Allied Properties Real Estate Investment Trust Announces 20% Growth in AFFO Per Unit in 2007 and Fifth Consecutive Annual Distri
08 Mars 2008 - 12:11AM
Marketwired
TORONTO, ONTARIO today announced results for the fourth quarter
and year ended December 31, 2007. On a fully diluted, per-unit
basis, Distributable Income ("DI"), Funds From Operations ("FFO")
and Adjusted Funds From Operations ("AFFO") were up in 2007 by 17%,
8% and 20%, respectively. The REIT's DI, FFO and AFFO payout ratios
for the year were at 76%, 76% and 84%, respectively.
The REIT also announced that its Trustees have approved a 5%
increase in monthly cash distributions from $0.105 per unit ($1.26
per unit annualized) to $0.11 per unit ($1.32 per unit annualized)
effective March, 2008. The increased distribution will be payable
on April 15, 2008, to unitholders of record on March 31, 2008.
"We brought our business to a new level in 2007," said Michael
Emory, President and CEO. "This enabled us to achieve top-tier
payout ratios and to announce today the largest of our five
consecutive annual distribution increases."
The financial results for the fourth quarter are summarized
below and compared to the same quarter in 2006:
(In thousands except for
 per unit and % amounts) Q4 2007  Q4 2006   Change   % Change
--------------------------------------------------------------
--------------------------------------------------------------
DI                        10,626    6,562    4,064       61.9%
DI per unit (diluted)     $0.423   $0.349   $0.074       21.2%
DI pay-out ratio            74.0%    86.8%   (12.8%)
FFO                       10,551    7,125    3,426       48.1%
FFO per unit (diluted)    $0.420   $0.379   $0.041       10.8%
FFO pay-out ratio           74.6%    79.9%    (5.3%)
AFFO                       9,383    5,928    3,455       58.3%
AFFO per unit (diluted)   $0.373   $0.315   $0.058       18.4%
AFFO pay-out ratio          83.8%    96.1%   (12.3%)
--------------------------------------------------------------
The financial results for 2007 are summarized below and compared
to the 2006:
(In thousands except for
 per unit and % amounts)   2007      2006   Change   % Change
--------------------------------------------------------------
--------------------------------------------------------------
DI                       39,258    23,982   15,276       63.7%
DI per unit (diluted)    $1.653    $1.414   $0.239       16.9%
DI pay-out ratio           75.8%     85.3%    (9.5%)
FFO                      39,350    25,911   13,439       51.9%
FFO per unit (diluted)   $1.656    $1.527   $0.129        8.4%
FFO pay-out ratio          75.6%     79.0%    (3.4%)
AFFO                     35,323    21,024   14,299       68.0%
AFFO per unit (diluted)  $1.487    $1.239   $0.248       20.0%
AFFO pay-out ratio         84.3%     97.3%   (13.0%)
--------------------------------------------------------------
In 2007, the REIT increased its leased area to 97.9% of total
GLA (not including Properties Under Development), increased
same-asset net operating income ("NOI") by 7.1% and completed $312
million in accretive acquisitions, all of which drove record
per-unit growth in DI, FFO and AFFO during the year. The REIT also
reduced the weighted average interest rate on its mortgages to 5.6%
and brought the weighted average term of its mortgages to seven
years. The REIT's debt ratio was 55.2% on December 31, 2007, and
declined to 50.5% following the closing on January 3, 2008, of the
offering of 2,900,000 units at a price of $20.75 per unit for gross
proceeds of $60 Million.
"We entered 2008 with a very strong balance sheet," added Mr.
Emory. "This will enable us to continue the systematic
consolidation of our target markets and to accelerate the pace of
our development and intensification activities."
DI, FFO, AFFO and NOI are not financial measures defined by
Canadian GAAP. Please see the REIT's MD&A for a description of
these measures and their reconciliation to net income or cash flow
from operations, as presented in the consolidated financial
statements of the REIT for the year ended December 31, 2007. These
statements, together with accompanying notes and MD&A, have
been filed with SEDAR, www.sedar.com, and are also available on the
REIT's web-site, www.alliedpropertiesreit.com.
This press release may contain forward-looking statements with
respect to the REIT, its operations, strategy, financial
performance and condition. These statements generally can be
identified by use of forward looking words such as "may", "will",
"expect", "estimate", "anticipate", intends", "believe" or
"continue" or the negative thereof or similar variations. The
actual results and performance of the REIT discussed herein could
differ materially from those expressed or implied by such
statements. Such statements are qualified in their entirety by the
inherent risks and uncertainties surrounding future expectations.
Important factors that could cause actual results to differ
materially from expectations include, among other things, general
economic and market factors, competition, changes in government
regulations and the factors described under "Risk Factors" in the
Annual Information Form of the REIT which is available at
www.sedar.com. The cautionary statements qualify all
forward-looking statements attributable to the REIT and persons
acting on their behalf. Unless otherwise stated, all
forward-looking statements speak only as of the date of this press
release and the REIT has no obligation to update such
statements.
Allied Properties REIT is the leading provider of Class I office
space in Canada, with portfolio assets in the urban areas of
Toronto, Montreal, Winnipeg, Quebec City and Kitchener. The
objectives of the REIT are to provide stable and growing cash
distributions to unitholders and to maximize unitholder value
through effective management and accretive portfolio growth.
Contacts: Allied Properties REIT Michael R. Emory President and
Chief Executive Officer (416) 977-9002 Email:
memory@alliedpropertiesreit.com Website:
www.alliedpropertiesreit.com
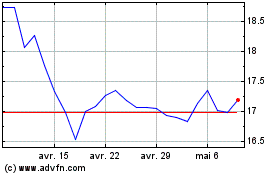
Allied Properties Real E... (TSX:AP.UN)
Graphique Historique de l'Action
De Juin 2024 à Juil 2024

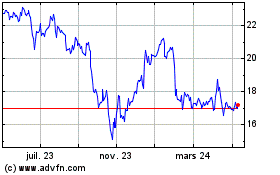
Allied Properties Real E... (TSX:AP.UN)
Graphique Historique de l'Action
De Juil 2023 à Juil 2024
