Bitcoin Price Repeating December 2023’s Playbook: Is The ‘Actual Breakout’ Yet To Come?
21 Décembre 2024 - 1:30AM
NEWSBTC
Bitcoin (BTC) tries the $100,000 support zone after falling to
$98,000 during the recent market shakeout. According to some market
watchers, the flagship crypto’s recent performance resembles its
December 2023 trajectory, suggesting that BTC might see a massive
breakout soon. Related Reading: Bitcoin Could Peak Between $160,000
And $290,000 If These Historical Patterns Repeat – Report Bitcoin
Price Mirrors December 2023’s Performance On Wednesday, Bitcoin and
the rest of the crypto market saw a massive correction after the US
Federal Reserve (Fed) announced a 25-basis-point rate cut and
signaled fewer cuts than expected in 2025. The flagship
cryptocurrency dropped 9.2% from its $108,135 all-time high (ATH),
briefly falling below the $99,000 on support before recovering. BTC
quickly climbed back to $100,000, surging 2% on Thursday morning to
the $102,000 resistance. After the dump, crypto trader Follis
suggested that this month’s price action mirrored BTC’s 2023
trajectory. The trader stated that Bitcoin was “repeating the
December playbook from last year,” forecasting that a pump to a new
high is coming soon. Per the chart, BTC moved within the
$40,000-$45,000 price range before breaking out in January 2024.
The breakout was followed by a significant 20% correction to the
previous consolidation zone, briefly dipping below this range.
However, Bitcoin reclaimed the breakout levels in the following
weeks and surged another 47% to its March ATH of $73,000. If the
largest crypto by market cap continues to follow this “playbook,”
then its price could see a correction below $88,000 by year-end
before resuming its bullish run to new highs. Similarly, Daan
Crypto Trades pointed out that BTC’s performance in Q4 resembles
its Q4 2023 price action. The analyst stated that Bitcoin will
likely continue the “slow hoppy grind up before the actual
breakout” happens. He recommended “zooming out” as the short-term
chart “doesn’t look pretty” but noted that BTC’s price is still
“trending up slowly.” Analyst Warns Of BTC’s Daily Close Other
analysts suggested that the coming hours will be decisive for BTC’s
short-term performance. Rekt Capital asserted that holding the
$100,000 support was crucial, as failing to maintain this level
could send Bitcoin below the previous key resistance of $98,000.
Moreover, a daily close above the $101,000 mark would be necessary
to prevent this range from turning into resistance again. The
analyst emphasized that “doing so could kickstart a chain of events
where BTC starts to lose support level by level.” Related Reading:
Sentiment For Ethereum Hits 1-year Low, Analyst Says A Massive Run
Is Coming He added that a close above this level would invalidate
the short-term bearish outlook. Previously, the analyst explained
that Bitcoin is amid the first “Price Discovery Correction,” which
tends to happen between the 6thand 8th week of BTC’s post-halving
“Parabolic Upside Phase”: As a result, over the next 3 weeks or so,
I am going to be increasingly cautious about retest attempts, and
given BTC’s history at this point in the cycle, I wouldn’t be
surprised to see key levels get invalidated. However, he emphasized
that the “Second Price Discovery Uptrend” will follow the big
correction. As of this writing, Bitcoin has dipped below the
$100,000 support level, registering a 5.1% 24-hour drop to the
$98,900 mark. Featured Image from Unsplash.com, Chart from
TradingView.com
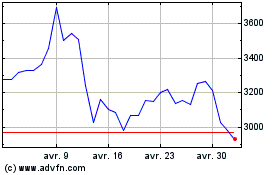
Ethereum (COIN:ETHUSD)
Graphique Historique de l'Action
De Nov 2024 à Déc 2024

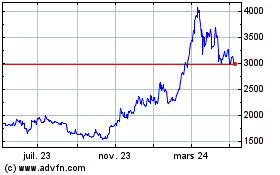
Ethereum (COIN:ETHUSD)
Graphique Historique de l'Action
De Déc 2023 à Déc 2024
