UNITED STATES
SECURITIES AND EXCHANGE COMMISSION
WASHINGTON, D.C. 20549
FORM N-CSR
CERTIFIED
SHAREHOLDER REPORT OF REGISTERED
MANAGEMENT INVESTMENT COMPANIES
Investment Company Act file number: 811-07732
ALLIANCEBERNSTEIN GLOBAL HIGH INCOME FUND, INC.
(Exact name of registrant as specified in charter)
1345 Avenue
of the Americas, New York, New York 10105
(Address of principal executive offices) (Zip code)
Stephen M. Woetzel
AllianceBernstein L.P.
1345 Avenue of the Americas
New York, New York 10105
(Name and address of agent for service)
Registrant’s telephone number, including area code: (800) 221-5672
Date of fiscal year end: March 31, 2024
Date of reporting period: September 30, 2023
ITEM 1. REPORTS TO STOCKHOLDERS.
SEP 09.30.23

SEMI-ANNUAL REPORT
ALLIANCEBERNSTEIN
GLOBAL HIGH INCOME FUND
(NYSE: AWF)

|
|
|
|
|
| Investment Products Offered |
|
• Are Not FDIC Insured • May Lose Value • Are Not Bank Guaranteed |
You may obtain a description of the Fund’s proxy voting policies and procedures, and information regarding how
the Fund voted proxies relating to portfolio securities during the most recent 12-month period ended June 30, without charge. Simply visit AB’s website at www.abfunds.com, or go to the Securities and
Exchange Commission’s (the “Commission”) website at www.sec.gov, or call AB at (800) 227 4618.
The Fund files its
complete schedule of portfolio holdings with the Commission for the first and third quarters of each fiscal year as an exhibit to its reports on Form N-PORT. The Fund’s Form N-PORT reports are available on the Commission’s website at
www.sec.gov. AB publishes full portfolio holdings for the Fund monthly at www.abfunds.com.
AllianceBernstein Investments, Inc. (ABI) is
the distributor of the AB family of mutual funds. ABI is a member of FINRA and is an affiliate of AllianceBernstein L.P., the Adviser of the funds.
The [A/B] logo is a registered service mark of AllianceBernstein and AllianceBernstein® is a registered service mark used by permission of the owner, AllianceBernstein L.P.
|
|
|
| FROM THE PRESIDENT |
|

|
Dear Shareholder,
We’re pleased to provide
this report for AllianceBernstein Global High Income Fund, Inc. (the “Fund”). Please review the discussion of Fund performance, the market conditions during the reporting period and the Fund’s investment strategy.
At AB, we’re striving to help our clients achieve better outcomes by:
| + |
|
Fostering diverse perspectives that give us a distinctive approach to navigating global capital markets
|
| + |
|
Applying differentiated investment insights through a connected global research network |
| + |
|
Embracing innovation to design better ways to invest and leading-edge mutual-fund solutions |
Whether you’re an individual investor or a multibillion-dollar institution, we’re putting our knowledge and experience to work for you every day.
For more information about AB’s comprehensive range of products and shareholder resources, please log on to www.abfunds.com.
Thank you for your investment in AB mutual funds—and for placing your trust in our firm.
Sincerely,

Onur Erzan
President and Chief Executive
Officer, AB Mutual Funds
|
|
|
|
|
| abfunds.com |
|
ALLIANCEBERNSTEIN GLOBAL HIGH INCOME
FUND | 1 |
SEMI-ANNUAL REPORT
November 6, 2023
This report provides management’s discussion of fund performance for AllianceBernstein Global High Income Fund, Inc. for the semi-annual reporting period ended
September 30, 2023. The Fund is a closed-end fund and its shares of common stock trade on the New York Stock Exchange.
The Fund seeks high current income and, secondarily, capital appreciation.
RETURNS AS OF SEPTEMBER 30, 2023 (unaudited)
|
|
|
|
|
|
|
|
|
|
|
|
| |
|
6 Months |
|
|
12 Months |
|
|
|
|
| ALLIANCEBERNSTEIN GLOBAL HIGH INCOME FUND (NAV) |
|
|
3.76% |
|
|
|
13.54% |
|
|
|
|
| Primary Benchmark:
Bloomberg Global High Yield Index (USD
hedged) |
|
|
2.52% |
|
|
|
12.21% |
|
|
|
|
| Blended Benchmark:
33% JPM
GBI-EM / 33% JPM EMBI Global /
33% Bloomberg US Corporate HY 2% Issuer Capped Index |
|
|
-0.35% |
|
|
|
8.40% |
|
The Fund’s market price per share on September 30, 2023, was $9.70. The Fund’s NAV per share on September 30, 2023,
was $10.53. For additional financial highlights, please see pages 108-109.
INVESTMENT RESULTS
The table above shows the Fund’s performance compared with its primary benchmark, the Bloomberg Global High Yield Index (USD hedged), as well as
its blended benchmark for the six- and 12-month periods ended September 30, 2023. The blended benchmark is composed of equal weightings of the JPMorgan
Government Bond Index-Emerging Markets (“JPM GBI-EM”) (local currency-denominated), the JPMorgan Emerging Markets Bond Index Global (“JPM EMBI Global”) and the Bloomberg US Corporate High
Yield (“HY”) 2% Issuer Capped Index.
During both periods, the Fund outperformed its primary benchmark and the blended benchmark. Over the six-month period, security selection was the largest contributor to relative performance, primarily from security selection in US and eurozone high-yield corporate bonds, US investment-grade corporates and
emerging-market corporate bonds. Yield-curve positioning also contributed. Country allocation detracted, mainly due to an underweight to the eurozone. Sector allocation also detracted, as losses from
off-benchmark exposure to US investment-grade corporates and US Treasuries, along with an underweight to emerging-market sovereign bonds, were greater than gains from
off-benchmark exposure to collateralized loan obligations, agency risk-sharing transactions, bank loans, high-yield credit default swaps and an underweight to emerging-market corporate bonds.
|
|
|
|
|
| 2 | ALLIANCEBERNSTEIN
GLOBAL HIGH INCOME FUND |
|
abfunds.com |
During the 12-month period, yield-curve positioning contributed. Security
selection also added due to selection in emerging-market corporate and sovereign bonds, eurozone and US high-yield corporates, and US investment-grade corporate bonds gained more than a loss from selection among commercial mortgage-backed securities
(“CMBS”). Sector allocation contributed, mostly from utilization of high-yield credit default swaps, off-benchmark exposure to collateralized loan obligations and an overweight to US high-yield
corporates that added more to results than losses from an underweight to emerging-market sovereign bonds and off-benchmark exposures to US Treasury bonds, CMBS, US investment-grade corporates and bank loans.
Country allocation detracted because of underweights to the eurozone and the UK.
During both periods, the Fund used interest rate swaps, futures and interest rate
swaptions to manage and hedge duration risk and/or to take active yield-curve positioning. Currency forwards were used to hedge foreign currency exposure and to take active currency risk. Credit default swaps were used to effectively obtain
high-yield credit/sector exposure. Total return swaps were used to take active credit risk. During the six-month period, written options and purchased options were used to put spread for downside protection.
During the 12-month period, the utilization of leverage on behalf of the Fund contributed to performance, relative to the
benchmark. As the benchmark generated positive returns in excess of the Fund’s borrowing rates, the utilization of leverage contributed to the Fund’s absolute returns. During the six-month period,
the utilization of leverage on behalf of the Fund detracted from performance, relative to the benchmark. As the benchmark generated negative returns compared to the Fund’s borrowing rates, the utilization of leverage detracted from the
Fund’s absolute returns.
MARKET REVIEW AND INVESTMENT STRATEGY
During the six-month period ended September 30, 2023, fixed-income government bond market yields were volatile as investors
adjusted their expectations for inflation and economic growth. US Treasury yields jumped higher at the end of the period after the Fed adjusted its quarterly expectations of interest rates to be higher for longer. Other developed-market treasury
yields rose in tandem. Most major developed-market central banks started to reduce the size of interest-rate hikes and pause future hikes. Headline inflation slowed, indicating that the end of the developed-market hiking cycle is clearly in sight.
Government bond returns fell overall—with losses in all major markets except Japan. In corporate credit risk sectors, investment-grade corporate bonds outperformed the returns of global developed-market treasuries—with US and eurozone
investment-grade corporates outperforming their respective treasury markets. Developed-market high-yield corporate bonds had positive returns and
|
|
|
|
|
| abfunds.com |
|
ALLIANCEBERNSTEIN GLOBAL HIGH INCOME FUND | 3 |
outperformed government bonds by a substantial margin. High-yield corporates significantly outperformed respective treasury markets in the US and eurozone. Emerging-market local-currency bonds
outperformed developed-market treasuries even as the US dollar gained on most currencies during the period. Hard-currency sovereign bonds hedged to the US dollar posted a minor decline, while emerging-market corporate bonds had positive results
overall.
The Fund’s Investment Management Team (the “Team”) seeks to generate high current income and, secondarily, capital appreciation. The Fund
is a globally diversified portfolio that takes full advantage of the Team’s best research ideas by pursuing high-income opportunities across all fixed-income sectors. The Fund invests primarily (and without limit) in corporate debt securities
from US and non-US issuers, as well as government bonds from both developing and developed countries, including the US. Under normal market conditions, the Fund invests substantially in lower-rated bonds, but
may also invest in investment-grade and unrated debt securities.
INVESTMENT POLICIES
The Fund invests without limit in securities denominated in non-US
currencies as well as those denominated in the US dollar. The Fund may also invest, without limit, in sovereign debt securities issued by emerging and developed nations and in debt securities of US and non-US
corporate issuers. For more information regarding the Fund’s risks, please see “Disclosures and Risks” on pages 5-8 and “Note E—Risks Involved in Investing in the Fund” of the
Notes to Financial Statements on pages 103-106.
|
|
|
|
|
| 4 | ALLIANCEBERNSTEIN
GLOBAL HIGH INCOME FUND |
|
abfunds.com |
DISCLOSURES AND RISKS
AllianceBernstein Global High Income Fund
Shareholder Information
Weekly comparative net asset value (“NAV”) and market price information about the Fund is published each Saturday in
Barron’s and in other newspapers in a table called “Closed-End Funds.” Daily NAV and market price information, and additional information regarding the Fund, is available at
www.abfunds.com and www.nyse.com. For additional shareholder information regarding this Fund, please see pages 110-111.
Benchmark Disclosure
All indices are unmanaged and do not reflect fees
and expenses associated with the active management of a fund portfolio. The Bloomberg Global High Yield Index (USD hedged) represents non-investment grade fixed-income securities of companies in the US,
and developed and emerging markets, hedged to the US dollar. The JPM® GBI-EM represents the performance of local currency government bonds issued by
emerging markets. The JPM EMBI Global (market-capitalization weighted) represents the performance of US dollar-denominated Brady bonds, Eurobonds and trade loans issued by sovereign and quasi-sovereign entities. The Bloomberg US Corporate HY 2%
Issuer Capped Index is the 2% Issuer Capped component of the US Corporate High Yield Index, which represents the performance of fixed-income securities having a maximum quality rating of Ba1, a minimum amount outstanding of $150 million and at
least one year to maturity. An investor cannot invest directly in an index, and its results are not indicative of the performance of any specific investment, including the Fund.
A Word About Risk
Market Risk: The market value of a security may
move up or down, sometimes rapidly and unpredictably. These fluctuations may cause a security to be worth less than the price originally paid for it, or less than it was worth at an earlier time. Market risk may affect a single issuer, industry,
sector of the economy or the market as a whole. Global economies and financial markets are increasingly interconnected, which increases the probabilities that conditions in one country or region might adversely impact issuers in a different country
or region. Conditions affecting the general economy, including political, social, or economic instability at the local, regional, or global level may also affect the market value of a security. Health crises, such as pandemic and epidemic diseases,
as well as other incidents that interrupt the expected course of events, such as natural disasters, including fires, earthquakes and flooding, war or civil disturbance, acts of terrorism, power outages and other unforeseeable and external events,
and the public response to or fear of such diseases or events, have had, and may in the future have, an adverse effect on the Fund’s investments and net asset value and can lead to increased market
|
|
|
|
|
| abfunds.com |
|
ALLIANCEBERNSTEIN GLOBAL HIGH INCOME FUND | 5 |
DISCLOSURES AND RISKS (continued)
volatility. For
example, the diseases or events themselves or any preventative or protective actions that governments may take in respect of such diseases or events may result in periods of business disruption, inability to obtain raw materials, supplies and
component parts, and reduced or disrupted operations for the Fund’s portfolio companies. The occurrence and pendency of such diseases or events could adversely affect the economies and financial markets either in specific countries or
worldwide.
Interest-Rate Risk: Changes in interest rates will affect the value of investments in fixed-income securities. When interest rates rise, the
value of existing investments in fixed-income securities tends to fall and this decrease in value may not be offset by higher income from new investments. Interest-rate risk is generally greater for fixed-income securities with longer maturities or
durations. The Fund may be subject to a greater risk of rising interest rates than would normally be the case due to the recent end of a period of historically low rates and the effect of potential central bank monetary policy, and government fiscal
policy, initiatives and resulting market reactions to those initiatives.
Credit Risk: An issuer or guarantor of a fixed-income security, or the counterparty
to a derivatives or other contract, may be unable or unwilling to make timely payments of interest or principal, or to otherwise honor its obligations. The issuer or guarantor may default, causing a loss of the full principal amount of a security
and accrued interest. The degree of risk for a particular security may be reflected in its credit rating. There is the possibility that the credit rating of a fixed-income security may be downgraded after purchase, which may adversely affect the
value of the security.
Below Investment-Grade Securities Risk: Investments in fixed-income securities with lower ratings (commonly known as “junk
bonds”) are subject to a higher probability that an issuer will default or fail to meet its payment obligations. These securities may be subject to greater price volatility due to such factors as specific corporate developments and negative
perceptions of the junk bond market generally and may be more difficult to trade than other types of securities.
Duration Risk: Duration is a measure that
relates the expected price volatility of a fixed-income security to changes in interest rates. The duration of a fixed-income security may be shorter than or equal to full maturity of a fixed-income security. Fixed-income securities with longer
durations have more risk and will decrease in price as interest rates rise.
|
|
|
|
|
| 6 | ALLIANCEBERNSTEIN
GLOBAL HIGH INCOME FUND |
|
abfunds.com |
DISCLOSURES AND RISKS (continued)
Inflation
Risk: This is the risk that the value of assets or income from investments will be less in the future as inflation decreases the value of money. As inflation increases, the value of the Fund’s assets can decline as can the value of the
Fund’s distributions. This risk is significantly greater for fixed-income securities with longer maturities.
Foreign
(Non-US) Risk: Investments in securities of non-US issuers may involve more risk than those of US issuers. These securities may fluctuate more widely in price and
may be more difficult to trade due to adverse market, economic, political, regulatory or other factors.
Emerging-Market Risk: Investments in emerging-market
countries may have more risk because the markets are less developed and less liquid and are subject to increased economic, political, regulatory or other uncertainties.
Currency Risk: Fluctuations in currency exchange rates may negatively affect the value of the Fund’s investments or reduce its returns.
Leverage Risk: As a result of the Fund’s use of leveraging techniques, its NAV may be more volatile because leverage tends to exaggerate the effect of
changes in interest rates and any increase or decrease in the value of the Fund’s investments.
Derivatives Risk: Investments in derivatives may be
difficult to price or unwind and leveraged so that small changes may produce disproportionate losses for the Fund. A short position in a derivative instrument involves the risk of a theoretically unlimited increase in the value of the underlying
asset, which could cause the Fund to suffer a potentially unlimited loss. Derivatives, especially over-the-counter derivatives, are also subject to counterparty risk,
which is the risk that the counterparty (the party on the other side of the transaction) on a derivative transaction will be unable or unwilling to honor its contractual obligations to the Fund.
Illiquid Investments Risk: Illiquid investments risk exists when certain investments are or become difficult to purchase or sell. Difficulty in selling such
investments may result in sales at disadvantageous prices affecting the value of your investment in the Fund. Causes of illiquid investments risk may include low trading volumes, large positions and heavy redemptions of Fund shares. Illiquid
investments risk may be higher in a rising interest rate environment, when the value and liquidity of fixed-income securities generally decline.
Management
Risk: The Fund is subject to management risk because it is an actively managed investment fund. The Adviser will apply its investment techniques and risk analyses in making investment decisions, but there is
|
|
|
|
|
| abfunds.com |
|
ALLIANCEBERNSTEIN GLOBAL HIGH INCOME
FUND | 7 |
DISCLOSURES AND RISKS (continued)
no guarantee that its techniques will produce the intended results. Some of these techniques may incorporate, or rely upon, quantitative models, but there is no
guarantee that these models will generate accurate forecasts, reduce risk or otherwise perform as expected. These models may not work as intended and may not enable a Fund to achieve its investment objective. In addition, certain models may be
constructed using data from external providers, and these inputs may be incorrect or incomplete, thus potentially limiting the effectiveness of the models. Finally, the Adviser may change, enhance and update its models and its usage of existing
models at its discretion.
Mortgage-Related and/or Other Asset-Backed Securities Risk: The Fund may invest in mortgage-backed and/or other asset-backed
securities, including securities backed by mortgages and assets with an international or emerging-markets origination and securities backed by non-performing loans at the time of investment. Investments in
mortgage-related and other asset-backed securities are subject to certain additional risks. The value of these securities may be particularly sensitive to changes in interest rates. These risks include “extension risk”, which is the risk
that, in periods of rising interest rates, issuers may delay the payment of principal, and “prepayment risk”, which is the risk that, in periods of falling interest rates, issuers may pay principal sooner than expected, exposing the Fund
to a lower rate of return upon reinvestment of principal. Mortgage-backed securities offered by nongovernmental issuers and other asset-backed securities may be subject to other risks, such as higher rates of default in the mortgages or assets
backing the securities or risks associated with the nature and servicing of mortgages or assets backing the securities.
As with all investments, you may lose money
by investing in the Fund.
An Important Note About Historical Performance
The performance shown in this report represents past performance and does not guarantee future results. Current performance may be lower or higher than the
performance information shown. All fees and expenses related to the operation of the Fund have been deducted. Performance assumes reinvestment of distributions and does not account for taxes. Historical performance does not reflect the deduction of
taxes that a shareholder would pay on fund distributions or the sale of fund shares and assumes the reinvestment of dividends and capital gains distributions at prices obtained pursuant to the Fund’s dividend reinvestment plan.
|
|
|
|
|
| 8 | ALLIANCEBERNSTEIN
GLOBAL HIGH INCOME FUND |
|
abfunds.com |
HISTORICAL PERFORMANCE
AVERAGE ANNUAL RETURNS AS OF
SEPTEMBER 30, 2023 (unaudited)
|
|
|
|
|
|
|
|
|
|
|
|
| |
|
NAV
Returns |
|
|
Market
Price |
|
|
|
|
| 1 Year |
|
|
13.54% |
|
|
|
19.43% |
|
|
|
|
| 5 Years |
|
|
2.89% |
|
|
|
3.87% |
|
|
|
|
| 10 Years |
|
|
4.65% |
|
|
|
3.90% |
|
AVERAGE ANNUAL RETURNS
AS OF THE MOST
RECENT CALENDAR QUARTER-END
SEPTEMBER 30, 2023 (unaudited)
|
|
|
|
|
|
|
|
|
|
|
|
| |
|
NAV
Returns |
|
|
Market
Price |
|
|
|
|
| 1 Year |
|
|
13.54% |
|
|
|
19.43% |
|
|
|
|
| 5 Years |
|
|
2.89% |
|
|
|
3.87% |
|
|
|
|
| 10 Years |
|
|
4.65% |
|
|
|
3.90% |
|
Performance assumes the reinvestment of dividends and capital gains distributions at prices obtained pursuant to the Fund’s dividend
reinvestment plan.
|
|
|
|
|
| abfunds.com |
|
ALLIANCEBERNSTEIN GLOBAL HIGH INCOME
FUND | 9 |
PORTFOLIO SUMMARY
September 30, 2023 (unaudited)
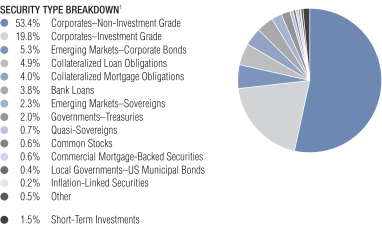
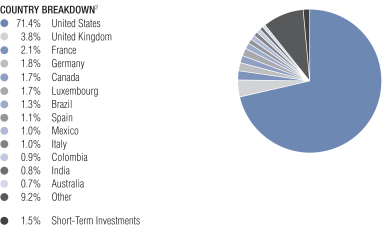
PORTFOLIO STATISTICS
Net Assets ($mil): $907.7
| 1 |
The Fund’s security type breakdown is expressed as a percentage of total investments and may vary over time. The Fund
also enters into derivative transactions, which may be used for hedging or investment purposes (see “Portfolio of Investments” section of the report for additional details). “Other” security type weightings represent 0.2% or less
in the following: Asset-Backed Securities, Governments–Sovereign Bonds, Preferred Stocks, Purchased Options–Puts and Rights. |
| 2 |
The Fund’s country breakdown is expressed as a percentage of total investments and may vary over time. The Fund also
enters into derivative transactions, which may be used for hedging or other investment purposes (see “Portfolio of Investments” section of the report for additional details). “Other” country weightings represent 0.6% or less in
the following: Angola, Argentina, Cayman Islands, Chile, China, Czech Republic, Dominican Republic, Ecuador, Egypt, El Salvador, Finland, Gabon, Ghana, Guatemala, Hong Kong, Indonesia, Ireland, Israel, Jamaica, Japan, Jersey (Channel Islands),
Kazakhstan, Kuwait, Macau, Netherlands, Nigeria, Norway, Panama, Peru, Senegal, Slovenia, South Africa, South Korea, Sweden, Switzerland, Trinidad & Tobago, Turkey, Ukraine, Venezuela and Zambia. |
|
|
|
|
|
| 10 | ALLIANCEBERNSTEIN
GLOBAL HIGH INCOME FUND |
|
abfunds.com |
PORTFOLIO OF INVESTMENTS
September 30, 2023 (unaudited)
|
|
|
|
|
|
|
|
|
|
|
|
|
| |
|
|
|
|
Principal
Amount
(000) |
|
|
U.S. $ Value |
|
| |
|
| CORPORATES - NON-INVESTMENT GRADE –
53.3% |
|
|
|
|
|
|
|
|
|
|
|
|
| Industrial – 47.4% |
|
|
|
|
|
|
|
|
|
|
|
|
| Basic – 2.8% |
|
|
|
|
|
|
|
|
|
|
|
|
| Advanced Drainage Systems, Inc.
5.00%,
09/30/2027(a)(b) |
|
|
U.S.$ |
|
|
|
140 |
|
|
$ |
131,459 |
|
| Arsenal AIC Parent LLC
8.00%,
10/01/2030(b) |
|
|
|
|
|
|
728 |
|
|
|
724,209 |
|
| ASP Unifrax Holdings, Inc.
5.25%,
09/30/2028(b) |
|
|
|
|
|
|
1,976 |
|
|
|
1,407,152 |
|
| 7.50%, 09/30/2029(b) |
|
|
|
|
|
|
1,244 |
|
|
|
679,608 |
|
| Baffinland Iron Mines Corp./Baffinland Iron Mines LP
8.75%, 07/15/2026(b) |
|
|
|
|
|
|
223 |
|
|
|
217,778 |
|
| Cerdia Finanz GmbH
10.50%, 02/15/2027(b) |
|
|
|
|
|
|
419 |
|
|
|
415,309 |
|
| Cleveland-Cliffs, Inc.
6.75%,
03/15/2026(b) |
|
|
|
|
|
|
107 |
|
|
|
106,775 |
|
| Commercial Metals Co.
4.125%, 01/15/2030 |
|
|
|
|
|
|
80 |
|
|
|
69,659 |
|
| 4.375%, 03/15/2032 |
|
|
|
|
|
|
80 |
|
|
|
67,087 |
|
| Constellium SE
3.125%, 07/15/2029(b) |
|
|
EUR |
|
|
|
1,109 |
|
|
|
992,348 |
|
| Crown Americas LLC/Crown Americas Capital Corp. VI
4.75%, 02/01/2026 |
|
|
U.S.$ |
|
|
|
775 |
|
|
|
745,570 |
|
| CVR Partners LP/CVR Nitrogen Finance Corp.
6.125%, 06/15/2028(b) |
|
|
|
|
|
|
370 |
|
|
|
333,029 |
|
| Domtar Corp.
6.75%, 10/01/2028(b) |
|
|
|
|
|
|
140 |
|
|
|
115,969 |
|
| Element Solutions, Inc.
3.875%,
09/01/2028(b) |
|
|
|
|
|
|
1,279 |
|
|
|
1,103,485 |
|
| ERP Iron Ore LLC
9.039%,
12/31/2019(c)(d)(e)(f)(g) |
|
|
|
|
|
|
240 |
|
|
|
76,802 |
|
| FMG Resources (August 2006) Pty Ltd.
4.375%,
04/01/2031(b) |
|
|
|
|
|
|
2,191 |
|
|
|
1,793,602 |
|
| 4.50%, 09/15/2027(b) |
|
|
|
|
|
|
819 |
|
|
|
743,929 |
|
| 5.875%, 04/15/2030(b) |
|
|
|
|
|
|
76 |
|
|
|
69,508 |
|
| 6.125%, 04/15/2032(b) |
|
|
|
|
|
|
2,563 |
|
|
|
2,341,250 |
|
| Glatfelter Corp.
4.75%, 11/15/2029(b) |
|
|
|
|
|
|
77 |
|
|
|
50,628 |
|
| Graham Packaging Co., Inc.
7.125%,
08/15/2028(b) |
|
|
|
|
|
|
420 |
|
|
|
353,345 |
|
| Graphic Packaging International LLC
3.75%,
02/01/2030(b) |
|
|
|
|
|
|
1,661 |
|
|
|
1,387,439 |
|
|
|
|
|
|
| abfunds.com |
|
ALLIANCEBERNSTEIN GLOBAL HIGH INCOME FUND | 11 |
PORTFOLIO OF INVESTMENTS (continued)
|
|
|
|
|
|
|
|
|
|
|
| |
|
|
|
Principal
Amount
(000) |
|
|
U.S. $ Value |
|
| |
|
| Hecla Mining Co.
7.25%, 02/15/2028 |
|
U.S.$ |
|
|
282 |
|
|
$
|
272,872 |
|
| INEOS Quattro Finance 2 PLC
3.375%,
01/15/2026(b) |
|
|
|
|
426 |
|
|
|
388,943 |
|
| INEOS Styrolution Group GmbH
2.25%,
01/16/2027(b) |
|
EUR |
|
|
104 |
|
|
|
95,521 |
|
| Ingevity Corp.
3.875%, 11/01/2028(b) |
|
U.S.$ |
|
|
495 |
|
|
|
408,027 |
|
| Intelligent Packaging Holdco Issuer LP
9.00% (9.00% Cash or 9.75% PIK),
01/15/2026(b)(g) |
|
|
|
|
611 |
|
|
|
506,860 |
|
| Intelligent Packaging Ltd. Finco, Inc./Intelligent Packaging Ltd.
Co-Issuer LLC
6.00%, 09/15/2028(b) |
|
|
|
|
361 |
|
|
|
315,370 |
|
| Magnetation LLC/Mag Finance Corp.
11.00%,
05/15/2018(c)(d)(e)(f)(h) |
|
|
|
|
2,857 |
|
|
|
– 0 |
– |
| Mineral Resources Ltd.
8.00%,
11/01/2027(b) |
|
|
|
|
192 |
|
|
|
188,404 |
|
| 8.125%, 05/01/2027(b) |
|
|
|
|
158 |
|
|
|
156,464 |
|
| Novelis Corp.
3.25%, 11/15/2026(b) |
|
|
|
|
61 |
|
|
|
54,433 |
|
| Olympus Water US Holding Corp.
4.25%,
10/01/2028(b) |
|
|
|
|
237 |
|
|
|
193,092 |
|
| 7.125%, 10/01/2027(b) |
|
|
|
|
755 |
|
|
|
701,353 |
|
| 9.75%, 11/15/2028(b) |
|
|
|
|
1,750 |
|
|
|
1,747,578 |
|
| Roller Bearing Co. of America, Inc.
4.375%,
10/15/2029(b) |
|
|
|
|
143 |
|
|
|
123,749 |
|
| SCIL IV LLC/SCIL USA Holdings LLC
4.375%,
11/01/2026(b) |
|
EUR |
|
|
320 |
|
|
|
314,559 |
|
| 5.375%, 11/01/2026(b) |
|
U.S.$ |
|
|
1,039 |
|
|
|
949,134 |
|
| Sealed Air Corp.
6.875%, 07/15/2033(b) |
|
|
|
|
564 |
|
|
|
547,976 |
|
| Sealed Air Corp./Sealed Air Corp. US
6.125%,
02/01/2028(b) |
|
|
|
|
546 |
|
|
|
528,579 |
|
| SNF Group SACA
3.125%, 03/15/2027(b) |
|
|
|
|
655 |
|
|
|
577,701 |
|
| 3.375%, 03/15/2030(b) |
|
|
|
|
951 |
|
|
|
768,410 |
|
| SunCoke Energy, Inc.
4.875%,
06/30/2029(b) |
|
|
|
|
145 |
|
|
|
122,969 |
|
| Trinseo Materials Operating SCA/Trinseo Materials Finance, Inc.
5.375%, 09/01/2025(b) |
|
|
|
|
58 |
|
|
|
53,435 |
|
| Tronox, Inc.
4.625%, 03/15/2029(b) |
|
|
|
|
98 |
|
|
|
78,999 |
|
| United States Steel Corp.
6.65%, 06/01/2037 |
|
|
|
|
37 |
|
|
|
36,162 |
|
| 6.875%, 03/01/2029 |
|
|
|
|
110 |
|
|
|
108,339 |
|
|
|
|
|
|
| 12 | ALLIANCEBERNSTEIN
GLOBAL HIGH INCOME FUND |
|
abfunds.com |
PORTFOLIO OF INVESTMENTS (continued)
|
|
|
|
|
|
|
|
|
|
|
|
|
| |
|
|
|
|
Principal
Amount
(000) |
|
|
U.S. $ Value |
|
| |
|
| Vibrantz Technologies, Inc.
9.00%,
02/15/2030(b) |
|
|
U.S.$ |
|
|
|
1,887 |
|
|
$
|
1,502,966 |
|
| WR Grace Holdings LLC
4.875%,
06/15/2027(b) |
|
|
|
|
|
|
1,106 |
|
|
|
1,013,222 |
|
| 5.625%, 08/15/2029(b) |
|
|
|
|
|
|
61 |
|
|
|
49,201 |
|
|
|
|
|
|
|
|
|
|
|
|
|
|
|
|
|
|
|
|
|
|
|
|
|
25,730,258 |
|
|
|
|
|
|
|
|
|
|
|
|
|
|
| Capital Goods – 4.0% |
|
|
|
|
|
|
|
|
|
|
|
|
| ARD Finance SA
5.00% (5.00% Cash or 5.75% PIK),
06/30/2027(b)(g) |
|
|
EUR |
|
|
|
3,069 |
|
|
|
2,404,782 |
|
| Ardagh Metal Packaging Finance USA LLC/Ardagh Metal Packaging Finance PLC
4.00%, 09/01/2029(b) |
|
|
U.S.$ |
|
|
|
985 |
|
|
|
770,598 |
|
| 6.00%, 06/15/2027(b) |
|
|
|
|
|
|
684 |
|
|
|
654,930 |
|
| Ardagh Packaging Finance PLC/Ardagh Holdings USA, Inc.
4.125%, 08/15/2026(b) |
|
|
|
|
|
|
2,663 |
|
|
|
2,433,129 |
|
| 5.25%, 08/15/2027(b) |
|
|
|
|
|
|
235 |
|
|
|
195,963 |
|
| Artera Services LLC
9.033%, 12/04/2025(b) |
|
|
|
|
|
|
375 |
|
|
|
345,878 |
|
| Ball Corp.
6.00%, 06/15/2029 |
|
|
|
|
|
|
1,607 |
|
|
|
1,562,808 |
|
| Bombardier, Inc.
6.00%, 02/15/2028(b) |
|
|
|
|
|
|
183 |
|
|
|
165,814 |
|
| 7.125%, 06/15/2026(b) |
|
|
|
|
|
|
217 |
|
|
|
210,272 |
|
| 7.50%, 02/01/2029(b) |
|
|
|
|
|
|
303 |
|
|
|
287,599 |
|
| 7.875%, 04/15/2027(b) |
|
|
|
|
|
|
1,212 |
|
|
|
1,182,404 |
|
| Calderys Financing LLC
11.25%,
06/01/2028(b) |
|
|
|
|
|
|
2,089 |
|
|
|
2,143,386 |
|
| Camelot Return Merger Sub, Inc.
8.75%,
08/01/2028(b) |
|
|
|
|
|
|
196 |
|
|
|
189,198 |
|
| Clean Harbors, Inc. |
|
|
|
|
|
|
|
|
|
|
|
|
| 4.875%, 07/15/2027(b) |
|
|
|
|
|
|
187 |
|
|
|
175,875 |
|
| 6.375%, 02/01/2031(b) |
|
|
|
|
|
|
11 |
|
|
|
10,693 |
|
| Crown Americas LLC
5.25%, 04/01/2030 |
|
|
|
|
|
|
411 |
|
|
|
379,862 |
|
| Eco Material Technologies, Inc.
7.875%,
01/31/2027(b) |
|
|
|
|
|
|
2,622 |
|
|
|
2,504,299 |
|
| Emerald Debt Merger Sub LLC
6.625%,
12/15/2030(b) |
|
|
|
|
|
|
631 |
|
|
|
609,000 |
|
| EnerSys
4.375%, 12/15/2027(b) |
|
|
|
|
|
|
935 |
|
|
|
849,548 |
|
| Enviri Corp.
5.75%, 07/31/2027(b) |
|
|
|
|
|
|
1,384 |
|
|
|
1,216,672 |
|
| F-Brasile SpA/F-Brasile US
LLC
Series XR
7.375%, 08/15/2026(b) |
|
|
|
|
|
|
957 |
|
|
|
891,695 |
|
|
|
|
|
|
| abfunds.com |
|
ALLIANCEBERNSTEIN GLOBAL HIGH INCOME FUND | 13 |
PORTFOLIO OF INVESTMENTS (continued)
|
|
|
|
|
|
|
|
|
|
|
| |
|
|
|
Principal
Amount
(000) |
|
|
U.S. $ Value |
|
| |
|
| Griffon Corp.
5.75%, 03/01/2028 |
|
U.S.$ |
|
|
983 |
|
|
$
|
891,781 |
|
| LSB Industries, Inc.
6.25%,
10/15/2028(a)(b) |
|
|
|
|
1,268 |
|
|
|
1,149,872 |
|
| Madison IAQ LLC
5.875%, 06/30/2029(b) |
|
|
|
|
359 |
|
|
|
288,936 |
|
| Masonite International Corp.
5.375%,
02/01/2028(b) |
|
|
|
|
374 |
|
|
|
347,978 |
|
| MIWD Holdco II LLC/MIWD Finance Corp.
5.50%,
02/01/2030(b) |
|
|
|
|
84 |
|
|
|
69,384 |
|
| Moog, Inc.
4.25%, 12/15/2027(b) |
|
|
|
|
353 |
|
|
|
318,697 |
|
| Mueller Water Products, Inc.
4.00%,
06/15/2029(b) |
|
|
|
|
291 |
|
|
|
254,540 |
|
| Oscar AcquisitionCo LLC/Oscar Finance, Inc.
9.50%, 04/15/2030(b) |
|
|
|
|
63 |
|
|
|
57,837 |
|
| Renk AG/Frankfurt am Main
5.75%,
07/15/2025(b) |
|
EUR |
|
|
1,560 |
|
|
|
1,635,648 |
|
| Rolls-Royce PLC
3.625%, 10/14/2025(b) |
|
U.S.$ |
|
|
918 |
|
|
|
865,292 |
|
| Stericycle, Inc.
3.875%, 01/15/2029(b) |
|
|
|
|
696 |
|
|
|
600,073 |
|
| Summit Materials LLC/Summit Materials Finance Corp.
5.25%, 01/15/2029(b) |
|
|
|
|
164 |
|
|
|
149,533 |
|
| Terex Corp.
5.00%, 05/15/2029(b) |
|
|
|
|
360 |
|
|
|
323,584 |
|
| TK Elevator Midco GmbH
4.375%,
07/15/2027(b) |
|
EUR |
|
|
885 |
|
|
|
847,287 |
|
| TK Elevator US Newco, Inc.
5.25%,
07/15/2027(b) |
|
U.S.$ |
|
|
306 |
|
|
|
281,345 |
|
| TransDigm, Inc.
4.625%, 01/15/2029 |
|
|
|
|
290 |
|
|
|
252,927 |
|
| 4.875%, 05/01/2029 |
|
|
|
|
1,954 |
|
|
|
1,716,464 |
|
| 6.25%, 03/15/2026(b) |
|
|
|
|
332 |
|
|
|
327,456 |
|
| 6.75%, 08/15/2028(b) |
|
|
|
|
2,508 |
|
|
|
2,471,801 |
|
| Trinity Industries, Inc.
7.75%,
07/15/2028(b) |
|
|
|
|
1,073 |
|
|
|
1,079,199 |
|
| Triumph Group, Inc.
7.75%, 08/15/2025 |
|
|
|
|
428 |
|
|
|
406,629 |
|
| 9.00%, 03/15/2028(b) |
|
|
|
|
2,516 |
|
|
|
2,487,394 |
|
| Trivium Packaging Finance BV
3.75%,
08/15/2026(b) |
|
EUR |
|
|
100 |
|
|
|
97,612 |
|
| Tutor Perini Corp.
6.875%, 05/01/2025(b) |
|
U.S.$ |
|
|
61 |
|
|
|
55,815 |
|
|
|
|
|
|
| 14 | ALLIANCEBERNSTEIN
GLOBAL HIGH INCOME FUND |
|
abfunds.com |
PORTFOLIO OF INVESTMENTS (continued)
|
|
|
|
|
|
|
|
|
|
|
|
|
| |
|
|
|
|
Principal
Amount
(000) |
|
|
U.S. $ Value |
|
| |
|
| WESCO Distribution, Inc.
7.125%,
06/15/2025(b) |
|
|
U.S.$ |
|
|
|
20 |
|
|
$
|
20,057 |
|
| 7.25%, 06/15/2028(b) |
|
|
|
|
|
|
271 |
|
|
|
272,862 |
|
|
|
|
|
|
|
|
|
|
|
|
|
|
|
|
|
|
|
|
|
|
|
|
|
36,454,408 |
|
|
|
|
|
|
|
|
|
|
|
|
|
|
| Communications - Media – 7.0% |
|
|
|
|
|
|
|
|
|
|
|
|
| Advantage Sales & Marketing, Inc.
6.50%, 11/15/2028(b) |
|
|
|
|
|
|
329 |
|
|
|
283,213 |
|
| Altice Financing SA
5.00%, 01/15/2028(b) |
|
|
|
|
|
|
764 |
|
|
|
651,323 |
|
| 5.75%, 08/15/2029(b) |
|
|
|
|
|
|
3,323 |
|
|
|
2,724,362 |
|
| AMC Networks, Inc.
4.25%, 02/15/2029 |
|
|
|
|
|
|
1,084 |
|
|
|
675,497 |
|
| 4.75%, 08/01/2025 |
|
|
|
|
|
|
890 |
|
|
|
820,705 |
|
| Arches Buyer, Inc.
6.125%, 12/01/2028(b) |
|
|
|
|
|
|
605 |
|
|
|
490,991 |
|
| Banijay Entertainment SASU
8.125%,
05/01/2029(b) |
|
|
|
|
|
|
805 |
|
|
|
799,937 |
|
| Series X
7.00%, 05/01/2029 |
|
|
EUR |
|
|
|
603 |
|
|
|
632,165 |
|
| CCO Holdings LLC/CCO Holdings Capital Corp.
4.50%, 08/15/2030(b) |
|
|
U.S.$ |
|
|
|
4,665 |
|
|
|
3,826,439 |
|
| 4.50%, 06/01/2033(b) |
|
|
|
|
|
|
3,016 |
|
|
|
2,307,374 |
|
| 4.75%, 02/01/2032(b) |
|
|
|
|
|
|
6,963 |
|
|
|
5,570,835 |
|
| 5.125%, 05/01/2027(b) |
|
|
|
|
|
|
327 |
|
|
|
304,561 |
|
| 6.375%, 09/01/2029(b) |
|
|
|
|
|
|
1,760 |
|
|
|
1,638,376 |
|
| 7.375%, 03/01/2031(b)(i) |
|
|
|
|
|
|
2,762 |
|
|
|
2,669,101 |
|
| Cimpress PLC
7.00%, 06/15/2026 |
|
|
|
|
|
|
356 |
|
|
|
332,995 |
|
| Clear Channel Outdoor Holdings, Inc.
5.125%,
08/15/2027(b) |
|
|
|
|
|
|
512 |
|
|
|
455,114 |
|
| CMG Media Corp.
8.875%, 12/15/2027(b) |
|
|
|
|
|
|
448 |
|
|
|
350,653 |
|
| CSC Holdings LLC
4.50%, 11/15/2031(b) |
|
|
|
|
|
|
981 |
|
|
|
694,339 |
|
| 4.625%, 12/01/2030(b) |
|
|
|
|
|
|
1,142 |
|
|
|
607,886 |
|
| 5.375%, 02/01/2028(b) |
|
|
|
|
|
|
2,721 |
|
|
|
2,220,197 |
|
| 5.75%, 01/15/2030(b) |
|
|
|
|
|
|
3,862 |
|
|
|
2,162,465 |
|
| 7.50%, 04/01/2028(b) |
|
|
|
|
|
|
1,150 |
|
|
|
746,283 |
|
| 11.25%, 05/15/2028(b) |
|
|
|
|
|
|
1,024 |
|
|
|
1,019,659 |
|
| Deluxe Corp.
8.00%, 06/01/2029(b) |
|
|
|
|
|
|
17 |
|
|
|
14,033 |
|
| DISH DBS Corp.
5.125%, 06/01/2029 |
|
|
|
|
|
|
2,900 |
|
|
|
1,601,964 |
|
| 5.25%, 12/01/2026(b) |
|
|
|
|
|
|
2,798 |
|
|
|
2,377,773 |
|
| 5.75%, 12/01/2028(b) |
|
|
|
|
|
|
2,596 |
|
|
|
1,995,016 |
|
| 5.875%, 11/15/2024 |
|
|
|
|
|
|
1,821 |
|
|
|
1,694,794 |
|
|
|
|
|
|
| abfunds.com |
|
ALLIANCEBERNSTEIN GLOBAL HIGH INCOME FUND | 15 |
PORTFOLIO OF INVESTMENTS (continued)
|
|
|
|
|
|
|
|
|
|
|
| |
|
|
|
Principal
Amount
(000) |
|
|
U.S. $ Value |
|
| |
|
| 7.375%, 07/01/2028 |
|
U.S.$ |
|
|
115 |
|
|
$
|
72,661 |
|
| 7.75%, 07/01/2026 |
|
|
|
|
816 |
|
|
|
611,332 |
|
| Gray Escrow II, Inc.
5.375%,
11/15/2031(b) |
|
|
|
|
1,364 |
|
|
|
890,262 |
|
| Gray Television, Inc.
7.00%,
05/15/2027(b) |
|
|
|
|
36 |
|
|
|
30,884 |
|
| iHeartCommunications, Inc.
4.75%,
01/15/2028(b) |
|
|
|
|
60 |
|
|
|
45,618 |
|
| 5.25%, 08/15/2027(b) |
|
|
|
|
1,499 |
|
|
|
1,188,730 |
|
| 8.375%, 05/01/2027 |
|
|
|
|
154 |
|
|
|
110,334 |
|
| LCPR Senior Secured Financing DAC
5.125%,
07/15/2029(b) |
|
|
|
|
2,910 |
|
|
|
2,353,522 |
|
| 6.75%, 10/15/2027(b) |
|
|
|
|
200 |
|
|
|
183,605 |
|
| Lions Gate Capital Holdings LLC
5.50%,
04/15/2029(b) |
|
|
|
|
27 |
|
|
|
17,823 |
|
| McGraw-Hill Education, Inc.
5.75%,
08/01/2028(b) |
|
|
|
|
1,123 |
|
|
|
974,653 |
|
| Outfront Media Capital LLC/Outfront Media Capital Corp.
4.625%, 03/15/2030(b) |
|
|
|
|
376 |
|
|
|
295,779 |
|
| Paramount Global
6.25%, 02/28/2057 |
|
|
|
|
245 |
|
|
|
184,047 |
|
| 6.375%, 03/30/2062 |
|
|
|
|
56 |
|
|
|
43,957 |
|
| Radiate Holdco LLC/Radiate Finance, Inc.
4.50%,
09/15/2026(b) |
|
|
|
|
1,331 |
|
|
|
1,008,704 |
|
| 6.50%, 09/15/2028(b) |
|
|
|
|
124 |
|
|
|
65,482 |
|
| Scripps Escrow II, Inc.
3.875%,
01/15/2029(b) |
|
|
|
|
26 |
|
|
|
19,567 |
|
| Sinclair Television Group, Inc.
4.125%,
12/01/2030(b) |
|
|
|
|
1,613 |
|
|
|
993,140 |
|
| 5.50%, 03/01/2030(b)(i) |
|
|
|
|
944 |
|
|
|
506,486 |
|
| Sirius XM Radio, Inc.
3.875%,
09/01/2031(b) |
|
|
|
|
145 |
|
|
|
109,822 |
|
| 4.00%, 07/15/2028(b) |
|
|
|
|
6,092 |
|
|
|
5,200,161 |
|
| 5.00%, 08/01/2027(b) |
|
|
|
|
837 |
|
|
|
764,468 |
|
| 5.50%, 07/01/2029(b) |
|
|
|
|
186 |
|
|
|
164,573 |
|
| Summer BC Holdco B SARL
5.75%,
10/31/2026(b) |
|
EUR |
|
|
1,395 |
|
|
|
1,352,697 |
|
| TEGNA, Inc.
5.00%, 09/15/2029 |
|
U.S.$ |
|
|
333 |
|
|
|
279,634 |
|
| Townsquare Media, Inc.
6.875%,
02/01/2026(b) |
|
|
|
|
113 |
|
|
|
106,270 |
|
| Univision Communications, Inc.
6.625%,
06/01/2027(b) |
|
|
|
|
1,593 |
|
|
|
1,482,073 |
|
| 7.375%, 06/30/2030(b) |
|
|
|
|
1,186 |
|
|
|
1,084,489 |
|
| 8.00%, 08/15/2028(b) |
|
|
|
|
322 |
|
|
|
310,366 |
|
|
|
|
|
|
| 16 | ALLIANCEBERNSTEIN
GLOBAL HIGH INCOME FUND |
|
abfunds.com |
PORTFOLIO OF INVESTMENTS (continued)
|
|
|
|
|
|
|
|
|
|
|
|
|
| |
|
|
|
|
Principal
Amount
(000) |
|
|
U.S. $ Value |
|
| |
|
| Urban One, Inc.
7.375%, 02/01/2028(b) |
|
|
U.S.$ |
|
|
|
2,600 |
|
|
$
|
2,230,231 |
|
| VZ Vendor Financing II BV
2.875%,
01/15/2029(b) |
|
|
EUR |
|
|
|
885 |
|
|
|
722,851 |
|
| Ziggo Bond Co. BV
5.125%, 02/28/2030(b) |
|
|
U.S.$ |
|
|
|
1,124 |
|
|
|
840,968 |
|
|
|
|
|
|
|
|
|
|
|
|
|
|
|
|
|
|
|
|
|
|
|
|
|
63,913,239 |
|
|
|
|
|
|
|
|
|
|
|
|
|
|
| Communications - Telecommunications – 2.6% |
|
|
|
|
|
|
|
|
|
|
|
|
| Altice France Holding SA
10.50%,
05/15/2027(b) |
|
|
|
|
|
|
2,710 |
|
|
|
1,658,401 |
|
| Altice France SA/France
3.375%,
01/15/2028(b) |
|
|
EUR |
|
|
|
885 |
|
|
|
693,213 |
|
| 5.125%, 07/15/2029(b) |
|
|
U.S.$ |
|
|
|
5,220 |
|
|
|
3,706,573 |
|
| 5.50%, 01/15/2028(b) |
|
|
|
|
|
|
492 |
|
|
|
376,139 |
|
| 5.50%, 10/15/2029(b) |
|
|
|
|
|
|
845 |
|
|
|
608,167 |
|
| 8.125%, 02/01/2027(b) |
|
|
|
|
|
|
224 |
|
|
|
198,265 |
|
| British Telecommunications PLC
4.25%,
11/23/2081(b) |
|
|
|
|
|
|
439 |
|
|
|
385,690 |
|
| Connect Finco SARL/Connect US Finco LLC
6.75%,
10/01/2026(b) |
|
|
|
|
|
|
2,240 |
|
|
|
2,092,969 |
|
| Consolidated Communications, Inc.
6.50%,
10/01/2028(b) |
|
|
|
|
|
|
1,040 |
|
|
|
812,121 |
|
| Embarq Corp.
7.995%, 06/01/2036 |
|
|
|
|
|
|
984 |
|
|
|
554,759 |
|
| Frontier Communications Holdings LLC
6.75%,
05/01/2029(b) |
|
|
|
|
|
|
321 |
|
|
|
247,317 |
|
| 8.75%, 05/15/2030(b) |
|
|
|
|
|
|
893 |
|
|
|
847,655 |
|
| Hughes Satellite Systems Corp.
6.625%, 08/01/2026 |
|
|
|
|
|
|
302 |
|
|
|
258,162 |
|
| Iliad Holding SASU
6.50%, 10/15/2026(b) |
|
|
|
|
|
|
519 |
|
|
|
487,771 |
|
| Intelsat Jackson Holdings SA
5.50%,
08/01/2023(c)(d)(e)(f) |
|
|
|
|
|
|
1,675 |
|
|
|
– 0 |
– |
| Level 3 Financing, Inc.
3.75%,
07/15/2029(b) |
|
|
|
|
|
|
1,018 |
|
|
|
569,058 |
|
| 4.25%, 07/01/2028(b) |
|
|
|
|
|
|
769 |
|
|
|
480,500 |
|
| 4.625%, 09/15/2027(b) |
|
|
|
|
|
|
1,451 |
|
|
|
1,044,720 |
|
| Lorca Telecom Bondco SA
4.00%,
09/18/2027(b) |
|
|
EUR |
|
|
|
952 |
|
|
|
935,103 |
|
| Lumen Technologies, Inc.
4.50%,
01/15/2029(b) |
|
|
U.S.$ |
|
|
|
68 |
|
|
|
21,072 |
|
| Telecom Italia Capital SA
7.20%, 07/18/2036 |
|
|
|
|
|
|
409 |
|
|
|
363,347 |
|
| 7.721%, 06/04/2038 |
|
|
|
|
|
|
1,565 |
|
|
|
1,440,717 |
|
|
|
|
|
|
| abfunds.com |
|
ALLIANCEBERNSTEIN GLOBAL HIGH INCOME FUND | 17 |
PORTFOLIO OF INVESTMENTS (continued)
|
|
|
|
|
|
|
|
|
|
|
|
|
| |
|
|
|
|
Principal
Amount
(000) |
|
|
U.S. $ Value |
|
| |
|
| Telecom Italia SpA/Milano
5.303%,
05/30/2024(b) |
|
|
U.S.$ |
|
|
|
403 |
|
|
$
|
397,240 |
|
| United Group BV
3.625%, 02/15/2028(b) |
|
|
EUR |
|
|
|
237 |
|
|
|
208,451 |
|
| 4.625%, 08/15/2028(b) |
|
|
|
|
|
|
481 |
|
|
|
432,308 |
|
| Series 2021-1A
8.60% (EURIBOR 3 Month + 4.88%), 02/01/2029(j) |
|
|
|
|
|
|
676 |
|
|
|
705,601 |
|
| Vmed O2 UK Financing I PLC
4.25%,
01/31/2031(b) |
|
|
U.S.$ |
|
|
|
530 |
|
|
|
422,741 |
|
| 4.75%, 07/15/2031(b) |
|
|
|
|
|
|
3,639 |
|
|
|
2,945,314 |
|
| Windstream Escrow LLC/Windstream Escrow Finance Corp.
7.75%, 08/15/2028(b) |
|
|
|
|
|
|
434 |
|
|
|
344,984 |
|
| Zayo Group Holdings, Inc.
4.00%,
03/01/2027(b) |
|
|
|
|
|
|
58 |
|
|
|
42,988 |
|
| 6.125%, 03/01/2028(b) |
|
|
|
|
|
|
128 |
|
|
|
82,192 |
|
|
|
|
|
|
|
|
|
|
|
|
|
|
|
|
|
|
|
|
|
|
|
|
|
23,363,538 |
|
|
|
|
|
|
|
|
|
|
|
|
|
|
| Consumer Cyclical - Automotive – 2.7% |
|
|
|
|
|
|
|
|
|
|
|
|
| Adient Global Holdings Ltd.
7.00%,
04/15/2028(b) |
|
|
|
|
|
|
363 |
|
|
|
360,673 |
|
| Allison Transmission, Inc.
3.75%,
01/30/2031(b) |
|
|
|
|
|
|
231 |
|
|
|
186,748 |
|
| 5.875%, 06/01/2029(b) |
|
|
|
|
|
|
1,163 |
|
|
|
1,096,024 |
|
| American Axle & Manufacturing, Inc.
5.00%, 10/01/2029 |
|
|
|
|
|
|
220 |
|
|
|
178,082 |
|
| Aston Martin Capital Holdings Ltd.
15.00% (8.89% Cash and 6.11% PIK), 11/30/2026(b)(g) |
|
|
|
|
|
|
1,060 |
|
|
|
1,172,164 |
|
| Clarios Global LP/Clarios US Finance Co.
4.375%, 05/15/2026(b) |
|
|
EUR |
|
|
|
210 |
|
|
|
212,513 |
|
| Dana Financing Luxembourg SARL
5.75%,
04/15/2025(b) |
|
|
U.S.$ |
|
|
|
55 |
|
|
|
53,803 |
|
| Dana, Inc.
4.25%, 09/01/2030 |
|
|
|
|
|
|
760 |
|
|
|
609,692 |
|
| 5.375%, 11/15/2027 |
|
|
|
|
|
|
109 |
|
|
|
101,197 |
|
| 5.625%, 06/15/2028 |
|
|
|
|
|
|
182 |
|
|
|
166,532 |
|
| Dealer Tire LLC/DT Issuer LLC
8.00%,
02/01/2028(b) |
|
|
|
|
|
|
1,116 |
|
|
|
1,046,372 |
|
| Exide Technologies
(Exchange Priority)
11.00%, 10/31/2024(c)(e)(f)(h)(k) |
|
|
|
|
|
|
2,940 |
|
|
|
– 0 |
– |
| (First Lien)
11.00%, 10/31/2024(c)(e)(f)(h)(k) |
|
|
|
|
|
|
1,207 |
|
|
|
– 0 |
– |
| Goodyear Tire & Rubber Co. (The)
5.25%, 07/15/2031 |
|
|
|
|
|
|
62 |
|
|
|
50,910 |
|
|
|
|
|
|
| 18 | ALLIANCEBERNSTEIN
GLOBAL HIGH INCOME FUND |
|
abfunds.com |
PORTFOLIO OF INVESTMENTS (continued)
|
|
|
|
|
|
|
|
|
|
|
|
|
| |
|
|
|
|
Principal
Amount
(000) |
|
|
U.S. $ Value |
|
| |
|
| IHO Verwaltungs GmbH
3.75% (3.75% Cash or 4.50% PIK), 09/15/2026(b)(g) |
|
|
EUR |
|
|
|
885 |
|
|
$
|
879,942 |
|
| 3.875% (3.875% Cash or 4.625% PIK), 05/15/2027(b)(g) |
|
|
|
|
|
|
338 |
|
|
|
322,616 |
|
| 6.00% (6.00% Cash or 6.75% PIK), 05/15/2027(b)(g) |
|
|
U.S.$ |
|
|
|
1,984 |
|
|
|
1,859,384 |
|
| 8.75% (8.75% Cash or 9.50% PIK), 05/15/2028(b)(g) |
|
|
EUR |
|
|
|
306 |
|
|
|
333,882 |
|
| Jaguar Land Rover Automotive PLC
5.50%,
07/15/2029(b) |
|
|
U.S.$ |
|
|
|
1,490 |
|
|
|
1,273,341 |
|
| 5.875%, 01/15/2028(b) |
|
|
|
|
|
|
705 |
|
|
|
633,357 |
|
| 7.75%, 10/15/2025(b) |
|
|
|
|
|
|
1,207 |
|
|
|
1,207,533 |
|
| Mclaren Finance PLC
7.50%, 08/01/2026(b) |
|
|
|
|
|
|
1,973 |
|
|
|
1,720,994 |
|
| PM General Purchaser LLC
9.50%,
10/01/2028(b) |
|
|
|
|
|
|
1,339 |
|
|
|
1,243,786 |
|
| Real Hero Merger Sub 2, Inc.
6.25%,
02/01/2029(b)(i) |
|
|
|
|
|
|
1,530 |
|
|
|
1,193,739 |
|
| Tenneco, Inc.
8.00%, 11/17/2028(b) |
|
|
|
|
|
|
2,853 |
|
|
|
2,320,268 |
|
| Titan International, Inc.
7.00%, 04/30/2028 |
|
|
|
|
|
|
1,465 |
|
|
|
1,370,018 |
|
| ZF Europe Finance BV
2.00%,
02/23/2026(a)(b) |
|
|
EUR |
|
|
|
200 |
|
|
|
193,500 |
|
| ZF Finance GmbH
Series E
2.00%,
05/06/2027(b) |
|
|
|
|
|
|
200 |
|
|
|
185,283 |
|
| 2.75%, 05/25/2027(b) |
|
|
|
|
|
|
900 |
|
|
|
850,110 |
|
| ZF North America Capital, Inc.
4.75%,
04/29/2025(b) |
|
|
U.S.$ |
|
|
|
2,357 |
|
|
|
2,268,144 |
|
| 6.875%, 04/14/2028(b) |
|
|
|
|
|
|
504 |
|
|
|
493,440 |
|
| 7.125%, 04/14/2030(b) |
|
|
|
|
|
|
504 |
|
|
|
494,223 |
|
|
|
|
|
|
|
|
|
|
|
|
|
|
|
|
|
|
|
|
|
|
|
|
|
24,078,270 |
|
|
|
|
|
|
|
|
|
|
|
|
|
|
| Consumer Cyclical - Entertainment – 2.9% |
|
|
|
|
|
|
|
|
|
|
|
|
| AMC Entertainment Holdings, Inc.
7.50%,
02/15/2029(b) |
|
|
|
|
|
|
142 |
|
|
|
98,672 |
|
| Carnival Corp.
4.00%, 08/01/2028(b) |
|
|
|
|
|
|
1,739 |
|
|
|
1,505,185 |
|
| 5.75%, 03/01/2027(b) |
|
|
|
|
|
|
1,171 |
|
|
|
1,059,220 |
|
| 6.00%, 05/01/2029(b) |
|
|
|
|
|
|
43 |
|
|
|
36,604 |
|
| 7.00%, 08/15/2029(b) |
|
|
|
|
|
|
243 |
|
|
|
238,748 |
|
| 7.625%, 03/01/2026(b) |
|
|
EUR |
|
|
|
311 |
|
|
|
322,603 |
|
| 9.875%, 08/01/2027(b) |
|
|
U.S.$ |
|
|
|
437 |
|
|
|
455,999 |
|
| 10.50%, 06/01/2030(b) |
|
|
|
|
|
|
388 |
|
|
|
398,185 |
|
|
|
|
|
|
| abfunds.com |
|
ALLIANCEBERNSTEIN GLOBAL HIGH INCOME FUND | 19 |
PORTFOLIO OF INVESTMENTS (continued)
|
|
|
|
|
|
|
|
|
|
|
|
|
| |
|
|
|
|
Principal
Amount
(000) |
|
|
U.S. $ Value |
|
| |
|
| Carnival Holdings Bermuda Ltd.
10.375%,
05/01/2028(b) |
|
|
U.S.$ |
|
|
|
3,714 |
|
|
$
|
3,980,849 |
|
| Carnival PLC
1.00%, 10/28/2029 |
|
|
EUR |
|
|
|
202 |
|
|
|
136,586 |
|
| Cedar Fair LP/Canada’s Wonderland Co./Magnum
Management Corp./Millennium Op
5.375%,
04/15/2027 |
|
|
U.S.$ |
|
|
|
117 |
|
|
|
109,659 |
|
| 5.50%, 05/01/2025(b) |
|
|
|
|
|
|
2,191 |
|
|
|
2,146,888 |
|
| Cinemark USA, Inc.
5.25%, 07/15/2028(b) |
|
|
|
|
|
|
492 |
|
|
|
436,829 |
|
| Lindblad Expeditions LLC
6.75%,
02/15/2027(b) |
|
|
|
|
|
|
365 |
|
|
|
341,691 |
|
| Live Nation Entertainment, Inc.
3.75%,
01/15/2028(b) |
|
|
|
|
|
|
566 |
|
|
|
501,207 |
|
| Motion Bondco DAC
4.50%, 11/15/2027(b) |
|
|
EUR |
|
|
|
670 |
|
|
|
613,549 |
|
| NCL Corp., Ltd.
5.875%, 03/15/2026(b) |
|
|
U.S.$ |
|
|
|
562 |
|
|
|
520,161 |
|
| 7.75%, 02/15/2029(b) |
|
|
|
|
|
|
153 |
|
|
|
142,024 |
|
| 8.375%, 02/01/2028(b) |
|
|
|
|
|
|
637 |
|
|
|
646,264 |
|
| NCL Finance Ltd.
6.125%, 03/15/2028(b) |
|
|
|
|
|
|
39 |
|
|
|
34,740 |
|
| Royal Caribbean Cruises Ltd.
5.375%,
07/15/2027(b) |
|
|
|
|
|
|
1,321 |
|
|
|
1,220,663 |
|
| 5.50%, 08/31/2026(b) |
|
|
|
|
|
|
1,165 |
|
|
|
1,099,399 |
|
| 5.50%, 04/01/2028(b) |
|
|
|
|
|
|
4,238 |
|
|
|
3,886,956 |
|
| 8.25%, 01/15/2029(b) |
|
|
|
|
|
|
336 |
|
|
|
346,728 |
|
| 11.50%, 06/01/2025(b) |
|
|
|
|
|
|
504 |
|
|
|
531,991 |
|
| 11.625%, 08/15/2027(b) |
|
|
|
|
|
|
158 |
|
|
|
170,936 |
|
| Six Flags Entertainment Corp.
7.25%,
05/15/2031(b) |
|
|
|
|
|
|
1,082 |
|
|
|
1,016,646 |
|
| Viking Cruises Ltd.
5.875%, 09/15/2027(b) |
|
|
|
|
|
|
715 |
|
|
|
652,028 |
|
| 7.00%, 02/15/2029(b) |
|
|
|
|
|
|
1,752 |
|
|
|
1,617,096 |
|
| 9.125%, 07/15/2031(b) |
|
|
|
|
|
|
83 |
|
|
|
83,135 |
|
| VOC Escrow Ltd.
5.00%, 02/15/2028(b) |
|
|
|
|
|
|
1,669 |
|
|
|
1,519,201 |
|
|
|
|
|
|
|
|
|
|
|
|
|
|
|
|
|
|
|
|
|
|
|
|
|
25,870,442 |
|
|
|
|
|
|
|
|
|
|
|
|
|
|
| Consumer Cyclical - Other – 3.4% |
|
|
|
|
|
|
|
|
|
|
|
|
| Adams Homes, Inc.
7.50%, 02/15/2025(b) |
|
|
|
|
|
|
598 |
|
|
|
593,730 |
|
| Affinity Interactive
6.875%,
12/15/2027(b) |
|
|
|
|
|
|
199 |
|
|
|
168,609 |
|
| Brookfield Residential Properties, Inc./Brookfield Residential US LLC
4.875%, 02/15/2030(b) |
|
|
|
|
|
|
1,097 |
|
|
|
892,530 |
|
|
|
|
|
|
| 20 | ALLIANCEBERNSTEIN
GLOBAL HIGH INCOME FUND |
|
abfunds.com |
PORTFOLIO OF INVESTMENTS (continued)
|
|
|
|
|
|
|
|
|
|
|
| |
|
|
|
Principal
Amount
(000) |
|
|
U.S. $ Value |
|
| |
|
| 5.00%, 06/15/2029(b) |
|
U.S.$ |
|
|
167 |
|
|
$
|
137,654 |
|
| 6.25%, 09/15/2027(b) |
|
|
|
|
1,233 |
|
|
|
1,109,742 |
|
| Builders FirstSource, Inc.
4.25%,
02/01/2032(b) |
|
|
|
|
270 |
|
|
|
221,464 |
|
| 5.00%, 03/01/2030(b) |
|
|
|
|
56 |
|
|
|
49,883 |
|
| 6.375%, 06/15/2032(b) |
|
|
|
|
1,070 |
|
|
|
1,006,892 |
|
| Caesars Entertainment, Inc.
6.25%,
07/01/2025(b) |
|
|
|
|
897 |
|
|
|
885,506 |
|
| 7.00%, 02/15/2030(b) |
|
|
|
|
1,275 |
|
|
|
1,239,977 |
|
| Castle UK Finco PLC
7.00%, 05/15/2029 |
|
GBP |
|
|
679 |
|
|
|
641,176 |
|
| Series U
9.031% (EURIBOR 3 Month + 5.25%), 05/15/2028(j) |
|
EUR |
|
|
514 |
|
|
|
469,225 |
|
| Century Communities, Inc.
3.875%,
08/15/2029(b) |
|
U.S.$ |
|
|
406 |
|
|
|
335,498 |
|
| Churchill Downs, Inc.
4.75%,
01/15/2028(b) |
|
|
|
|
491 |
|
|
|
442,996 |
|
| Everi Holdings, Inc.
5.00%, 07/15/2029(b) |
|
|
|
|
240 |
|
|
|
206,583 |
|
| Five Point Operating Co. LP/Five Point Capital Corp.
7.875%, 11/15/2025(b) |
|
|
|
|
1,969 |
|
|
|
1,857,352 |
|
| Forestar Group, Inc.
3.85%, 05/15/2026(b) |
|
|
|
|
385 |
|
|
|
350,820 |
|
| Hilton Domestic Operating Co., Inc.
3.625%,
02/15/2032(b) |
|
|
|
|
1,728 |
|
|
|
1,392,780 |
|
| 3.75%, 05/01/2029(b) |
|
|
|
|
399 |
|
|
|
344,758 |
|
| 5.375%, 05/01/2025(b) |
|
|
|
|
229 |
|
|
|
224,931 |
|
| 5.75%, 05/01/2028(b) |
|
|
|
|
246 |
|
|
|
237,385 |
|
| Hilton Grand Vacations Borrower Escrow LLC/Hilton Grand Vacations Borrower Esc
4.875%, 07/01/2031(b) |
|
|
|
|
989 |
|
|
|
805,832 |
|
| 5.00%, 06/01/2029(b) |
|
|
|
|
1,598 |
|
|
|
1,387,997 |
|
| Hilton Worldwide Finance LLC/Hilton Worldwide Finance Corp.
4.875%, 04/01/2027 |
|
|
|
|
16 |
|
|
|
15,220 |
|
| Installed Building Products, Inc.
5.75%,
02/01/2028(b) |
|
|
|
|
291 |
|
|
|
267,929 |
|
| Jacobs Entertainment, Inc.
6.75%,
02/15/2029(b) |
|
|
|
|
2 |
|
|
|
1,773 |
|
| Marriott Ownership Resorts, Inc.
4.50%,
06/15/2029(b) |
|
|
|
|
401 |
|
|
|
336,058 |
|
| MGM Resorts International
4.75%, 10/15/2028 |
|
|
|
|
1,047 |
|
|
|
921,957 |
|
| 5.50%, 04/15/2027 |
|
|
|
|
1,163 |
|
|
|
1,084,715 |
|
| 5.75%, 06/15/2025 |
|
|
|
|
30 |
|
|
|
29,318 |
|
|
|
|
|
|
| abfunds.com |
|
ALLIANCEBERNSTEIN GLOBAL HIGH INCOME FUND | 21 |
PORTFOLIO OF INVESTMENTS (continued)
|
|
|
|
|
|
|
|
|
|
|
|
|
| |
|
|
|
|
Principal
Amount
(000) |
|
|
U.S. $ Value |
|
| |
|
| Mohegan Tribal Gaming Authority
8.00%,
02/01/2026(b) |
|
|
U.S.$ |
|
|
|
420 |
|
|
$
|
386,487 |
|
| New Home Co., Inc. (The)
8.25%,
10/15/2027(a)(b) |
|
|
|
|
|
|
211 |
|
|
|
197,401 |
|
| Playtech PLC
4.25%, 03/07/2026(b) |
|
|
EUR |
|
|
|
101 |
|
|
|
103,147 |
|
| Premier Entertainment Sub LLC/Premier Entertainment Finance Corp.
5.625%, 09/01/2029(b) |
|
|
U.S.$ |
|
|
|
69 |
|
|
|
53,056 |
|
| Scientific Games Holdings LP/Scientific Games US FinCo, Inc.
6.625%, 03/01/2030(b) |
|
|
|
|
|
|
112 |
|
|
|
96,653 |
|
| Shea Homes LP/Shea Homes Funding Corp.
4.75%, 02/15/2028 |
|
|
|
|
|
|
549 |
|
|
|
491,861 |
|
| 4.75%, 04/01/2029 |
|
|
|
|
|
|
911 |
|
|
|
791,573 |
|
| Standard Industries, Inc./NJ
4.375%,
07/15/2030(b) |
|
|
|
|
|
|
929 |
|
|
|
769,456 |
|
| 4.75%, 01/15/2028(b) |
|
|
|
|
|
|
163 |
|
|
|
147,022 |
|
| Sugarhouse HSP Gaming Prop Mezz LP/Sugarhouse HSP Gaming Finance Corp.
5.875%, 05/15/2025(b) |
|
|
|
|
|
|
1,785 |
|
|
|
1,720,902 |
|
| Taylor Morrison Communities, Inc.
5.75%,
01/15/2028(b) |
|
|
|
|
|
|
292 |
|
|
|
271,858 |
|
| Thor Industries, Inc.
4.00%,
10/15/2029(b) |
|
|
|
|
|
|
230 |
|
|
|
189,535 |
|
| TopBuild Corp.
4.125%, 02/15/2032(b) |
|
|
|
|
|
|
418 |
|
|
|
340,069 |
|
| Travel + Leisure Co.
4.50%, 12/01/2029(b) |
|
|
|
|
|
|
976 |
|
|
|
820,691 |
|
| 4.625%, 03/01/2030(b) |
|
|
|
|
|
|
2,415 |
|
|
|
2,040,675 |
|
| 6.00%, 04/01/2027(a) |
|
|
|
|
|
|
112 |
|
|
|
106,481 |
|
| 6.625%, 07/31/2026(b) |
|
|
|
|
|
|
637 |
|
|
|
619,133 |
|
| Universal Entertainment Corp.
8.75%,
12/11/2024(a)(b) |
|
|
|
|
|
|
410 |
|
|
|
437,429 |
|
| Wyndham Hotels & Resorts, Inc.
4.375%,
08/15/2028(b) |
|
|
|
|
|
|
727 |
|
|
|
652,702 |
|
| Wynn Las Vegas LLC/Wynn Las Vegas Capital Corp.
5.25%, 05/15/2027(b) |
|
|
|
|
|
|
781 |
|
|
|
726,141 |
|
| Wynn Resorts Finance LLC/Wynn Resorts Capital Corp.
5.125%, 10/01/2029(b) |
|
|
|
|
|
|
1,988 |
|
|
|
1,737,868 |
|
|
|
|
|
|
|
|
|
|
|
|
|
|
|
|
|
|
|
|
|
|
|
|
|
30,360,430 |
|
|
|
|
|
|
|
|
|
|
|
|
|
|
| Consumer Cyclical - Restaurants – 0.4% |
|
|
|
|
|
|
|
|
|
|
|
|
| 1011778 BC ULC/New Red Finance, Inc.
3.875%,
01/15/2028(b) |
|
|
|
|
|
|
1,524 |
|
|
|
1,368,413 |
|
| 4.375%, 01/15/2028(b) |
|
|
|
|
|
|
315 |
|
|
|
283,862 |
|
|
|
|
|
|
| 22 | ALLIANCEBERNSTEIN
GLOBAL HIGH INCOME FUND |
|
abfunds.com |
PORTFOLIO OF INVESTMENTS (continued)
|
|
|
|
|
|
|
|
|
|
|
|
|
| |
|
|
|
|
Principal
Amount
(000) |
|
|
U.S. $ Value |
|
| |
|
| CEC Entertainment LLC
6.75%,
05/01/2026(b) |
|
|
U.S.$ |
|
|
|
350 |
|
|
$
|
331,468 |
|
| Fertitta Entertainment LLC/Fertitta Entertainment Finance Co., Inc.
4.625%, 01/15/2029(b) |
|
|
|
|
|
|
166 |
|
|
|
140,787 |
|
| Stonegate Pub Co. Financing 2019 PLC
8.00%,
07/13/2025(b) |
|
|
GBP |
|
|
|
192 |
|
|
|
218,777 |
|
| Yum! Brands, Inc.
4.625%, 01/31/2032 |
|
|
U.S.$ |
|
|
|
1,114 |
|
|
|
966,322 |
|
| 4.75%, 01/15/2030(b) |
|
|
|
|
|
|
85 |
|
|
|
76,308 |
|
|
|
|
|
|
|
|
|
|
|
|
|
|
|
|
|
|
|
|
|
|
|
|
|
3,385,937 |
|
|
|
|
|
|
|
|
|
|
|
|
|
|
| Consumer Cyclical - Retailers – 2.5% |
|
|
|
|
|
|
|
|
|
|
|
|
| Arko Corp.
5.125%, 11/15/2029(b) |
|
|
|
|
|
|
1,035 |
|
|
|
835,076 |
|
| Asbury Automotive Group, Inc.
4.625%,
11/15/2029(b) |
|
|
|
|
|
|
1,152 |
|
|
|
988,815 |
|
| 4.75%, 03/01/2030 |
|
|
|
|
|
|
17 |
|
|
|
14,457 |
|
| 5.00%, 02/15/2032(b) |
|
|
|
|
|
|
826 |
|
|
|
684,699 |
|
| Bath & Body Works, Inc.
6.625%,
10/01/2030(b) |
|
|
|
|
|
|
1,916 |
|
|
|
1,794,409 |
|
| 6.75%, 07/01/2036 |
|
|
|
|
|
|
98 |
|
|
|
85,333 |
|
| 6.875%, 11/01/2035 |
|
|
|
|
|
|
519 |
|
|
|
462,965 |
|
| 7.50%, 06/15/2029 |
|
|
|
|
|
|
107 |
|
|
|
105,488 |
|
| 7.60%, 07/15/2037 |
|
|
|
|
|
|
261 |
|
|
|
227,819 |
|
| 9.375%, 07/01/2025(b) |
|
|
|
|
|
|
41 |
|
|
|
42,573 |
|
| BCPE Ulysses Intermediate, Inc.
7.75% (7.75% Cash or 8.50% PIK), 04/01/2027(b)(g) |
|
|
|
|
|
|
518 |
|
|
|
453,986 |
|
| Beacon Roofing Supply, Inc.
6.50%,
08/01/2030(b) |
|
|
|
|
|
|
674 |
|
|
|
653,828 |
|
| Carvana Co.
5.50%, 04/15/2027(b) |
|
|
|
|
|
|
415 |
|
|
|
304,005 |
|
| 12.00%, 12/01/2028(a)(b)(g) |
|
|
|
|
|
|
329 |
|
|
|
256,925 |
|
| Foundation Building Materials, Inc.
6.00%,
03/01/2029(b) |
|
|
|
|
|
|
246 |
|
|
|
204,084 |
|
| Gap, Inc. (The)
3.625%, 10/01/2029(b) |
|
|
|
|
|
|
27 |
|
|
|
19,997 |
|
| 3.875%, 10/01/2031(b) |
|
|
|
|
|
|
56 |
|
|
|
39,338 |
|
| Group 1 Automotive, Inc.
4.00%,
08/15/2028(b) |
|
|
|
|
|
|
417 |
|
|
|
361,561 |
|
| Guitar Center, Inc.
8.50%, 01/15/2026(b) |
|
|
|
|
|
|
161 |
|
|
|
139,832 |
|
| Kontoor Brands, Inc.
4.125%,
11/15/2029(b) |
|
|
|
|
|
|
894 |
|
|
|
744,020 |
|
|
|
|
|
|
| abfunds.com |
|
ALLIANCEBERNSTEIN GLOBAL HIGH INCOME FUND | 23 |
PORTFOLIO OF INVESTMENTS (continued)
|
|
|
|
|
|
|
|
|
|
|
| |
|
|
|
Principal
Amount
(000) |
|
|
U.S. $ Value |
|
| |
|
| LBM Acquisition LLC
6.25%, 01/15/2029(b) |
|
U.S.$ |
|
|
81 |
|
|
$
|
66,442 |
|
| LCM Investments Holdings II LLC
8.25%,
08/01/2031(b) |
|
|
|
|
431 |
|
|
|
419,421 |
|
| Levi Strauss & Co.
3.50%,
03/01/2031(b) |
|
|
|
|
746 |
|
|
|
593,645 |
|
| Lithia Motors, Inc.
4.375%, 01/15/2031(b) |
|
|
|
|
464 |
|
|
|
383,462 |
|
| LSF9 Atlantis Holdings LLC/Victra Finance Corp.
7.75%, 02/15/2026(b) |
|
|
|
|
154 |
|
|
|
139,453 |
|
| Michaels Cos., Inc. (The)
5.25%,
05/01/2028(b) |
|
|
|
|
1,475 |
|
|
|
1,177,845 |
|
| 7.875%, 05/01/2029(b) |
|
|
|
|
1,356 |
|
|
|
889,019 |
|
| Murphy Oil USA, Inc.
3.75%, 02/15/2031(b) |
|
|
|
|
442 |
|
|
|
360,882 |
|
| 5.625%, 05/01/2027 |
|
|
|
|
69 |
|
|
|
66,899 |
|
| NMG Holding Co., Inc./Neiman Marcus Group LLC
7.125%, 04/01/2026(b) |
|
|
|
|
2,103 |
|
|
|
1,973,876 |
|
| Nordstrom, Inc.
5.00%, 01/15/2044 |
|
|
|
|
4 |
|
|
|
2,360 |
|
| Penske Automotive Group, Inc.
3.75%, 06/15/2029 |
|
|
|
|
1,230 |
|
|
|
1,034,318 |
|
| QVC, Inc.
4.375%, 09/01/2028 |
|
|
|
|
5 |
|
|
|
2,622 |
|
| 4.45%, 02/15/2025 |
|
|
|
|
296 |
|
|
|
258,809 |
|
| 4.75%, 02/15/2027 |
|
|
|
|
213 |
|
|
|
130,899 |
|
| Sonic Automotive, Inc.
4.625%,
11/15/2029(b) |
|
|
|
|
1,674 |
|
|
|
1,384,216 |
|
| 4.875%, 11/15/2031(b) |
|
|
|
|
144 |
|
|
|
114,522 |
|
| Specialty Building Products Holdings LLC/SBP Finance Corp.
6.375%, 09/30/2026(b) |
|
|
|
|
418 |
|
|
|
392,027 |
|
| Staples, Inc.
7.50%, 04/15/2026(b) |
|
|
|
|
2,851 |
|
|
|
2,345,135 |
|
| 10.75%, 04/15/2027(b) |
|
|
|
|
1,207 |
|
|
|
706,701 |
|
| TPro Acquisition Corp.
11.00%,
10/15/2024(b) |
|
|
|
|
1,062 |
|
|
|
1,062,026 |
|
| Victoria’s Secret & Co.
4.625%,
07/15/2029(b) |
|
|
|
|
58 |
|
|
|
42,035 |
|
| White Cap Buyer LLC
6.875%, 10/15/2028(b) |
|
|
|
|
226 |
|
|
|
199,364 |
|
|
|
|
|
|
| 24 | ALLIANCEBERNSTEIN
GLOBAL HIGH INCOME FUND |
|
abfunds.com |
PORTFOLIO OF INVESTMENTS (continued)
|
|
|
|
|
|
|
|
|
|
|
|
|
| |
|
|
|
|
Principal
Amount
(000) |
|
|
U.S. $ Value |
|
| |
|
| White Cap Parent LLC
8.25% (8.25% Cash or 9.00% PIK), 03/15/2026(b)(g) |
|
|
U.S.$ |
|
|
|
329 |
|
|
$
|
317,746 |
|
|
|
|
|
|
|
|
|
|
|
|
|
|
|
|
|
|
|
|
|
|
|
|
|
22,482,934 |
|
|
|
|
|
|
|
|
|
|
|
|
|
|
| Consumer Non-Cyclical – 6.7% |
|
|
|
|
|
|
|
|
|
|
|
|
| AdaptHealth LLC
6.125%, 08/01/2028(b) |
|
|
|
|
|
|
288 |
|
|
|
249,114 |
|
| AHP Health Partners, Inc.
5.75%,
07/15/2029(b) |
|
|
|
|
|
|
162 |
|
|
|
137,407 |
|
| Albertsons Cos., Inc./Safeway, Inc./New Albertsons LP/Albertsons LLC
4.625%, 01/15/2027(b) |
|
|
|
|
|
|
615 |
|
|
|
581,020 |
|
| 4.875%, 02/15/2030(b) |
|
|
|
|
|
|
200 |
|
|
|
180,316 |
|
| 6.50%, 02/15/2028(b) |
|
|
|
|
|
|
2,469 |
|
|
|
2,439,173 |
|
| Bausch & Lomb Escrow Corp.
8.375%,
10/01/2028(b) |
|
|
|
|
|
|
2,040 |
|
|
|
2,044,645 |
|
| Bausch Health Americas, Inc.
8.50%,
01/31/2027(b) |
|
|
|
|
|
|
543 |
|
|
|
275,677 |
|
| Bausch Health Cos., Inc.
4.875%,
06/01/2028(b) |
|
|
|
|
|
|
2,835 |
|
|
|
1,613,337 |
|
| 5.25%, 01/30/2030(b) |
|
|
|
|
|
|
8 |
|
|
|
3,053 |
|
| 5.50%, 11/01/2025(b) |
|
|
|
|
|
|
226 |
|
|
|
200,406 |
|
| 5.75%, 08/15/2027(b) |
|
|
|
|
|
|
70 |
|
|
|
41,699 |
|
| 6.125%, 02/01/2027(b) |
|
|
|
|
|
|
359 |
|
|
|
224,728 |
|
| 6.25%, 02/15/2029(b) |
|
|
|
|
|
|
911 |
|
|
|
360,376 |
|
| 7.25%, 05/30/2029(b) |
|
|
|
|
|
|
254 |
|
|
|
105,529 |
|
| 11.00%, 09/30/2028(b) |
|
|
|
|
|
|
403 |
|
|
|
272,835 |
|
| CAB SELAS
3.375%, 02/01/2028(b) |
|
|
EUR |
|
|
|
1,880 |
|
|
|
1,659,232 |
|
| CD&R Smokey Buyer, Inc.
6.75%,
07/15/2025(b) |
|
|
U.S.$ |
|
|
|
72 |
|
|
|
69,338 |
|
| CHS/Community Health Systems, Inc.
4.75%,
02/15/2031(b) |
|
|
|
|
|
|
493 |
|
|
|
349,961 |
|
| 5.625%, 03/15/2027(b) |
|
|
|
|
|
|
573 |
|
|
|
490,829 |
|
| 6.00%, 01/15/2029(b) |
|
|
|
|
|
|
133 |
|
|
|
107,777 |
|
| 6.125%, 04/01/2030(b) |
|
|
|
|
|
|
3,702 |
|
|
|
1,897,820 |
|
| 6.875%, 04/01/2028(b) |
|
|
|
|
|
|
577 |
|
|
|
307,856 |
|
| 6.875%, 04/15/2029(b) |
|
|
|
|
|
|
1,497 |
|
|
|
797,530 |
|
| 8.00%, 03/15/2026(b) |
|
|
|
|
|
|
599 |
|
|
|
571,017 |
|
| Coty, Inc.
5.00%, 04/15/2026(b) |
|
|
|
|
|
|
133 |
|
|
|
127,730 |
|
| DaVita, Inc.
3.75%, 02/15/2031(b) |
|
|
|
|
|
|
687 |
|
|
|
522,826 |
|
| 4.625%, 06/01/2030(b) |
|
|
|
|
|
|
3,878 |
|
|
|
3,182,346 |
|
| Edgewell Personal Care Co.
4.125%,
04/01/2029(b) |
|
|
|
|
|
|
164 |
|
|
|
139,387 |
|
|
|
|
|
|
| abfunds.com |
|
ALLIANCEBERNSTEIN GLOBAL HIGH INCOME FUND | 25 |
PORTFOLIO OF INVESTMENTS (continued)
|
|
|
|
|
|
|
|
|
|
|
| |
|
|
|
Principal
Amount
(000) |
|
|
U.S. $ Value |
|
| |
|
| Elanco Animal Health, Inc.
6.65%,
08/28/2028(a)(i) |
|
U.S.$ |
|
|
1,416 |
|
|
$
|
1,374,111 |
|
| Embecta Corp.
5.00%, 02/15/2030(b) |
|
|
|
|
2,581 |
|
|
|
2,030,635 |
|
| Emergent BioSolutions, Inc.
3.875%,
08/15/2028(b) |
|
|
|
|
1,516 |
|
|
|
636,294 |
|
| Fortrea Holdings, Inc.
7.50%,
07/01/2030(b) |
|
|
|
|
328 |
|
|
|
320,227 |
|
| Garden Spinco Corp.
8.625%, 07/20/2030(b) |
|
|
|
|
883 |
|
|
|
922,583 |
|
| Global Medical Response, Inc.
6.50%,
10/01/2025(b) |
|
|
|
|
309 |
|
|
|
209,313 |
|
| Grifols SA
3.875%, 10/15/2028(b) |
|
EUR |
|
|
2,222 |
|
|
|
1,992,348 |
|
| Gruenenthal GmbH
3.625%, 11/15/2026(b) |
|
|
|
|
885 |
|
|
|
887,671 |
|
| 4.125%, 05/15/2028(b) |
|
|
|
|
1,141 |
|
|
|
1,111,178 |
|
| Heartland Dental LLC/Heartland Dental Finance Corp.
10.50%, 04/30/2028(b) |
|
U.S.$ |
|
|
76 |
|
|
|
76,277 |
|
| Herbalife Nutrition Ltd./HLF Financing, Inc.
7.875%, 09/01/2025(b) |
|
|
|
|
382 |
|
|
|
362,938 |
|
| Hologic, Inc.
3.25%, 02/15/2029(b) |
|
|
|
|
246 |
|
|
|
207,882 |
|
| Iceland Bondco PLC
9.254% (EURIBOR 3 Month + 5.50%), 12/15/2027(j) |
|
EUR |
|
|
385 |
|
|
|
404,826 |
|
| 10.875%, 12/15/2027(b) |
|
GBP |
|
|
162 |
|
|
|
201,930 |
|
| IQVIA, Inc.
2.25%, 03/15/2029(b) |
|
EUR |
|
|
862 |
|
|
|
763,316 |
|
| 5.00%, 10/15/2026(b) |
|
U.S.$ |
|
|
239 |
|
|
|
227,950 |
|
| 6.50%, 05/15/2030(b) |
|
|
|
|
329 |
|
|
|
323,012 |
|
| Jazz Securities DAC
4.375%, 01/15/2029(b) |
|
|
|
|
954 |
|
|
|
831,746 |
|
| Kronos Acquisition Holdings, Inc./KIK Custom Products, Inc.
7.00%, 12/31/2027(b) |
|
|
|
|
1,929 |
|
|
|
1,663,728 |
|
| Lamb Weston Holdings, Inc.
4.125%,
01/31/2030(b) |
|
|
|
|
1,062 |
|
|
|
907,859 |
|
| Legacy LifePoint Health LLC
4.375%,
02/15/2027(b) |
|
|
|
|
3,165 |
|
|
|
2,721,978 |
|
| Medline Borrower LP
3.875%, 04/01/2029(b) |
|
|
|
|
1,738 |
|
|
|
1,468,501 |
|
| 5.25%, 10/01/2029(b) |
|
|
|
|
3,167 |
|
|
|
2,737,801 |
|
|
|
|
|
|
| 26 | ALLIANCEBERNSTEIN
GLOBAL HIGH INCOME FUND |
|
abfunds.com |
PORTFOLIO OF INVESTMENTS (continued)
|
|
|
|
|
|
|
|
|
|
|
| |
|
|
|
Principal
Amount
(000) |
|
|
U.S. $ Value |
|
| |
|
| Newell Brands, Inc.
4.875%, 06/01/2025 |
|
U.S.$ |
|
|
170 |
|
|
$
|
163,067 |
|
| 5.20%, 04/01/2026(a) |
|
|
|
|
452 |
|
|
|
425,922 |
|
| 6.375%, 09/15/2027 |
|
|
|
|
407 |
|
|
|
388,155 |
|
| Organon & Co./Organon Foreign Debt Co-Issuer BV
2.875%,
04/30/2028(b) |
|
EUR |
|
|
885 |
|
|
|
806,439 |
|
| 4.125%, 04/30/2028(b) |
|
U.S.$ |
|
|
915 |
|
|
|
796,093 |
|
| 5.125%, 04/30/2031(b) |
|
|
|
|
1,160 |
|
|
|
930,238 |
|
| Oriflame Investment Holding PLC
5.125%,
05/04/2026(b) |
|
|
|
|
347 |
|
|
|
125,515 |
|
| Performance Food Group, Inc.
4.25%,
08/01/2029(b) |
|
|
|
|
187 |
|
|
|
161,506 |
|
| Perrigo Finance Unlimited Co.
4.65%,
06/15/2030(a) |
|
|
|
|
691 |
|
|
|
589,617 |
|
| Post Holdings, Inc.
4.50%, 09/15/2031(b) |
|
|
|
|
1,564 |
|
|
|
1,302,438 |
|
| 4.625%, 04/15/2030(b) |
|
|
|
|
821 |
|
|
|
703,211 |
|
| 5.50%, 12/15/2029(b) |
|
|
|
|
529 |
|
|
|
479,399 |
|
| Prime Healthcare Services, Inc.
7.25%,
11/01/2025(b) |
|
|
|
|
225 |
|
|
|
207,644 |
|
| Primo Water Holdings, Inc.
4.375%,
04/30/2029(b) |
|
|
|
|
1,227 |
|
|
|
1,048,795 |
|
| RegionalCare Hospital Partners Holdings, Inc./LifePoint Health, Inc.
9.75%, 12/01/2026(b) |
|
|
|
|
775 |
|
|
|
751,903 |
|
| RP Escrow Issuer LLC
5.25%, 12/15/2025(b) |
|
|
|
|
471 |
|
|
|
346,119 |
|
| Simmons Foods Inc/Simmons Prepared Foods Inc/Simmons Pet Food Inc/Simmons Feed
4.625%, 03/01/2029(b) |
|
|
|
|
27 |
|
|
|
22,158 |
|
| Spectrum Brands, Inc.
3.875%,
03/15/2031(b) |
|
|
|
|
2,079 |
|
|
|
1,685,013 |
|
| 4.00%, 10/01/2026(b) |
|
EUR |
|
|
530 |
|
|
|
537,744 |
|
| Tempur Sealy International, Inc.
3.875%,
10/15/2031(b) |
|
U.S.$ |
|
|
473 |
|
|
|
364,568 |
|
| Tenet Healthcare Corp.
4.375%, 01/15/2030 |
|
|
|
|
2,307 |
|
|
|
1,987,070 |
|
| 6.125%, 10/01/2028 |
|
|
|
|
648 |
|
|
|
608,135 |
|
| 6.125%, 06/15/2030 |
|
|
|
|
1,017 |
|
|
|
955,341 |
|
| Triton Water Holdings, Inc.
6.25%,
04/01/2029(b) |
|
|
|
|
884 |
|
|
|
723,246 |
|
| United Natural Foods, Inc.
6.75%,
10/15/2028(b) |
|
|
|
|
187 |
|
|
|
142,627 |
|
|
|
|
|
|
| abfunds.com |
|
ALLIANCEBERNSTEIN GLOBAL HIGH INCOME FUND | 27 |
PORTFOLIO OF INVESTMENTS (continued)
|
|
|
|
|
|
|
|
|
|
|
|
|
| |
|
|
|
|
Principal
Amount
(000) |
|
|
U.S. $ Value |
|
| |
|
| US Acute Care Solutions LLC
6.375%,
03/01/2026(b) |
|
|
U.S.$ |
|
|
|
3,192 |
|
|
$
|
2,745,363 |
|
| US Foods, Inc.
7.25%, 01/15/2032(b) |
|
|
|
|
|
|
77 |
|
|
|
76,922 |
|
| Vector Group Ltd.
5.75%, 02/01/2029(b) |
|
|
|
|
|
|
213 |
|
|
|
180,938 |
|
| 10.50%, 11/01/2026(b) |
|
|
|
|
|
|
188 |
|
|
|
188,284 |
|
| Vista Outdoor, Inc.
4.50%, 03/15/2029(b) |
|
|
|
|
|
|
388 |
|
|
|
324,702 |
|
|
|
|
|
|
|
|
|
|
|
|
|
|
|
|
|
|
|
|
|
|
|
|
|
61,105,240 |
|
|
|
|
|
|
|
|
|
|
|
|
|
|
| Energy – 4.6% |
|
|
|
|
|
|
|
|
|
|
|
|
| Ascent Resources Utica Holdings LLC/ARU Finance Corp.
7.00%, 11/01/2026(b) |
|
|
|
|
|
|
3 |
|
|
|
2,933 |
|
| Berry Petroleum Co., LLC
7.00%,
02/15/2026(b) |
|
|
|
|
|
|
245 |
|
|
|
234,479 |
|
| Blue Racer Midstream LLC/Blue Racer Finance Corp.
7.625%, 12/15/2025(b) |
|
|
|
|
|
|
421 |
|
|
|
422,403 |
|
| Buckeye Partners LP
3.95%, 12/01/2026 |
|
|
|
|
|
|
6 |
|
|
|
5,394 |
|
| California Resources Corp.
7.125%,
02/01/2026(b) |
|
|
|
|
|
|
333 |
|
|
|
335,158 |
|
| Callon Petroleum Co.
7.50%, 06/15/2030(b) |
|
|
|
|
|
|
1,004 |
|
|
|
973,467 |
|
| Calumet Specialty Products Partners LP/Calumet Finance Corp.
11.00%, 04/15/2025(b) |
|
|
|
|
|
|
16 |
|
|
|
16,294 |
|
| CGG SA
8.75%, 04/01/2027(b) |
|
|
|
|
|
|
422 |
|
|
|
376,273 |
|
| Chesapeake Energy Corp.
5.50%,
02/01/2026(b) |
|
|
|
|
|
|
432 |
|
|
|
418,566 |
|
| CITGO Petroleum Corp.
6.375%,
06/15/2026(b) |
|
|
|
|
|
|
471 |
|
|
|
464,538 |
|
| 7.00%, 06/15/2025(b) |
|
|
|
|
|
|
1,781 |
|
|
|
1,754,702 |
|
| 8.375%, 01/15/2029(b) |
|
|
|
|
|
|
844 |
|
|
|
842,945 |
|
| Civitas Resources, Inc.
5.00%,
10/15/2026(b) |
|
|
|
|
|
|
682 |
|
|
|
639,600 |
|
| 8.375%, 07/01/2028(b) |
|
|
|
|
|
|
1,587 |
|
|
|
1,614,595 |
|
| 8.75%, 07/01/2031(b) |
|
|
|
|
|
|
1,067 |
|
|
|
1,092,221 |
|
| CNX Resources Corp. |
|
|
|
|
|
|
|
|
|
|
|
|
| 6.00%, 01/15/2029(b) |
|
|
|
|
|
|
625 |
|
|
|
583,062 |
|
| 7.375%, 01/15/2031(b) |
|
|
|
|
|
|
7 |
|
|
|
6,866 |
|
| Comstock Resources, Inc.
5.875%,
01/15/2030(b) |
|
|
|
|
|
|
30 |
|
|
|
25,939 |
|
| 6.75%, 03/01/2029(b) |
|
|
|
|
|
|
294 |
|
|
|
270,519 |
|
|
|
|
|
|
| 28 | ALLIANCEBERNSTEIN
GLOBAL HIGH INCOME FUND |
|
abfunds.com |
PORTFOLIO OF INVESTMENTS (continued)
|
|
|
|
|
|
|
|
|
|
|
| |
|
|
|
Principal
Amount
(000) |
|
|
U.S. $ Value |
|
| |
|
| Crescent Energy Finance LLC
7.25%,
05/01/2026(b) |
|
U.S.$ |
|
|
832 |
|
|
$
|
815,416 |
|
| 9.25%, 02/15/2028(b) |
|
|
|
|
364 |
|
|
|
371,621 |
|
| CVR Energy, Inc.
5.25%, 02/15/2025(b) |
|
|
|
|
223 |
|
|
|
217,372 |
|
| Earthstone Energy Holdings LLC
9.875%,
07/15/2031(b) |
|
|
|
|
116 |
|
|
|
126,645 |
|
| Encino Acquisition Partners Holdings LLC
8.50%,
05/01/2028(b) |
|
|
|
|
1,676 |
|
|
|
1,610,559 |
|
| Enerflex Ltd.
9.00%, 10/15/2027(b) |
|
|
|
|
337 |
|
|
|
332,852 |
|
| EnLink Midstream Partners LP
Series C
9.78% (SOFR + 4.37%), 10/30/2023(j)(l) |
|
|
|
|
2,734 |
|
|
|
2,472,401 |
|
| EQM Midstream Partners LP
4.50%,
01/15/2029(b) |
|
|
|
|
811 |
|
|
|
722,044 |
|
| 4.75%, 01/15/2031(b) |
|
|
|
|
859 |
|
|
|
739,392 |
|
| FTAI Infra Escrow Holdings LLC
10.50%,
06/01/2027(b) |
|
|
|
|
336 |
|
|
|
334,267 |
|
| Genesis Energy LP/Genesis Energy Finance Corp.
6.25%, 05/15/2026 |
|
|
|
|
92 |
|
|
|
88,312 |
|
| 6.50%, 10/01/2025 |
|
|
|
|
411 |
|
|
|
404,277 |
|
| 7.75%, 02/01/2028 |
|
|
|
|
440 |
|
|
|
416,607 |
|
| 8.00%, 01/15/2027 |
|
|
|
|
522 |
|
|
|
503,255 |
|
| Global Partners LP/GLP Finance Corp.
6.875%, 01/15/2029 |
|
|
|
|
439 |
|
|
|
408,250 |
|
| 7.00%, 08/01/2027 |
|
|
|
|
403 |
|
|
|
393,142 |
|
| Gulfport Energy Corp.
6.00%,
10/15/2024(e)(k) |
|
|
|
|
589 |
|
|
|
371 |
|
| 6.375%, 05/15/2025(e)(k) |
|
|
|
|
1,547 |
|
|
|
975 |
|
| 6.375%, 01/15/2026(e)(k) |
|
|
|
|
1,710 |
|
|
|
1,077 |
|
| 6.625%, 05/01/2023(d)(e) |
|
|
|
|
161 |
|
|
|
101 |
|
| 8.00%, 05/17/2026(b) |
|
|
|
|
610 |
|
|
|
611,110 |
|
| Harbour Energy PLC
5.50%, 10/15/2026(b) |
|
|
|
|
200 |
|
|
|
187,515 |
|
| Hess Midstream Operations LP
5.625%,
02/15/2026(b) |
|
|
|
|
481 |
|
|
|
464,688 |
|
| Hilcorp Energy I LP/Hilcorp Finance Co.
5.75%,
02/01/2029(b) |
|
|
|
|
233 |
|
|
|
210,769 |
|
| 6.00%, 02/01/2031(b) |
|
|
|
|
340 |
|
|
|
299,092 |
|
| 6.25%, 04/15/2032(b) |
|
|
|
|
96 |
|
|
|
85,212 |
|
| Howard Midstream Energy Partners LLC
8.875%,
07/15/2028(b) |
|
|
|
|
627 |
|
|
|
632,897 |
|
| Ithaca Energy North Sea PLC
9.00%,
07/15/2026(b) |
|
|
|
|
200 |
|
|
|
194,496 |
|
|
|
|
|
|
| abfunds.com |
|
ALLIANCEBERNSTEIN GLOBAL HIGH INCOME FUND | 29 |
PORTFOLIO OF INVESTMENTS (continued)
|
|
|
|
|
|
|
|
|
|
|
| |
|
|
|
Principal
Amount
(000) |
|
|
U.S. $ Value |
|
| |
|
| ITT Holdings LLC
6.50%, 08/01/2029(b) |
|
U.S.$ |
|
|
2,299 |
|
|
$
|
1,965,651 |
|
| KCA Deutag UK Finance PLC
9.875%,
12/01/2025(b) |
|
|
|
|
331 |
|
|
|
333,175 |
|
| MEG Energy Corp.
5.875%, 02/01/2029(b) |
|
|
|
|
231 |
|
|
|
215,685 |
|
| Moss Creek Resources Holdings, Inc.
7.50%,
01/15/2026(b) |
|
|
|
|
867 |
|
|
|
839,615 |
|
| 10.50%, 05/15/2027(b) |
|
|
|
|
202 |
|
|
|
202,773 |
|
| Nabors Industries Ltd.
7.25%,
01/15/2026(b) |
|
|
|
|
403 |
|
|
|
388,152 |
|
| 7.50%, 01/15/2028(b) |
|
|
|
|
2,085 |
|
|
|
1,925,059 |
|
| Nabors Industries, Inc.
7.375%,
05/15/2027(b) |
|
|
|
|
319 |
|
|
|
309,429 |
|
| New Fortress Energy, Inc.
6.75%,
09/15/2025(b) |
|
|
|
|
1,126 |
|
|
|
1,075,356 |
|
| NGL Energy Operating LLC/NGL Energy Finance Corp.
7.50%, 02/01/2026(b) |
|
|
|
|
1,683 |
|
|
|
1,663,700 |
|
| NuStar Logistics LP
6.375%, 10/01/2030 |
|
|
|
|
225 |
|
|
|
213,245 |
|
| Oceaneering International, Inc.
6.00%,
02/01/2028(b) |
|
|
|
|
85 |
|
|
|
79,983 |
|
| Parkland Corp.
4.50%, 10/01/2029(b) |
|
|
|
|
220 |
|
|
|
189,081 |
|
| 4.625%, 05/01/2030(b) |
|
|
|
|
220 |
|
|
|
187,781 |
|
| 5.875%, 07/15/2027(b) |
|
|
|
|
31 |
|
|
|
29,437 |
|
| PBF Holding Co., LLC/PBF Finance Corp.
6.00%, 02/15/2028 |
|
|
|
|
216 |
|
|
|
203,548 |
|
| 7.875%, 09/15/2030(b) |
|
|
|
|
77 |
|
|
|
76,736 |
|
| PDC Energy, Inc.
5.75%, 05/15/2026 |
|
|
|
|
1,351 |
|
|
|
1,347,444 |
|
| Petrofac Ltd.
9.75%, 11/15/2026(b) |
|
|
|
|
200 |
|
|
|
152,507 |
|
| Range Resources Corp.
4.875%, 05/15/2025 |
|
|
|
|
418 |
|
|
|
405,249 |
|
| Rockies Express Pipeline LLC
3.60%,
05/15/2025(b) |
|
|
|
|
442 |
|
|
|
416,760 |
|
| Southwestern Energy Co.
5.375%, 02/01/2029 |
|
|
|
|
187 |
|
|
|
172,128 |
|
| 8.375%, 09/15/2028 |
|
|
|
|
120 |
|
|
|
123,935 |
|
| Strathcona Resources Ltd./Alberta
6.875%,
08/01/2026(b) |
|
|
|
|
357 |
|
|
|
336,566 |
|
| Summit Midstream Holdings LLC/Summit Midstream Finance Corp.
9.00%, 10/15/2026(a)(b) |
|
|
|
|
1,086 |
|
|
|
1,043,630 |
|
|
|
|
|
|
| 30 | ALLIANCEBERNSTEIN
GLOBAL HIGH INCOME FUND |
|
abfunds.com |
PORTFOLIO OF INVESTMENTS (continued)
|
|
|
|
|
|
|
|
|
|
|
|
|
| |
|
|
|
|
Principal
Amount
(000) |
|
|
U.S. $ Value |
|
| |
|
| Sunoco LP/Sunoco Finance Corp.
4.50%, 05/15/2029 |
|
|
U.S.$ |
|
|
|
114 |
|
|
$
|
100,013 |
|
| 5.875%, 03/15/2028 |
|
|
|
|
|
|
774 |
|
|
|
740,655 |
|
| Tallgrass Energy Partners LP/Tallgrass Energy Finance Corp.
6.00%, 12/31/2030(b) |
|
|
|
|
|
|
160 |
|
|
|
141,233 |
|
| 6.00%, 09/01/2031(b) |
|
|
|
|
|
|
72 |
|
|
|
62,710 |
|
| Transocean Aquila Ltd.
8.00%,
09/30/2028(b) |
|
|
|
|
|
|
743 |
|
|
|
743,003 |
|
| Transocean, Inc.
11.50%, 01/30/2027(b) |
|
|
|
|
|
|
211 |
|
|
|
221,233 |
|
| USA Compression Partners LP/USA Compression Finance Corp.
6.875%, 09/01/2027 |
|
|
|
|
|
|
4 |
|
|
|
3,865 |
|
| Venture Global Calcasieu Pass LLC
4.125%,
08/15/2031(b) |
|
|
|
|
|
|
890 |
|
|
|
730,475 |
|
| Venture Global LNG, Inc.
8.125%,
06/01/2028(b) |
|
|
|
|
|
|
1,108 |
|
|
|
1,097,219 |
|
| 8.375%, 06/01/2031(b) |
|
|
|
|
|
|
1,107 |
|
|
|
1,091,333 |
|
| Weatherford International Ltd.
8.625%,
04/30/2030(b) |
|
|
|
|
|
|
175 |
|
|
|
176,118 |
|
|
|
|
|
|
|
|
|
|
|
|
|
|
|
|
|
|
|
|
|
|
|
|
|
41,729,151 |
|
|
|
|
|
|
|
|
|
|
|
|
|
|
| Other Industrial – 0.2% |
|
| AECOM
5.125%, 03/15/2027 |
|
|
|
|
|
|
374 |
|
|
|
353,453 |
|
| American Builders & Contractors Supply Co., Inc.
4.00%, 01/15/2028(b) |
|
|
|
|
|
|
100 |
|
|
|
88,634 |
|
| Grand Canyon University
4.125%, 10/01/2024 |
|
|
|
|
|
|
223 |
|
|
|
212,914 |
|
| Ritchie Bros Holdings, Inc.
6.75%,
03/15/2028(b) |
|
|
|
|
|
|
768 |
|
|
|
766,101 |
|
| 7.75%, 03/15/2031(b) |
|
|
|
|
|
|
703 |
|
|
|
713,625 |
|
|
|
|
|
|
|
|
|
|
|
|
|
|
|
|
|
|
|
|
|
|
|
|
|
2,134,727 |
|
|
|
|
|
|
|
|
|
|
|
|
|
|
| Services – 3.3% |
|
| ADT Security Corp. (The)
4.875%,
07/15/2032(b) |
|
|
|
|
|
|
1,012 |
|
|
|
843,281 |
|
| Allied Universal Holdco LLC/Allied Universal Finance Corp.
6.00%, 06/01/2029(b) |
|
|
|
|
|
|
327 |
|
|
|
245,062 |
|
| 6.625%, 07/15/2026(b) |
|
|
|
|
|
|
312 |
|
|
|
295,906 |
|
| 9.75%, 07/15/2027(b) |
|
|
|
|
|
|
1,601 |
|
|
|
1,431,212 |
|
| Allied Universal Holdco LLC/Allied Universal Finance Corp./Atlas Luxco 4 SARL
3.625%, 06/01/2028(b) |
|
|
EUR |
|
|
|
255 |
|
|
|
221,083 |
|
| 4.625%, 06/01/2028(b) |
|
|
U.S.$ |
|
|
|
1,727 |
|
|
|
1,434,458 |
|
| 4.875%, 06/01/2028(b) |
|
|
GBP |
|
|
|
1,010 |
|
|
|
980,688 |
|
|
|
|
|
|
| abfunds.com |
|
ALLIANCEBERNSTEIN GLOBAL HIGH INCOME FUND | 31 |
PORTFOLIO OF INVESTMENTS (continued)
|
|
|
|
|
|
|
|
|
|
|
| |
|
|
|
Principal
Amount
(000) |
|
|
U.S. $ Value |
|
| |
|
| AMN Healthcare, Inc.
4.625%,
10/01/2027(b) |
|
U.S.$ |
|
|
4 |
|
|
$
|
3,631 |
|
| ANGI Group LLC
3.875%, 08/15/2028(b) |
|
|
|
|
2,420 |
|
|
|
1,893,999 |
|
| APX Group, Inc.
5.75%, 07/15/2029(b) |
|
|
|
|
1,504 |
|
|
|
1,268,907 |
|
| 6.75%, 02/15/2027(b) |
|
|
|
|
676 |
|
|
|
651,105 |
|
| Aramark Services, Inc.
5.00%,
02/01/2028(b) |
|
|
|
|
1,064 |
|
|
|
982,989 |
|
| Block, Inc.
2.75%, 06/01/2026 |
|
|
|
|
623 |
|
|
|
559,650 |
|
| 3.50%, 06/01/2031 |
|
|
|
|
1,474 |
|
|
|
1,158,414 |
|
| Brink’s Co. (The)
4.625%,
10/15/2027(b) |
|
|
|
|
176 |
|
|
|
160,636 |
|
| Cars.com, Inc.
6.375%, 11/01/2028(b) |
|
|
|
|
830 |
|
|
|
754,677 |
|
| CoreLogic, Inc.
4.50%, 05/01/2028(b) |
|
|
|
|
119 |
|
|
|
90,396 |
|
| Garda World Security Corp.
4.625%,
02/15/2027(b) |
|
|
|
|
102 |
|
|
|
93,224 |
|
| 6.00%, 06/01/2029(b) |
|
|
|
|
179 |
|
|
|
146,413 |
|
| 7.75%, 02/15/2028(b) |
|
|
|
|
1,333 |
|
|
|
1,308,510 |
|
| 9.50%, 11/01/2027(b) |
|
|
|
|
479 |
|
|
|
457,606 |
|
| GrubHub Holdings, Inc.
5.50%,
07/01/2027(b) |
|
|
|
|
234 |
|
|
|
181,722 |
|
| IHS Markit Ltd.
4.75%, 08/01/2028 |
|
|
|
|
104 |
|
|
|
98,273 |
|
| ION Trading Technologies SARL
5.75%,
05/15/2028(b) |
|
|
|
|
1,067 |
|
|
|
928,999 |
|
| Korn Ferry
4.625%, 12/15/2027(b) |
|
|
|
|
402 |
|
|
|
369,840 |
|
| Millennium Escrow Corp.
6.625%,
08/01/2026(b) |
|
|
|
|
1,950 |
|
|
|
1,547,495 |
|
| Mobius Merger Sub, Inc.
9.00%,
06/01/2030(b) |
|
|
|
|
367 |
|
|
|
341,225 |
|
| Monitronics International, Inc.
9.125%,
04/01/2020(c)(d)(e)(f) |
|
|
|
|
958 |
|
|
|
– 0 |
– |
| MPH Acquisition Holdings LLC
5.50%,
09/01/2028(b) |
|
|
|
|
1,922 |
|
|
|
1,634,736 |
|
| 5.75%, 11/01/2028(b)(i) |
|
|
|
|
3,593 |
|
|
|
2,692,082 |
|
| Neptune Bidco US, Inc.
9.29%,
04/15/2029(b) |
|
|
|
|
2,563 |
|
|
|
2,322,869 |
|
| Prime Security Services Borrower LLC/Prime Finance, Inc.
3.375%, 08/31/2027(b) |
|
|
|
|
423 |
|
|
|
370,321 |
|
| 5.25%, 04/15/2024(b) |
|
|
|
|
19 |
|
|
|
18,892 |
|
| 6.25%, 01/15/2028(b) |
|
|
|
|
1,515 |
|
|
|
1,402,911 |
|
|
|
|
|
|
| 32 | ALLIANCEBERNSTEIN
GLOBAL HIGH INCOME FUND |
|
abfunds.com |
PORTFOLIO OF INVESTMENTS (continued)
|
|
|
|
|
|
|
|
|
|
|
|
|
| |
|
|
|
|
Principal
Amount
(000) |
|
|
U.S. $ Value |
|
| |
|
| Q-Park Holding I BV
2.00%, 03/01/2027(b) |
|
|
EUR |
|
|
|
579 |
|
|
$
|
527,390 |
|
| Rakuten Group, Inc.
10.25%, 11/30/2024(b) |
|
|
U.S.$ |
|
|
|
402 |
|
|
|
404,096 |
|
| Shutterfly Finance LLC
8.50% (4.25% Cash and 4.25% PIK), 10/01/2027(b)(g) |
|
|
|
|
|
|
58 |
|
|
|
38,558 |
|
| 9.75%, 10/01/2027(b) |
|
|
|
|
|
|
7 |
|
|
|
6,955 |
|
| Sotheby’s
7.375%, 10/15/2027(b) |
|
|
|
|
|
|
212 |
|
|
|
195,269 |
|
| Sotheby’s/Bidfair Holdings, Inc.
5.875%,
06/01/2029(b) |
|
|
|
|
|
|
205 |
|
|
|
164,535 |
|
| TriNet Group, Inc.
3.50%, 03/01/2029(b) |
|
|
|
|
|
|
413 |
|
|
|
347,821 |
|
| Verscend Escrow Corp.
9.75%,
08/15/2026(b) |
|
|
|
|
|
|
551 |
|
|
|
551,046 |
|
| WASH Multifamily Acquisition, Inc.
5.75%,
04/15/2026(b) |
|
|
|
|
|
|
26 |
|
|
|
24,272 |
|
| WW International, Inc.
4.50%,
04/15/2029(b) |
|
|
|
|
|
|
468 |
|
|
|
324,885 |
|
| ZipRecruiter, Inc.
5.00%, 01/15/2030(b) |
|
|
|
|
|
|
25 |
|
|
|
19,762 |
|
|
|
|
|
|
|
|
|
|
|
|
|
|
|
|
|
|
|
|
|
|
|
|
|
29,495,801 |
|
|
|
|
|
|
|
|
|
|
|
|
|
|
| Technology – 2.6% |
|
|
|
|
|
|
|
|
|
|
|
|
| Ahead DB Holdings LLC
6.625%,
05/01/2028(b) |
|
|
|
|
|
|
725 |
|
|
|
614,974 |
|
| AthenaHealth Group, Inc.
6.50%,
02/15/2030(b)(i) |
|
|
|
|
|
|
1,754 |
|
|
|
1,464,747 |
|
| Central Parent, Inc./CDK Global, Inc.
7.25%,
06/15/2029(b) |
|
|
|
|
|
|
33 |
|
|
|
31,985 |
|
| Cloud Software Group, Inc.
6.50%,
03/31/2029(b) |
|
|
|
|
|
|
216 |
|
|
|
189,902 |
|
| CommScope Technologies LLC
5.00%,
03/15/2027(b) |
|
|
|
|
|
|
255 |
|
|
|
147,279 |
|
| CommScope, Inc.
4.75%, 09/01/2029(b) |
|
|
|
|
|
|
637 |
|
|
|
468,916 |
|
| 6.00%, 03/01/2026(b) |
|
|
|
|
|
|
276 |
|
|
|
257,461 |
|
| 8.25%, 03/01/2027(b) |
|
|
|
|
|
|
86 |
|
|
|
56,469 |
|
| Conduent Business Services LLC/Conduent State & Local Solutions, Inc.
6.00%, 11/01/2029(b) |
|
|
|
|
|
|
18 |
|
|
|
15,365 |
|
| Consensus Cloud Solutions, Inc.
6.50%,
10/15/2028(b) |
|
|
|
|
|
|
51 |
|
|
|
43,761 |
|
| CWT Travel Group, Inc.
8.50%,
11/19/2026(b) |
|
|
|
|
|
|
321 |
|
|
|
175,064 |
|
|
|
|
|
|
| abfunds.com |
|
ALLIANCEBERNSTEIN GLOBAL HIGH INCOME FUND | 33 |
PORTFOLIO OF INVESTMENTS (continued)
|
|
|
|
|
|
|
|
|
|
|
| |
|
|
|
Principal
Amount
(000) |
|
|
U.S. $ Value |
|
| |
|
| Entegris Escrow Corp.
5.95%,
06/15/2030(b) |
|
U.S.$ |
|
|
1,146 |
|
|
$
|
1,059,785 |
|
| Fair Isaac Corp.
4.00%, 06/15/2028(b) |
|
|
|
|
407 |
|
|
|
363,690 |
|
| Gen Digital, Inc.
6.75%, 09/30/2027(b) |
|
|
|
|
1,271 |
|
|
|
1,245,289 |
|
| 7.125%, 09/30/2030(b) |
|
|
|
|
586 |
|
|
|
577,865 |
|
| GoTo Group, Inc.
5.50%, 09/01/2027(b) |
|
|
|
|
2,165 |
|
|
|
1,186,322 |
|
| Imola Merger Corp.
4.75%, 05/15/2029(b) |
|
|
|
|
968 |
|
|
|
847,297 |
|
| MicroStrategy, Inc.
6.125%, 06/15/2028(b) |
|
|
|
|
363 |
|
|
|
322,573 |
|
| NCR Corp.
5.125%, 04/15/2029(b) |
|
|
|
|
963 |
|
|
|
849,246 |
|
| 5.75%, 09/01/2027(b) |
|
|
|
|
89 |
|
|
|
89,684 |
|
| ON Semiconductor Corp.
3.875%,
09/01/2028(b) |
|
|
|
|
383 |
|
|
|
338,314 |
|
| Open Text Corp.
3.875%, 02/15/2028(b) |
|
|
|
|
369 |
|
|
|
322,301 |
|
| Playtika Holding Corp.
4.25%,
03/15/2029(b) |
|
|
|
|
1,104 |
|
|
|
924,330 |
|
| Presidio Holdings, Inc.
4.875%,
02/01/2027(b) |
|
|
|
|
98 |
|
|
|
90,578 |
|
| 8.25%, 02/01/2028(b) |
|
|
|
|
1,740 |
|
|
|
1,661,610 |
|
| Rackspace Technology Global, Inc.
3.50%,
02/15/2028(b) |
|
|
|
|
3,885 |
|
|
|
1,818,261 |
|
| Science Applications International Corp.
4.875%, 04/01/2028(b) |
|
|
|
|
105 |
|
|
|
95,344 |
|
| Seagate HDD Cayman
3.375%, 07/15/2031 |
|
|
|
|
45 |
|
|
|
31,487 |
|
| 4.091%, 06/01/2029 |
|
|
|
|
1,214 |
|
|
|
1,046,859 |
|
| 4.125%, 01/15/2031 |
|
|
|
|
38 |
|
|
|
30,200 |
|
| 4.75%, 01/01/2025 |
|
|
|
|
292 |
|
|
|
284,968 |
|
| 5.75%, 12/01/2034 |
|
|
|
|
231 |
|
|
|
195,348 |
|
| 8.25%, 12/15/2029(b) |
|
|
|
|
956 |
|
|
|
980,472 |
|
| 8.50%, 07/15/2031(b) |
|
|
|
|
1,012 |
|
|
|
1,037,125 |
|
| Sensata Technologies BV
5.00%,
10/01/2025(b) |
|
|
|
|
219 |
|
|
|
212,393 |
|
| Sensata Technologies, Inc.
3.75%,
02/15/2031(b) |
|
|
|
|
474 |
|
|
|
383,054 |
|
| TTM Technologies, Inc.
4.00%,
03/01/2029(b) |
|
|
|
|
375 |
|
|
|
313,984 |
|
| Vericast Corp.
11.00%, 09/15/2026(b) |
|
|
|
|
130 |
|
|
|
135,860 |
|
| Veritas US, Inc./Veritas Bermuda Ltd.
7.50%,
09/01/2025(b) |
|
|
|
|
3,229 |
|
|
|
2,701,397 |
|
|
|
|
|
|
| 34 | ALLIANCEBERNSTEIN
GLOBAL HIGH INCOME FUND |
|
abfunds.com |
PORTFOLIO OF INVESTMENTS (continued)
|
|
|
|
|
|
|
|
|
|
|
|
|
| |
|
|
|
|
Principal
Amount
(000) |
|
|
U.S. $ Value |
|
| |
|
| Viasat, Inc.
5.625%, 04/15/2027(b) |
|
|
U.S.$ |
|
|
|
435 |
|
|
$
|
377,120 |
|
| Virtusa Corp.
7.125%, 12/15/2028(b) |
|
|
|
|
|
|
717 |
|
|
|
579,096 |
|
| Xerox Corp.
6.75%, 12/15/2039 |
|
|
|
|
|
|
42 |
|
|
|
31,612 |
|
| Xerox Holdings Corp.
5.50%, 08/15/2028(b) |
|
|
|
|
|
|
442 |
|
|
|
371,198 |
|
|
|
|
|
|
|
|
|
|
|
|
|
|
|
|
|
|
|
|
|
|
|
|
|
23,970,585 |
|
|
|
|
|
|
|
|
|
|
|
|
|
|
| Transportation - Airlines – 0.8% |
|
|
|
|
|
|
|
|
|
|
|
|
| Air Canada
3.875%, 08/15/2026(b) |
|
|
|
|
|
|
417 |
|
|
|
378,595 |
|
| Allegiant Travel Co.
7.25%, 08/15/2027(b) |
|
|
|
|
|
|
127 |
|
|
|
119,432 |
|
| American Airlines, Inc./AAdvantage Loyalty IP Ltd.
5.50%, 04/20/2026(b) |
|
|
|
|
|
|
1,487 |
|
|
|
1,453,936 |
|
| 5.75%, 04/20/2029(b) |
|
|
|
|
|
|
1,125 |
|
|
|
1,045,777 |
|
| Hawaiian Brand Intellectual Property Ltd./HawaiianMiles Loyalty Ltd.
5.75%, 01/20/2026(b) |
|
|
|
|
|
|
2,103 |
|
|
|
1,892,810 |
|
| Spirit Loyalty Cayman Ltd./Spirit IP Cayman Ltd.
8.00%, 09/20/2025(b) |
|
|
|
|
|
|
1,590 |
|
|
|
1,589,701 |
|
| United Airlines, Inc.
4.375%,
04/15/2026(b) |
|
|
|
|
|
|
601 |
|
|
|
556,137 |
|
| VistaJet Malta Finance PLC/Vista Management Holding, Inc.
6.375%, 02/01/2030(b) |
|
|
|
|
|
|
15 |
|
|
|
11,532 |
|
| 7.875%, 05/01/2027(b) |
|
|
|
|
|
|
428 |
|
|
|
368,615 |
|
|
|
|
|
|
|
|
|
|
|
|
|
|
|
|
|
|
|
|
|
|
|
|
|
7,416,535 |
|
|
|
|
|
|
|
|
|
|
|
|
|
|
| Transportation - Services – 0.9% |
|
|
|
|
|
|
|
|
|
|
|
|
| Albion Financing 1 SARL/Aggreko Holdings, Inc.
5.25%, 10/15/2026(b) |
|
|
EUR |
|
|
|
625 |
|
|
|
624,829 |
|
| 6.125%, 10/15/2026(b) |
|
|
U.S.$ |
|
|
|
657 |
|
|
|
621,571 |
|
| Avis Budget Car Rental LLC/Avis Budget Finance, Inc.
4.75%, 04/01/2028(b) |
|
|
|
|
|
|
660 |
|
|
|
578,249 |
|
| 5.375%, 03/01/2029(b) |
|
|
|
|
|
|
434 |
|
|
|
386,080 |
|
| 5.75%, 07/15/2027(b) |
|
|
|
|
|
|
1,031 |
|
|
|
973,039 |
|
| BCP V Modular Services Finance II PLC
4.75%,
11/30/2028(b) |
|
|
EUR |
|
|
|
132 |
|
|
|
116,646 |
|
| BCP V Modular Services Finance PLC
6.75%, 11/30/2029 |
|
|
|
|
|
|
1,214 |
|
|
|
925,351 |
|
|
|
|
|
|
| abfunds.com |
|
ALLIANCEBERNSTEIN GLOBAL HIGH INCOME FUND | 35 |
PORTFOLIO OF INVESTMENTS (continued)
|
|
|
|
|
|
|
|
|
|
|
|
|
| |
|
|
|
|
Principal
Amount
(000) |
|
|
U.S. $ Value |
|
| |
|
| Hertz Corp. (The)
4.625%, 12/01/2026(b) |
|
|
U.S.$ |
|
|
|
1,153 |
|
|
$
|
1,022,075 |
|
| 5.00%, 12/01/2029(b) |
|
|
|
|
|
|
1,308 |
|
|
|
1,025,450 |
|
| Loxam SAS
2.875%, 04/15/2026(b) |
|
|
EUR |
|
|
|
301 |
|
|
|
293,598 |
|
| 4.50%, 02/15/2027(b) |
|
|
|
|
|
|
629 |
|
|
|
628,672 |
|
| Rand Parent LLC
8.50%, 02/15/2030(b) |
|
|
U.S.$ |
|
|
|
372 |
|
|
|
344,045 |
|
| United Rentals North America, Inc.
3.875%, 02/15/2031 |
|
|
|
|
|
|
178 |
|
|
|
148,082 |
|
| 4.00%, 07/15/2030 |
|
|
|
|
|
|
206 |
|
|
|
175,684 |
|
| 4.875%, 01/15/2028 |
|
|
|
|
|
|
112 |
|
|
|
104,834 |
|
| 5.50%, 05/15/2027 |
|
|
|
|
|
|
222 |
|
|
|
215,775 |
|
| Williams Scotsman International, Inc.
4.625%,
08/15/2028(b) |
|
|
|
|
|
|
76 |
|
|
|
68,020 |
|
|
|
|
|
|
|
|
|
|
|
|
|
|
|
|
|
|
|
|
|
|
|
|
|
8,252,000 |
|
|
|
|
|
|
|
|
|
|
|
|
|
|
|
|
|
|
|
|
|
|
|
|
|
429,743,495 |
|
|
|
|
|
|
|
|
|
|
|
|
|
|
| Financial Institutions – 5.0% |
|
|
|
|
|
|
|
|
|
|
|
|
| Banking – 0.1% |
|
|
|
|
|
|
|
|
|
|
|
|
| Ally Financial, Inc.
Series C
4.70%,
05/15/2028(l) |
|
|
|
|
|
|
256 |
|
|
|
158,720 |
|
| Bread Financial Holdings, Inc.
7.00%,
01/15/2026(b) |
|
|
|
|
|
|
1,157 |
|
|
|
1,089,031 |
|
| Freedom Mortgage Corp.
7.625%,
05/01/2026(b) |
|
|
|
|
|
|
35 |
|
|
|
32,623 |
|
| 12.00%, 10/01/2028(b) |
|
|
|
|
|
|
77 |
|
|
|
78,156 |
|
|
|
|
|
|
|
|
|
|
|
|
|
|
|
|
|
|
|
|
|
|
|
|
|
1,358,530 |
|
|
|
|
|
|
|
|
|
|
|
|
|
|
| Brokerage – 0.8% |
|
|
|
|
|
|
|
|
|
|
|
|
| AG Issuer LLC
6.25%, 03/01/2028(b) |
|
|
|
|
|
|
376 |
|
|
|
351,297 |
|
| AG TTMT Escrow Issuer LLC
8.625%,
09/30/2027(b) |
|
|
|
|
|
|
714 |
|
|
|
719,157 |
|
| Hightower Holding LLC
6.75%,
04/15/2029(b) |
|
|
|
|
|
|
2,936 |
|
|
|
2,522,612 |
|
| NFP Corp.
6.875%, 08/15/2028(b) |
|
|
|
|
|
|
1,494 |
|
|
|
1,280,436 |
|
| 7.50%, 10/01/2030(b) |
|
|
|
|
|
|
1,323 |
|
|
|
1,268,466 |
|
| Osaic Holdings, Inc.
10.75%,
08/01/2027(b) |
|
|
|
|
|
|
1,425 |
|
|
|
1,432,069 |
|
|
|
|
|
|
|
|
|
|
|
|
|
|
|
|
|
|
|
|
|
|
|
|
|
7,574,037 |
|
|
|
|
|
|
|
|
|
|
|
|
|
|
| Finance – 2.0% |
|
|
|
|
|
|
|
|
|
|
|
|
| Aircastle Ltd.
5.25%, 06/15/2026(b)(l) |
|
|
|
|
|
|
1,374 |
|
|
|
1,085,009 |
|
| Castlelake Aviation Finance DAC
5.00%,
04/15/2027(b) |
|
|
|
|
|
|
1,036 |
|
|
|
945,432 |
|
|
|
|
|
|
| 36 | ALLIANCEBERNSTEIN
GLOBAL HIGH INCOME FUND |
|
abfunds.com |
PORTFOLIO OF INVESTMENTS (continued)
|
|
|
|
|
|
|
|
|
|
|
|
|
| |
|
|
|
|
Principal
Amount
(000) |
|
|
U.S. $ Value |
|
| |
|
| CNG Holdings, Inc.
14.50%, 06/30/2026(b) |
|
|
U.S.$ |
|
|
|
794 |
|
|
$
|
678,870 |
|
| Compass Group Diversified Holdings LLC
5.25%,
04/15/2029(b) |
|
|
|
|
|
|
1,277 |
|
|
|
1,116,523 |
|
| Curo Group Holdings Corp.
7.50%,
08/01/2028(b) |
|
|
|
|
|
|
3,647 |
|
|
|
1,457,379 |
|
| Enova International, Inc.
8.50%,
09/01/2024(b) |
|
|
|
|
|
|
343 |
|
|
|
341,204 |
|
| 8.50%, 09/15/2025(b) |
|
|
|
|
|
|
1,996 |
|
|
|
1,951,019 |
|
| GGAM Finance Ltd.
7.75%, 05/15/2026(b) |
|
|
|
|
|
|
662 |
|
|
|
656,588 |
|
| 8.00%, 06/15/2028(b) |
|
|
|
|
|
|
993 |
|
|
|
993,138 |
|
| Jefferies Finance LLC/JFIN Co-Issuer Corp.
5.00%, 08/15/2028(b) |
|
|
|
|
|
|
2,234 |
|
|
|
1,880,548 |
|
| LD Holdings Group LLC
6.125%,
04/01/2028(b) |
|
|
|
|
|
|
421 |
|
|
|
265,217 |
|
| 6.50%, 11/01/2025(b) |
|
|
|
|
|
|
85 |
|
|
|
70,547 |
|
| Midcap Financial Issuer Trust
5.625%,
01/15/2030(b) |
|
|
|
|
|
|
216 |
|
|
|
168,398 |
|
| 6.50%, 05/01/2028(b) |
|
|
|
|
|
|
231 |
|
|
|
200,392 |
|
| Navient Corp.
4.875%, 03/15/2028 |
|
|
|
|
|
|
1,706 |
|
|
|
1,450,100 |
|
| 5.00%, 03/15/2027 |
|
|
|
|
|
|
792 |
|
|
|
711,910 |
|
| 5.50%, 03/15/2029 |
|
|
|
|
|
|
79 |
|
|
|
66,366 |
|
| 5.625%, 08/01/2033 |
|
|
|
|
|
|
40 |
|
|
|
29,248 |
|
| 6.75%, 06/25/2025 |
|
|
|
|
|
|
954 |
|
|
|
939,579 |
|
| 6.75%, 06/15/2026 |
|
|
|
|
|
|
835 |
|
|
|
807,203 |
|
| OneMain Finance Corp.
3.50%, 01/15/2027 |
|
|
|
|
|
|
174 |
|
|
|
149,000 |
|
| 7.125%, 03/15/2026 |
|
|
|
|
|
|
180 |
|
|
|
176,011 |
|
| 9.00%, 01/15/2029 |
|
|
|
|
|
|
76 |
|
|
|
75,698 |
|
| PennyMac Financial Services, Inc.
4.25%,
02/15/2029(b) |
|
|
|
|
|
|
174 |
|
|
|
140,630 |
|
| 5.75%, 09/15/2031(b) |
|
|
|
|
|
|
67 |
|
|
|
54,684 |
|
| SLM Corp.
3.125%, 11/02/2026 |
|
|
|
|
|
|
188 |
|
|
|
163,457 |
|
| Synchrony Financial
7.25%, 02/02/2033 |
|
|
|
|
|
|
1,795 |
|
|
|
1,581,220 |
|
|
|
|
|
|
|
|
|
|
|
|
|
|
|
|
|
|
|
|
|
|
|
|
|
18,155,370 |
|
|
|
|
|
|
|
|
|
|
|
|
|
|
| Insurance – 0.5% |
|
|
|
|
|
|
|
|
|
|
|
|
| Acrisure LLC/Acrisure Finance, Inc.
4.25%,
02/15/2029(b) |
|
|
|
|
|
|
53 |
|
|
|
44,417 |
|
| 10.125%, 08/01/2026(b) |
|
|
|
|
|
|
559 |
|
|
|
571,550 |
|
| Ardonagh Midco 2 PLC
11.50% (11.50% Cash or 12.75% PIK), 01/15/2027(b)(g)(i) |
|
|
|
|
|
|
1,926 |
|
|
|
1,885,178 |
|
|
|
|
|
|
| abfunds.com |
|
ALLIANCEBERNSTEIN GLOBAL HIGH INCOME FUND | 37 |
PORTFOLIO OF INVESTMENTS (continued)
|
|
|
|
|
|
|
|
|
|
|
|
|
| |
|
|
|
|
Principal
Amount
(000) |
|
|
U.S. $ Value |
|
| |
|
| HUB International Ltd.
7.00%,
05/01/2026(b) |
|
|
U.S.$ |
|
|
|
292 |
|
|
$
|
291,350 |
|
| 7.25%, 06/15/2030(b) |
|
|
|
|
|
|
1,476 |
|
|
|
1,468,951 |
|
|
|
|
|
|
|
|
|
|
|
|
|
|
|
|
|
|
|
|
|
|
|
|
|
4,261,446 |
|
|
|
|
|
|
|
|
|
|
|
|
|
|
| Other Finance – 0.5% |
|
|
|
|
|
|
|
|
|
|
|
|
| Armor Holdco, Inc.
8.50%, 11/15/2029(b) |
|
|
|
|
|
|
1,967 |
|
|
|
1,709,301 |
|
| Coinbase Global, Inc.
3.375%,
10/01/2028(b) |
|
|
|
|
|
|
1,281 |
|
|
|
922,681 |
|
| 3.625%, 10/01/2031(b) |
|
|
|
|
|
|
818 |
|
|
|
544,608 |
|
| CURO Group Holdings Corp.
18.00%,
08/02/2027(c) |
|
|
|
|
|
|
1,526 |
|
|
|
1,464,919 |
|
|
|
|
|
|
|
|
|
|
|
|
|
|
|
|
|
|
|
|
|
|
|
|
|
4,641,509 |
|
|
|
|
|
|
|
|
|
|
|
|
|
|
| REITs – 1.1% |
|
|
|
|
|
|
|
|
|
|
|
|
| Aedas Homes Opco SLU
Series 2022-1A
4.00%,
08/15/2026 |
|
|
EUR |
|
|
|
1,580 |
|
|
|
1,549,936 |
|
| Agps Bondco PLC
5.50%, 11/13/2026(a)(b) |
|
|
|
|
|
|
200 |
|
|
|
84,943 |
|
| Anywhere Real Estate Group LLC/Anywhere Co-Issuer Corp.
7.00%,
04/15/2030(b) |
|
|
U.S.$ |
|
|
|
134 |
|
|
|
120,574 |
|
| Apollo Commercial Real Estate Finance, Inc.
4.625%, 06/15/2029(b) |
|
|
|
|
|
|
16 |
|
|
|
12,087 |
|
| Brookfield Property REIT, Inc./BPR Cumulus LLC/BPR Nimbus LLC/GGSI Sellco LL
4.50%, 04/01/2027(b) |
|
|
|
|
|
|
2,519 |
|
|
|
2,100,133 |
|
| 5.75%, 05/15/2026(b) |
|
|
|
|
|
|
350 |
|
|
|
321,048 |
|
| Diversified Healthcare Trust
4.75%, 02/15/2028 |
|
|
|
|
|
|
23 |
|
|
|
16,701 |
|
| Howard Hughes Corp. (The)
4.125%,
02/01/2029(b) |
|
|
|
|
|
|
128 |
|
|
|
102,354 |
|
| Hunt Cos., Inc.
5.25%, 04/15/2029(b) |
|
|
|
|
|
|
32 |
|
|
|
25,120 |
|
| Iron Mountain, Inc.
5.25%, 03/15/2028(b) |
|
|
|
|
|
|
1,943 |
|
|
|
1,787,827 |
|
| 5.625%, 07/15/2032(b) |
|
|
|
|
|
|
169 |
|
|
|
145,725 |
|
| Ladder Capital Finance Holdings LLLP/Ladder Capital Finance Corp.
4.75%, 06/15/2029(b) |
|
|
|
|
|
|
99 |
|
|
|
80,099 |
|
| MPT Operating Partnership LP/MPT Finance Corp.
5.00%, 10/15/2027 |
|
|
|
|
|
|
257 |
|
|
|
199,026 |
|
|
|
|
|
|
| 38 | ALLIANCEBERNSTEIN
GLOBAL HIGH INCOME FUND |
|
abfunds.com |
PORTFOLIO OF INVESTMENTS (continued)
|
|
|
|
|
|
|
|
|
|
|
|
|
| |
|
|
|
|
Principal
Amount
(000) |
|
|
U.S. $ Value |
|
| |
|
| Office Properties Income Trust
3.45%, 10/15/2031 |
|
|
U.S.$ |
|
|
|
863 |
|
|
$
|
437,027 |
|
| Realogy Group LLC/Realogy Co-Issuer Corp.
5.75%, 01/15/2029(b) |
|
|
|
|
|
|
9 |
|
|
|
6,494 |
|
| Rithm Capital Corp.
6.25%, 10/15/2025(b) |
|
|
|
|
|
|
333 |
|
|
|
315,769 |
|
| Service Properties Trust
4.75%, 10/01/2026 |
|
|
|
|
|
|
89 |
|
|
|
76,417 |
|
| 4.95%, 10/01/2029 |
|
|
|
|
|
|
85 |
|
|
|
64,292 |
|
| Uniti Group LP/Uniti Group Finance, Inc./CSL Capital LLC
10.50%, 02/15/2028(b) |
|
|
|
|
|
|
43 |
|
|
|
42,143 |
|
| Via Celere Desarrollos Inmobiliarios SA
Series 2020-1A
5.25%, 04/01/2026 |
|
|
EUR |
|
|
|
771 |
|
|
|
766,327 |
|
| Vivion Investments SARL
3.00%,
08/08/2024(b) |
|
|
|
|
|
|
1,000 |
|
|
|
962,850 |
|
| Series E
7.90%, 02/28/2029(a)(b)(g) |
|
|
|
|
|
|
400 |
|
|
|
312,940 |
|
|
|
|
|
|
|
|
|
|
|
|
|
|
|
|
|
|
|
|
|
|
|
|
|
9,529,832 |
|
|
|
|
|
|
|
|
|
|
|
|
|
|
|
|
|
|
|
|
|
|
|
|
|
45,520,724 |
|
|
|
|
|
|
|
|
|
|
|
|
|
|
| Utility – 0.9% |
|
|
|
|
|
|
|
|
|
|
|
|
| Electric – 0.6% |
|
|
|
|
|
|
|
|
|
|
|
|
| Algonquin Power & Utilities Corp.
4.75%, 01/18/2082 |
|
|
U.S.$ |
|
|
|
184 |
|
|
|
149,943 |
|
| Calpine Corp.
5.125%, 03/15/2028(b) |
|
|
|
|
|
|
304 |
|
|
|
270,720 |
|
| ContourGlobal Power Holdings SA
3.125%,
01/01/2028(b) |
|
|
EUR |
|
|
|
167 |
|
|
|
144,793 |
|
| NextEra Energy Operating Partners LP
3.875%,
10/15/2026(b) |
|
|
U.S.$ |
|
|
|
27 |
|
|
|
24,464 |
|
| 4.50%, 09/15/2027(b) |
|
|
|
|
|
|
108 |
|
|
|
97,811 |
|
| NRG Energy, Inc.
3.375%, 02/15/2029(b) |
|
|
|
|
|
|
158 |
|
|
|
127,522 |
|
| 3.875%, 02/15/2032(b) |
|
|
|
|
|
|
2,090 |
|
|
|
1,567,548 |
|
| 6.625%, 01/15/2027 |
|
|
|
|
|
|
7 |
|
|
|
6,858 |
|
| 10.25%, 03/15/2028(b)(l) |
|
|
|
|
|
|
842 |
|
|
|
824,563 |
|
| PG&E Corp.
5.25%, 07/01/2030 |
|
|
|
|
|
|
163 |
|
|
|
141,884 |
|
| Vistra Corp.
7.00%, 12/15/2026(b)(l) |
|
|
|
|
|
|
835 |
|
|
|
768,059 |
|
| 8.00%, 10/15/2026(b)(l) |
|
|
|
|
|
|
1,003 |
|
|
|
962,569 |
|
| Vistra Operations Co., LLC
5.50%,
09/01/2026(b) |
|
|
|
|
|
|
445 |
|
|
|
423,845 |
|
| 5.625%, 02/15/2027(b) |
|
|
|
|
|
|
163 |
|
|
|
154,422 |
|
|
|
|
|
|
| abfunds.com |
|
ALLIANCEBERNSTEIN GLOBAL HIGH INCOME FUND | 39 |
PORTFOLIO OF INVESTMENTS (continued)
|
|
|
|
|
|
|
|
|
|
|
|
|
| |
|
|
|
|
Principal
Amount
(000) |
|
|
U.S. $ Value |
|
| |
|
| 7.75%, 10/15/2031(b) |
|
|
U.S.$ |
|
|
|
77 |
|
|
$
|
75,858 |
|
|
|
|
|
|
|
|
|
|
|
|
|
|
|
|
|
|
|
|
|
|
|
|
|
5,740,859 |
|
|
|
|
|
|
|
|
|
|
|
|
|
|
| Natural Gas – 0.2% |
|
|
|
|
|
|
|
|
|
|
|
|
| AmeriGas Partners LP/AmeriGas Finance Corp.
5.75%, 05/20/2027 |
|
|
|
|
|
|
230 |
|
|
|
215,592 |
|
| 5.875%, 08/20/2026 |
|
|
|
|
|
|
140 |
|
|
|
134,494 |
|
| UGI International LLC
2.50%,
12/01/2029(b) |
|
|
EUR |
|
|
|
1,169 |
|
|
|
1,021,951 |
|
|
|
|
|
|
|
|
|
|
|
|
|
|
|
|
|
|
|
|
|
|
|
|
|
1,372,037 |
|
|
|
|
|
|
|
|
|
|
|
|
|
|
| Other Utility – 0.1% |
|
|
|
|
|
|
|
|
|
|
|
|
| Solaris Midstream Holdings LLC
7.625%,
04/01/2026(b) |
|
|
U.S.$ |
|
|
|
1,376 |
|
|
|
1,328,214 |
|
|
|
|
|
|
|
|
|
|
|
|
|
|
|
|
|
|
|
|
|
|
|
|
|
8,441,110 |
|
|
|
|
|
|
|
|
|
|
|
|
|
|
| Total Corporates – Non-Investment Grade
(cost
$542,264,433) |
|
|
|
|
|
|
|
|
|
|
483,705,329 |
|
|
|
|
|
|
|
|
|
|
|
|
|
|
|
|
|
|
|
|
|
|
|
|
|
|
|
| CORPORATES - INVESTMENT GRADE – 19.7% |
|
|
|
|
|
|
|
|
|
|
|
|
| Industrial – 10.4% |
|
|
|
|
|
|
|
|
|
|
|
|
| Basic – 1.0% |
|
|
|
|
|
|
|
|
|
|
|
|
| Braskem Netherlands Finance BV
4.50%,
01/31/2030(b) |
|
|
|
|
|
|
1,515 |
|
|
|
1,227,529 |
|
| 8.50%, 01/12/2031(b) |
|
|
|
|
|
|
915 |
|
|
|
908,250 |
|
| Celanese US Holdings LLC
6.05%, 03/15/2025 |
|
|
|
|
|
|
170 |
|
|
|
169,345 |
|
| 6.35%, 11/15/2028 |
|
|
|
|
|
|
389 |
|
|
|
384,020 |
|
| 6.55%, 11/15/2030 |
|
|
|
|
|
|
940 |
|
|
|
919,726 |
|
| Freeport Indonesia PT
4.763%,
04/14/2027(b) |
|
|
|
|
|
|
281 |
|
|
|
266,571 |
|
| Georgia-Pacific LLC
8.875%, 05/15/2031 |
|
|
|
|
|
|
1 |
|
|
|
1,189 |
|
| Glencore Funding LLC
6.50%, 10/06/2033(b) |
|
|
|
|
|
|
1,173 |
|
|
|
1,170,745 |
|
| Industrias Penoles SAB de CV
5.65%,
09/12/2049(b) |
|
|
|
|
|
|
386 |
|
|
|
321,345 |
|
| INEOS Finance PLC
3.375%, 03/31/2026(b) |
|
|
EUR |
|
|
|
351 |
|
|
|
348,980 |
|
| MEGlobal Canada ULC
5.875%, 05/18/2030(b) |
|
|
U.S.$ |
|
|
|
343 |
|
|
|
339,556 |
|
| Nexa Resources SA
6.50%, 01/18/2028(b) |
|
|
|
|
|
|
773 |
|
|
|
731,884 |
|
| Olin Corp.
5.00%, 02/01/2030 |
|
|
|
|
|
|
85 |
|
|
|
75,572 |
|
| 5.625%, 08/01/2029 |
|
|
|
|
|
|
735 |
|
|
|
691,545 |
|
|
|
|
|
|
| 40 | ALLIANCEBERNSTEIN
GLOBAL HIGH INCOME FUND |
|
abfunds.com |
PORTFOLIO OF INVESTMENTS (continued)
|
|
|
|
|
|
|
|
|
|
|
|
|
| |
|
|
|
|
Principal
Amount
(000) |
|
|
U.S. $ Value |
|
| |
|
| Smurfit Kappa Treasury Funding DAC
7.50%, 11/20/2025 |
|
|
U.S.$ |
|
|
|
238 |
|
|
$
|
243,633 |
|
| Suzano Austria GmbH
3.75%, 01/15/2031 |
|
|
|
|
|
|
262 |
|
|
|
215,822 |
|
| 5.00%, 01/15/2030 |
|
|
|
|
|
|
218 |
|
|
|
197,800 |
|
| Series DM3N
3.125%, 01/15/2032 |
|
|
|
|
|
|
331 |
|
|
|
253,711 |
|
| UPL Corp., Ltd.
4.50%, 03/08/2028(b) |
|
|
|
|
|
|
272 |
|
|
|
234,894 |
|
| 4.625%, 06/16/2030(b) |
|
|
|
|
|
|
673 |
|
|
|
538,400 |
|
|
|
|
|
|
|
|
|
|
|
|
|
|
|
|
|
|
|
|
|
|
|
|
|
9,240,517 |
|
|
|
|
|
|
|
|
|
|
|
|
|
|
| Capital Goods – 0.1% |
|
|
|
|
|
|
|
|
|
|
|
|
| Howmet Aerospace, Inc.
3.00%, 01/15/2029 |
|
|
|
|
|
|
22 |
|
|
|
18,630 |
|
| 5.90%, 02/01/2027 |
|
|
|
|
|
|
119 |
|
|
|
116,928 |
|
| 6.875%, 05/01/2025 |
|
|
|
|
|
|
499 |
|
|
|
500,672 |
|
| Regal Rexnord Corp.
6.30%, 02/15/2030(b) |
|
|
|
|
|
|
235 |
|
|
|
227,730 |
|
| 6.40%, 04/15/2033(b) |
|
|
|
|
|
|
277 |
|
|
|
266,659 |
|
| Weir Group PLC (The)
2.20%, 05/13/2026(b) |
|
|
|
|
|
|
200 |
|
|
|
179,797 |
|
|
|
|
|
|
|
|
|
|
|
|
|
|
|
|
|
|
|
|
|
|
|
|
|
1,310,416 |
|
|
|
|
|
|
|
|
|
|
|
|
|
|
| Communications - Media – 0.7% |
|
|
|
|
|
|
|
|
|
|
|
|
| Cox Communications, Inc.
5.70%,
06/15/2033(b) |
|
|
|
|
|
|
442 |
|
|
|
425,287 |
|
| DirecTV Financing LLC/DirecTV Financing Co-Obligor, Inc.
5.875%, 08/15/2027(b) |
|
|
|
|
|
|
2,634 |
|
|
|
2,329,853 |
|
| Discovery Communications LLC
4.125%, 05/15/2029 |
|
|
|
|
|
|
179 |
|
|
|
159,664 |
|
| Prosus NV
3.061%, 07/13/2031(b) |
|
|
|
|
|
|
857 |
|
|
|
636,280 |
|
| 4.027%, 08/03/2050(b) |
|
|
|
|
|
|
331 |
|
|
|
188,703 |
|
| Telecomunicaciones Digitales SA
4.50%,
01/30/2030(b) |
|
|
|
|
|
|
505 |
|
|
|
409,050 |
|
| Warnermedia Holdings, Inc.
3.755%, 03/15/2027 |
|
|
|
|
|
|
745 |
|
|
|
687,678 |
|
| 4.279%, 03/15/2032 |
|
|
|
|
|
|
1,034 |
|
|
|
877,537 |
|
| Weibo Corp.
3.375%, 07/08/2030 |
|
|
|
|
|
|
513 |
|
|
|
398,827 |
|
|
|
|
|
|
|
|
|
|
|
|
|
|
|
|
|
|
|
|
|
|
|
|
|
6,112,879 |
|
|
|
|
|
|
|
|
|
|
|
|
|
|
| Communications - Telecommunications – 0.2% |
|
|
|
|
|
|
|
|
|
|
|
|
| Hughes Satellite Systems Corp.
5.25%, 08/01/2026 |
|
|
|
|
|
|
118 |
|
|
|
106,532 |
|
|
|
|
|
|
| abfunds.com |
|
ALLIANCEBERNSTEIN GLOBAL HIGH INCOME FUND | 41 |
PORTFOLIO OF INVESTMENTS (continued)
|
|
|
|
|
|
|
|
|
|
|
|
|
| |
|
|
|
|
Principal
Amount
(000) |
|
|
U.S. $ Value |
|
| |
|
| Sprint Capital Corp.
8.75%, 03/15/2032 |
|
|
U.S.$ |
|
|
|
666 |
|
|
$
|
771,028 |
|
| Sprint LLC
7.625%, 03/01/2026 |
|
|
|
|
|
|
186 |
|
|
|
191,367 |
|
| Xiaomi Best Time International Ltd.
3.375%,
04/29/2030(b) |
|
|
|
|
|
|
718 |
|
|
|
574,486 |
|
|
|
|
|
|
|
|
|
|
|
|
|
|
|
|
|
|
|
|
|
|
|
|
|
1,643,413 |
|
|
|
|
|
|
|
|
|
|
|
|
|
|
| Consumer Cyclical - Automotive – 3.1% |
|
|
|
|
|
|
|
|
|
|
|
|
| Ford Motor Co.
3.25%, 02/12/2032 |
|
|
|
|
|
|
3,020 |
|
|
|
2,322,630 |
|
| 6.10%, 08/19/2032 |
|
|
|
|
|
|
4,493 |
|
|
|
4,233,973 |
|
| Ford Motor Credit Co., LLC
2.70%, 08/10/2026 |
|
|
|
|
|
|
793 |
|
|
|
706,023 |
|
| 4.063%, 11/01/2024 |
|
|
|
|
|
|
469 |
|
|
|
453,842 |
|
| 4.271%, 01/09/2027 |
|
|
|
|
|
|
220 |
|
|
|
203,365 |
|
| 4.687%, 06/09/2025 |
|
|
|
|
|
|
200 |
|
|
|
191,893 |
|
| 4.95%, 05/28/2027 |
|
|
|
|
|
|
1,160 |
|
|
|
1,088,874 |
|
| 6.80%, 05/12/2028 |
|
|
|
|
|
|
2,512 |
|
|
|
2,508,393 |
|
| 7.35%, 11/04/2027 |
|
|
|
|
|
|
4,412 |
|
|
|
4,500,857 |
|
| Series G
4.389%, 01/08/2026 |
|
|
|
|
|
|
200 |
|
|
|
188,780 |
|
| General Motors Co.
5.20%, 04/01/2045 |
|
|
|
|
|
|
19 |
|
|
|
14,790 |
|
| General Motors Financial Co., Inc.
2.70%, 06/10/2031 |
|
|
|
|
|
|
130 |
|
|
|
99,498 |
|
| 5.65%, 01/17/2029 |
|
|
|
|
|
|
30 |
|
|
|
29,062 |
|
| 5.85%, 04/06/2030 |
|
|
|
|
|
|
1,927 |
|
|
|
1,844,770 |
|
| 6.40%, 01/09/2033(i) |
|
|
|
|
|
|
1,708 |
|
|
|
1,664,287 |
|
| Harley-Davidson Financial Services, Inc.
6.50%,
03/10/2028(b) |
|
|
|
|
|
|
3,503 |
|
|
|
3,462,359 |
|
| Hyundai Capital America
6.10%,
09/21/2028(b) |
|
|
|
|
|
|
1,745 |
|
|
|
1,733,354 |
|
| Lear Corp.
3.50%, 05/30/2030 |
|
|
|
|
|
|
3 |
|
|
|
2,548 |
|
| 4.25%, 05/15/2029 |
|
|
|
|
|
|
17 |
|
|
|
15,432 |
|
| Nissan Motor Acceptance Co., LLC
1.85%,
09/16/2026(b) |
|
|
|
|
|
|
310 |
|
|
|
269,656 |
|
| 2.45%, 09/15/2028(b) |
|
|
|
|
|
|
575 |
|
|
|
465,359 |
|
| 2.75%, 03/09/2028(b) |
|
|
|
|
|
|
1,245 |
|
|
|
1,042,273 |
|
| 6.95%, 09/15/2026(b) |
|
|
|
|
|
|
77 |
|
|
|
77,518 |
|
| 7.05%, 09/15/2028(b) |
|
|
|
|
|
|
77 |
|
|
|
76,945 |
|
| Nissan Motor Co., Ltd.
4.345%,
09/17/2027(b) |
|
|
|
|
|
|
1,084 |
|
|
|
989,472 |
|
| 4.81%, 09/17/2030(b) |
|
|
|
|
|
|
233 |
|
|
|
201,726 |
|
|
|
|
|
|
|
|
|
|
|
|
|
|
|
|
|
|
|
|
|
|
|
|
|
28,387,679 |
|
|
|
|
|
|
|
|
|
|
|
|
|
|
|
|
|
|
|
| 42 | ALLIANCEBERNSTEIN
GLOBAL HIGH INCOME FUND |
|
abfunds.com |
PORTFOLIO OF INVESTMENTS (continued)
|
|
|
|
|
|
|
|
|
|
|
|
|
| |
|
|
|
|
Principal
Amount
(000) |
|
|
U.S. $ Value |
|
| |
|
| Consumer Cyclical - Entertainment – 0.2% |
|
|
|
|
|
|
|
|
|
|
|
|
| Mattel, Inc.
3.375%, 04/01/2026(b) |
|
|
U.S.$ |
|
|
|
1,152 |
|
|
$
|
1,066,255 |
|
| 3.75%, 04/01/2029(b) |
|
|
|
|
|
|
383 |
|
|
|
333,305 |
|
| 5.875%, 12/15/2027(b) |
|
|
|
|
|
|
578 |
|
|
|
560,970 |
|
|
|
|
|
|
|
|
|
|
|
|
|
|
|
|
|
|
|
|
|
|
|
|
|
1,960,530 |
|
|
|
|
|
|
|
|
|
|
|
|
|
|
| Consumer Cyclical - Other – 0.9% |
|
|
|
|
|
|
|
|
|
|
|
|
| Genting New York LLC/GENNY Capital, Inc.
3.30%,
02/15/2026(b) |
|
|
|
|
|
|
239 |
|
|
|
213,036 |
|
| International Game Technology PLC
3.50%,
06/15/2026(b) |
|
|
EUR |
|
|
|
214 |
|
|
|
215,859 |
|
| 4.125%, 04/15/2026(b) |
|
|
U.S.$ |
|
|
|
1,760 |
|
|
|
1,653,679 |
|
| Las Vegas Sands Corp.
3.50%, 08/18/2026 |
|
|
|
|
|
|
74 |
|
|
|
67,328 |
|
| MDC Holdings, Inc.
6.00%, 01/15/2043 |
|
|
|
|
|
|
1,881 |
|
|
|
1,575,980 |
|
| Owens Corning
7.00%, 12/01/2036(a) |
|
|
|
|
|
|
777 |
|
|
|
820,723 |
|
| Resorts World Las Vegas LLC/RWLV Capital, Inc.
4.625%, 04/16/2029(b) |
|
|
|
|
|
|
1,400 |
|
|
|
1,119,749 |
|
| 4.625%, 04/06/2031(b) |
|
|
|
|
|
|
1,100 |
|
|
|
821,051 |
|
| 8.45%, 07/27/2030(b) |
|
|
|
|
|
|
200 |
|
|
|
192,799 |
|
| Sands China Ltd.
3.50%, 08/08/2031(a) |
|
|
|
|
|
|
285 |
|
|
|
224,178 |
|
| 4.30%, 01/08/2026(a) |
|
|
|
|
|
|
200 |
|
|
|
186,774 |
|
| 4.875%, 06/18/2030(a) |
|
|
|
|
|
|
935 |
|
|
|
806,660 |
|
|
|
|
|
|
|
|
|
|
|
|
|
|
|
|
|
|
|
|
|
|
|
|
|
7,897,816 |
|
|
|
|
|
|
|
|
|
|
|
|
|
|
| Consumer Cyclical - Retailers – 0.2% |
|
|
|
|
|
|
|
|
|
|
|
|
| Macy’s Retail Holdings LLC
5.875%,
04/01/2029(b) |
|
|
|
|
|
|
316 |
|
|
|
276,396 |
|
| 5.875%, 03/15/2030(b) |
|
|
|
|
|
|
1,064 |
|
|
|
901,788 |
|
| 6.125%, 03/15/2032(b) |
|
|
|
|
|
|
509 |
|
|
|
420,264 |
|
|
|
|
|
|
|
|
|
|
|
|
|
|
|
|
|
|
|
|
|
|
|
|
|
1,598,448 |
|
|
|
|
|
|
|
|
|
|
|
|
|
|
| Consumer Non-Cyclical – 0.9% |
|
|
|
|
|
|
|
|
|
|
|
|
| BAT Capital Corp.
6.421%, 08/02/2033 |
|
|
|
|
|
|
1,197 |
|
|
|
1,161,198 |
|
| 7.079%, 08/02/2043 |
|
|
|
|
|
|
77 |
|
|
|
73,836 |
|
| 7.081%, 08/02/2053 |
|
|
|
|
|
|
77 |
|
|
|
72,666 |
|
| 7.75%, 10/19/2032 |
|
|
|
|
|
|
665 |
|
|
|
702,407 |
|
| Charles River Laboratories International, Inc.
3.75%, 03/15/2029(b) |
|
|
|
|
|
|
770 |
|
|
|
662,050 |
|
| 4.00%, 03/15/2031(b) |
|
|
|
|
|
|
991 |
|
|
|
837,995 |
|
|
|
|
|
|
| abfunds.com |
|
ALLIANCEBERNSTEIN GLOBAL HIGH INCOME FUND | 43 |
PORTFOLIO OF INVESTMENTS (continued)
|
|
|
|
|
|
|
|
|
|
|
|
|
| |
|
|
|
|
Principal
Amount
(000) |
|
|
U.S. $ Value |
|
| |
|
| IQVIA, Inc.
5.70%, 05/15/2028(b) |
|
|
U.S.$ |
|
|
|
340 |
|
|
$
|
330,334 |
|
| JBS USA LUX SA/JBS USA Food Co./JBS Luxembourg SARL
6.75%, 03/15/2034(b) |
|
|
|
|
|
|
1,344 |
|
|
|
1,304,766 |
|
| 7.25%, 11/15/2053(b) |
|
|
|
|
|
|
77 |
|
|
|
74,149 |
|
| Pilgrim’s Pride Corp.
3.50%, 03/01/2032 |
|
|
|
|
|
|
1,249 |
|
|
|
966,861 |
|
| 6.875%, 05/15/2034 |
|
|
|
|
|
|
1,581 |
|
|
|
1,552,339 |
|
| Reynolds American, Inc.
5.85%, 08/15/2045 |
|
|
|
|
|
|
171 |
|
|
|
141,373 |
|
|
|
|
|
|
|
|
|
|
|
|
|
|
|
|
|
|
|
|
|
|
|
|
|
7,879,974 |
|
|
|
|
|
|
|
|
|
|
|
|
|
|
| Energy – 2.1% |
|
|
|
|
|
|
|
|
|
|
|
|
| Apache Corp.
4.75%, 04/15/2043 |
|
|
|
|
|
|
8 |
|
|
|
5,854 |
|
| 5.10%, 09/01/2040 |
|
|
|
|
|
|
24 |
|
|
|
19,103 |
|
| Cenovus Energy, Inc.
6.75%, 11/15/2039 |
|
|
|
|
|
|
30 |
|
|
|
29,923 |
|
| Cheniere Energy Partners LP
4.50%, 10/01/2029 |
|
|
|
|
|
|
603 |
|
|
|
545,868 |
|
| Columbia Pipelines Operating Co., LLC
5.927%,
08/15/2030(b) |
|
|
|
|
|
|
228 |
|
|
|
224,552 |
|
| 6.036%, 11/15/2033(b) |
|
|
|
|
|
|
320 |
|
|
|
312,623 |
|
| Continental Resources, Inc./OK
2.875%,
04/01/2032(b) |
|
|
|
|
|
|
83 |
|
|
|
62,101 |
|
| 5.75%, 01/15/2031(b) |
|
|
|
|
|
|
906 |
|
|
|
850,379 |
|
| Ecopetrol SA
4.625%, 11/02/2031 |
|
|
|
|
|
|
841 |
|
|
|
642,061 |
|
| 6.875%, 04/29/2030 |
|
|
|
|
|
|
782 |
|
|
|
710,838 |
|
| 8.625%, 01/19/2029 |
|
|
|
|
|
|
1,118 |
|
|
|
1,119,230 |
|
| 8.875%, 01/13/2033 |
|
|
|
|
|
|
531 |
|
|
|
517,313 |
|
| EnLink Midstream LLC
5.625%,
01/15/2028(b) |
|
|
|
|
|
|
23 |
|
|
|
21,760 |
|
| EnLink Midstream Partners LP
4.85%, 07/15/2026 |
|
|
|
|
|
|
440 |
|
|
|
414,765 |
|
| 5.05%, 04/01/2045 |
|
|
|
|
|
|
807 |
|
|
|
613,649 |
|
| 5.60%, 04/01/2044 |
|
|
|
|
|
|
104 |
|
|
|
86,052 |
|
| Enterprise Products Operating LLC
Series E
5.25%, 08/16/2077 |
|
|
|
|
|
|
345 |
|
|
|
304,433 |
|
| EQT Corp.
3.90%, 10/01/2027 |
|
|
|
|
|
|
291 |
|
|
|
269,279 |
|
| Hunt Oil Co. of Peru LLC Sucursal Del Peru
8.55%, 09/18/2033(b) |
|
|
|
|
|
|
403 |
|
|
|
405,982 |
|
| KazMunayGas National Co. JSC
4.75%,
04/19/2027(b) |
|
|
|
|
|
|
543 |
|
|
|
508,150 |
|
|
|
|
|
|
| 44 | ALLIANCEBERNSTEIN
GLOBAL HIGH INCOME FUND |
|
abfunds.com |
PORTFOLIO OF INVESTMENTS (continued)
|
|
|
|
|
|
|
|
|
|
|
|
|
| |
|
|
|
|
Principal
Amount
(000) |
|
|
U.S. $ Value |
|
| |
|
| 5.375%, 04/24/2030(b) |
|
|
U.S.$ |
|
|
|
1,383 |
|
|
$
|
1,254,990 |
|
| Occidental Petroleum Corp.
4.40%, 04/15/2046 |
|
|
|
|
|
|
62 |
|
|
|
45,488 |
|
| 5.50%, 12/01/2025 |
|
|
|
|
|
|
158 |
|
|
|
155,910 |
|
| 5.55%, 03/15/2026 |
|
|
|
|
|
|
18 |
|
|
|
17,775 |
|
| 5.875%, 09/01/2025 |
|
|
|
|
|
|
21 |
|
|
|
20,904 |
|
| 6.20%, 03/15/2040 |
|
|
|
|
|
|
2 |
|
|
|
1,905 |
|
| 6.45%, 09/15/2036 |
|
|
|
|
|
|
59 |
|
|
|
57,942 |
|
| 7.50%, 05/01/2031 |
|
|
|
|
|
|
2,480 |
|
|
|
2,622,588 |
|
| Oleoducto Central SA
4.00%, 07/14/2027(b) |
|
|
|
|
|
|
424 |
|
|
|
377,784 |
|
| ONEOK, Inc.
6.05%, 09/01/2033 |
|
|
|
|
|
|
703 |
|
|
|
690,874 |
|
| Ovintiv, Inc.
5.65%, 05/15/2028 |
|
|
|
|
|
|
777 |
|
|
|
760,041 |
|
| 6.25%, 07/15/2033 |
|
|
|
|
|
|
1,110 |
|
|
|
1,074,568 |
|
| Tengizchevroil Finance Co. International Ltd.
3.25%, 08/15/2030(b) |
|
|
|
|
|
|
1,212 |
|
|
|
917,848 |
|
| Var Energi ASA
7.50%, 01/15/2028(b) |
|
|
|
|
|
|
894 |
|
|
|
917,811 |
|
| 8.00%, 11/15/2032(b) |
|
|
|
|
|
|
1,585 |
|
|
|
1,658,406 |
|
| Western Midstream Operating LP
3.10%,
02/01/2025(a) |
|
|
|
|
|
|
153 |
|
|
|
146,583 |
|
| 3.95%, 06/01/2025 |
|
|
|
|
|
|
225 |
|
|
|
216,111 |
|
| 4.05%, 02/01/2030(a) |
|
|
|
|
|
|
150 |
|
|
|
130,825 |
|
| 4.75%, 08/15/2028 |
|
|
|
|
|
|
27 |
|
|
|
25,242 |
|
| 5.45%, 04/01/2044 |
|
|
|
|
|
|
193 |
|
|
|
155,703 |
|
|
|
|
|
|
|
|
|
|
|
|
|
|
|
|
|
|
|
|
|
|
|
|
|
18,913,213 |
|
|
|
|
|
|
|
|
|
|
|
|
|
|
| Other Industrial – 0.2% |
|
|
|
|
|
|
|
|
|
|
|
|
| LKQ Corp.
5.75%, 06/15/2028(b) |
|
|
|
|
|
|
1,067 |
|
|
|
1,042,476 |
|
| 6.25%, 06/15/2033(b) |
|
|
|
|
|
|
945 |
|
|
|
914,054 |
|
|
|
|
|
|
|
|
|
|
|
|
|
|
|
|
|
|
|
|
|
|
|
|
|
1,956,530 |
|
|
|
|
|
|
|
|
|
|
|
|
|
|
| Services – 0.2% |
|
| Gartner, Inc.
3.625%, 06/15/2029(b) |
|
|
|
|
|
|
262 |
|
|
|
224,500 |
|
| 4.50%, 07/01/2028(b) |
|
|
|
|
|
|
210 |
|
|
|
191,601 |
|
| GTCR W-2 Merger Sub LLC
7.50%, 01/15/2031(b) |
|
|
|
|
|
|
1,210 |
|
|
|
1,211,531 |
|
| Verisk Analytics, Inc.
5.50%, 06/15/2045 |
|
|
|
|
|
|
5 |
|
|
|
4,396 |
|
|
|
|
|
|
|
|
|
|
|
|
|
|
|
|
|
|
|
|
|
|
|
|
|
1,632,028 |
|
|
|
|
|
|
|
|
|
|
|
|
|
|
|
|
|
|
|
| abfunds.com |
|
ALLIANCEBERNSTEIN GLOBAL HIGH INCOME FUND | 45 |
PORTFOLIO OF INVESTMENTS (continued)
|
|
|
|
|
|
|
|
|
|
|
|
|
| |
|
|
|
|
Principal
Amount
(000) |
|
|
U.S. $ Value |
|
| |
|
| Technology – 0.2% |
|
| Lenovo Group Ltd.
3.421%, 11/02/2030(b) |
|
|
U.S.$ |
|
|
|
289 |
|
|
$
|
235,232 |
|
| 5.831%, 01/27/2028(b) |
|
|
|
|
|
|
597 |
|
|
|
583,914 |
|
| SK Hynix, Inc.
2.375%, 01/19/2031(b) |
|
|
|
|
|
|
408 |
|
|
|
306,624 |
|
| 6.25%, 01/17/2026(b) |
|
|
|
|
|
|
301 |
|
|
|
300,762 |
|
| 6.50%, 01/17/2033(b) |
|
|
|
|
|
|
258 |
|
|
|
251,836 |
|
| Western Digital Corp.
2.85%, 02/01/2029 |
|
|
|
|
|
|
59 |
|
|
|
47,287 |
|
| 3.10%, 02/01/2032 |
|
|
|
|
|
|
130 |
|
|
|
95,086 |
|
| Xiaomi Best Time International Ltd.
2.875%,
07/14/2031(b) |
|
|
|
|
|
|
318 |
|
|
|
235,943 |
|
|
|
|
|
|
|
|
|
|
|
|
|
|
|
|
|
|
|
|
|
|
|
|
|
2,056,684 |
|
|
|
|
|
|
|
|
|
|
|
|
|
|
| Transportation - Airlines – 0.4% |
|
| American Airlines Pass Through Trust
Series 2015-1,
Class A
3.375%, 05/01/2027 |
|
|
|
|
|
|
258 |
|
|
|
228,449 |
|
| Delta Air Lines, Inc.
2.90%, 10/28/2024 |
|
|
|
|
|
|
474 |
|
|
|
455,559 |
|
| Delta Air Lines, Inc./SkyMiles IP Ltd.
4.75%,
10/20/2028(b) |
|
|
|
|
|
|
716 |
|
|
|
681,001 |
|
| Mileage Plus Holdings LLC/Mileage Plus Intellectual Property Assets Ltd.
6.50%, 06/20/2027(b) |
|
|
|
|
|
|
1,861 |
|
|
|
1,846,812 |
|
|
|
|
|
|
|
|
|
|
|
|
|
|
|
|
|
|
|
|
|
|
|
|
|
3,211,821 |
|
|
|
|
|
|
|
|
|
|
|
|
|
|
| Transportation - Railroads – 0.0% |
|
| Lima Metro Line 2 Finance Ltd.
4.35%,
04/05/2036(b) |
|
|
|
|
|
|
390 |
|
|
|
337,202 |
|
|
|
|
|
|
|
|
|
|
|
|
|
|
|
| Transportation - Services – 0.0% |
|
| AerCap Global Aviation Trust
6.50%,
06/15/2045(b) |
|
|
|
|
|
|
235 |
|
|
|
230,069 |
|
|
|
|
|
|
|
|
|
|
|
|
|
|
|
|
|
|
|
|
|
|
|
|
|
94,369,219 |
|
|
|
|
|
|
|
|
|
|
|
|
|
|
| Financial Institutions – 8.7% |
|
| Banking – 6.1% |
|
| AIB Group PLC
4.263%, 04/10/2025(b) |
|
|
|
|
|
|
526 |
|
|
|
518,505 |
|
| 6.608%, 09/13/2029(b) |
|
|
|
|
|
|
429 |
|
|
|
427,973 |
|
| 7.583%, 10/14/2026(b) |
|
|
|
|
|
|
1,117 |
|
|
|
1,137,124 |
|
| Ally Financial, Inc.
5.75%, 11/20/2025 |
|
|
|
|
|
|
22 |
|
|
|
21,407 |
|
| 6.70%, 02/14/2033 |
|
|
|
|
|
|
1,158 |
|
|
|
1,006,963 |
|
| 8.00%, 11/01/2031 |
|
|
|
|
|
|
548 |
|
|
|
551,970 |
|
|
|
|
|
|
| 46 | ALLIANCEBERNSTEIN
GLOBAL HIGH INCOME FUND |
|
abfunds.com |
PORTFOLIO OF INVESTMENTS (continued)
|
|
|
|
|
|
|
|
|
|
|
| |
|
|
|
Principal
Amount
(000) |
|
|
U.S. $ Value |
|
| |
|
| Series B
4.70%, 05/15/2026(l) |
|
U.S.$ |
|
|
2,950 |
|
|
$
|
2,023,088 |
|
| Banco Santander SA
3.225%, 11/22/2032 |
|
|
|
|
200 |
|
|
|
151,839 |
|
| 6.921%, 08/08/2033 |
|
|
|
|
2,600 |
|
|
|
2,497,162 |
|
| Bank of America Corp.
Series U
8.806% (SOFR + 3.40%), 10/30/2023(j)(l) |
|
|
|
|
316 |
|
|
|
315,924 |
|
| Series X
6.25%, 09/05/2024(l) |
|
|
|
|
1,199 |
|
|
|
1,187,887 |
|
| Barclays PLC
6.125%, 12/15/2025(l) |
|
|
|
|
1,402 |
|
|
|
1,270,640 |
|
| 7.119%, 06/27/2034 |
|
|
|
|
361 |
|
|
|
348,322 |
|
| 7.125%, 06/15/2025(l) |
|
GBP |
|
|
404 |
|
|
|
459,560 |
|
| BNP Paribas SA
4.625%, 02/25/2031(b)(l) |
|
U.S.$ |
|
|
1,350 |
|
|
|
958,652 |
|
| 7.375%, 08/19/2025(b)(l) |
|
|
|
|
755 |
|
|
|
738,364 |
|
| 8.50%, 08/14/2028(b)(l) |
|
|
|
|
1,205 |
|
|
|
1,183,157 |
|
| CaixaBank SA
5.875%, 10/09/2027(b)(l) |
|
EUR |
|
|
1,000 |
|
|
|
950,722 |
|
| 6.84%, 09/13/2034(b) |
|
U.S.$ |
|
|
1,227 |
|
|
|
1,207,072 |
|
| Capital One Financial Corp.
2.359%, 07/29/2032 |
|
|
|
|
423 |
|
|
|
288,236 |
|
| Citigroup, Inc.
7.625%, 11/15/2028(l) |
|
|
|
|
592 |
|
|
|
578,046 |
|
| 9.699% (SOFR + 4.33%), 10/30/2023(j)(l) |
|
|
|
|
1,107 |
|
|
|
1,108,042 |
|
| Series W
4.00%, 12/10/2025(l) |
|
|
|
|
413 |
|
|
|
361,664 |
|
| Credit Agricole SA
8.125%,
12/23/2025(b)(l) |
|
|
|
|
1,461 |
|
|
|
1,451,869 |
|
| 8.125%, 03/23/2172(l) |
|
|
|
|
448 |
|
|
|
445,266 |
|
| Deutsche Bank AG/New York NY
1.447%, 04/01/2025 |
|
|
|
|
150 |
|
|
|
145,817 |
|
| 6.72%, 01/18/2029 |
|
|
|
|
1,317 |
|
|
|
1,308,788 |
|
| 7.079%, 02/10/2034 |
|
|
|
|
1,509 |
|
|
|
1,362,295 |
|
| 7.146%, 07/13/2027 |
|
|
|
|
573 |
|
|
|
576,635 |
|
| Discover Financial Services
6.70%, 11/29/2032 |
|
|
|
|
286 |
|
|
|
276,234 |
|
| Goldman Sachs Group, Inc. (The)
Series P
8.501% (SOFR + 3.14%), 10/30/2023(j)(l)
|
|
|
|
|
1,130 |
|
|
|
1,126,061 |
|
| Series W
7.50%, 02/10/2029(l) |
|
|
|
|
903 |
|
|
|
894,244 |
|
| HSBC Holdings PLC
4.762%, 03/29/2033 |
|
|
|
|
901 |
|
|
|
769,012 |
|
| 8.113%, 11/03/2033 |
|
|
|
|
1,024 |
|
|
|
1,080,226 |
|
|
|
|
|
|
| abfunds.com |
|
ALLIANCEBERNSTEIN GLOBAL HIGH INCOME FUND | 47 |
PORTFOLIO OF INVESTMENTS (continued)
|
|
|
|
|
|
|
|
|
|
|
| |
|
|
|
Principal
Amount
(000) |
|
|
U.S. $ Value |
|
| |
|
| Series E
4.75%, 07/04/2029(b)(l) |
|
EUR |
|
|
1,595 |
|
|
$
|
1,404,232 |
|
| Intesa Sanpaolo SpA
5.017%, 06/26/2024(b) |
|
U.S.$ |
|
|
331 |
|
|
|
323,689 |
|
| 5.71%, 01/15/2026(b) |
|
|
|
|
1,650 |
|
|
|
1,578,371 |
|
| 6.625%, 06/20/2033(b) |
|
|
|
|
997 |
|
|
|
941,852 |
|
| 7.00%, 11/21/2025(b) |
|
|
|
|
355 |
|
|
|
358,861 |
|
| JPMorgan Chase & Co.
Series Q
8.884% (SOFR + 3.51%), 11/01/2023(j)(l) |
|
|
|
|
1,212 |
|
|
|
1,213,815 |
|
| Series R
8.934% (SOFR + 3.56%), 11/01/2023(j)(l) |
|
|
|
|
89 |
|
|
|
89,312 |
|
| Lloyds Banking Group PLC
7.50%,
06/27/2024(l) |
|
|
|
|
212 |
|
|
|
207,360 |
|
| 7.50%, 09/27/2025(l) |
|
|
|
|
680 |
|
|
|
635,256 |
|
| 7.953%, 11/15/2033 |
|
|
|
|
854 |
|
|
|
884,116 |
|
| 8.00%, 09/27/2029(l) |
|
|
|
|
801 |
|
|
|
714,930 |
|
| Nordea Bank Abp
6.625%, 03/26/2026(b)(l) |
|
|
|
|
3,065 |
|
|
|
2,884,075 |
|
| PNC Financial Services Group, Inc. (The)
Series R
8.711% (SOFR + 3.30%), 12/01/2023(j)(l) |
|
|
|
|
503 |
|
|
|
501,612 |
|
| Santander Holdings USA, Inc.
6.499%, 03/09/2029 |
|
|
|
|
1,967 |
|
|
|
1,919,243 |
|
| 6.565%, 06/12/2029 |
|
|
|
|
1,802 |
|
|
|
1,756,360 |
|
| Santander UK Group Holdings PLC
6.833%, 11/21/2026 |
|
|
|
|
3,782 |
|
|
|
3,801,846 |
|
| Standard Chartered PLC
6.17%,
01/09/2027(b) |
|
|
|
|
449 |
|
|
|
446,929 |
|
| 6.187%, 07/06/2027(b) |
|
|
|
|
433 |
|
|
|
431,444 |
|
| 7.776%, 11/16/2025(b) |
|
|
|
|
467 |
|
|
|
475,454 |
|
| Swedbank AB
Series NC5
5.625%,
09/17/2024(b)(l) |
|
|
|
|
1,000 |
|
|
|
957,385 |
|
| Synchrony Bank
5.625%, 08/23/2027 |
|
|
|
|
727 |
|
|
|
675,170 |
|
| Truist Financial Corp.
Series L
8.773% (SOFR + 3.36%), 12/15/2024(j)(l) |
|
|
|
|
1,397 |
|
|
|
1,376,142 |
|
| UBS Group AG
6.373%, 07/15/2026(b) |
|
|
|
|
712 |
|
|
|
709,670 |
|
| 7.00%, 02/19/2025(b)(l) |
|
|
|
|
620 |
|
|
|
601,825 |
|
| UniCredit SpA
1.982%, 06/03/2027(b) |
|
|
|
|
915 |
|
|
|
808,242 |
|
| 5.459%, 06/30/2035(b) |
|
|
|
|
243 |
|
|
|
204,145 |
|
| 7.296%, 04/02/2034(b) |
|
|
|
|
200 |
|
|
|
188,570 |
|
|
|
|
|
|
| 48 | ALLIANCEBERNSTEIN
GLOBAL HIGH INCOME FUND |
|
abfunds.com |
PORTFOLIO OF INVESTMENTS (continued)
|
|
|
|
|
|
|
|
|
|
|
|
|
| |
|
|
|
|
Principal
Amount
(000) |
|
|
U.S. $ Value |
|
| |
|
| Wells Fargo & Co.
7.625%,
09/15/2028(l) |
|
|
U.S.$ |
|
|
|
843 |
|
|
$
|
853,358 |
|
|
|
|
|
|
|
|
|
|
|
|
|
|
|
|
|
|
|
|
|
|
|
|
|
55,672,030 |
|
|
|
|
|
|
|
|
|
|
|
|
|
|
| Brokerage – 0.2% |
|
|
|
|
|
|
|
|
|
|
|
|
| Abrdn PLC
4.25%, 06/30/2028(b) |
|
|
|
|
|
|
341 |
|
|
|
290,723 |
|
| Charles Schwab Corp. (The)
Series I
4.00%,
06/01/2026(l) |
|
|
|
|
|
|
1,251 |
|
|
|
1,045,246 |
|
|
|
|
|
|
|
|
|
|
|
|
|
|
|
|
|
|
|
|
|
|
|
|
|
1,335,969 |
|
|
|
|
|
|
|
|
|
|
|
|
|
|
| Finance – 1.1% |
|
|
|
|
|
|
|
|
|
|
|
|
| Air Lease Corp.
Series B
4.65%,
06/15/2026(l) |
|
|
|
|
|
|
1,229 |
|
|
|
1,080,113 |
|
| Aircastle Ltd.
5.25%, 08/11/2025(b) |
|
|
|
|
|
|
2,239 |
|
|
|
2,180,407 |
|
| Aviation Capital Group LLC
1.95%,
09/20/2026(b) |
|
|
|
|
|
|
844 |
|
|
|
735,909 |
|
| 3.50%, 11/01/2027(b) |
|
|
|
|
|
|
295 |
|
|
|
259,994 |
|
| 4.125%, 08/01/2025(b) |
|
|
|
|
|
|
395 |
|
|
|
375,767 |
|
| 4.875%, 10/01/2025(b) |
|
|
|
|
|
|
319 |
|
|
|
306,172 |
|
| 6.375%, 07/15/2030(b) |
|
|
|
|
|
|
1,098 |
|
|
|
1,062,574 |
|
| Blue Owl Capital Corp.
3.40%, 07/15/2026 |
|
|
|
|
|
|
337 |
|
|
|
302,165 |
|
| Enact Holdings, Inc.
6.50%, 08/15/2025(b) |
|
|
|
|
|
|
215 |
|
|
|
211,946 |
|
| GTCR W-2 Merger Sub LLC/GTCR W Dutch Finance Sub BV
8.50%,
01/15/2031(b) |
|
|
GBP |
|
|
|
163 |
|
|
|
203,302 |
|
| Huarong Finance 2017 Co., Ltd.
4.75%,
04/27/2027(b) |
|
|
U.S.$ |
|
|
|
200 |
|
|
|
170,492 |
|
| Huarong Finance 2019 Co., Ltd.
Series E
3.75%, 05/29/2024(b) |
|
|
|
|
|
|
343 |
|
|
|
331,153 |
|
| Huarong Finance II Co., Ltd.
Series E
4.625%,
06/03/2026(b) |
|
|
|
|
|
|
200 |
|
|
|
174,724 |
|
| 4.875%, 11/22/2026(b) |
|
|
|
|
|
|
430 |
|
|
|
370,626 |
|
| 5.50%, 01/16/2025(b) |
|
|
|
|
|
|
1,082 |
|
|
|
1,016,615 |
|
| ILFC E-Capital Trust II
7.459% (LIBOR 3 Month + 1.80%),
12/21/2065(b)(j) |
|
|
|
|
|
|
2,000 |
|
|
|
1,500,024 |
|
| United Wholesale Mortgage LLC
5.50%,
04/15/2029(b) |
|
|
|
|
|
|
145 |
|
|
|
122,519 |
|
|
|
|
|
|
|
|
|
|
|
|
|
|
|
|
|
|
|
|
|
|
|
|
|
10,404,502 |
|
|
|
|
|
|
|
|
|
|
|
|
|
|
|
|
|
|
|
| abfunds.com |
|
ALLIANCEBERNSTEIN GLOBAL HIGH INCOME FUND | 49 |
PORTFOLIO OF INVESTMENTS (continued)
|
|
|
|
|
|
|
|
|
|
|
|
|
| |
|
|
|
|
Principal
Amount
(000) |
|
|
U.S. $ Value |
|
| |
|
| Insurance – 1.1% |
|
|
|
|
|
|
|
|
|
|
|
|
| Aegon NV
5.50%, 04/11/2048 |
|
|
U.S.$ |
|
|
|
314 |
|
|
$
|
290,250 |
|
| Allstate Corp. (The)
6.50%, 05/15/2057 |
|
|
|
|
|
|
1,657 |
|
|
|
1,550,959 |
|
| American International Group, Inc.
Series A-9
5.75%,
04/01/2048 |
|
|
|
|
|
|
319 |
|
|
|
296,286 |
|
| Argentum Netherlands BV for Swiss Re Ltd.
5.625%, 08/15/2052(b) |
|
|
|
|
|
|
308 |
|
|
|
288,654 |
|
| Enstar Finance LLC
5.50%, 01/15/2042 |
|
|
|
|
|
|
262 |
|
|
|
209,462 |
|
| Global Atlantic Fin Co.
4.70%,
10/15/2051(b) |
|
|
|
|
|
|
62 |
|
|
|
44,975 |
|
| Liberty Mutual Group, Inc.
4.125%,
12/15/2051(b) |
|
|
|
|
|
|
43 |
|
|
|
35,417 |
|
| 7.80%, 03/15/2037(b) |
|
|
|
|
|
|
2,187 |
|
|
|
2,206,597 |
|
| MetLife, Inc.
10.75%, 08/01/2039 |
|
|
|
|
|
|
2,350 |
|
|
|
3,011,082 |
|
| Prudential Financial, Inc.
5.20%, 03/15/2044 |
|
|
|
|
|
|
340 |
|
|
|
334,016 |
|
| Sammons Financial Group, Inc.
3.35%,
04/16/2031(b) |
|
|
|
|
|
|
388 |
|
|
|
291,559 |
|
| Transatlantic Holdings, Inc.
8.00%, 11/30/2039 |
|
|
|
|
|
|
1,261 |
|
|
|
1,478,656 |
|
|
|
|
|
|
|
|
|
|
|
|
|
|
|
|
|
|
|
|
|
|
|
|
|
10,037,913 |
|
|
|
|
|
|
|
|
|
|
|
|
|
|
| REITs – 0.2% |
|
|
|
|
|
|
|
|
|
|
|
|
| Global Net Lease, Inc./Global Net Lease Operating Partnership LP
3.75%, 12/15/2027(b) |
|
|
|
|
|
|
19 |
|
|
|
14,717 |
|
| Necessity Retail REIT, Inc. (The)/American Finance Operating Partner LP
4.50%, 09/30/2028(b) |
|
|
|
|
|
|
424 |
|
|
|
322,260 |
|
| Trust Fibra Uno
4.869%, 01/15/2030(b) |
|
|
|
|
|
|
1,480 |
|
|
|
1,251,828 |
|
| WEA Finance LLC
2.875%, 01/15/2027(b) |
|
|
|
|
|
|
117 |
|
|
|
100,404 |
|
| WEA Finance LLC/Westfield UK & Europe Finance PLC
3.75%, 09/17/2024(b) |
|
|
|
|
|
|
212 |
|
|
|
203,889 |
|
|
|
|
|
|
|
|
|
|
|
|
|
|
|
|
|
|
|
|
|
|
|
|
|
1,893,098 |
|
|
|
|
|
|
|
|
|
|
|
|
|
|
|
|
|
|
|
|
|
|
|
|
|
79,343,512 |
|
|
|
|
|
|
|
|
|
|
|
|
|
|
|
|
|
|
|
| 50 | ALLIANCEBERNSTEIN
GLOBAL HIGH INCOME FUND |
|
abfunds.com |
PORTFOLIO OF INVESTMENTS (continued)
|
|
|
|
|
|
|
|
|
|
|
|
|
| |
|
|
|
|
Principal
Amount
(000) |
|
|
U.S. $ Value |
|
| |
|
| Utility – 0.6% |
|
|
|
|
|
|
|
|
|
|
|
|
| Electric – 0.6% |
|
|
|
|
|
|
|
|
|
|
|
|
| Alexander Funding Trust II
7.467%,
07/31/2028(b) |
|
|
U.S.$ |
|
|
|
685 |
|
|
$
|
684,433 |
|
| Cometa Energia SA de CV
6.375%,
04/24/2035(b) |
|
|
|
|
|
|
452 |
|
|
|
419,860 |
|
| Edison International
8.125%, 06/15/2053 |
|
|
|
|
|
|
319 |
|
|
|
318,958 |
|
| Electricite de France SA
9.125%,
03/15/2033(b)(l) |
|
|
|
|
|
|
427 |
|
|
|
443,673 |
|
| Enel Finance International NV
7.50%,
10/14/2032(b) |
|
|
|
|
|
|
1,190 |
|
|
|
1,269,960 |
|
| FirstEnergy Corp.
Series C
5.10%,
07/15/2047(a) |
|
|
|
|
|
|
7 |
|
|
|
5,941 |
|
| NRG Energy, Inc.
4.45%, 06/15/2029(b) |
|
|
|
|
|
|
154 |
|
|
|
133,956 |
|
| 7.00%, 03/15/2033(b) |
|
|
|
|
|
|
323 |
|
|
|
310,114 |
|
| Pacific Gas and Electric Co.
6.75%, 01/15/2053 |
|
|
|
|
|
|
76 |
|
|
|
71,360 |
|
| Palomino Funding Trust I
7.233%,
05/17/2028(b) |
|
|
|
|
|
|
1,703 |
|
|
|
1,707,977 |
|
|
|
|
|
|
|
|
|
|
|
|
|
|
|
|
|
|
|
|
|
|
|
|
|
5,366,232 |
|
|
|
|
|
|
|
|
|
|
|
|
|
|
| Total Corporates – Investment Grade
(cost $185,707,829) |
|
|
|
|
|
|
|
|
|
|
179,078,963 |
|
|
|
|
|
|
|
|
|
|
|
|
|
|
|
|
|
|
|
|
|
|
|
|
|
|
|
| EMERGING MARKETS - CORPORATE BONDS – 5.3% |
|
|
|
|
|
|
|
|
|
|
|
|
| Industrial – 4.8% |
|
|
|
|
|
|
|
|
|
|
|
|
| Basic – 1.3% |
|
|
|
|
|
|
|
|
|
|
|
|
| Braskem Idesa SAPI
6.99%, 02/20/2032(b) |
|
|
|
|
|
|
1,174 |
|
|
|
704,506 |
|
| 7.45%, 11/15/2029(b) |
|
|
|
|
|
|
1,010 |
|
|
|
627,574 |
|
| Cia de Minas Buenaventura SAA
5.50%,
07/23/2026(b) |
|
|
|
|
|
|
1,072 |
|
|
|
934,334 |
|
| Consolidated Energy Finance SA
5.625%,
10/15/2028(b) |
|
|
|
|
|
|
196 |
|
|
|
162,747 |
|
| CSN Inova Ventures
6.75%, 01/28/2028(b) |
|
|
|
|
|
|
2,644 |
|
|
|
2,445,700 |
|
| Eldorado Gold Corp.
6.25%, 09/01/2029(b) |
|
|
|
|
|
|
986 |
|
|
|
850,307 |
|
| First Quantum Minerals Ltd.
6.875%,
10/15/2027(b) |
|
|
|
|
|
|
1,215 |
|
|
|
1,158,988 |
|
| 7.50%, 04/01/2025(b) |
|
|
|
|
|
|
261 |
|
|
|
259,987 |
|
| 8.625%, 06/01/2031(b) |
|
|
|
|
|
|
832 |
|
|
|
827,840 |
|
| Indika Energy Capital IV Pte Ltd.
8.25%,
10/22/2025(b) |
|
|
|
|
|
|
1,431 |
|
|
|
1,413,227 |
|
|
|
|
|
|
| abfunds.com |
|
ALLIANCEBERNSTEIN GLOBAL HIGH INCOME FUND | 51 |
PORTFOLIO OF INVESTMENTS (continued)
|
|
|
|
|
|
|
|
|
|
|
|
|
| |
|
|
|
|
Principal
Amount
(000) |
|
|
U.S. $ Value |
|
| |
|
| JSW Steel Ltd.
3.95%, 04/05/2027(b) |
|
|
U.S.$ |
|
|
|
409 |
|
|
$
|
358,178 |
|
| 5.05%, 04/05/2032(b) |
|
|
|
|
|
|
658 |
|
|
|
528,900 |
|
| Sasol Financing USA LLC
8.75%,
05/03/2029(b) |
|
|
|
|
|
|
668 |
|
|
|
642,394 |
|
| Stillwater Mining Co.
4.00%, 11/16/2026(b) |
|
|
|
|
|
|
319 |
|
|
|
276,356 |
|
| 4.50%, 11/16/2029(b) |
|
|
|
|
|
|
309 |
|
|
|
237,037 |
|
| Vedanta Resources Finance II PLC
13.875%,
01/21/2024(b) |
|
|
|
|
|
|
414 |
|
|
|
370,087 |
|
| Volcan Cia Minera SAA
4.375%,
02/11/2026(b) |
|
|
|
|
|
|
345 |
|
|
|
196,402 |
|
|
|
|
|
|
|
|
|
|
|
|
|
|
|
|
|
|
|
|
|
|
|
|
|
11,994,564 |
|
|
|
|
|
|
|
|
|
|
|
|
|
|
| Capital Goods – 0.4% |
|
|
|
|
|
|
|
|
|
|
|
|
| Cemex SAB de CV
5.125%, 06/08/2026(b)(l) |
|
|
|
|
|
|
1,028 |
|
|
|
955,732 |
|
| Embraer Netherlands Finance BV
5.40%, 02/01/2027 |
|
|
|
|
|
|
918 |
|
|
|
892,746 |
|
| 7.00%, 07/28/2030(b) |
|
|
|
|
|
|
803 |
|
|
|
796,678 |
|
| IHS Holding Ltd.
5.625%, 11/29/2026(b) |
|
|
|
|
|
|
402 |
|
|
|
330,138 |
|
| 6.25%, 11/29/2028(b) |
|
|
|
|
|
|
383 |
|
|
|
289,230 |
|
| Odebrecht Holdco Finance Ltd.
Zero Coupon,
09/10/2058(e)(h) |
|
|
|
|
|
|
2,661 |
|
|
|
2,395 |
|
|
|
|
|
|
|
|
|
|
|
|
|
|
|
|
|
|
|
|
|
|
|
|
|
3,266,919 |
|
|
|
|
|
|
|
|
|
|
|
|
|
|
| Communications - Media – 0.1% |
|
|
|
|
|
|
|
|
|
|
|
|
| Globo Comunicacao e Participacoes SA
4.875%,
01/22/2030(b) |
|
|
|
|
|
|
1,130 |
|
|
|
934,906 |
|
|
|
|
|
|
|
|
|
|
|
|
|
|
|
|
|
|
| Communications - Telecommunications – 0.1% |
|
|
|
|
|
|
|
|
|
|
|
|
| CT Trust
5.125%, 02/03/2032(b) |
|
|
|
|
|
|
557 |
|
|
|
434,956 |
|
| Digicel Group Holdings Ltd.
7.00%,
10/16/2023(g)(h)(l) |
|
|
|
|
|
|
101 |
|
|
|
5,370 |
|
| Digicel International Finance Ltd./Digicel International Holdings Ltd.
8.75%, 05/25/2024(b) |
|
|
|
|
|
|
657 |
|
|
|
585,019 |
|
|
|
|
|
|
|
|
|
|
|
|
|
|
|
|
|
|
|
|
|
|
|
|
|
1,025,345 |
|
|
|
|
|
|
|
|
|
|
|
|
|
|
| Consumer Cyclical - Other – 1.2% |
|
|
|
|
|
|
|
|
|
|
|
|
| Allwyn Entertainment Financing UK PLC
7.875%,
04/30/2029(b) |
|
|
|
|
|
|
200 |
|
|
|
200,137 |
|
| 7.906% (EURIBOR 3 Month + 4.12%),
02/15/2028(j) |
|
|
EUR |
|
|
|
650 |
|
|
|
691,185 |
|
| Allwyn International AS
3.875%,
02/15/2027(b) |
|
|
|
|
|
|
170 |
|
|
|
167,376 |
|
|
|
|
|
|
| 52 | ALLIANCEBERNSTEIN
GLOBAL HIGH INCOME FUND |
|
abfunds.com |
PORTFOLIO OF INVESTMENTS (continued)
|
|
|
|
|
|
|
|
|
|
|
|
|
| |
|
|
|
|
Principal
Amount
(000) |
|
|
U.S. $ Value |
|
| |
|
| Melco Resorts Finance Ltd.
5.375%,
12/04/2029(b) |
|
|
U.S.$ |
|
|
|
1,603 |
|
|
$
|
1,317,201 |
|
| 5.625%, 07/17/2027(b) |
|
|
|
|
|
|
965 |
|
|
|
860,433 |
|
| 5.75%, 07/21/2028(b) |
|
|
|
|
|
|
1,255 |
|
|
|
1,088,336 |
|
| MGM China Holdings Ltd.
4.75%,
02/01/2027(b) |
|
|
|
|
|
|
1,322 |
|
|
|
1,188,703 |
|
| 5.25%, 06/18/2025(b) |
|
|
|
|
|
|
222 |
|
|
|
212,174 |
|
| 5.375%, 05/15/2024(b) |
|
|
|
|
|
|
398 |
|
|
|
391,121 |
|
| 5.875%, 05/15/2026(b) |
|
|
|
|
|
|
414 |
|
|
|
392,298 |
|
| Studio City Co., Ltd.
7.00%,
02/15/2027(b) |
|
|
|
|
|
|
289 |
|
|
|
272,261 |
|
| Studio City Finance Ltd.
5.00%,
01/15/2029(b) |
|
|
|
|
|
|
609 |
|
|
|
456,129 |
|
| 6.00%, 07/15/2025(b) |
|
|
|
|
|
|
648 |
|
|
|
611,842 |
|
| 6.50%, 01/15/2028(b) |
|
|
|
|
|
|
457 |
|
|
|
383,674 |
|
| Wynn Macau Ltd.
4.875%, 10/01/2024(b) |
|
|
|
|
|
|
286 |
|
|
|
277,563 |
|
| 5.125%, 12/15/2029(b) |
|
|
|
|
|
|
241 |
|
|
|
197,620 |
|
| 5.50%, 01/15/2026(b) |
|
|
|
|
|
|
734 |
|
|
|
680,741 |
|
| 5.50%, 10/01/2027(b) |
|
|
|
|
|
|
947 |
|
|
|
841,324 |
|
| 5.625%, 08/26/2028(b) |
|
|
|
|
|
|
717 |
|
|
|
618,413 |
|
|
|
|
|
|
|
|
|
|
|
|
|
|
|
|
|
|
|
|
|
|
|
|
|
10,848,531 |
|
|
|
|
|
|
|
|
|
|
|
|
|
|
| Consumer Cyclical - Retailers – 0.0% |
|
|
|
|
|
|
|
|
|
|
|
|
| K201640219 South Africa Ltd.
Zero Coupon,
06/25/2024(c)(e)(f)(k) |
|
|
ZAR |
|
|
|
45 |
|
|
|
– 0 |
– |
| K2016470219 South Africa Ltd.
3.00%,
12/31/2022(c)(d)(e)(f)(h) |
|
|
U.S.$ |
|
|
|
1,100 |
|
|
|
– 0 |
– |
| K2016470260 South Africa Ltd.
25.00%,
12/31/2022(b)(c)(d)(e)(f) |
|
|
|
|
|
|
771 |
|
|
|
– 0 |
– |
|
|
|
|
|
|
|
|
|
|
|
|
|
|
|
|
|
|
|
|
|
|
|
|
– 0 |
– |
|
|
|
|
|
|
|
|
|
|
|
|
|
| Consumer Non-Cyclical – 0.7% |
|
|
|
|
|
|
|
|
|
|
|
|
| BBFI Liquidating Trust
Zero Coupon,
12/30/2099(c)(e)(f)(h)(l) |
|
|
|
|
|
|
780 |
|
|
|
341,560 |
|
| BRF SA
4.875%, 01/24/2030(b) |
|
|
|
|
|
|
655 |
|
|
|
528,094 |
|
| Central American Bottling Corp./CBC Bottling Holdco SL/Beliv Holdco SL
5.25%, 04/27/2029(b) |
|
|
|
|
|
|
377 |
|
|
|
338,593 |
|
| MARB BondCo PLC
3.95%, 01/29/2031(b) |
|
|
|
|
|
|
1,180 |
|
|
|
870,309 |
|
| Rede D’or Finance SARL
4.50%,
01/22/2030(b) |
|
|
|
|
|
|
223 |
|
|
|
187,710 |
|
| 4.95%, 01/17/2028(b) |
|
|
|
|
|
|
735 |
|
|
|
670,342 |
|
| Teva Pharmaceutical Finance Netherlands II BV
3.75%, 05/09/2027 |
|
|
EUR |
|
|
|
446 |
|
|
|
426,941 |
|
| 4.375%, 05/09/2030 |
|
|
|
|
|
|
1,000 |
|
|
|
902,162 |
|
|
|
|
|
|
| abfunds.com |
|
ALLIANCEBERNSTEIN GLOBAL HIGH INCOME FUND | 53 |
PORTFOLIO OF INVESTMENTS (continued)
|
|
|
|
|
|
|
|
|
|
|
|
|
| |
|
|
|
|
Principal
Amount
(000) |
|
|
U.S. $ Value |
|
| |
|
| Teva Pharmaceutical Finance Netherlands III BV
4.75%, 05/09/2027 |
|
|
U.S.$ |
|
|
|
517 |
|
|
$
|
473,319 |
|
| 5.125%, 05/09/2029(i) |
|
|
|
|
|
|
517 |
|
|
|
467,451 |
|
| 7.875%, 09/15/2029 |
|
|
|
|
|
|
506 |
|
|
|
514,233 |
|
| 8.125%, 09/15/2031 |
|
|
|
|
|
|
506 |
|
|
|
522,472 |
|
| Tonon Luxembourg SA
6.50%,
10/31/2024(e)(f)(h)(k) |
|
|
|
|
|
|
621 |
|
|
|
62 |
|
| Ulker Biskuvi Sanayi AS
6.95%,
10/30/2025(b) |
|
|
|
|
|
|
327 |
|
|
|
305,866 |
|
| Virgolino de Oliveira Finance SA
10.50%,
01/28/2018(c)(d)(e)(f)(h) |
|
|
|
|
|
|
4,090 |
|
|
|
408 |
|
| 10.875%, 01/13/2020(c)(d)(e)(f)(h) |
|
|
|
|
|
|
480 |
|
|
|
48 |
|
| 11.75%, 02/09/2022(c)(d)(e)(f)(h) |
|
|
|
|
|
|
1,620 |
|
|
|
162 |
|
|
|
|
|
|
|
|
|
|
|
|
|
|
|
|
|
|
|
|
|
|
|
|
|
6,549,732 |
|
|
|
|
|
|
|
|
|
|
|
|
|
|
| Energy – 0.7% |
|
|
|
|
|
|
|
|
|
|
|
|
| Acu Petroleo Luxembourg SARL
7.50%,
01/13/2032(b) |
|
|
|
|
|
|
539 |
|
|
|
492,428 |
|
| Canacol Energy Ltd.
5.75%, 11/24/2028(b) |
|
|
|
|
|
|
544 |
|
|
|
440,022 |
|
| Continuum Energy Aura Pte Ltd.
9.50%,
02/24/2027(b) |
|
|
|
|
|
|
401 |
|
|
|
398,494 |
|
| Cosan Luxembourg SA
5.50%, 09/20/2029(b) |
|
|
|
|
|
|
461 |
|
|
|
419,741 |
|
| Geopark Ltd.
5.50%, 01/17/2027(b) |
|
|
|
|
|
|
561 |
|
|
|
478,252 |
|
| Gran Tierra Energy, Inc.
7.75%,
05/23/2027(b) |
|
|
|
|
|
|
732 |
|
|
|
632,706 |
|
| Greenko Wind Projects Mauritius Ltd.
5.50%,
04/06/2025(b) |
|
|
|
|
|
|
957 |
|
|
|
916,749 |
|
| Kosmos Energy Ltd.
7.50%, 03/01/2028(b) |
|
|
|
|
|
|
314 |
|
|
|
279,425 |
|
| 7.75%, 05/01/2027(b) |
|
|
|
|
|
|
200 |
|
|
|
184,068 |
|
| Leviathan Bond Ltd.
6.50%, 06/30/2027(b) |
|
|
|
|
|
|
1,197 |
|
|
|
1,134,293 |
|
| MV24 Capital BV
6.748%, 06/01/2034(b) |
|
|
|
|
|
|
467 |
|
|
|
409,961 |
|
| ReNew Pvt Ltd.
5.875%, 03/05/2027(b) |
|
|
|
|
|
|
202 |
|
|
|
185,876 |
|
| SEPLAT Energy PLC
7.75%, 04/01/2026(b) |
|
|
|
|
|
|
381 |
|
|
|
324,284 |
|
| SierraCol Energy Andina LLC
6.00%,
06/15/2028(b) |
|
|
|
|
|
|
558 |
|
|
|
442,427 |
|
|
|
|
|
|
|
|
|
|
|
|
|
|
|
|
|
|
|
|
|
|
|
|
|
6,738,726 |
|
|
|
|
|
|
|
|
|
|
|
|
|
|
| Services – 0.1% |
|
|
|
|
|
|
|
|
|
|
|
|
| Bidvest Group UK PLC (The)
3.625%,
09/23/2026(b) |
|
|
|
|
|
|
454 |
|
|
|
402,625 |
|
|
|
|
|
|
|
|
|
|
|
|
|
|
|
|
|
|
|
| 54 | ALLIANCEBERNSTEIN
GLOBAL HIGH INCOME FUND |
|
abfunds.com |
PORTFOLIO OF INVESTMENTS (continued)
|
|
|
|
|
|
|
|
|
|
|
|
|
| |
|
|
|
|
Principal
Amount
(000) |
|
|
U.S. $ Value |
|
| |
|
| Technology – 0.2% |
|
|
|
|
|
|
|
|
|
|
|
|
| CA Magnum Holdings
5.375%, 10/31/2026(b) |
|
|
U.S.$ |
|
|
|
2,039 |
|
|
$
|
1,799,091 |
|
|
|
|
|
|
|
|
|
|
|
|
|
|
|
|
|
|
| Transportation - Services – 0.0% |
|
|
|
|
|
|
|
|
|
|
|
|
| JSW Infrastructure Ltd.
4.95%,
01/21/2029(b) |
|
|
|
|
|
|
204 |
|
|
|
178,351 |
|
|
|
|
|
|
|
|
|
|
|
|
|
|
|
|
|
|
|
|
|
|
|
|
|
43,738,790 |
|
|
|
|
|
|
|
|
|
|
|
|
|
|
| Utility – 0.3% |
|
|
|
|
|
|
|
|
|
|
|
|
| Electric – 0.3% |
|
|
|
|
|
|
|
|
|
|
|
|
| Adani Green Energy Ltd.
4.375%,
09/08/2024(b) |
|
|
|
|
|
|
495 |
|
|
|
462,444 |
|
| AES Andes SA
6.35%, 10/07/2079(b) |
|
|
|
|
|
|
495 |
|
|
|
465,671 |
|
| Diamond II Ltd.
7.95%, 07/28/2026(b) |
|
|
|
|
|
|
597 |
|
|
|
588,170 |
|
| India Clean Energy Holdings
4.50%,
04/18/2027(b) |
|
|
|
|
|
|
511 |
|
|
|
423,011 |
|
| Investment Energy Resources Ltd.
6.25%,
04/26/2029(b) |
|
|
|
|
|
|
403 |
|
|
|
366,730 |
|
| JSW Hydro Energy Ltd.
4.125%,
05/18/2031(b) |
|
|
|
|
|
|
458 |
|
|
|
378,990 |
|
| Star Energy Geothermal Wayang Windu Ltd.
6.75%,
04/24/2033(b) |
|
|
|
|
|
|
186 |
|
|
|
178,010 |
|
| Terraform Global Operating LP
6.125%,
03/01/2026(b) |
|
|
|
|
|
|
118 |
|
|
|
115,762 |
|
|
|
|
|
|
|
|
|
|
|
|
|
|
|
|
|
|
|
|
|
|
|
|
|
2,978,788 |
|
|
|
|
|
|
|
|
|
|
|
|
|
|
| Financial Institutions – 0.2% |
|
|
|
|
|
|
|
|
|
|
|
|
| Banking – 0.2% |
|
|
|
|
|
|
|
|
|
|
|
|
| Turkiye Vakiflar Bankasi TAO
9.00%,
10/12/2028(b) |
|
|
|
|
|
|
928 |
|
|
|
916,400 |
|
| Yapi ve Kredi Bankasi AS
9.25%,
10/16/2028(b) |
|
|
|
|
|
|
400 |
|
|
|
402,000 |
|
|
|
|
|
|
|
|
|
|
|
|
|
|
|
|
|
|
|
|
|
|
|
|
|
1,318,400 |
|
|
|
|
|
|
|
|
|
|
|
|
|
|
| Finance – 0.0% |
|
|
|
|
|
|
|
|
|
|
|
|
| Global Aircraft Leasing Co., Ltd.
6.50% (6.50% Cash or 7.25% PIK),
09/15/2024(b)(g) |
|
|
|
|
|
|
188 |
|
|
|
179,443 |
|
|
|
|
|
|
|
|
|
|
|
|
|
|
|
|
|
|
| Other Finance – 0.0% |
|
|
|
|
|
|
|
|
|
|
|
|
| OEC Finance Ltd.
4.375%,
10/25/2029(a)(b)(g) |
|
|
|
|
|
|
207 |
|
|
|
8,288 |
|
| 5.25%, 12/27/2033(a)(b)(g) |
|
|
|
|
|
|
669 |
|
|
|
26,773 |
|
| 7.125%, 12/26/2046(a)(b)(g) |
|
|
|
|
|
|
1,852 |
|
|
|
128,111 |
|
|
|
|
|
|
|
|
|
|
|
|
|
|
|
|
|
|
|
|
|
|
|
|
|
163,172 |
|
|
|
|
|
|
|
|
|
|
|
|
|
|
|
|
|
|
|
| abfunds.com |
|
ALLIANCEBERNSTEIN GLOBAL HIGH INCOME FUND | 55 |
PORTFOLIO OF INVESTMENTS (continued)
|
|
|
|
|
|
|
|
|
|
|
|
|
| |
|
|
|
|
Principal
Amount
(000) |
|
|
U.S. $ Value |
|
| |
|
| REITs – 0.0% |
|
|
|
|
|
|
|
|
|
|
|
|
| China Aoyuan Group Ltd.
5.375%,
09/13/2022(b)(d)(e) |
|
|
U.S.$ |
|
|
|
247 |
|
|
$
|
3,705 |
|
| 5.88%, 03/01/2027(b)(e)(k) |
|
|
|
|
|
|
306 |
|
|
|
4,590 |
|
| Yango Justice International Ltd.
8.25%,
11/25/2023(b)(e)(k) |
|
|
|
|
|
|
414 |
|
|
|
4,140 |
|
|
|
|
|
|
|
|
|
|
|
|
|
|
|
|
|
|
|
|
|
|
|
|
|
12,435 |
|
|
|
|
|
|
|
|
|
|
|
|
|
|
|
|
|
|
|
|
|
|
|
|
|
1,673,450 |
|
|
|
|
|
|
|
|
|
|
|
|
|
|
| Total Emerging Markets – Corporate Bonds
(cost $62,650,267) |
|
|
|
|
|
|
|
|
|
|
48,391,028 |
|
|
|
|
|
|
|
|
|
|
|
|
|
|
|
|
|
|
|
|
|
|
|
|
|
|
|
| COLLATERALIZED LOAN OBLIGATIONS – 5.0% |
|
|
|
|
|
|
|
|
|
|
|
|
| CLO - Floating Rate – 5.0% |
|
|
|
|
|
|
|
|
|
|
|
|
| AMMC CLO 25 Ltd.
Series 2022-25A, Class E
12.898%
(SOFR + 7.59%), 04/15/2035(b)(j) |
|
|
|
|
|
|
5,000 |
|
|
|
4,740,230 |
|
| Ares XXXIV CLO Ltd.
Series 2015-2A, Class CR
7.57%
(SOFR + 2.26%), 04/17/2033(b)(j) |
|
|
|
|
|
|
2,358 |
|
|
|
2,302,020 |
|
| Balboa Bay Loan Funding Ltd.
Series 2020-1A,
Class ER
11.995% (SOFR + 6.66%), 01/20/2032(b)(j) |
|
|
|
|
|
|
3,100 |
|
|
|
2,823,644 |
|
| Series 2021-2A, Class E
12.195% (SOFR + 6.86%), 01/20/2035(b)(j) |
|
|
|
|
|
|
1,000 |
|
|
|
896,173 |
|
| Series 2022-1A, Class E
13.256% (SOFR + 7.93%), 04/20/2034(b)(j) |
|
|
|
|
|
|
3,700 |
|
|
|
3,563,711 |
|
| Ballyrock CLO 15 Ltd.
Series 2021-1A, Class D
11.79%
(SOFR + 6.48%), 04/15/2034(b)(j) |
|
|
|
|
|
|
250 |
|
|
|
241,384 |
|
| Crown Point CLO 11 Ltd.
Series 2021-11A, Class E
12.38% (SOFR + 7.07%), 01/17/2034(b)(j) |
|
|
|
|
|
|
2,000 |
|
|
|
1,829,850 |
|
| Dryden 49 Senior Loan Fund
Series 2017-49A, Class E
11.872% (SOFR + 6.56%), 07/18/2030(b)(j) |
|
|
|
|
|
|
417 |
|
|
|
366,661 |
|
| Dryden 57 CLO Ltd.
Series 2018-57A, Class E
10.826%
(SOFR + 5.46%), 05/15/2031(b)(j) |
|
|
|
|
|
|
275 |
|
|
|
231,859 |
|
|
|
|
|
|
| 56 | ALLIANCEBERNSTEIN
GLOBAL HIGH INCOME FUND |
|
abfunds.com |
PORTFOLIO OF INVESTMENTS (continued)
|
|
|
|
|
|
|
|
|
|
|
| |
|
|
|
Principal
Amount
(000) |
|
|
U.S. $ Value |
|
| |
|
| Dryden 78 CLO Ltd.
Series 2020-78A, Class C
7.52% (SOFR
+ 2.21%), 04/17/2033(b)(j) |
|
U.S.$ |
|
|
3,000 |
|
|
$
|
2,965,272 |
|
| Series 2020-78A, Class D
8.57% (SOFR + 3.26%), 04/17/2033(b)(j) |
|
|
|
|
1,329 |
|
|
|
1,252,535 |
|
| Dryden 98 CLO Ltd.
Series 2022-98A, Class E
11.726%
(SOFR + 6.40%), 04/20/2035(b)(j) |
|
|
|
|
541 |
|
|
|
473,681 |
|
| Elevation CLO Ltd.
Series 2020-11A, Class C
7.77% (SOFR
+ 2.46%), 04/15/2033(b)(j) |
|
|
|
|
648 |
|
|
|
629,042 |
|
| Series 2020-11A, Class D1
9.42% (SOFR + 4.11%), 04/15/2033(b)(j) |
|
|
|
|
1,006 |
|
|
|
963,021 |
|
| Elmwood CLO IX Ltd.
Series 2021-2A, Class E
11.538%
(SOFR + 6.21%), 07/20/2034(b)(j) |
|
|
|
|
250 |
|
|
|
240,970 |
|
| Elmwood CLO VII Ltd.
Series 2020-4A, Class E
12.67%
(SOFR + 7.36%), 01/17/2034(b)(j) |
|
|
|
|
402 |
|
|
|
402,658 |
|
| Elmwood CLO VIII Ltd.
Series 2021-1A, Class E1
11.588%
(SOFR + 6.26%), 01/20/2034(b)(j) |
|
|
|
|
350 |
|
|
|
340,457 |
|
| Elmwood CLO XII Ltd.
Series 2021-5A, Class E
11.938%
(SOFR + 6.61%), 01/20/2035(b)(j) |
|
|
|
|
650 |
|
|
|
642,311 |
|
| Flatiron CLO 21 Ltd.
Series 2021-1A, Class E
11.582%
(LIBOR 3 Month + 6.00%),
07/19/2034(b)(j) |
|
|
|
|
400 |
|
|
|
384,202 |
|
| Galaxy 30 CLO Ltd.
Series 2022-30A, Class E
12.258%
(SOFR + 6.95%), 04/15/2035(b)(j) |
|
|
|
|
2,000 |
|
|
|
1,872,874 |
|
| Madison Park Funding LI Ltd.
Series 2021-51A, Class E
11.852% (SOFR + 6.53%), 07/19/2034(b)(j) |
|
|
|
|
250 |
|
|
|
229,797 |
|
| OCP CLO Ltd.
Series 2021-21A, Class E
11.868% (SOFR +
6.54%), 07/20/2034(b)(j) |
|
|
|
|
250 |
|
|
|
232,803 |
|
|
|
|
|
|
| abfunds.com |
|
ALLIANCEBERNSTEIN GLOBAL HIGH INCOME FUND | 57 |
PORTFOLIO OF INVESTMENTS (continued)
|
|
|
|
|
|
|
|
|
|
|
| |
|
|
|
Principal
Amount
(000) |
|
|
U.S. $ Value |
|
| |
|
| Octagon Investment Partners 29 Ltd.
Series 2016-1A,
Class DR
8.707% (SOFR + 3.36%), 01/24/2033(b)(j) |
|
U.S.$ |
|
|
1,701 |
|
|
$
|
1,633,568 |
|
| OZLM XXII Ltd.
Series 2018-22A, Class D
10.87% (SOFR +
5.56%), 01/17/2031(b)(j) |
|
|
|
|
349 |
|
|
|
282,463 |
|
| Palmer Square CLO Ltd.
Series 2021-1A, Class D
11.588%
(SOFR + 6.26%), 04/20/2034(b)(j) |
|
|
|
|
1,202 |
|
|
|
1,147,122 |
|
| Series 2021-3A, Class E
11.72% (SOFR + 6.41%), 01/15/2035(b)(j) |
|
|
|
|
4,100 |
|
|
|
3,974,872 |
|
| Rad CLO 4 Ltd.
Series 2019-4A, Class E
12.363% (SOFR +
7.01%), 04/25/2032(b)(j) |
|
|
|
|
585 |
|
|
|
566,606 |
|
| Rad CLO 10 Ltd.
Series 2021-10A, Class E
11.457% (SOFR
+ 6.11%), 04/23/2034(b)(j) |
|
|
|
|
750 |
|
|
|
675,289 |
|
| Rad CLO 11 Ltd.
Series 2021-11A, Class E
11.82% (SOFR
+ 6.51%), 04/15/2034(b)(j) |
|
|
|
|
355 |
|
|
|
331,817 |
|
| Regatta XIX Funding Ltd.
Series 2022-1A, Class E
12.206% (SOFR + 6.88%), 04/20/2035(b)(j) |
|
|
|
|
349 |
|
|
|
332,834 |
|
| Regatta XXIV Funding Ltd.
Series 2021-5A, Class E
12.388% (SOFR + 7.06%), 01/20/2035(b)(j) |
|
|
|
|
3,600 |
|
|
|
3,558,982 |
|
| Rockford Tower CLO Ltd.
Series 2019-1A, Class ER
11.908%
(SOFR + 6.58%), 04/20/2034(b)(j) |
|
|
|
|
250 |
|
|
|
211,913 |
|
| Series 2021-2A, Class E
11.988% (SOFR + 6.66%), 07/20/2034(b)(j) |
|
|
|
|
250 |
|
|
|
224,188 |
|
| Series 2021-3A, Class E
12.308% (SOFR + 6.98%), 10/20/2034(b)(j) |
|
|
|
|
1,062 |
|
|
|
931,834 |
|
| Sixth Street CLO XVIII Ltd.
Series 2021-18A, Class E
12.088% (SOFR + 6.76%), 04/20/2034(b)(j) |
|
|
|
|
1,238 |
|
|
|
1,199,146 |
|
|
|
|
|
|
| 58 | ALLIANCEBERNSTEIN
GLOBAL HIGH INCOME FUND |
|
abfunds.com |
PORTFOLIO OF INVESTMENTS (continued)
|
|
|
|
|
|
|
|
|
|
|
|
|
| |
|
|
|
|
Principal
Amount
(000) |
|
|
U.S. $ Value |
|
| |
|
| Sixth Street CLO XX Ltd.
Series 2021-20A, Class E
11.738% (SOFR + 6.41%), 10/20/2034(b)(j) |
|
|
U.S.$ |
|
|
|
679 |
|
|
$
|
657,359 |
|
| Trimaran Cavu Ltd.
Series 2019-1A, Class E
12.628%
(SOFR + 7.30%), 07/20/2032(b)(j) |
|
|
|
|
|
|
485 |
|
|
|
453,085 |
|
| Voya CLO Ltd.
Series 2019-1A, Class DR
8.42% (SOFR +
3.11%), 04/15/2031(b)(j) |
|
|
|
|
|
|
1,050 |
|
|
|
1,001,270 |
|
|
|
|
|
|
|
|
|
|
|
|
|
|
|
|
|
|
| Total Collateralized Loan Obligations
(cost $46,924,563) |
|
|
|
|
|
|
|
|
|
|
44,807,503 |
|
|
|
|
|
|
|
|
|
|
|
|
|
|
|
|
|
|
|
|
|
|
|
|
|
|
|
| COLLATERALIZED MORTGAGE OBLIGATIONS – 4.0% |
|
|
|
|
|
|
|
|
|
|
|
|
| Risk Share Floating Rate – 3.0% |
|
|
|
|
|
|
|
|
|
|
|
|
| Bellemeade Re Ltd.
Series 2019-3A, Class M1C
7.384%
(LIBOR 1 Month + 1.95%), 07/25/2029(b)(j) |
|
|
|
|
|
|
928 |
|
|
|
930,566 |
|
| Series 2019-4A, Class M2
8.284% (LIBOR 1 Month + 2.85%), 10/25/2029(b)(j) |
|
|
|
|
|
|
475 |
|
|
|
478,789 |
|
| Eagle Re Ltd.
Series 2018-1, Class M2
8.429% (LIBOR 1
Month + 3.00%), 11/25/2028(b)(j) |
|
|
|
|
|
|
2,764 |
|
|
|
2,771,066 |
|
| Federal Home Loan Mortgage Corp. Structured Agency Credit Risk Debt Notes
Series 2013-DN2, Class M2
9.679% (SOFR + 4.36%), 11/25/2023(j) |
|
|
|
|
|
|
702 |
|
|
|
704,843 |
|
| Series 2014-DN3, Class M3
9.429% (SOFR + 4.11%), 08/25/2024(j) |
|
|
|
|
|
|
33 |
|
|
|
33,214 |
|
| Series 2014-HQ2, Class M3
9.179% (SOFR + 3.86%), 09/25/2024(j) |
|
|
|
|
|
|
1,262 |
|
|
|
1,289,682 |
|
| Series 2015-DNA1, Class B
14.629% (SOFR + 9.31%),
10/25/2027(j) |
|
|
|
|
|
|
592 |
|
|
|
640,676 |
|
| Series 2015-DNA2, Class B
12.979% (SOFR + 7.66%),
12/25/2027(j) |
|
|
|
|
|
|
1,270 |
|
|
|
1,338,413 |
|
| Series 2015-DNA3, Class B
14.779% (SOFR + 9.46%),
04/25/2028(j) |
|
|
|
|
|
|
1,014 |
|
|
|
1,105,396 |
|
| Series 2015-HQA1, Class B
14.229% (SOFR + 8.91%),
03/25/2028(j) |
|
|
|
|
|
|
1,002 |
|
|
|
1,047,118 |
|
|
|
|
|
|
| abfunds.com |
|
ALLIANCEBERNSTEIN GLOBAL HIGH INCOME FUND | 59 |
PORTFOLIO OF INVESTMENTS (continued)
|
|
|
|
|
|
|
|
|
|
|
| |
|
|
|
Principal
Amount
(000) |
|
|
U.S. $ Value |
|
| |
|
| Series 2016-DNA2, Class B
15.929% (SOFR + 10.61%),
10/25/2028(j) |
|
U.S.$ |
|
|
853 |
|
|
$
|
961,627 |
|
| Series 2016-DNA3, Class B
16.679% (SOFR + 11.36%),
12/25/2028(j) |
|
|
|
|
2,743 |
|
|
|
3,155,265 |
|
| Series 2016-DNA4, Class B
14.029% (SOFR + 8.71%),
03/25/2029(j) |
|
|
|
|
392 |
|
|
|
428,768 |
|
| Series 2016-HQA2, Class B
16.929% (SOFR + 11.61%),
11/25/2028(j) |
|
|
|
|
420 |
|
|
|
483,975 |
|
| Series 2020-HQA2, Class M2
8.529% (SOFR + 3.21%),
03/25/2050(b)(j) |
|
|
|
|
34 |
|
|
|
35,466 |
|
| Federal National Mortgage Association Connecticut Avenue Securities
Series 2014-C01, Class M2
9.829% (SOFR + 4.51%), 01/25/2024(j) |
|
|
|
|
616 |
|
|
|
622,146 |
|
| Series 2015-C04, Class 1M2
11.129% (SOFR + 5.81%), 04/25/2028(j) |
|
|
|
|
938 |
|
|
|
1,000,736 |
|
| Series 2015-C04, Class 2M2
10.979% (SOFR + 5.66%), 04/25/2028(j) |
|
|
|
|
258 |
|
|
|
268,017 |
|
| Series 2016-C01, Class 1B
17.179% (SOFR + 11.86%), 08/25/2028(j) |
|
|
|
|
674 |
|
|
|
776,292 |
|
| Series 2016-C01, Class 2M2
12.379% (SOFR + 7.06%), 08/25/2028(j) |
|
|
|
|
130 |
|
|
|
136,988 |
|
| Series 2016-C02, Class 1B
17.679% (SOFR + 12.36%), 09/25/2028(j) |
|
|
|
|
446 |
|
|
|
524,238 |
|
| Series 2016-C02, Class 1M2
11.429% (SOFR + 6.11%), 09/25/2028(j) |
|
|
|
|
351 |
|
|
|
368,272 |
|
| Series 2016-C03, Class 1B
17.179% (SOFR + 11.86%), 10/25/2028(j) |
|
|
|
|
371 |
|
|
|
432,058 |
|
| Series 2016-C03, Class 2B
18.179% (SOFR + 12.86%), 10/25/2028(j) |
|
|
|
|
630 |
|
|
|
742,645 |
|
| Series 2016-C04, Class 1B
15.679% (SOFR + 10.36%), 01/25/2029(j) |
|
|
|
|
1,476 |
|
|
|
1,669,620 |
|
| Series 2016-C05, Class 2B
16.18% (SOFR + 10.86%), 01/25/2029(j) |
|
|
|
|
1,815 |
|
|
|
2,060,843 |
|
| Series 2016-C06, Class 1B
14.679% (SOFR + 9.36%), 04/25/2029(j) |
|
|
|
|
1,276 |
|
|
|
1,420,640 |
|
| Series 2016-C07, Class 2B
14.929% (SOFR + 9.61%), 05/25/2029(j) |
|
|
|
|
1,555 |
|
|
|
1,733,211 |
|
|
|
|
|
|
| 60 | ALLIANCEBERNSTEIN
GLOBAL HIGH INCOME FUND |
|
abfunds.com |
PORTFOLIO OF INVESTMENTS (continued)
|
|
|
|
|
|
|
|
|
|
|
|
|
| |
|
|
|
|
Principal
Amount
(000) |
|
|
U.S. $ Value |
|
| |
|
| JPMorgan Madison Avenue Securities Trust
Series 2015-CH1,
Class M2
10.929% (SOFR + 5.61%), 10/25/2025(h)(j) |
|
|
U.S.$ |
|
|
|
378 |
|
|
$
|
383,324 |
|
| Wells Fargo Credit Risk Transfer Securities Trust
Series
2015-WF1, Class 2M2
10.929% (SOFR + 5.61%), 11/25/2025(h)(j) |
|
|
|
|
|
|
122 |
|
|
|
125,733 |
|
|
|
|
|
|
|
|
|
|
|
|
|
|
|
|
|
|
|
|
|
|
|
|
|
27,669,627 |
|
|
|
|
|
|
|
|
|
|
|
|
|
|
| Non-Agency Fixed Rate – 0.4% |
|
|
|
|
|
|
|
|
|
|
|
|
| Alternative Loan Trust
Series 2006-24CB, Class A15
5.75%, 08/25/2036 |
|
|
|
|
|
|
489 |
|
|
|
258,592 |
|
| Series 2006-42, Class 1A6
6.00%, 01/25/2047 |
|
|
|
|
|
|
446 |
|
|
|
238,804 |
|
| Series 2006-HY12, Class A5
4.164%, 08/25/2036 |
|
|
|
|
|
|
494 |
|
|
|
448,600 |
|
| Series 2006-J1, Class 1A10
5.50%, 02/25/2036
|
|
|
|
|
|
|
535 |
|
|
|
366,743 |
|
| Series 2006-J5, Class 1A1
6.50%, 09/25/2036 |
|
|
|
|
|
|
480 |
|
|
|
262,746 |
|
| Bear Stearns ARM Trust
Series 2007-3, Class 1A1
3.882%,
05/25/2047 |
|
|
|
|
|
|
72 |
|
|
|
63,788 |
|
| Series 2007-4, Class 22A1
4.068%, 06/25/2047 |
|
|
|
|
|
|
292 |
|
|
|
259,010 |
|
| ChaseFlex Trust
Series 2007-1, Class 1A3
6.50%,
02/25/2037 |
|
|
|
|
|
|
401 |
|
|
|
141,713 |
|
| CHL Mortgage Pass-Through Trust
Series 2007-HY4, Class 1A1
4.163%, 09/25/2047 |
|
|
|
|
|
|
84 |
|
|
|
73,275 |
|
| Citigroup Mortgage Loan Trust
Series 2007-AR4, Class 1A1A
4.109%, 03/25/2037 |
|
|
|
|
|
|
45 |
|
|
|
37,746 |
|
| CitiMortgage Alternative Loan Trust
Series 2007-A3,
Class 1A4
5.75%, 03/25/2037 |
|
|
|
|
|
|
422 |
|
|
|
373,383 |
|
| Residential Accredit Loans, Inc. Trust
Series 2005-QS14, Class 3A1
6.00%, 09/25/2035 |
|
|
|
|
|
|
178 |
|
|
|
150,910 |
|
| Residential Asset Securitization Trust
Series 2006-A8,
Class 3A4
6.00%, 08/25/2036 |
|
|
|
|
|
|
126 |
|
|
|
58,140 |
|
|
|
|
|
|
| abfunds.com |
|
ALLIANCEBERNSTEIN GLOBAL HIGH INCOME FUND | 61 |
PORTFOLIO OF INVESTMENTS (continued)
|
|
|
|
|
|
|
|
|
|
|
|
|
| |
|
|
|
|
Principal
Amount
(000) |
|
|
U.S. $ Value |
|
| |
|
| Washington Mutual Mortgage Pass-Through Certificates Trust
Series
2006-9, Class A4
4.296%, 10/25/2036 |
|
|
U.S.$ |
|
|
|
1,219 |
|
|
$
|
335,307 |
|
| Wells Fargo Mortgage Backed Securities Trust
Series 2007-AR7,
Class A1
4.782%, 12/28/2037 |
|
|
|
|
|
|
284 |
|
|
|
243,057 |
|
|
|
|
|
|
|
|
|
|
|
|
|
|
|
|
|
|
|
|
|
|
|
|
|
3,311,814 |
|
|
|
|
|
|
|
|
|
|
|
|
|
|
| Non-Agency Floating Rate – 0.3% |
|
|
|
|
|
|
|
|
|
|
|
|
| Alternative Loan Trust
Series 2007-7T2, Class A3
6.00%
(SOFR + 0.71%), 04/25/2037(j) |
|
|
|
|
|
|
1,939 |
|
|
|
632,195 |
|
| CHL Mortgage Pass-Through Trust
Series 2007-13, Class A7
6.00% (SOFR + 0.71%), 08/25/2037(j) |
|
|
|
|
|
|
285 |
|
|
|
109,205 |
|
| First Horizon Alternative Mortgage Securities Trust
Series
2007-FA2, Class 1A6
0.116% (5.44% – SOFR), 04/25/2037(j)(m) |
|
|
|
|
|
|
71 |
|
|
|
3,825 |
|
| Series 2007-FA2, Class 1A10
5.684% (SOFR + 0.36%), 04/25/2037(j) |
|
|
|
|
|
|
209 |
|
|
|
49,449 |
|
| Lehman XS Trust
Series 2007-10H, Class 2AIO
1.556%
(6.89% – SOFR), 07/25/2037(j)(m) |
|
|
|
|
|
|
112 |
|
|
|
7,904 |
|
| Residential Accredit Loans, Inc. Trust
Series 2006-QS18, Class 2A2
1.116% (6.44% – SOFR),
12/25/2036(j)(m) |
|
|
|
|
|
|
1,705 |
|
|
|
140,553 |
|
| Wachovia Mortgage Loan Trust
Series 2006-ALT1, Class A2
1.502% (SOFR + 0.47%), 01/25/2037(j) |
|
|
|
|
|
|
5,034 |
|
|
|
1,852,698 |
|
|
|
|
|
|
|
|
|
|
|
|
|
|
|
|
|
|
|
|
|
|
|
|
|
2,795,829 |
|
|
|
|
|
|
|
|
|
|
|
|
|
|
| Agency Fixed Rate – 0.3% |
|
|
|
|
|
|
|
|
|
|
|
|
| Federal Home Loan Mortgage Corp.
Series 247, Class 54
5.50%, 04/15/2036(n) |
|
|
|
|
|
|
3,958 |
|
|
|
824,335 |
|
| Federal Home Loan Mortgage Corp. REMICs
Series 4767, Class KI
6.00%, 03/15/2048(n) |
|
|
|
|
|
|
8,851 |
|
|
|
1,779,185 |
|
|
|
|
|
|
|
|
|
|
|
|
|
|
|
|
|
|
|
|
|
|
|
|
|
2,603,520 |
|
|
|
|
|
|
|
|
|
|
|
|
|
|
| Total Collateralized Mortgage Obligations
(cost $39,113,807) |
|
|
|
|
|
|
|
|
|
|
36,380,790 |
|
|
|
|
|
|
|
|
|
|
|
|
|
|
|
|
|
|
|
| 62 | ALLIANCEBERNSTEIN
GLOBAL HIGH INCOME FUND |
|
abfunds.com |
PORTFOLIO OF INVESTMENTS (continued)
|
|
|
|
|
|
|
|
|
|
|
|
|
| |
|
|
|
|
Principal
Amount
(000) |
|
|
U.S. $ Value |
|
| |
|
| BANK LOANS – 3.8% |
|
|
|
|
|
|
|
|
|
|
|
|
| Industrial – 3.4% |
|
|
|
|
|
|
|
|
|
|
|
|
| Capital Goods – 0.3% |
|
|
|
|
|
|
|
|
|
|
|
|
| ACProducts Holdings, Inc.
9.902% (SOFR 3 Month + 4.25%), 05/17/2028(o) |
|
|
U.S.$ |
|
|
|
1,933 |
|
|
$
|
1,588,954 |
|
| Apex Tool Group, LLC
10.674% (SOFR 1 Month + 5.25%), 02/08/2029(o) |
|
|
|
|
|
|
1,039 |
|
|
|
944,342 |
|
| Chariot Buyer, LLC
8.666% (SOFR 1 Month + 3.25%), 11/03/2028(o) |
|
|
|
|
|
|
157 |
|
|
|
154,620 |
|
| TransDigm, Inc.
8.492% (SOFR 3 Month + 3.25%),
08/24/2028(o) |
|
|
|
|
|
|
293 |
|
|
|
291,877 |
|
|
|
|
|
|
|
|
|
|
|
|
|
|
|
|
|
|
2,979,793 |
|
|
|
|
|
|
|
|
|
|
|
|
|
|
| Communications - Media – 0.2% |
|
|
|
|
|
|
|
|
|
|
|
|
| Advantage Sales & Marketing, Inc.
9.943% (SOFR 1 Month + 4.50%), 10/28/2027(o) |
|
|
|
|
|
|
2 |
|
|
|
2,385 |
|
| 10.038% (SOFR 3 Month + 4.50%), 10/28/2027(o) |
|
|
|
|
|
|
1,699 |
|
|
|
1,633,512 |
|
| Clear Channel Outdoor Holdings, Inc.
8.931% (SOFR 1 Month + 3.50%), 08/21/2026(o) |
|
|
|
|
|
|
1 |
|
|
|
787 |
|
| 9.131% (SOFR 3 Month + 3.50%), 08/21/2026(o) |
|
|
|
|
|
|
312 |
|
|
|
302,276 |
|
| iHeartCommunications, Inc. (fka Clear Channel Communications, Inc.)
8.431% (SOFR 1 Month + 3.00%),
05/01/2026(o) |
|
|
|
|
|
|
355 |
|
|
|
318,071 |
|
|
|
|
|
|
|
|
|
|
|
|
|
|
|
|
|
|
2,257,031 |
|
|
|
|
|
|
|
|
|
|
|
|
|
|
| Communications - Telecommunications – 0.7% |
|
|
|
|
|
|
|
|
|
|
|
|
| Crown Subsea Communications Holding, Inc.
10.444% (SOFR 1 Month + 5.00%), 04/27/2027(o) |
|
|
|
|
|
|
1,515 |
|
|
|
1,517,118 |
|
| DIRECTV Financing, LLC
10.431% (SOFR 1 Month + 5.00%), 08/02/2027(o) |
|
|
|
|
|
|
574 |
|
|
|
560,287 |
|
| Proofpoint, Inc.
11.681% (SOFR 1 Month + 6.25%), 08/31/2029(o) |
|
|
|
|
|
|
2,480 |
|
|
|
2,482,331 |
|
|
|
|
|
|
| abfunds.com |
|
ALLIANCEBERNSTEIN GLOBAL HIGH INCOME FUND | 63 |
PORTFOLIO OF INVESTMENTS (continued)
|
|
|
|
|
|
|
|
|
|
|
|
|
| |
|
|
|
|
Principal
Amount
(000) |
|
|
U.S. $ Value |
|
| |
|
| Zacapa SARL
9.242% (SOFR 3 Month + 4.00%),
03/22/2029(o) |
|
|
U.S.$ |
|
|
|
2,116 |
|
|
$
|
2,097,032 |
|
|
|
|
|
|
|
|
|
|
|
|
|
|
|
|
|
|
6,656,768 |
|
|
|
|
|
|
|
|
|
|
|
|
|
|
| Consumer Cyclical - Automotive – 0.1% |
|
|
|
|
|
|
|
|
|
|
|
|
| Garret Motion SARL
9.869% (SOFR 3 Month + 4.50%), 04/30/2028(c)(o) |
|
|
|
|
|
|
340 |
|
|
|
340,000 |
|
| 10.131% (SOFR 3 Month + 4.50%), 04/30/2028(c)(o) |
|
|
|
|
|
|
510 |
|
|
|
510,000 |
|
|
|
|
|
|
|
|
|
|
|
|
|
|
|
|
|
|
850,000 |
|
|
|
|
|
|
|
|
|
|
|
|
|
|
| Consumer Cyclical - Restaurants – 0.0% |
|
|
|
|
|
|
|
|
|
|
|
|
| IRB Holding Corp.
8.431% (SOFR 1 Month + 3.00%), 12/15/2027(o) |
|
|
|
|
|
|
159 |
|
|
|
158,057 |
|
|
|
|
|
|
|
|
|
|
|
|
|
|
|
|
|
|
| Consumer Cyclical - Retailers – 0.1% |
|
|
|
|
|
|
|
|
|
|
|
|
| Great Outdoors Group, LLC
9.181% (SOFR 1 Month + 3.75%), 03/06/2028(o) |
|
|
|
|
|
|
473 |
|
|
|
471,604 |
|
|
|
|
|
|
|
|
|
|
|
|
|
|
|
|
|
|
| Consumer Non-Cyclical – 0.7% |
|
|
|
|
|
|
|
|
|
|
|
|
| Gainwell Acquisition Corp.
9.490% (SOFR 3 Month + 4.00%), 10/01/2027(o) |
|
|
|
|
|
|
1,206 |
|
|
|
1,174,619 |
|
| LifePoint Health, Inc. (fka Regionalcare Hospital Partners Holdings, Inc.)
9.377% (SOFR 3 Month +
3.75%), 11/16/2025(o) |
|
|
|
|
|
|
743 |
|
|
|
740,844 |
|
| PetSmart, LLC
9.166% (SOFR 1 Month + 3.75%),
02/11/2028(o) |
|
|
|
|
|
|
2,185 |
|
|
|
2,176,418 |
|
| US Radiology Specialists, Inc. (US Outpatient Imaging Services, Inc.)
10.740% (SOFR 3 Month + 5.25%),
12/15/2027(o) |
|
|
|
|
|
|
1,931 |
|
|
|
1,868,976 |
|
|
|
|
|
|
|
|
|
|
|
|
|
|
|
|
|
|
|
|
|
|
|
|
|
5,960,857 |
|
|
|
|
|
|
|
|
|
|
|
|
|
|
| Energy – 0.4% |
|
|
|
|
|
|
|
|
|
|
|
|
| GIP II Blue Holding, L.P.
9.946% (SOFR 1 Month + 4.50%), 09/29/2028(o) |
|
|
|
|
|
|
2,318 |
|
|
|
2,216,358 |
|
| Parkway Generation, LLC
10.180% (SOFR 1 Month + 4.75%), 02/18/2029(o) |
|
|
|
|
|
|
1,399 |
|
|
|
1,395,376 |
|
|
|
|
|
|
|
|
|
|
|
|
|
|
|
|
|
|
|
|
|
|
|
|
|
3,611,734 |
|
|
|
|
|
|
|
|
|
|
|
|
|
|
|
|
|
|
|
| 64 | ALLIANCEBERNSTEIN
GLOBAL HIGH INCOME FUND |
|
abfunds.com |
PORTFOLIO OF INVESTMENTS (continued)
|
|
|
|
|
|
|
|
|
|
|
|
|
| |
|
|
|
|
Principal
Amount
(000) |
|
|
U.S. $ Value |
|
| |
|
| Other Industrial – 0.3% |
|
|
|
|
|
|
|
|
|
|
|
|
| American Tire Distributors, Inc.
11.813% (SOFR 3 Month + 6.25%), 10/20/2028(o) |
|
|
U.S.$ |
|
|
|
2,087 |
|
|
$
|
1,818,275 |
|
| Dealer Tire Financial, LLC
9.816% (SOFR 1 Month + 4.50%), 12/14/2027(o) |
|
|
|
|
|
|
290 |
|
|
|
289,744 |
|
| FCG Acquisitions, Inc.
12.402% (SOFR 3 Month + 6.75%), 03/30/2029(c)(o) |
|
|
|
|
|
|
640 |
|
|
|
600,800 |
|
| Rockwood Service Corporation
9.431% (SOFR 1 Month + 4.00%), 01/23/2027(o) |
|
|
|
|
|
|
83 |
|
|
|
83,408 |
|
|
|
|
|
|
|
|
|
|
|
|
|
|
|
|
|
|
|
|
|
|
|
|
|
2,792,227 |
|
|
|
|
|
|
|
|
|
|
|
|
|
|
| Technology – 0.6% |
|
|
|
|
|
|
|
|
|
|
|
|
| Amentum Government Services Holdings, LLC
9.431% (SOFR 1 Month + 4.00%), 01/29/2027(o) |
|
|
|
|
|
|
310 |
|
|
|
306,634 |
|
| Ascend Learning, LLC
11.166% (SOFR 1 Month + 5.75%), 12/10/2029(o) |
|
|
|
|
|
|
840 |
|
|
|
713,647 |
|
| Banff Guarantor, Inc.
10.931% (SOFR 1 Month + 5.50%), 02/27/2026(o) |
|
|
|
|
|
|
690 |
|
|
|
685,936 |
|
| Boxer Parent Company, Inc.
9.181% (SOFR 1 Month + 3.75%), 10/02/2025(o) |
|
|
|
|
|
|
1,471 |
|
|
|
1,468,769 |
|
| FINThrive Software Intermediate Holdings, Inc.
12.196% (SOFR 1 Month + 6.75%), 12/17/2029(o) |
|
|
|
|
|
|
660 |
|
|
|
409,200 |
|
| Loyalty Ventures, Inc.
14.000% (PRIME 3 Month + 5.50%), 11/03/2027(c)(e)(k)(o) |
|
|
|
|
|
|
1,518 |
|
|
|
7,592 |
|
| Peraton Corp.
9.166% (SOFR 1 Month + 3.75%),
02/01/2028(o) |
|
|
|
|
|
|
611 |
|
|
|
608,875 |
|
| Presidio Holdings, Inc.
8.916% (SOFR 1 Month + 3.50%), 01/22/2027(c)(o) |
|
|
|
|
|
|
13 |
|
|
|
12,506 |
|
| 8.969% (SOFR 3 Month + 3.50%), 01/22/2027(c)(o) |
|
|
|
|
|
|
373 |
|
|
|
371,597 |
|
| Veritas US, Inc.
10.446% (SOFR 1 Month + 5.00%), 09/01/2025(o) |
|
|
|
|
|
|
573 |
|
|
|
493,506 |
|
|
|
|
|
|
|
|
|
|
|
|
|
|
|
|
|
|
|
|
|
|
|
|
|
5,078,262 |
|
|
|
|
|
|
|
|
|
|
|
|
|
|
|
|
|
|
|
|
|
|
|
|
|
30,816,333 |
|
|
|
|
|
|
|
|
|
|
|
|
|
|
|
|
|
|
|
| abfunds.com |
|
ALLIANCEBERNSTEIN GLOBAL HIGH INCOME FUND | 65 |
PORTFOLIO OF INVESTMENTS (continued)
|
|
|
|
|
|
|
|
|
|
|
|
|
| |
|
|
|
|
Principal
Amount
(000) |
|
|
U.S. $ Value |
|
| |
|
| Financial Institutions – 0.2% |
|
|
|
|
|
|
|
|
|
|
|
|
| Finance – 0.0% |
|
|
|
|
|
|
|
|
|
|
|
|
| Orbit Private Holdings I Ltd.
10.087% (SOFR 6 Month + 4.50%), 12/11/2028(o) |
|
|
U.S.$ |
|
|
|
236 |
|
|
$
|
236,488 |
|
|
|
|
|
|
|
|
|
|
|
|
|
|
|
|
|
|
| Insurance – 0.2% |
|
|
|
|
|
|
|
|
|
|
|
|
| Asurion, LLC
9.666% (SOFR 1 Month + 4.25%),
08/19/2028(o) |
|
|
|
|
|
|
1,652 |
|
|
|
1,602,149 |
|
|
|
|
|
|
|
|
|
|
|
|
|
|
|
|
|
|
|
|
|
|
|
|
|
1,838,637 |
|
|
|
|
|
|
|
|
|
|
|
|
|
|
| Utility – 0.2% |
|
|
|
|
|
|
|
|
|
|
|
|
| Electric – 0.2% |
|
|
|
|
|
|
|
|
|
|
|
|
| Granite Generation, LLC
9.181% (SOFR 1 Month + 3.75%), 11/09/2026(o) |
|
|
|
|
|
|
1,737 |
|
|
|
1,697,017 |
|
|
|
|
|
|
|
|
|
|
|
|
|
|
|
|
|
|
| Total Bank Loans
(cost $36,869,202) |
|
|
|
|
|
|
|
|
|
|
34,351,987 |
|
|
|
|
|
|
|
|
|
|
|
|
|
|
|
|
|
|
|
|
|
|
|
|
|
|
|
| EMERGING MARKETS - SOVEREIGNS – 2.3% |
|
|
|
|
|
|
|
|
|
|
|
|
| Angola – 0.3% |
|
|
|
|
|
|
|
|
|
|
|
|
| Angolan Government International Bond
8.00%,
11/26/2029(b) |
|
|
|
|
|
|
835 |
|
|
|
684,951 |
|
| 8.25%, 05/09/2028(b) |
|
|
|
|
|
|
200 |
|
|
|
172,740 |
|
| 9.50%, 11/12/2025(b) |
|
|
|
|
|
|
2,118 |
|
|
|
2,067,337 |
|
|
|
|
|
|
|
|
|
|
|
|
|
|
|
|
|
|
|
|
|
|
|
|
|
2,925,028 |
|
|
|
|
|
|
|
|
|
|
|
|
|
|
| Argentina – 0.1% |
|
|
|
|
|
|
|
|
|
|
|
|
| Argentine Republic Government International Bond
0.75%, 07/09/2030(a) |
|
|
|
|
|
|
199 |
|
|
|
56,875 |
|
| 1.00%, 07/09/2029 |
|
|
|
|
|
|
1,099 |
|
|
|
301,232 |
|
| 3.50%, 07/09/2041(a) |
|
|
|
|
|
|
562 |
|
|
|
144,781 |
|
| 3.625%, 07/09/2035(a) |
|
|
|
|
|
|
835 |
|
|
|
207,066 |
|
| 4.25%, 01/09/2038(a) |
|
|
|
|
|
|
1,323 |
|
|
|
387,124 |
|
|
|
|
|
|
|
|
|
|
|
|
|
|
|
|
|
|
|
|
|
|
|
|
|
1,097,078 |
|
|
|
|
|
|
|
|
|
|
|
|
|
|
| Dominican Republic – 0.7% |
|
|
|
|
|
|
|
|
|
|
|
|
| Dominican Republic International Bond
8.625%,
04/20/2027(b) |
|
|
|
|
|
|
5,719 |
|
|
|
5,889,655 |
|
|
|
|
|
|
|
|
|
|
|
|
|
|
|
|
|
|
| Ecuador – 0.0% |
|
|
|
|
|
|
|
|
|
|
|
|
| Ecuador Government International Bond
3.50%,
07/31/2035(a)(b) |
|
|
|
|
|
|
371 |
|
|
|
137,019 |
|
|
|
|
|
|
|
|
|
|
|
|
|
|
|
|
|
|
|
| 66 | ALLIANCEBERNSTEIN
GLOBAL HIGH INCOME FUND |
|
abfunds.com |
PORTFOLIO OF INVESTMENTS (continued)
|
|
|
|
|
|
|
|
|
|
|
|
|
| |
|
|
|
|
Principal
Amount
(000) |
|
|
U.S. $ Value |
|
| |
|
| Egypt – 0.2% |
|
| Egypt Government International Bond
8.50%,
01/31/2047(b) |
|
|
U.S.$ |
|
|
|
862 |
|
|
$
|
458,774 |
|
| 8.70%, 03/01/2049(b) |
|
|
|
|
|
|
611 |
|
|
|
326,836 |
|
| 8.875%, 05/29/2050(b)(i) |
|
|
|
|
|
|
1,096 |
|
|
|
591,675 |
|
|
|
|
|
|
|
|
|
|
|
|
|
|
|
|
|
|
|
|
|
|
|
|
|
1,377,285 |
|
|
|
|
|
|
|
|
|
|
|
|
|
|
| El Salvador – 0.2% |
|
| El Salvador Government International Bond
7.625%, 09/21/2034(b) |
|
|
|
|
|
|
762 |
|
|
|
526,290 |
|
| 7.625%, 02/01/2041(b) |
|
|
|
|
|
|
826 |
|
|
|
562,985 |
|
| 8.625%, 02/28/2029(b) |
|
|
|
|
|
|
860 |
|
|
|
700,866 |
|
|
|
|
|
|
|
|
|
|
|
|
|
|
|
|
|
|
|
|
|
|
|
|
|
1,790,141 |
|
|
|
|
|
|
|
|
|
|
|
|
|
|
| Gabon – 0.1% |
|
| Gabon Government International Bond
6.625%,
02/06/2031(b) |
|
|
|
|
|
|
574 |
|
|
|
425,150 |
|
|
|
|
|
|
|
|
|
|
|
|
|
|
|
| Nigeria – 0.4% |
|
| Nigeria Government International Bond
6.125%,
09/28/2028(b) |
|
|
|
|
|
|
2,789 |
|
|
|
2,216,530 |
|
| 6.50%, 11/28/2027(b) |
|
|
|
|
|
|
1,418 |
|
|
|
1,180,967 |
|
| 7.143%, 02/23/2030(b) |
|
|
|
|
|
|
721 |
|
|
|
567,672 |
|
|
|
|
|
|
|
|
|
|
|
|
|
|
|
|
|
|
|
|
|
|
|
|
|
3,965,169 |
|
|
|
|
|
|
|
|
|
|
|
|
|
|
| Senegal – 0.0% |
|
| Senegal Government International Bond
4.75%,
03/13/2028(b) |
|
|
EUR |
|
|
|
465 |
|
|
|
418,640 |
|
|
|
|
|
|
|
|
|
|
|
|
|
|
|
| Ukraine – 0.2% |
|
| Ukraine Government International Bond
7.253%,
03/15/2035(a)(b) |
|
|
U.S.$ |
|
|
|
1,886 |
|
|
|
493,189 |
|
| 7.375%, 09/25/2034(a)(b) |
|
|
|
|
|
|
1,164 |
|
|
|
304,386 |
|
| 7.75%, 09/01/2025(a)(b) |
|
|
|
|
|
|
3,507 |
|
|
|
1,148,543 |
|
|
|
|
|
|
|
|
|
|
|
|
|
|
|
|
|
|
|
|
|
|
|
|
|
1,946,118 |
|
|
|
|
|
|
|
|
|
|
|
|
|
|
| Venezuela – 0.1% |
|
| Venezuela Government International Bond
9.25%,
09/15/2027(e)(k) |
|
|
|
|
|
|
7,978 |
|
|
|
757,910 |
|
| 9.25%, 05/07/2028(b)(e)(k) |
|
|
|
|
|
|
300 |
|
|
|
28,500 |
|
|
|
|
|
|
|
|
|
|
|
|
|
|
|
|
|
|
|
|
|
|
|
|
|
786,410 |
|
|
|
|
|
|
|
|
|
|
|
|
|
|
| Total Emerging Markets – Sovereigns
(cost $34,191,285) |
|
|
|
|
|
|
|
|
|
|
20,757,693 |
|
|
|
|
|
|
|
|
|
|
|
|
|
|
|
|
|
|
|
|
| GOVERNMENTS - TREASURIES – 2.0% |
|
| United States – 2.0% |
|
| U.S. Treasury Bonds
2.75%, 11/15/2042(p) |
|
|
|
|
|
|
2,154 |
|
|
|
1,569,727 |
|
| 5.00%, 05/15/2037(p) |
|
|
|
|
|
|
1,824 |
|
|
|
1,891,830 |
|
|
|
|
|
|
| abfunds.com |
|
ALLIANCEBERNSTEIN GLOBAL HIGH INCOME FUND | 67 |
PORTFOLIO OF INVESTMENTS (continued)
|
|
|
|
|
|
|
|
|
|
|
|
|
| Company |
|
|
|
|
Principal
Amount
(000) |
|
|
U.S. $ Value |
|
| |
|
| 5.25%, 02/15/2029(q)(r) |
|
|
U.S.$ |
|
|
|
320 |
|
|
$
|
327,800 |
|
| 6.125%, 11/15/2027(q) |
|
|
|
|
|
|
1,000 |
|
|
|
1,051,563 |
|
| U.S. Treasury Notes
2.25%,
02/15/2027(q)(r) |
|
|
|
|
|
|
10,811 |
|
|
|
9,976,249 |
|
| 2.875%, 08/15/2028(q)(r) |
|
|
|
|
|
|
3,866 |
|
|
|
3,570,194 |
|
|
|
|
|
|
|
|
|
|
|
|
|
|
|
|
|
|
| Total Governments – Treasuries
(cost $19,867,587) |
|
|
|
|
|
|
|
|
|
|
18,387,363 |
|
|
|
|
|
|
|
|
|
|
|
|
|
|
|
|
|
|
|
|
| QUASI-SOVEREIGNS – 0.7% |
|
| Quasi-Sovereign Bonds – 0.7% |
|
| Mexico – 0.6% |
|
| Comision Federal de Electricidad
4.688%,
05/15/2029(b) |
|
|
|
|
|
|
650 |
|
|
|
581,750 |
|
| Petroleos Mexicanos
5.95%, 01/28/2031 |
|
|
|
|
|
|
3,174 |
|
|
|
2,259,888 |
|
| 6.49%, 01/23/2027 |
|
|
|
|
|
|
463 |
|
|
|
408,597 |
|
| 6.50%, 03/13/2027 |
|
|
|
|
|
|
355 |
|
|
|
311,305 |
|
| 6.70%, 02/16/2032 |
|
|
|
|
|
|
465 |
|
|
|
344,332 |
|
| 6.75%, 09/21/2047 |
|
|
|
|
|
|
2,113 |
|
|
|
1,237,426 |
|
|
|
|
|
|
|
|
|
|
|
|
|
|
|
|
|
|
|
|
|
|
|
|
|
5,143,298 |
|
|
|
|
|
|
|
|
|
|
|
|
|
|
| South Africa – 0.1% |
|
|
|
|
|
|
|
|
|
|
|
|
| Eskom Holdings SOC Ltd.
7.125%,
02/11/2025(b) |
|
|
|
|
|
|
237 |
|
|
|
230,611 |
|
| Transnet SOC Ltd.
8.25%, 02/06/2028(b) |
|
|
|
|
|
|
1,300 |
|
|
|
1,242,241 |
|
|
|
|
|
|
|
|
|
|
|
|
|
|
|
|
|
|
|
|
|
|
|
|
|
1,472,852 |
|
|
|
|
|
|
|
|
|
|
|
|
|
|
| Total Quasi-Sovereigns
(cost $7,396,719) |
|
|
|
|
|
|
|
|
|
|
6,616,150 |
|
|
|
|
|
|
|
|
|
|
|
|
|
|
|
|
|
|
| |
|
|
|
|
Shares |
|
|
|
|
| COMMON STOCKS – 0.6% |
|
|
|
|
|
|
|
|
|
|
|
|
| Consumer Staples – 0.2% |
|
|
|
|
|
|
|
|
|
|
|
|
| Household Products – 0.2% |
|
|
|
|
|
|
|
|
|
|
|
|
| Southeastern Grocers, Inc.(c)(e)(f) |
|
|
|
|
|
|
105,865 |
|
|
|
2,673,091 |
|
|
|
|
|
|
|
|
|
|
|
|
|
|
|
|
|
|
| Consumer Discretionary – 0.1% |
|
|
|
|
|
|
|
|
|
|
|
|
| Broadline Retail – 0.1% |
|
|
|
|
|
|
|
|
|
|
|
|
| ATD New Holdings, Inc.(c)(e) |
|
|
|
|
|
|
20,185 |
|
|
|
726,660 |
|
| K201640219 South Africa Ltd.
A Shares(c)(e)(f) |
|
|
|
|
|
|
12,695,187 |
|
|
|
13 |
|
| K201640219 South Africa Ltd.
B Shares(c)(e)(f) |
|
|
|
|
|
|
2,009,762 |
|
|
|
2 |
|
|
|
|
|
|
|
|
|
|
|
|
|
|
|
|
|
|
|
|
|
|
|
|
|
726,675 |
|
|
|
|
|
|
|
|
|
|
|
|
|
|
| Diversified Consumer Services – 0.0% |
|
|
|
|
|
|
|
|
|
|
|
|
| AG Tracker Series 2021-2A(c)(e)(f) |
|
|
|
|
|
|
78,082 |
|
|
|
– 0 |
– |
|
|
|
|
|
|
|
|
|
|
|
|
|
|
|
|
|
|
| 68 | ALLIANCEBERNSTEIN
GLOBAL HIGH INCOME FUND |
|
abfunds.com |
PORTFOLIO OF INVESTMENTS (continued)
|
|
|
|
|
|
|
|
|
|
|
|
|
| Company |
|
|
|
|
Shares |
|
|
U.S. $ Value |
|
| |
|
| Hotels, Restaurants & Leisure – 0.0% |
|
| Caesars Entertainment, Inc.(e) |
|
|
|
|
|
|
1,674 |
|
|
$
|
77,590 |
|
|
|
|
|
|
|
|
|
|
|
|
|
|
|
| Leisure Products – 0.0% |
|
| New Cotai LLC/New Cotai Capital
Corp.(c)(e)(f) |
|
|
|
|
|
|
3 |
|
|
|
– 0 |
– |
|
|
|
|
|
|
|
|
|
|
|
|
|
|
|
|
|
|
|
|
|
|
|
|
804,265 |
|
|
|
|
|
|
|
|
|
|
|
|
|
|
| Communication Services – 0.1% |
|
|
|
|
|
|
|
|
|
|
|
|
| Diversified Telecommunication Services – 0.0% |
|
|
|
|
|
|
|
|
|
|
|
|
| Intelsat Emergence SA(c)(e) |
|
|
|
|
|
|
15,697 |
|
|
|
331,207 |
|
| Intelsat Jackson Holdings SA(c)(e)(f) |
|
|
|
|
|
|
1,643 |
|
|
|
11,501 |
|
|
|
|
|
|
|
|
|
|
|
|
|
|
|
|
|
|
|
|
|
|
|
|
|
342,708 |
|
|
|
|
|
|
|
|
|
|
|
|
|
|
| Media – 0.1% |
|
|
|
|
|
|
|
|
|
|
|
|
| iHeartMedia, Inc. – Class A(e) |
|
|
|
|
|
|
25,545 |
|
|
|
80,722 |
|
| National CineMedia, Inc.(e) |
|
|
|
|
|
|
59,108 |
|
|
|
265,395 |
|
|
|
|
|
|
|
|
|
|
|
|
|
|
|
|
|
|
|
|
|
|
|
|
|
346,117 |
|
|
|
|
|
|
|
|
|
|
|
|
|
|
|
|
|
|
|
|
|
|
|
|
|
688,825 |
|
|
|
|
|
|
|
|
|
|
|
|
|
|
| Energy – 0.1% |
|
|
|
|
|
|
|
|
|
|
|
|
| Energy Equipment & Services – 0.0% |
|
|
|
|
|
|
|
|
|
|
|
|
| BIS Industries Holdings Ltd.(c)(e)(f) |
|
|
|
|
|
|
838,296 |
|
|
|
1 |
|
| CHC Group LLC(e) |
|
|
|
|
|
|
21,009 |
|
|
|
31 |
|
|
|
|
|
|
|
|
|
|
|
|
|
|
|
|
|
|
|
|
|
|
|
|
|
32 |
|
|
|
|
|
|
|
|
|
|
|
|
|
|
| Oil, Gas & Consumable Fuels – 0.1% |
|
|
|
|
|
|
|
|
|
|
|
|
| Berry Corp. |
|
|
|
|
|
|
37,000 |
|
|
|
303,400 |
|
| Civitas Resources, Inc. |
|
|
|
|
|
|
3,393 |
|
|
|
274,392 |
|
| Golden Energy Offshore Services AS(e) |
|
|
|
|
|
|
916,212 |
|
|
|
105,869 |
|
| SandRidge Energy, Inc. |
|
|
|
|
|
|
243 |
|
|
|
3,805 |
|
|
|
|
|
|
|
|
|
|
|
|
|
|
|
|
|
|
|
|
|
|
|
|
|
687,466 |
|
|
|
|
|
|
|
|
|
|
|
|
|
|
|
|
|
|
|
|
|
|
|
|
|
687,498 |
|
|
|
|
|
|
|
|
|
|
|
|
|
|
| Financials – 0.1% |
|
| Financial Services – 0.0% |
|
| Paysafe Ltd.(e) |
|
|
|
|
|
|
10,709 |
|
|
|
128,401 |
|
|
|
|
|
|
|
|
|
|
|
|
| Insurance – 0.1% |
|
| Mt Logan Re Ltd. Special Investment, Series 1, June 2022 –
Class U-2(c)(e)(f) |
|
|
|
|
|
|
100 |
|
|
|
72,075 |
|
| Mt Logan Re Ltd. Special Investment, Series 2, June 2022 –
Class U-2(c)(e)(f) |
|
|
|
|
|
|
441 |
|
|
|
317,338 |
|
|
|
|
|
|
|
|
|
|
|
|
|
|
|
|
|
|
|
|
|
|
389,413 |
|
|
|
|
|
|
|
|
|
|
|
|
|
|
|
|
|
|
|
|
|
|
517,814 |
|
|
|
|
|
|
|
|
|
|
|
|
|
|
| Industrials – 0.0% |
|
| Electrical Equipment – 0.0% |
|
| Exide Corp.(c)(e)(f) |
|
|
|
|
|
|
643 |
|
|
|
217,334 |
|
|
|
|
|
|
|
|
|
|
|
|
|
|
|
|
| abfunds.com |
|
ALLIANCEBERNSTEIN GLOBAL HIGH INCOME FUND | 69 |
PORTFOLIO OF INVESTMENTS (continued)
|
|
|
|
|
|
|
|
|
|
|
|
|
| Company |
|
|
|
|
Shares |
|
|
U.S. $ Value |
|
| |
|
| Information Technology – 0.0% |
|
| IT Services – 0.0% |
|
| GOLO Mobile, Inc.(c)(e)(f) |
|
|
|
|
|
|
38,543 |
|
|
$
|
– 0 |
– |
|
|
|
|
|
|
|
|
|
|
|
|
|
|
| Total Common Stocks
(cost $15,532,887) |
|
|
|
|
|
|
|
|
|
|
5,588,827 |
|
|
|
|
|
|
|
|
|
|
|
| |
|
|
|
|
Principal
Amount
(000) |
|
|
|
|
| COMMERCIAL MORTGAGE-BACKED SECURITIES – 0.6% |
|
|
|
|
|
|
|
|
|
|
|
|
| Non-Agency Fixed Rate CMBS – 0.6% |
|
| Citigroup Commercial Mortgage Trust
Series 2013-GC17, Class D
5.228%, 11/10/2046(b) |
|
|
U.S.$ |
|
|
|
902 |
|
|
|
799,046 |
|
| Commercial Mortgage Trust
Series 2012-CR3,
Class F
4.75%, 10/15/2045(b) |
|
|
|
|
|
|
20 |
|
|
|
1,008 |
|
| Series 2012-CR3, Class XA
1.022%, 10/15/2045(n) |
|
|
|
|
|
|
55 |
|
|
|
3 |
|
| Series 2013-LC6, Class D
4.14%, 01/10/2046(b) |
|
|
|
|
|
|
2,016 |
|
|
|
1,853,600 |
|
| Series 2014-CR15, Class XA
0.708%, 02/10/2047(n) |
|
|
|
|
|
|
1,068 |
|
|
|
30 |
|
| Series 2014-CR20, Class XA
1.074%, 11/10/2047(n) |
|
|
|
|
|
|
8,230 |
|
|
|
47,029 |
|
| WF-RBS Commercial Mortgage Trust
Series 2011-C4, Class D
4.993%, 06/15/2044(b) |
|
|
|
|
|
|
1,022 |
|
|
|
837,777 |
|
| Series 2014-C25, Class D
3.803%, 11/15/2047(b) |
|
|
|
|
|
|
1,807 |
|
|
|
1,521,378 |
|
|
|
|
|
|
|
|
|
|
|
|
|
|
|
|
|
|
|
|
|
|
|
|
|
5,059,871 |
|
|
|
|
|
|
|
|
|
|
|
|
|
|
| Non-Agency Floating Rate CMBS – 0.0% |
|
|
|
|
|
|
|
|
|
|
|
|
| Morgan Stanley Capital I Trust
Series 2019-BPR, Class E
10.672% (SOFR + 5.34%), 05/15/2036(b)(j) |
|
|
|
|
|
|
301 |
|
|
|
264,178 |
|
|
|
|
|
|
|
|
|
|
|
|
|
|
|
|
|
|
| Total Commercial Mortgage-Backed Securities
(cost $5,860,694) |
|
|
|
|
|
|
|
|
|
|
5,324,049 |
|
|
|
|
|
|
|
|
|
|
|
|
|
|
|
|
|
|
|
|
|
|
|
|
|
|
|
|
|
|
|
|
| 70 | ALLIANCEBERNSTEIN
GLOBAL HIGH INCOME FUND |
|
abfunds.com |
PORTFOLIO OF INVESTMENTS (continued)
|
|
|
|
|
|
|
|
|
|
|
|
|
| |
|
|
|
|
Principal
Amount
(000) |
|
|
U.S. $ Value |
|
| |
|
| LOCAL GOVERNMENTS - US MUNICIPAL BONDS – 0.4% |
|
|
|
|
|
|
|
|
|
|
|
|
| United States – 0.4% |
|
|
|
|
|
|
|
|
|
|
|
|
| State of California
Series 2010
7.60%, 11/01/2040 |
|
|
U.S.$ |
|
|
|
750 |
|
|
$
|
885,744 |
|
| State of Illinois
Series 2010
7.35%, 07/01/2035 |
|
|
|
|
|
|
1,641 |
|
|
|
1,709,706 |
|
| Wisconsin Public Finance Authority
(Catholic Bishop of Chicago (The))
Series 2021
5.75%,
07/25/2041(h) |
|
|
|
|
|
|
1,435 |
|
|
|
1,189,660 |
|
|
|
|
|
|
|
|
|
|
|
|
|
|
|
|
|
|
| Total Local Governments – US Municipal Bonds
(cost $3,836,729) |
|
|
|
|
|
|
|
|
|
|
3,785,110 |
|
|
|
|
|
|
|
|
|
|
|
|
|
|
|
|
|
|
|
|
|
|
|
|
|
|
|
| INFLATION-LINKED SECURITIES – 0.2% |
|
|
|
|
|
|
|
|
|
|
|
|
| Colombia – 0.2% |
|
|
|
|
|
|
|
|
|
|
|
|
| Fideicomiso PA Concesion Ruta al Mar
6.75%,
02/15/2044(h) |
|
|
COP |
|
|
|
1,437,090 |
|
|
|
228,945 |
|
| Fideicomiso PA Costera
6.25%,
01/15/2034(h) |
|
|
|
|
|
|
1,230,800 |
|
|
|
279,162 |
|
| Fideicomiso PA Pacifico Tres
7.00%,
01/15/2035(h) |
|
|
|
|
|
|
6,642,880 |
|
|
|
1,355,424 |
|
|
|
|
|
|
|
|
|
|
|
|
|
|
|
|
|
|
| Total Inflation-Linked Securities
(cost $2,848,726) |
|
|
|
|
|
|
|
|
|
|
1,863,531 |
|
|
|
|
|
|
|
|
|
|
|
|
|
|
|
|
|
|
|
|
|
|
|
|
|
|
|
| ASSET-BACKED SECURITIES – 0.2% |
|
|
|
|
|
|
|
|
|
|
|
|
| Autos - Fixed Rate – 0.1% |
|
|
|
|
|
|
|
|
|
|
|
|
| Flagship Credit Auto Trust
Series 2019-4, Class E
4.11%, 03/15/2027(b) |
|
|
U.S.$ |
|
|
|
770 |
|
|
|
729,206 |
|
|
|
|
|
|
|
|
|
|
|
|
|
|
|
|
|
|
| Other ABS - Fixed Rate – 0.1% |
|
|
|
|
|
|
|
|
|
|
|
|
| Consumer Loan Underlying Bond Club Certificate Issuer Trust I
Series
2018-12, Class PT
0.00%, 06/15/2043(e)(h) |
|
|
|
|
|
|
0 |
** |
|
|
348 |
|
| Series 2019-24, Class PT
10.385%, 08/15/2044(h) |
|
|
|
|
|
|
19 |
|
|
|
18,406 |
|
| Series 2019-36, Class PT
12.824%, 10/17/2044(h) |
|
|
|
|
|
|
40 |
|
|
|
38,550 |
|
|
|
|
|
|
| abfunds.com |
|
ALLIANCEBERNSTEIN GLOBAL HIGH INCOME FUND | 71 |
PORTFOLIO OF INVESTMENTS (continued)
|
|
|
|
|
|
|
|
|
|
|
|
|
| |
|
|
|
|
Principal
Amount
(000) |
|
|
U.S. $ Value |
|
| |
|
| Pagaya AI Debt Trust
Series 2022-6, Class A1
6.159%,
05/15/2030(b)(c) |
|
|
U.S.$ |
|
|
|
284 |
|
|
$
|
283,995 |
|
| Series 2022-6, Class A2
6.811%, 05/15/2030(b)(c) |
|
|
|
|
|
|
142 |
|
|
|
141,872 |
|
| Series 2022-6, Class A3
7.656%, 05/15/2030(b)(c) |
|
|
|
|
|
|
176 |
|
|
|
175,207 |
|
|
|
|
|
|
|
|
|
|
|
|
|
|
|
|
|
|
|
|
|
|
|
|
|
658,378 |
|
|
|
|
|
|
|
|
|
|
|
|
|
|
| Other ABS - Floating Rate – 0.0% |
|
|
|
|
|
|
|
|
|
|
|
|
| Pagaya AI Debt Trust
Series 2022-6, Class A4
55.042%,
05/15/2030(b)(c) |
|
|
|
|
|
|
62 |
|
|
|
79,458 |
|
|
|
|
|
|
|
|
|
|
|
|
|
|
|
|
|
|
| Total Asset-Backed Securities
(cost $1,498,687) |
|
|
|
|
|
|
|
|
|
|
1,467,042 |
|
|
|
|
|
|
|
|
|
|
|
|
|
|
|
|
|
|
| |
|
|
|
|
Shares |
|
|
|
|
| PREFERRED STOCKS – 0.1% |
|
|
|
|
|
|
|
|
|
|
|
|
| Industrial – 0.1% |
|
|
|
|
|
|
|
|
|
|
|
|
| Other Industrial – 0.1% |
|
|
|
|
|
|
|
|
|
|
|
|
| WESCO International, Inc.
Series A
10.625%(e)
(cost $948,963) |
|
|
|
|
|
|
35,175 |
|
|
|
928,972 |
|
|
|
|
|
|
|
|
|
|
|
|
|
|
|
|
|
|
| |
|
|
|
|
Principal
Amount
(000) |
|
|
|
|
| GOVERNMENTS - SOVEREIGN BONDS – 0.1% |
|
|
|
|
|
|
|
|
|
|
|
|
| Colombia – 0.1% |
|
|
|
|
|
|
|
|
|
|
|
|
| Colombia Government International Bond
4.125%, 05/15/2051
(cost $1,044,765) |
|
|
U.S.$ |
|
|
|
1,058 |
|
|
|
587,191 |
|
|
|
|
|
|
|
|
|
|
|
|
|
|
|
|
|
|
| |
|
|
|
|
Notional
Amount |
|
|
|
|
| PURCHASED OPTIONS - PUTS – 0.1% |
|
|
|
|
|
|
|
|
|
|
|
|
| Options on Indices – 0.1% |
|
|
|
|
|
|
|
|
|
|
|
|
| S&P 500 Index
Expiration: Nov 2023; Contracts: 74;
Exercise Price: USD 4,220.00;
Counterparty: UBS AG(e)
(premiums paid $308,804) |
|
|
USD |
|
|
|
31,228,000 |
|
|
|
475,820 |
|
|
|
|
|
|
|
|
|
|
|
|
|
|
|
|
|
|
|
| 72 | ALLIANCEBERNSTEIN
GLOBAL HIGH INCOME FUND |
|
abfunds.com |
PORTFOLIO OF INVESTMENTS (continued)
|
|
|
|
|
|
|
|
|
|
|
|
|
| |
|
|
|
|
Shares |
|
|
U.S. $ Value |
|
| |
|
| RIGHTS – 0.0% |
|
| Intelsat Jackson Holdings SA,
Series B, expiring
12/31/2049(c)(e)(f) |
|
|
|
|
|
|
1,643 |
|
|
$
|
– 0 |
– |
| Vistra Energy
Corp.,
expiring 12/31/2049(c)(e) |
|
|
|
|
|
|
10,721 |
|
|
|
12,490 |
|
|
|
|
|
|
|
|
|
|
|
|
|
|
|
|
|
|
| Total Rights
(cost $0) |
|
|
|
|
|
|
|
|
|
|
12,490 |
|
|
|
|
|
|
|
|
|
|
|
|
|
|
|
| |
|
|
|
|
Principal
Amount
(000) |
|
|
|
|
| SHORT-TERM INVESTMENTS – 1.5% |
|
|
|
|
|
|
|
|
|
|
|
|
| Time Deposits – 1.1% |
|
|
|
|
|
|
|
|
|
|
|
|
| BBH, Grand Cayman
6.21%, 10/02/2023 |
|
|
ZAR |
|
|
|
21 |
|
|
|
1,115 |
|
| Citibank, New York
4.68%, 10/02/2023 |
|
|
U.S.$ |
|
|
|
3,424 |
|
|
|
3,423,942 |
|
| Royal Bank of Canada, Toronto
3.80%, 10/03/2023 |
|
|
CAD |
|
|
|
839 |
|
|
|
617,653 |
|
| SEB, Stockholm
2.81%, 10/02/2023 |
|
|
EUR |
|
|
|
4,279 |
|
|
|
4,524,203 |
|
| 4.17%, 10/02/2023 |
|
|
GBP |
|
|
|
1,285 |
|
|
|
1,568,132 |
|
|
|
|
|
|
|
|
|
|
|
|
|
|
|
|
|
|
| Total Time Deposits
(cost $10,135,045) |
|
|
|
|
|
|
|
|
|
|
10,135,045 |
|
|
|
|
|
|
|
|
|
|
|
|
|
|
|
|
|
|
| |
|
|
|
|
Shares |
|
|
|
|
| Investment Companies – 0.4% |
|
|
|
|
|
|
|
|
|
|
|
|
| AB Fixed Income Shares, Inc. – Government Money Market Portfolio – Class AB, 5.25%(s)(t)(u)
(cost $3,838,235) |
|
|
|
|
|
|
3,838,235 |
|
|
|
3,838,235 |
|
|
|
|
|
|
|
|
|
|
|
|
|
|
|
|
|
|
| Total Short-Term Investments
(cost $13,973,280) |
|
|
|
|
|
|
|
|
|
|
13,973,280 |
|
|
|
|
|
|
|
|
|
|
|
| Total Investments – 99.9%
(cost $1,020,839,227) |
|
|
|
|
|
|
|
|
|
|
906,483,118 |
|
| Other assets less liabilities – 0.1% |
|
|
|
|
|
|
|
|
|
|
1,209,797 |
|
|
|
|
|
|
|
|
|
|
|
| Net Assets – 100.0% |
|
|
|
|
|
|
|
|
|
$ |
907,692,915 |
|
|
|
|
|
|
|
|
|
|
|
|
| abfunds.com |
|
ALLIANCEBERNSTEIN GLOBAL HIGH INCOME FUND | 73 |
PORTFOLIO OF INVESTMENTS (continued)
FUTURES (see
Note C)
|
|
|
|
|
|
|
|
|
|
|
|
|
|
|
|
|
| Description |
|
Number of
Contracts |
|
|
Expiration
Month |
|
|
Current
Notional |
|
|
Value and
Unrealized
Appreciation
(Depreciation) |
|
| Purchased Contracts |
|
|
|
|
|
|
|
|
|
|
|
|
|
|
|
|
| U.S. 10 Yr Ultra Futures |
|
|
97 |
|
|
|
December 2023 |
|
|
$ |
10,821,563 |
|
|
$ |
(304,453 |
) |
| U.S. Long Bond (CBT) Futures |
|
|
50 |
|
|
|
December 2023 |
|
|
|
5,689,063 |
|
|
|
(316,766 |
) |
| U.S. T-Note 5 Yr (CBT) Futures |
|
|
650 |
|
|
|
December 2023 |
|
|
|
68,483,594 |
|
|
|
(651,531 |
) |
| U.S. T-Note 10 Yr (CBT) Futures |
|
|
85 |
|
|
|
December 2023 |
|
|
|
9,185,313 |
|
|
|
(161,531 |
) |
|
|
|
|
|
|
|
|
|
|
|
|
|
|
|
|
|
|
|
|
$ |
(1,434,281 |
) |
|
|
|
|
|
|
|
|
|
|
|
|
|
|
|
|
|
FORWARD CURRENCY EXCHANGE CONTRACTS (see Note C)
|
|
|
|
|
|
|
|
|
|
|
|
|
|
|
|
|
|
|
|
|
| Counterparty |
|
Contracts to
Deliver
(000) |
|
|
In Exchange
For
(000) |
|
|
Settlement
Date |
|
|
Unrealized
Appreciation
(Depreciation) |
|
| Bank of America, NA |
|
BRL |
|
|
98 |
|
|
USD |
|
|
20 |
|
|
|
10/03/2023 |
|
|
$ |
175 |
|
| Bank of America, NA |
|
USD |
|
|
20 |
|
|
BRL |
|
|
98 |
|
|
|
10/03/2023 |
|
|
|
(74 |
) |
| Bank of America, NA |
|
USD |
|
|
20 |
|
|
BRL |
|
|
98 |
|
|
|
11/03/2023 |
|
|
|
(175 |
) |
| Bank of America, NA |
|
USD |
|
|
39 |
|
|
INR |
|
|
3,258 |
|
|
|
12/14/2023 |
|
|
|
66 |
|
| BNP Paribas SA |
|
EUR |
|
|
974 |
|
|
USD |
|
|
1,032 |
|
|
|
10/12/2023 |
|
|
|
1,217 |
|
| BNP Paribas SA |
|
IDR |
|
|
627,900 |
|
|
USD |
|
|
42 |
|
|
|
10/12/2023 |
|
|
|
1,014 |
|
| BNP Paribas SA |
|
USD |
|
|
35 |
|
|
IDR |
|
|
530,686 |
|
|
|
10/12/2023 |
|
|
|
(1,008 |
) |
| BNP Paribas SA |
|
KRW |
|
|
41,966 |
|
|
USD |
|
|
33 |
|
|
|
10/26/2023 |
|
|
|
1,757 |
|
| BNP Paribas SA |
|
USD |
|
|
35 |
|
|
KRW |
|
|
45,179 |
|
|
|
10/26/2023 |
|
|
|
(1,414 |
) |
| BNP Paribas SA |
|
COP |
|
|
13,572,390 |
|
|
USD |
|
|
3,329 |
|
|
|
11/16/2023 |
|
|
|
43,522 |
|
| BNP Paribas SA |
|
PEN |
|
|
247 |
|
|
USD |
|
|
66 |
|
|
|
11/16/2023 |
|
|
|
1,215 |
|
| BNP Paribas SA |
|
USD |
|
|
84 |
|
|
COP |
|
|
341,003 |
|
|
|
11/16/2023 |
|
|
|
(1,093 |
) |
| Brown Brothers Harriman & Co. |
|
EUR |
|
|
1,066 |
|
|
USD |
|
|
1,147 |
|
|
|
10/12/2023 |
|
|
|
19,652 |
|
| Brown Brothers Harriman & Co. |
|
USD |
|
|
1,126 |
|
|
EUR |
|
|
1,071 |
|
|
|
10/12/2023 |
|
|
|
6,704 |
|
| Brown Brothers Harriman & Co. |
|
USD |
|
|
1,407 |
|
|
EUR |
|
|
1,326 |
|
|
|
10/12/2023 |
|
|
|
(5,121 |
) |
| Brown Brothers Harriman & Co. |
|
JPY |
|
|
10,218 |
|
|
USD |
|
|
70 |
|
|
|
10/19/2023 |
|
|
|
1,442 |
|
| Brown Brothers Harriman & Co. |
|
USD |
|
|
99 |
|
|
JPY |
|
|
14,299 |
|
|
|
10/19/2023 |
|
|
|
(2,877 |
) |
| Brown Brothers Harriman & Co. |
|
CAD |
|
|
151 |
|
|
USD |
|
|
112 |
|
|
|
10/27/2023 |
|
|
|
622 |
|
| Brown Brothers Harriman & Co. |
|
NZD |
|
|
23 |
|
|
USD |
|
|
14 |
|
|
|
10/27/2023 |
|
|
|
(121 |
) |
| Brown Brothers Harriman & Co. |
|
USD |
|
|
32 |
|
|
CAD |
|
|
43 |
|
|
|
10/27/2023 |
|
|
|
221 |
|
| Brown Brothers Harriman & Co. |
|
USD |
|
|
33 |
|
|
NZD |
|
|
55 |
|
|
|
10/27/2023 |
|
|
|
83 |
|
| Brown Brothers Harriman & Co. |
|
USD |
|
|
75 |
|
|
ZAR |
|
|
1,443 |
|
|
|
11/06/2023 |
|
|
|
590 |
|
| Brown Brothers Harriman & Co. |
|
ZAR |
|
|
596 |
|
|
USD |
|
|
32 |
|
|
|
11/06/2023 |
|
|
|
359 |
|
| Brown Brothers Harriman & Co. |
|
AUD |
|
|
59 |
|
|
USD |
|
|
38 |
|
|
|
11/08/2023 |
|
|
|
(264 |
) |
| Brown Brothers Harriman & Co. |
|
USD |
|
|
83 |
|
|
AUD |
|
|
128 |
|
|
|
11/08/2023 |
|
|
|
(541 |
) |
| Brown Brothers Harriman & Co. |
|
CHF |
|
|
40 |
|
|
USD |
|
|
44 |
|
|
|
11/16/2023 |
|
|
|
920 |
|
| Brown Brothers Harriman & Co. |
|
SGD |
|
|
93 |
|
|
USD |
|
|
69 |
|
|
|
11/16/2023 |
|
|
|
137 |
|
| Brown Brothers Harriman & Co. |
|
USD |
|
|
18 |
|
|
MXN |
|
|
305 |
|
|
|
11/16/2023 |
|
|
|
(282 |
) |
| Brown Brothers Harriman & Co. |
|
GBP |
|
|
46 |
|
|
USD |
|
|
57 |
|
|
|
11/17/2023 |
|
|
|
1,206 |
|
| Brown Brothers Harriman & Co. |
|
USD |
|
|
66 |
|
|
GBP |
|
|
54 |
|
|
|
11/17/2023 |
|
|
|
(25 |
) |
| Brown Brothers Harriman & Co. |
|
CZK |
|
|
852 |
|
|
USD |
|
|
37 |
|
|
|
11/29/2023 |
|
|
|
583 |
|
| Brown Brothers Harriman & Co. |
|
HUF |
|
|
8,969 |
|
|
USD |
|
|
24 |
|
|
|
11/29/2023 |
|
|
|
(118 |
) |
| Brown Brothers Harriman & Co. |
|
PLN |
|
|
88 |
|
|
USD |
|
|
21 |
|
|
|
11/29/2023 |
|
|
|
446 |
|
| Brown Brothers Harriman & Co. |
|
USD |
|
|
30 |
|
|
PLN |
|
|
131 |
|
|
|
11/29/2023 |
|
|
|
(65 |
) |
| Brown Brothers Harriman & Co. |
|
USD |
|
|
65 |
|
|
NOK |
|
|
701 |
|
|
|
12/07/2023 |
|
|
|
732 |
|
| Brown Brothers Harriman & Co. |
|
USD |
|
|
33 |
|
|
SEK |
|
|
358 |
|
|
|
12/07/2023 |
|
|
|
103 |
|
| Brown Brothers Harriman & Co. |
|
CNH |
|
|
249 |
|
|
USD |
|
|
34 |
|
|
|
01/11/2024 |
|
|
|
(45 |
) |
| Brown Brothers Harriman & Co. |
|
USD |
|
|
32 |
|
|
CNH |
|
|
231 |
|
|
|
01/11/2024 |
|
|
|
19 |
|
|
|
|
|
|
| 74 | ALLIANCEBERNSTEIN
GLOBAL HIGH INCOME FUND |
|
abfunds.com |
PORTFOLIO OF INVESTMENTS (continued)
|
|
|
|
|
|
|
|
|
|
|
|
|
|
|
|
|
|
|
|
|
|
|
|
|
| Counterparty |
|
Contracts to
Deliver
(000) |
|
|
In Exchange
For
(000) |
|
|
Settlement
Date |
|
|
Unrealized
Appreciation
(Depreciation) |
|
| Citibank, NA |
|
|
USD |
|
|
|
1,175 |
|
|
|
CAD |
|
|
|
1,589 |
|
|
|
10/27/2023 |
|
|
$
|
(4,478 |
) |
| Citibank, NA |
|
|
GBP |
|
|
|
2,985 |
|
|
|
USD |
|
|
|
3,721 |
|
|
|
11/17/2023 |
|
|
|
79,086 |
|
| Citibank, NA |
|
|
USD |
|
|
|
7 |
|
|
|
TWD |
|
|
|
237 |
|
|
|
11/29/2023 |
|
|
|
(88 |
) |
| Citibank, NA |
|
|
INR |
|
|
|
2,206 |
|
|
|
USD |
|
|
|
26 |
|
|
|
12/14/2023 |
|
|
|
(16 |
) |
| Citibank, NA |
|
|
USD |
|
|
|
33 |
|
|
|
CNH |
|
|
|
237 |
|
|
|
01/11/2024 |
|
|
|
(4 |
) |
| HSBC Bank USA |
|
|
USD |
|
|
|
31 |
|
|
|
KRW |
|
|
|
39,813 |
|
|
|
10/26/2023 |
|
|
|
(1,707 |
) |
| Morgan Stanley Capital Services LLC |
|
|
BRL |
|
|
|
98 |
|
|
|
USD |
|
|
|
20 |
|
|
|
10/03/2023 |
|
|
|
74 |
|
| Morgan Stanley Capital Services LLC |
|
|
USD |
|
|
|
20 |
|
|
|
BRL |
|
|
|
98 |
|
|
|
10/03/2023 |
|
|
|
(408 |
) |
| Morgan Stanley Capital Services LLC |
|
|
EUR |
|
|
|
43,552 |
|
|
|
USD |
|
|
|
48,027 |
|
|
|
10/12/2023 |
|
|
|
1,965,097 |
|
| Morgan Stanley Capital Services LLC |
|
|
USD |
|
|
|
7 |
|
|
|
IDR |
|
|
|
105,055 |
|
|
|
10/12/2023 |
|
|
|
(201 |
) |
| Morgan Stanley Capital Services LLC |
|
|
KRW |
|
|
|
45,732 |
|
|
|
USD |
|
|
|
36 |
|
|
|
10/26/2023 |
|
|
|
2,506 |
|
| Morgan Stanley Capital Services LLC |
|
|
USD |
|
|
|
58 |
|
|
|
CLP |
|
|
|
51,955 |
|
|
|
11/16/2023 |
|
|
|
376 |
|
| UBS AG |
|
|
USD |
|
|
|
31 |
|
|
|
IDR |
|
|
|
470,512 |
|
|
|
10/12/2023 |
|
|
|
(447 |
) |
| UBS AG |
|
|
KRW |
|
|
|
51,025 |
|
|
|
USD |
|
|
|
39 |
|
|
|
10/26/2023 |
|
|
|
796 |
|
| UBS AG |
|
|
CNH |
|
|
|
247 |
|
|
|
USD |
|
|
|
34 |
|
|
|
01/11/2024 |
|
|
|
16 |
|
|
|
|
|
|
|
|
|
|
|
|
|
|
|
|
|
|
|
|
|
|
|
|
|
|
|
|
|
|
|
|
|
|
|
|
|
|
|
|
|
|
|
|
|
|
|
|
$ |
2,110,164 |
|
|
|
|
|
|
|
|
|
|
|
|
|
|
|
|
|
|
|
|
|
|
|
|
|
|
PUT WRITTEN OPTIONS (see Note C)
|
|
|
|
|
|
|
|
|
|
|
|
|
|
|
|
|
|
|
|
|
|
|
|
|
| Description |
|
Counterparty |
|
Contracts |
|
Exercise
Price |
|
|
Expiration
Month |
|
|
Notional
(000) |
|
|
Premiums
Received |
|
|
U.S. $ Value |
|
| S&P 500 Index(v) |
|
UBS AG |
|
74 |
|
|
USD 3,980 |
|
|
|
November 2023 |
|
|
|
USD 29,452 |
|
|
$ |
179,004 |
|
|
$ |
(158,730 |
) |
CENTRALLY CLEARED CREDIT DEFAULT SWAPS (see Note C)
|
|
|
|
|
|
|
|
|
|
|
|
|
|
|
|
|
|
|
|
|
|
|
|
|
|
|
|
|
| Description |
|
Fixed
Rate
(Pay)
Receive |
|
|
Payment
Frequency |
|
|
Implied
Credit
Spread at
September 30,
2023 |
|
|
Notional
Amount
(000) |
|
|
Market
Value |
|
|
Upfront
Premiums
Paid
(Received) |
|
|
Unrealized
Appreciation
(Depreciation) |
|
| Sale Contracts |
|
|
|
|
|
|
|
|
|
|
|
|
|
|
|
|
|
|
|
|
|
|
|
|
|
| Brazilian Government International Bond, 4.250%, 01/07/2025, 12/20/2028* |
|
|
1.00 |
% |
|
|
Quarterly |
|
|
|
1.84 |
% |
|
USD |
320 |
|
|
$ |
(11,993 |
) |
|
$ |
(12,025 |
) |
|
$ |
32 |
|
| CDX-NAHY Series 40, 5 Year Index, 06/20/2028* |
|
|
5.00 |
|
|
|
Quarterly |
|
|
|
4.58 |
|
|
USD |
40,939 |
|
|
|
704,696 |
|
|
|
160,233 |
|
|
|
544,463 |
|
| CDX-NAHY Series 41, 5 Year Index, 12/20/2028* |
|
|
5.00 |
|
|
|
Quarterly |
|
|
|
4.79 |
|
|
USD |
104,981 |
|
|
|
1,014,912 |
|
|
|
1,047,610 |
|
|
|
(32,698 |
) |
|
|
|
|
|
| abfunds.com |
|
ALLIANCEBERNSTEIN GLOBAL HIGH INCOME FUND | 75 |
PORTFOLIO OF INVESTMENTS (continued)
|
|
|
|
|
|
|
|
|
|
|
|
|
|
|
|
|
|
|
|
|
|
|
|
|
|
|
|
|
| Description |
|
Fixed
Rate
(Pay)
Receive |
|
|
Payment
Frequency |
|
|
Implied
Credit
Spread at
September 30,
2023 |
|
|
Notional
Amount
(000) |
|
|
Market
Value |
|
|
Upfront
Premiums
Paid
(Received) |
|
|
Unrealized
Appreciation
(Depreciation) |
|
| iTraxx Europe Crossover Series 40, 5 Year Index, 12/20/2028* |
|
|
5.00 |
%
|
|
|
Quarterly |
|
|
|
4.26 |
%
|
|
EUR |
33,120 |
|
|
$
|
1,099,908 |
|
|
$
|
1,375,867 |
|
|
$
|
(275,959 |
) |
| South Africa Government International Bond, 5.875%, 09/16/2025, 12/20/2028* |
|
|
1.00 |
|
|
|
Quarterly |
|
|
|
2.76 |
|
|
USD |
2,380 |
|
|
|
(175,633 |
) |
|
|
(173,423 |
) |
|
|
(2,210 |
) |
|
|
|
|
|
|
|
|
|
|
|
|
|
|
|
|
|
|
|
|
|
|
|
|
|
|
|
|
|
|
|
|
|
|
|
|
|
|
|
|
|
|
|
|
|
|
|
$ |
2,631,890 |
|
|
$ |
2,398,262 |
|
|
$ |
233,628 |
|
|
|
|
|
|
|
|
|
|
|
|
|
|
|
|
|
|
|
|
|
|
|
|
|
|
|
|
|
|
CREDIT DEFAULT SWAPS (see Note C)
|
|
|
|
|
|
|
|
|
|
|
|
|
|
|
|
|
|
|
|
|
|
|
|
|
|
|
|
|
Swap Counterparty &
Referenced Obligation |
|
Fixed
Rate
(Pay)
Receive |
|
|
Payment
Frequency |
|
|
Implied
Credit
Spread at
September 30,
2023 |
|
|
Notional
Amount
(000) |
|
|
Market
Value |
|
|
Upfront
Premiums
Paid
(Received) |
|
|
Unrealized
Appreciation
(Depreciation) |
|
| Sale Contracts |
|
|
|
|
|
|
|
|
|
|
|
|
|
|
|
|
|
|
|
|
|
|
|
|
|
|
|
|
| Citigroup Global Markets, Inc. |
|
|
|
|
|
|
|
|
|
|
|
|
|
|
|
|
|
|
|
|
|
|
|
|
|
|
|
|
|
CDX-CMBX.NA.BBB-
Series 6,
05/11/2063* |
|
|
3.00 |
% |
|
|
Monthly |
|
|
|
7.50 |
% |
|
USD |
222 |
|
|
$ |
(31,930 |
) |
|
$ |
(22,764 |
) |
|
$ |
(9,166 |
) |
| Deutsche Bank AG |
|
|
|
|
|
|
|
|
|
|
|
|
|
|
|
|
|
|
|
|
|
|
|
|
|
|
|
|
|
CDX-CMBX.NA.BBB-
Series 6,
05/11/2063* |
|
|
3.00 |
|
|
|
Monthly |
|
|
|
7.50 |
|
|
USD |
126 |
|
|
|
(18,145 |
) |
|
|
(12,780 |
) |
|
|
(5,365 |
) |
| CDX-CMBX.NA.BBB-
Series 6, 05/11/2063* |
|
|
3.00 |
|
|
|
Monthly |
|
|
|
7.50 |
|
|
USD |
178 |
|
|
|
(25,615 |
) |
|
|
(19,041 |
) |
|
|
(6,574 |
) |
| Goldman Sachs International |
|
|
|
|
|
|
|
|
|
|
|
|
|
|
|
|
|
|
|
|
|
|
|
|
|
|
|
|
| Avis Budget Car Rental LLC,
5.250%, 03/15/2025, 12/20/2023* |
|
|
5.00 |
|
|
|
Quarterly |
|
|
|
0.29 |
|
|
USD |
300 |
|
|
|
3,195 |
|
|
|
1,341 |
|
|
|
1,854 |
|
| Avis Budget Car Rental LLC,
5.250%, 03/15/2025, 12/20/2023* |
|
|
5.00 |
|
|
|
Quarterly |
|
|
|
0.29 |
|
|
USD |
270 |
|
|
|
2,876 |
|
|
|
771 |
|
|
|
2,105 |
|
| CDX-CMBX.NA.BBB-
Series 6, 05/11/2063* |
|
|
3.00 |
|
|
|
Monthly |
|
|
|
7.50 |
|
|
USD |
65 |
|
|
|
(9,354 |
) |
|
|
(6,408 |
) |
|
|
(2,946 |
) |
| CDX-CMBX.NA.BBB-
Series 6, 05/11/2063* |
|
|
3.00 |
|
|
|
Monthly |
|
|
|
7.50 |
|
|
USD |
88 |
|
|
|
(12,667 |
) |
|
|
(7,199 |
) |
|
|
(5,468 |
) |
| CDX-CMBX.NA.BBB-
Series 6, 05/11/2063* |
|
|
3.00 |
|
|
|
Monthly |
|
|
|
7.50 |
|
|
USD |
176 |
|
|
|
(25,334 |
) |
|
|
(15,868 |
) |
|
|
(9,466 |
) |
| CDX-CMBX.NA.BBB-
Series 6, 05/11/2063* |
|
|
3.00 |
|
|
|
Monthly |
|
|
|
7.50 |
|
|
USD |
176 |
|
|
|
(25,334 |
) |
|
|
(14,664 |
) |
|
|
(10,670 |
) |
| CDX-CMBX.NA.BBB-
Series 6, 05/11/2063* |
|
|
3.00 |
|
|
|
Monthly |
|
|
|
7.50 |
|
|
USD |
259 |
|
|
|
(37,276 |
) |
|
|
(25,350 |
) |
|
|
(11,926 |
) |
| CDX-CMBX.NA.BBB-
Series 6, 05/11/2063* |
|
|
3.00 |
|
|
|
Monthly |
|
|
|
7.50 |
|
|
USD |
181 |
|
|
|
(26,108 |
) |
|
|
(13,979 |
) |
|
|
(12,129 |
) |
| CDX-CMBX.NA.BBB-
Series 6, 05/11/2063* |
|
|
3.00 |
|
|
|
Monthly |
|
|
|
7.50 |
|
|
USD |
509 |
|
|
|
(73,215 |
) |
|
|
(50,124 |
) |
|
|
(23,091 |
) |
| CDX-CMBX.NA.BBB-
Series 6, 05/11/2063* |
|
|
3.00 |
|
|
|
Monthly |
|
|
|
7.50 |
|
|
USD |
1,055 |
|
|
|
(151,863 |
) |
|
|
(83,219 |
) |
|
|
(68,644 |
) |
| CDX-CMBX.NA.BBB-
Series 6, 05/11/2063* |
|
|
3.00 |
|
|
|
Monthly |
|
|
|
7.50 |
|
|
USD |
351 |
|
|
|
(50,597 |
) |
|
|
(34,639 |
) |
|
|
(15,958 |
) |
| JPMorgan Securities, LLC |
|
|
|
|
|
|
|
|
|
|
|
|
|
|
|
|
|
|
|
|
|
|
|
|
|
|
|
|
| CDX-CMBX.NA.BBB-
Series 6, 05/11/2063* |
|
|
3.00 |
|
|
|
Monthly |
|
|
|
7.50 |
|
|
USD |
5,865 |
|
|
|
(843,486 |
) |
|
|
(615,152 |
) |
|
|
(228,334 |
) |
| CDX-CMBX.NA.BBB-
Series 6, 05/11/2063* |
|
|
3.00 |
|
|
|
Monthly |
|
|
|
7.50 |
|
|
USD |
3,128 |
|
|
|
(449,859 |
) |
|
|
(343,977 |
) |
|
|
(105,882 |
) |
|
|
|
|
|
| 76 | ALLIANCEBERNSTEIN
GLOBAL HIGH INCOME FUND |
|
abfunds.com |
PORTFOLIO OF INVESTMENTS (continued)
|
|
|
|
|
|
|
|
|
|
|
|
|
|
|
|
|
|
|
|
|
|
|
|
|
|
|
|
|
Swap Counterparty &
Referenced Obligation |
|
Fixed
Rate
(Pay)
Receive |
|
|
Payment
Frequency |
|
|
Implied
Credit
Spread at
September 30,
2023 |
|
|
Notional
Amount
(000) |
|
|
Market
Value |
|
|
Upfront
Premiums
Paid
(Received) |
|
|
Unrealized
Appreciation
(Depreciation) |
|
| Morgan Stanley Capital Services LLC |
|
|
|
|
|
|
|
|
|
|
|
|
|
|
|
|
|
|
|
|
|
|
|
|
|
|
|
|
| CDX-CMBX.NA.BBB- Series 6,
05/11/2063* |
|
|
3.00 |
%
|
|
|
Monthly |
|
|
|
7.50 |
%
|
|
USD |
581 |
|
|
$
|
(83,553 |
) |
|
$
|
(55,691 |
) |
|
$
|
(27,862 |
) |
| CDX-CMBX.NA.BBB- Series 6,
05/11/2063* |
|
|
3.00 |
|
|
|
Monthly |
|
|
|
7.50 |
|
|
USD |
622 |
|
|
|
(89,461 |
) |
|
|
(62,095 |
) |
|
|
(27,366 |
) |
| CDX-CMBX.NA.BBB- Series 6,
05/11/2063* |
|
|
3.00 |
|
|
|
Monthly |
|
|
|
7.50 |
|
|
USD |
1,632 |
|
|
|
(234,770 |
) |
|
|
(16,501 |
) |
|
|
(218,269 |
) |
|
|
|
|
|
|
|
|
|
|
|
|
|
|
|
|
|
|
|
|
|
|
|
|
|
|
|
|
|
|
|
|
|
|
|
|
|
|
|
|
|
|
|
|
|
|
|
$ |
(2,182,496 |
) |
|
$ |
(1,397,339 |
) |
|
$ |
(785,157 |
) |
|
|
|
|
|
|
|
|
|
|
|
|
|
|
|
|
|
|
|
|
|
|
|
|
|
|
|
|
|
TOTAL RETURN SWAPS (see Note C)
|
|
|
|
|
|
|
|
|
|
|
|
|
|
|
|
|
|
|
|
|
| Counterparty &
Referenced Obligation |
|
Rate
Paid/
Received |
|
|
Payment
Frequency |
|
|
Current
Notional
(000) |
|
|
Maturity
Date |
|
|
Unrealized
Appreciation
(Depreciation) |
|
| Pay Total Return on Reference Obligation |
|
|
|
|
|
|
|
|
|
| BNP Paribas SA |
|
|
|
|
|
|
|
|
|
|
|
|
|
|
|
|
|
|
|
|
| Markit iBoxx EUR Contingent Convertible Liquid Developed Market AT1 |
|
|
3 Month
EURIBOR |
|
|
|
Quarterly |
|
|
EUR |
8,856 |
|
|
|
03/20/2024 |
|
|
$ |
(90,096 |
) |
REVERSE REPURCHASE AGREEMENTS (see Note C)
|
|
|
|
|
|
|
|
|
|
|
|
|
|
|
|
|
|
|
|
|
| Broker |
|
Currency |
|
|
Principal
Amount
(000) |
|
|
Interest
Rate |
|
|
Maturity |
|
|
U.S. $
Value at
September 30,
2023 |
|
| Barclays Capital, Inc.† |
|
|
USD |
|
|
|
2,593 |
|
|
|
(2.00 |
)%* |
|
|
— |
|
|
$ |
2,579,393 |
|
| Barclays Capital, Inc.† |
|
|
USD |
|
|
|
450 |
|
|
|
0.00 |
% |
|
|
— |
|
|
|
451,198 |
|
| Barclays Capital, Inc.† |
|
|
USD |
|
|
|
478 |
|
|
|
2.25 |
% |
|
|
— |
|
|
|
480,855 |
|
| Barclays Capital, Inc.† |
|
|
USD |
|
|
|
1,405 |
|
|
|
3.00 |
% |
|
|
— |
|
|
|
1,414,359 |
|
| Barclays Capital, Inc.† |
|
|
USD |
|
|
|
2,700 |
|
|
|
4.00 |
% |
|
|
— |
|
|
|
2,739,059 |
|
| Jefferies LLC† |
|
|
USD |
|
|
|
644 |
|
|
|
1.25 |
% |
|
|
— |
|
|
|
644,371 |
|
| Jefferies LLC† |
|
|
USD |
|
|
|
625 |
|
|
|
2.75 |
% |
|
|
— |
|
|
|
625,006 |
|
| Jefferies LLC† |
|
|
USD |
|
|
|
1,755 |
|
|
|
3.00 |
% |
|
|
— |
|
|
|
1,764,319 |
|
| Jefferies LLC† |
|
|
USD |
|
|
|
953 |
|
|
|
3.75 |
% |
|
|
— |
|
|
|
957,064 |
|
| Jefferies LLC† |
|
|
USD |
|
|
|
902 |
|
|
|
4.75 |
% |
|
|
— |
|
|
|
909,624 |
|
|
|
|
|
|
|
|
|
|
|
|
|
|
|
|
|
|
|
|
|
|
|
|
|
|
|
|
|
|
|
|
|
|
|
|
|
|
|
|
$ |
12,565,248 |
|
|
|
|
|
|
|
|
|
|
|
|
|
|
|
|
|
|
|
|
|
|
| † |
The reverse repurchase agreement matures on demand. Interest rate resets daily and the rate shown is the rate in effect on
September 30, 2023. |
| * |
Interest payment due from counterparty. |
|
|
|
|
|
| abfunds.com |
|
ALLIANCEBERNSTEIN GLOBAL HIGH INCOME FUND | 77 |
PORTFOLIO OF INVESTMENTS (continued)
The type of
underlying collateral and the remaining maturity of open reverse repurchase agreements on statements of assets and liabilities is as follows:
|
|
|
|
|
|
|
|
|
|
|
|
|
|
|
|
|
|
|
|
|
| |
|
Overnight
and
Continuous |
|
|
Up to 30 Days |
|
|
31-90 Days |
|
|
Greater than
90 Days |
|
|
Total |
|
| Corporates – Investment Grade |
|
$ |
1,764,319 |
|
|
$ |
– 0 |
– |
|
$ |
– 0 |
– |
|
$ |
– 0 |
– |
|
$ |
1,764,319 |
|
| Corporates – Non-Investment Grade |
|
|
9,695,068 |
|
|
|
– 0 |
– |
|
|
– 0 |
– |
|
|
– 0 |
– |
|
|
9,695,068 |
|
| Emerging Markets – Corporate Bonds |
|
|
480,855 |
|
|
|
– 0 |
– |
|
|
– 0 |
– |
|
|
– 0 |
– |
|
|
480,855 |
|
| Emerging Markets – Sovereigns |
|
|
625,006 |
|
|
|
– 0 |
– |
|
|
– 0 |
– |
|
|
– 0 |
– |
|
|
625,006 |
|
|
|
|
|
|
|
|
|
|
|
|
|
|
|
|
|
|
|
|
|
|
| Total |
|
$ |
12,565,248 |
|
|
$ |
– 0 |
– |
|
$ |
– 0 |
– |
|
$ |
– 0 |
– |
|
$ |
12,565,248 |
|
|
|
|
|
|
|
|
|
|
|
|
|
|
|
|
|
|
|
|
|
|
| ** |
Principal amount less than 500. |
| (a) |
Coupon rate adjusts periodically based upon a predetermined schedule. Stated interest rate in effect at September 30,
2023. |
| (b) |
Security is exempt from registration under Rule 144A or Regulation S of the Securities Act of 1933. These securities are
considered restricted, but liquid and may be resold in transactions exempt from registration. At September 30, 2023, the aggregate market value of these securities amounted to $630,582,270 or 69.5% of net assets. |
| (c) |
Security in which significant unobservable inputs (Level 3) were used in determining fair value. |
| (d) |
Defaulted matured security. |
| (e) |
Non-income producing security. |
| (f) |
Fair valued by the Adviser. |
| (g) |
Pay-In-Kind Payments (PIK). The issuer may
pay cash interest and/or interest in additional debt securities. Rates shown are the rates in effect at September 30, 2023. |
| (h) |
Security is exempt from registration under Rule 144A or Regulation S of the Securities Act of 1933. These securities,
which represent 0.43% of net assets as of September 30, 2023, are considered illiquid and restricted. Additional information regarding such securities follows: |
|
|
|
|
|
|
|
|
|
|
|
|
|
|
|
|
|
144A/Restricted &
Illiquid Securities |
|
Acquisition
Date |
|
|
Cost |
|
|
Market
Value |
|
|
Percentage of
Net Assets |
|
| BBFI Liquidating Trust Zero Coupon, 12/30/2099 |
|
|
01/18/2013 -
06/17/2022 |
|
|
$ |
666,784 |
|
|
$ |
341,560 |
|
|
|
0.04 |
% |
| Consumer Loan Underlying Bond Club Certificate Issuer Trust
I
Series 2018-12, Class PT
0.00%, 06/15/2043 |
|
|
06/26/2018 |
|
|
|
376 |
|
|
|
348 |
|
|
|
0.00 |
% |
| Consumer Loan Underlying Bond Club Certificate Issuer Trust I
Series
2019-24, Class PT
10.385%, 08/15/2044 |
|
|
06/27/2019 |
|
|
|
18,652 |
|
|
|
18,406 |
|
|
|
0.00 |
% |
| Consumer Loan Underlying Bond Club Certificate Issuer Trust I
Series
2019-36, Class PT
12.824%, 10/17/2044 |
|
|
09/04/2019 |
|
|
|
39,609 |
|
|
|
38,550 |
|
|
|
0.00 |
% |
| Digicel Group Holdings Ltd. 7.00%, 10/16/2023 |
|
|
11/28/2016 -
04/03/2023 |
|
|
|
156,350 |
|
|
|
5,370 |
|
|
|
0.00 |
% |
|
|
|
|
|
| 78 | ALLIANCEBERNSTEIN
GLOBAL HIGH INCOME FUND |
|
abfunds.com |
PORTFOLIO OF INVESTMENTS (continued)
|
|
|
|
|
|
|
|
|
|
|
|
|
|
|
|
|
144A/Restricted &
Illiquid Securities |
|
Acquisition
Date |
|
|
Cost |
|
|
Market
Value |
|
|
Percentage of
Net Assets |
|
| Exide Technologies (Exchange Priority) 11.00%, 10/31/2024 |
|
|
10/29/2020 |
|
|
$
|
0 |
|
|
$
|
0 |
|
|
|
0.00 |
% |
| Exide Technologies (First Lien) 11.00%, 10/31/2024 |
|
|
10/29/2020 |
|
|
|
0 |
|
|
|
0 |
|
|
|
0.00 |
% |
| Fideicomiso PA Concesion Ruta al Mar 6.75%, 02/15/2044 |
|
|
12/14/2017 |
|
|
|
476,819 |
|
|
|
228,945 |
|
|
|
0.03 |
% |
| Fideicomiso PA Costera
6.25%, 01/15/2034 |
|
|
06/30/2016 |
|
|
|
396,605 |
|
|
|
279,162 |
|
|
|
0.03 |
% |
| Fideicomiso PA Pacifico Tres
7.00%, 01/15/2035 |
|
|
03/04/2016 |
|
|
|
1,975,302 |
|
|
|
1,355,424 |
|
|
|
0.15 |
% |
| JPMorgan Madison Avenue Securities Trust
Series 2015-CH1,
Class M2
10.929%, 10/25/2025 |
|
|
09/18/2015 |
|
|
|
377,624 |
|
|
|
383,324 |
|
|
|
0.04 |
% |
| K2016470219 South Africa Ltd.
3.00%, 12/31/2022 |
|
|
01/31/2017 -
06/30/2022 |
|
|
|
1,100,178 |
|
|
|
0 |
|
|
|
0.00 |
% |
| Magnetation LLC/Mag Finance Corp.
11.00%, 05/15/2018 |
|
|
05/15/2013 -
02/19/2015 |
|
|
|
2,295,760 |
|
|
|
0 |
|
|
|
0.00 |
% |
| Odebrecht Holdco Finance Ltd. Zero Coupon, 09/10/2058 |
|
|
01/22/2021 |
|
|
|
668,115 |
|
|
|
2,395 |
|
|
|
0.00 |
% |
| Tonon Luxembourg SA 6.50%, 10/31/2024 |
|
|
05/03/2019 -
10/31/2021 |
|
|
|
1,209,003 |
|
|
|
62 |
|
|
|
0.00 |
% |
| Virgolino de Oliveira Finance SA
10.50%, 01/28/2018 |
|
|
01/23/2014 -
02/27/2014 |
|
|
|
2,401,854 |
|
|
|
408 |
|
|
|
0.00 |
% |
| Virgolino de Oliveira Finance SA
10.875%, 01/13/2020 |
|
|
06/09/2014 |
|
|
|
477,418 |
|
|
|
48 |
|
|
|
0.00 |
% |
| Virgolino de Oliveira Finance SA
11.75%, 02/09/2022 |
|
|
01/29/2014 -
02/05/2014 |
|
|
|
838,866 |
|
|
|
162 |
|
|
|
0.00 |
% |
| Wells Fargo Credit Risk Transfer Securities Trust
Series 2015-WF1,
Class 2M2
10.929%, 11/25/2025 |
|
|
09/28/2015 -
02/26/2018 |
|
|
|
121,993 |
|
|
|
125,733 |
|
|
|
0.01 |
% |
| Wisconsin Public Finance Authority (Catholic Bishop of Chicago (The)) Series 2021 5.75%, 07/25/2041 |
|
|
08/03/2021 |
|
|
|
1,435,000 |
|
|
|
1,189,660 |
|
|
|
0.13 |
% |
| (i) |
Position, or a portion thereof, has been segregated to collateralize reverse repurchase agreements. |
| (j) |
Floating Rate Security. Stated interest/floor/ceiling rate was in effect at September 30, 2023.
|
| (l) |
Securities are perpetual and, thus, do not have a predetermined maturity date. The date shown, if applicable, reflects the
next call date. |
|
|
|
|
|
| abfunds.com |
|
ALLIANCEBERNSTEIN GLOBAL HIGH INCOME FUND | 79 |
PORTFOLIO OF INVESTMENTS (continued)
| (m) |
Inverse interest only security. |
| (o) |
The stated coupon rate represents the greater of the SOFR or an alternate base rate such as the PRIME or the SOFR/PRIME
floor rate plus a spread at September 30, 2023. |
| (p) |
Position, or a portion thereof, has been segregated to collateralize margin requirements for open futures contracts.
|
| (q) |
Position, or a portion thereof, has been segregated to collateralize margin requirements for open centrally cleared swaps.
|
| (r) |
Position, or a portion thereof, has been segregated to collateralize OTC derivatives outstanding. |
| (s) |
To obtain a copy of the fund’s shareholder report, please go to the Securities and Exchange Commission’s website
at www.sec.gov, or call AB at (800) 227-4618. |
| (t) |
Affiliated investments. |
| (u) |
The rate shown represents the 7-day yield as of period end. |
| (v) |
One contract relates to 100 shares. |
|
|
|
| Currency Abbreviations:
AUD – Australian Dollar BRL – Brazilian Real
CAD – Canadian Dollar CHF – Swiss Franc
CLP – Chilean Peso CNH – Chinese Yuan Renminbi (Offshore)
COP – Colombian Peso CZK – Czech Koruna
EUR – Euro GBP – Great British Pound
HUF – Hungarian Forint IDR – Indonesian Rupiah |
|
INR – Indian Rupee JPY – Japanese Yen
KRW – South Korean Won MXN – Mexican Peso
NOK – Norwegian Krone NZD – New Zealand Dollar
PEN – Peruvian Sol PLN – Polish Zloty
SEK – Swedish Krona SGD – Singapore Dollar
TWD – New Taiwan Dollar USD – United States Dollar
ZAR – South African Rand |
Glossary:
ABS – Asset-Backed Securities
CBT – Chicago Board of Trade
CDX-CMBX.NA – North American Commercial
Mortgage-Backed Index
CDX-NAHY – North American High Yield Credit Default Swap Index
CLO – Collateralized Loan Obligations
CMBS – Commercial Mortgage-Backed
Securities
EURIBOR – Euro Interbank Offered Rate
JSC – Joint Stock
Company
LIBOR – London Interbank Offered Rate
OTC – Over-the-Counter
REIT – Real Estate Investment Trust
REMICs – Real Estate Mortgage Investment Conduits
SOFR – Secured Overnight
Financing Rate
See notes to financial statements.
|
|
|
|
|
| 80 | ALLIANCEBERNSTEIN
GLOBAL HIGH INCOME FUND |
|
abfunds.com |
STATEMENT OF ASSETS & LIABILITIES
September 30, 2023 (unaudited)
|
|
|
|
|
| Assets |
|
|
|
|
| Investments in securities, at value |
|
|
|
|
| Unaffiliated issuers (cost $1,017,000,992) |
|
$ |
902,644,883 |
|
| Affiliated issuers (cost $3,838,235) |
|
|
3,838,235 |
|
| Cash collateral due from broker |
|
|
6,948,554 |
|
| Foreign currencies, at value (cost $400,128) |
|
|
41,330 |
|
| Unaffiliated dividends and interest receivable |
|
|
15,206,074 |
|
| Unrealized appreciation on forward currency exchange contracts |
|
|
2,130,736 |
|
| Receivable for investment securities sold and foreign currency transactions |
|
|
1,253,797 |
|
| Receivable for variation margin on futures |
|
|
155,622 |
|
| Affiliated dividends receivable |
|
|
46,404 |
|
| Market value of credit default swaps (net premiums paid $2,112) |
|
|
6,071 |
|
|
|
|
|
|
| Total assets |
|
|
932,271,706 |
|
|
|
|
|
|
| Liabilities |
|
|
|
|
| Written options, at value (premiums received $179,004) |
|
|
158,730 |
|
| Due to Custodian |
|
|
89,725 |
|
| Payable for reverse repurchase agreements |
|
|
12,565,248 |
|
| Payable for investment securities purchased |
|
|
7,541,362 |
|
| Market value of credit default swaps (net premiums received $1,399,451) |
|
|
2,188,567 |
|
| Advisory fee payable |
|
|
833,322 |
|
| Payable for capital gains taxes |
|
|
425,789 |
|
| Payable for variation margin on centrally cleared swaps |
|
|
169,573 |
|
| Unrealized depreciation on total return swaps |
|
|
90,096 |
|
| Administrative fee payable |
|
|
28,562 |
|
| Unrealized depreciation on forward currency exchange contracts |
|
|
20,572 |
|
| Transfer Agent fee payable |
|
|
5,487 |
|
| Directors’ fee payable |
|
|
435 |
|
| Accrued expenses |
|
|
461,323 |
|
|
|
|
|
|
| Total liabilities |
|
|
24,578,791 |
|
|
|
|
|
|
| Net Assets |
|
$ |
907,692,915 |
|
|
|
|
|
|
| Composition of Net Assets |
|
|
|
|
| Capital stock, at par |
|
$ |
862,297 |
|
| Additional paid-in capital |
|
|
1,154,458,535 |
|
| Accumulated loss |
|
|
(247,627,917 |
) |
|
|
|
|
|
|
|
$ |
907,692,915 |
|
|
|
|
|
|
| Net Asset Value Per Share—100 million shares of capital stock
authorized, $0.01 par value (based on 86,229,677 shares outstanding) |
|
$ |
10.53 |
|
|
|
|
|
|
See notes to financial statements.
|
|
|
|
|
| abfunds.com |
|
ALLIANCEBERNSTEIN GLOBAL HIGH INCOME FUND | 81 |
STATEMENT OF OPERATIONS
Six Months Ended September 30, 2023 (unaudited)
|
|
|
|
|
|
|
|
|
| Investment Income |
|
|
|
|
|
|
|
|
| Interest |
|
$ |
35,221,909 |
|
|
|
|
|
| Dividends |
|
|
|
|
|
|
|
|
| Affiliated issuers |
|
|
223,907 |
|
|
|
|
|
| Unaffiliated issuers |
|
|
199,780 |
|
|
$ |
35,645,596 |
|
|
|
|
|
|
|
|
|
|
| Expenses |
|
|
|
|
|
|
|
|
| Advisory fee (see Note B) |
|
|
4,129,479 |
|
|
|
|
|
| Transfer agency |
|
|
15,994 |
|
|
|
|
|
| Custody and accounting |
|
|
172,462 |
|
|
|
|
|
| Printing |
|
|
95,624 |
|
|
|
|
|
| Audit and tax |
|
|
90,334 |
|
|
|
|
|
| Administrative |
|
|
49,040 |
|
|
|
|
|
| Registration fees |
|
|
45,155 |
|
|
|
|
|
| Legal |
|
|
26,337 |
|
|
|
|
|
| Directors’ fees |
|
|
14,473 |
|
|
|
|
|
| Miscellaneous |
|
|
36,717 |
|
|
|
|
|
|
|
|
|
|
|
|
|
|
| Total expenses before interest expense |
|
|
4,675,615 |
|
|
|
|
|
| Interest expense |
|
|
213,795 |
|
|
|
|
|
|
|
|
|
|
|
|
|
|
| Total expenses |
|
|
4,889,410 |
|
|
|
|
|
| Less: expenses waived and reimbursed by the Adviser (see Note B) |
|
|
(4,841 |
) |
|
|
|
|
|
|
|
|
|
|
|
|
|
| Net expenses |
|
|
|
|
|
|
4,884,569 |
|
|
|
|
|
|
|
|
|
|
| Net investment income |
|
|
|
|
|
|
30,761,027 |
|
|
|
|
|
|
|
|
|
|
| Realized and Unrealized Gain (Loss) on Investment and Foreign Currency Transactions |
|
|
|
|
|
|
|
|
| Net realized gain (loss) on: |
|
|
|
|
|
|
|
|
| Investment transactions(a) |
|
|
|
|
|
|
(11,314,174 |
) |
| Forward currency exchange contracts |
|
|
|
|
|
|
(1,994,823 |
) |
| Futures |
|
|
|
|
|
|
(2,351,300 |
) |
| Swaps |
|
|
|
|
|
|
6,779,848 |
|
| Foreign currency transactions |
|
|
|
|
|
|
(615,651 |
) |
| Net change in unrealized appreciation (depreciation) on: |
|
|
|
|
|
|
|
|
| Investments(b) |
|
|
|
|
|
|
10,691,847 |
|
| Forward currency exchange contracts |
|
|
|
|
|
|
3,269,607 |
|
| Futures |
|
|
|
|
|
|
(3,881,499 |
) |
| Written options |
|
|
|
|
|
|
20,274 |
|
| Swaps |
|
|
|
|
|
|
(669,526 |
) |
| Foreign currency denominated assets and liabilities |
|
|
|
|
|
|
(63,386 |
) |
|
|
|
|
|
|
|
|
|
| Net loss on investment and foreign currency transactions |
|
|
|
|
|
|
(128,783 |
) |
|
|
|
|
|
|
|
|
|
| Net Increase in Net Assets from Operations |
|
|
|
|
|
$ |
30,632,244 |
|
|
|
|
|
|
|
|
|
|
| (a) |
Net of foreign realized capital gains taxes of $32,095. |
| (b) |
Net of increase in accrued foreign capital gains taxes on unrealized gains of $24,593. |
See notes to financial statements.
|
|
|
|
|
| 82 | ALLIANCEBERNSTEIN
GLOBAL HIGH INCOME FUND |
|
abfunds.com |
STATEMENT OF CHANGES IN NET ASSETS
|
|
|
|
|
|
|
|
|
| |
|
Six Months Ended
September 30, 2023
(unaudited) |
|
|
Year Ended
March 31, 2023 |
|
| Increase (Decrease) in Net Assets from Operations |
|
|
|
|
|
|
|
|
| Net investment income |
|
$ |
30,761,027 |
|
|
$ |
59,434,784 |
|
| Net realized loss on investment and foreign currency transactions |
|
|
(9,496,100 |
) |
|
|
(59,646,186 |
) |
| Net change in unrealized appreciation (depreciation) on investments and foreign currency denominated assets
and liabilities |
|
|
9,367,317 |
|
|
|
(49,324,368 |
) |
|
|
|
|
|
|
|
|
|
| Net increase (decrease) in net assets from operations |
|
|
30,632,244 |
|
|
|
(49,535,770 |
) |
| Distributions to Shareholders |
|
|
(33,888,263 |
) |
|
|
(76,201,166 |
) |
|
|
|
|
|
|
|
|
|
| Total decrease |
|
|
(3,256,019 |
) |
|
|
(125,736,936 |
) |
| Net Assets |
|
|
|
|
|
|
|
|
| Beginning of period |
|
|
910,948,934 |
|
|
|
1,036,685,870 |
|
|
|
|
|
|
|
|
|
|
| End of period |
|
$ |
907,692,915 |
|
|
$ |
910,948,934 |
|
|
|
|
|
|
|
|
|
|
See notes to financial statements.
|
|
|
|
|
| abfunds.com |
|
ALLIANCEBERNSTEIN GLOBAL HIGH INCOME FUND | 83 |
NOTES TO FINANCIAL STATEMENTS
September 30, 2023 (unaudited)
NOTE A
Significant Accounting Policies
AllianceBernstein Global High Income Fund, Inc. (the “Fund”) is incorporated under the laws of the State of Maryland and is registered under the Investment
Company Act of 1940, as amended, as a diversified, closed-end management investment company. The financial statements have been prepared in conformity with U.S. generally accepted accounting principles
(“U.S. GAAP”), which require management to make certain estimates and assumptions that affect the reported amounts of assets and liabilities in the financial statements and amounts of income and expenses during the reporting period. Actual
results could differ from those estimates. The Fund is an investment company under U.S. GAAP and follows the accounting and reporting guidance applicable to investment companies. The following is a summary of significant accounting policies followed
by the Fund.
1. Security Valuation
Portfolio securities are valued at
market value determined on the basis of market quotations or, if market quotations are not readily available or are unreliable, at “fair value” as determined in accordance with procedures approved by and under the oversight of the
Fund’s Board of Directors (the “Board”). Pursuant to these procedures, AllianceBernstein L.P. (the “Adviser”) serves as the Fund’s valuation designee pursuant to Rule
2a-5 of the 1940 Act. In this capacity, the Adviser is responsible, among other things, for making all fair value determinations relating to the Fund’s portfolio investments, subject to the Board’s
oversight.
In general, the market values of securities which are readily available and deemed reliable are determined as follows: securities listed on a national
securities exchange (other than securities listed on the NASDAQ Stock Market, Inc. (“NASDAQ”)) or on a foreign securities exchange are valued at the last sale price at the close of the exchange or foreign securities exchange. If there has
been no sale on such day, the securities are valued at the last traded price from the previous day. Securities listed on more than one exchange are valued by reference to the principal exchange on which the securities are traded; securities listed
only on NASDAQ are valued in accordance with the NASDAQ Official Closing Price; listed or over the counter (“OTC”) market put or call options are valued at the mid level between the current bid and ask prices. If either a current bid or
current ask price is unavailable, the Adviser will have discretion to determine the best valuation (e.g., last trade price in the case of listed options); open futures are valued using the closing settlement price or, in the absence of such a price,
the most recent quoted bid price. If there are no quotations available for the day of valuation, the last available closing settlement price is used; U.S. Government securities and any other debt instruments having 60 days
|
|
|
|
|
| 84 | ALLIANCEBERNSTEIN
GLOBAL HIGH INCOME FUND |
|
abfunds.com |
NOTES TO FINANCIAL STATEMENTS (continued)
or less
remaining until maturity are generally valued at market by an independent pricing vendor, if a market price is available. If a market price is not available, the securities are valued at amortized cost. This methodology is commonly used for short
term securities that have an original maturity of 60 days or less, as well as short term securities that had an original term to maturity that exceeded 60 days. In instances when amortized cost is utilized, the Valuation Committee (the
“Committee”) must reasonably conclude that the utilization of amortized cost is approximately the same as the fair value of the security. Factors the Committee will consider include, but are not limited to, an impairment of the
creditworthiness of the issuer or material changes in interest rates. Fixed-income securities, including mortgage-backed and asset-backed securities, may be valued on the basis of prices provided by a pricing service or at a price obtained from one
or more of the major broker-dealers. In cases where broker-dealer quotes are obtained, the Adviser may establish procedures whereby changes in market yields or spreads are used to adjust, on a daily basis, a recently obtained quoted price on a
security. Swaps and other derivatives are valued daily, primarily using independent pricing services, independent pricing models using market inputs, as well as third party broker-dealers or counterparties.
Open-end mutual funds are valued at the closing net asset value per share, while exchange traded funds are valued at the closing market price per share.
Securities for which market quotations are not readily available (including restricted securities) or are deemed unreliable are valued at fair value as deemed
appropriate by the Adviser. Factors considered in making this determination may include, but are not limited to, information obtained by contacting the issuer, analysts, analysis of the issuer’s financial statements or other available
documents. In addition, the Fund may use fair value pricing for securities primarily traded in non-U.S. markets because most foreign markets close well before the Fund values its securities at 4:00 p.m.,
Eastern Time. The earlier close of these foreign markets gives rise to the possibility that significant events, including broad market moves, may have occurred in the interim and may materially affect the value of those securities. To account
for this, the Fund generally values many of its foreign equity securities using fair value prices based on third party vendor modeling tools to the extent available.
2. Fair Value Measurements
In accordance with U.S. GAAP regarding fair
value measurements, fair value is defined as the price that the Fund would receive to sell an asset or pay to transfer a liability in an orderly transaction between market participants at the measurement date. U.S. GAAP establishes a framework for
measuring fair value, and a three-level hierarchy for fair value measurements based upon the transparency of inputs to the valuation of an asset or
|
|
|
|
|
| abfunds.com |
|
ALLIANCEBERNSTEIN GLOBAL HIGH INCOME FUND | 85 |
NOTES TO FINANCIAL STATEMENTS (continued)
liability
(including those valued based on their market values as described in Note A.1 above). Inputs may be observable or unobservable and refer broadly to the assumptions that market participants would use in pricing the asset or liability. Observable
inputs reflect the assumptions market participants would use in pricing the asset or liability based on market data obtained from sources independent of the Fund. Unobservable inputs reflect the Fund’s own assumptions about the assumptions that
market participants would use in pricing the asset or liability based on the best information available in the circumstances. Each investment is assigned a level based upon the observability of the inputs which are significant to the overall
valuation. The three-tier hierarchy of inputs is summarized below.
| |
• |
|
Level 1—quoted prices in active markets for identical investments |
| |
• |
|
Level 2—other significant observable inputs (including quoted prices for similar investments, interest rates,
prepayment speeds, credit risk, etc.) |
| |
• |
|
Level 3—significant unobservable inputs (including the Fund’s own assumptions in determining the fair value
of investments) |
The fair value of debt instruments, such as bonds, and
over-the-counter derivatives is generally based on market price quotations, recently executed market transactions (where observable) or industry recognized modeling
techniques and are generally classified as Level 2. Pricing vendor inputs to Level 2 valuations may include quoted prices for similar investments in active markets, interest rate curves, coupon rates, currency rates, yield curves, option
adjusted spreads, default rates, credit spreads and other unique security features in order to estimate the relevant cash flows which are then discounted to calculate fair values. If these inputs are unobservable and significant to the fair value,
these investments will be classified as Level 3.
Where readily available market prices or relevant bid prices are not available for certain equity
investments, such investments may be valued based on similar publicly traded investments, movements in relevant indices since last available prices or based upon underlying company fundamentals and comparable company data (such as multiples to
earnings or other multiples to equity). Where an investment is valued using an observable input, such as another publicly traded security, the investment will be classified as Level 2. If management determines that an adjustment is appropriate
based on restrictions on resale, illiquidity or uncertainty, and such adjustment is a significant component of the valuation, the investment will be classified as Level 3. An investment will also be classified as Level 3 where management
uses company fundamentals and other significant inputs to determine the valuation.
|
|
|
|
|
| 86 | ALLIANCEBERNSTEIN
GLOBAL HIGH INCOME FUND |
|
abfunds.com |
NOTES TO FINANCIAL STATEMENTS (continued)
Options are
valued using market-based inputs to models, broker or dealer quotations, or alternative pricing sources with reasonable levels of price transparency, where such inputs and models are available. Alternatively, the values may be obtained through
unobservable management determined inputs and/or management’s proprietary models. Where models are used, the selection of a particular model to value an option depends upon the contractual terms of, and specific risks inherent in, the option as
well as the availability of pricing information in the market. Valuation models require a variety of inputs, including contractual terms, market prices, measures of volatility and correlations of such inputs. Exchange traded options generally will
be classified as Level 2. For options that do not trade on an exchange but trade in liquid markets, inputs can generally be verified and model selection does not involve significant management judgment. Options are classified within
Level 2 on the fair value hierarchy when all of the significant inputs can be corroborated to market evidence. Otherwise such instruments are classified as Level 3.
Valuations of mortgage-backed or other asset-backed securities, by pricing vendors, are based on both proprietary and industry recognized models and discounted cash
flow techniques. Significant inputs to the valuation of these instruments are value of the collateral, the rates and timing of delinquencies, the rates and timing of prepayments, and default and loss expectations, which are driven in part by housing
prices for residential mortgages. Significant inputs are determined based on relative value analyses, which incorporate comparisons to instruments with similar collateral and risk profiles, including relevant indices. Mortgage and asset-backed
securities for which management has collected current observable data through pricing services are generally categorized within Level 2. Those investments for which current observable data has not been provided are classified as Level 3.
Bank loan prices are provided by third party pricing services and consist of a composite of the quotes received by the vendor into a consensus price. Certain bank
loans are classified as Level 3, as a significant input used in the fair value measurement of these instruments is the market quotes that are received by the vendor and these inputs are not observable.
Other fixed income investments, including non-U.S. government and corporate debt, are generally valued using quoted market
prices, if available, which are typically impacted by current interest rates, maturity dates and any perceived credit risk of the issuer. Additionally, in the absence of quoted market prices, these inputs are used by pricing vendors to derive a
valuation based upon industry or proprietary models which incorporate issuer specific data with relevant yield/spread comparisons with more widely quoted bonds with similar key characteristics. Those investments
|
|
|
|
|
| abfunds.com |
|
ALLIANCEBERNSTEIN GLOBAL HIGH INCOME FUND | 87 |
NOTES TO FINANCIAL STATEMENTS (continued)
for which
there are observable inputs are classified as Level 2. Where the inputs are not observable, the investments are classified as Level 3.
The following
table summarizes the valuation of the Fund’s investments by the above fair value hierarchy levels as of September 30, 2023:
|
|
|
|
|
|
|
|
|
|
|
|
|
|
|
|
|
| Investments in
Securities |
|
Level 1 |
|
|
Level 2 |
|
|
Level 3 |
|
|
Total |
|
| Assets: |
|
|
|
|
|
|
|
|
|
|
|
|
|
|
|
|
| Corporates – Non-Investment Grade |
|
$ |
– 0 |
– |
|
$ |
482,163,608 |
|
|
$ |
1,541,721 |
# |
|
$ |
483,705,329 |
|
| Corporates – Investment Grade |
|
|
– 0 |
– |
|
|
179,078,963 |
|
|
|
– 0 |
– |
|
|
179,078,963 |
|
| Emerging Markets – Corporate Bonds |
|
|
– 0 |
– |
|
|
48,048,850 |
|
|
|
342,178 |
# |
|
|
48,391,028 |
|
| Collateralized Loan Obligations |
|
|
– 0 |
– |
|
|
44,807,503 |
|
|
|
– 0 |
– |
|
|
44,807,503 |
|
| Collateralized Mortgage Obligations |
|
|
– 0 |
– |
|
|
36,380,790 |
|
|
|
– 0 |
– |
|
|
36,380,790 |
|
| Bank Loans |
|
|
– 0 |
– |
|
|
32,509,492 |
|
|
|
1,842,495 |
|
|
|
34,351,987 |
|
| Emerging Markets – Sovereigns |
|
|
– 0 |
– |
|
|
20,757,693 |
|
|
|
– 0 |
– |
|
|
20,757,693 |
|
| Governments – Treasuries |
|
|
– 0 |
– |
|
|
18,387,363 |
|
|
|
– 0 |
– |
|
|
18,387,363 |
|
| Quasi-Sovereigns |
|
|
– 0 |
– |
|
|
6,616,150 |
|
|
|
– 0 |
– |
|
|
6,616,150 |
|
| Common Stocks |
|
|
1,239,574 |
|
|
|
31 |
|
|
|
4,349,222 |
# |
|
|
5,588,827 |
|
| Commercial Mortgage-Backed Securities |
|
|
– 0 |
– |
|
|
5,324,049 |
|
|
|
– 0 |
– |
|
|
5,324,049 |
|
| Local Governments – US Municipal Bonds |
|
|
– 0 |
– |
|
|
3,785,110 |
|
|
|
– 0 |
– |
|
|
3,785,110 |
|
| Inflation-Linked Securities |
|
|
– 0 |
– |
|
|
1,863,531 |
|
|
|
– 0 |
– |
|
|
1,863,531 |
|
| Asset-Backed Securities |
|
|
– 0 |
– |
|
|
786,510 |
|
|
|
680,532 |
|
|
|
1,467,042 |
|
| Preferred Stocks |
|
|
928,972 |
|
|
|
– 0 |
– |
|
|
– 0 |
– |
|
|
928,972 |
|
| Governments – Sovereign Bonds |
|
|
– 0 |
– |
|
|
587,191 |
|
|
|
– 0 |
– |
|
|
587,191 |
|
| Purchased Options – Puts |
|
|
– 0 |
– |
|
|
475,820 |
|
|
|
– 0 |
– |
|
|
475,820 |
|
| Rights |
|
|
– 0 |
– |
|
|
– 0 |
– |
|
|
12,490 |
# |
|
|
12,490 |
|
| Short-Term Investments: |
|
|
|
|
|
|
|
|
|
|
|
|
|
|
|
|
| Time Deposits |
|
|
– 0 |
– |
|
|
10,135,045 |
|
|
|
– 0 |
– |
|
|
10,135,045 |
|
| Investment Companies |
|
|
3,838,235 |
|
|
|
– 0 |
– |
|
|
– 0 |
– |
|
|
3,838,235 |
|
|
|
|
|
|
|
|
|
|
|
|
|
|
|
|
|
|
| Total Investments in Securities |
|
|
6,006,781 |
|
|
|
891,707,699 |
|
|
|
8,768,638 |
|
|
|
906,483,118 |
|
| Other Financial Instruments*: |
|
|
|
|
|
|
|
|
|
|
|
|
|
|
|
|
| Assets |
|
|
|
|
|
|
|
|
|
|
|
|
|
|
|
|
| Forward Currency Exchange Contracts |
|
|
– 0 |
– |
|
|
2,130,736 |
|
|
|
– 0 |
– |
|
|
2,130,736 |
|
| Centrally Cleared Credit Default Swaps |
|
|
– 0 |
– |
|
|
2,819,516 |
|
|
|
– 0 |
– |
|
|
2,819,516 |
† |
| Credit Default Swaps |
|
|
– 0 |
– |
|
|
6,071 |
|
|
|
– 0 |
– |
|
|
6,071 |
|
|
|
|
|
|
| 88 | ALLIANCEBERNSTEIN
GLOBAL HIGH INCOME FUND |
|
abfunds.com |
NOTES TO FINANCIAL STATEMENTS (continued)
|
|
|
|
|
|
|
|
|
|
|
|
|
|
|
|
|
| Investments in
Securities |
|
Level 1 |
|
|
Level 2 |
|
|
Level 3 |
|
|
Total |
|
| Liabilities |
|
|
|
|
|
|
|
|
|
|
|
|
|
|
|
|
| Futures |
|
$
|
(1,434,281 |
) |
|
$
|
– 0 |
– |
|
$
|
– 0 |
– |
|
$
|
(1,434,281 |
)† |
| Forward Currency Exchange Contracts |
|
|
– 0 |
– |
|
|
(20,572 |
) |
|
|
– 0 |
– |
|
|
(20,572 |
) |
| Put Written Options |
|
|
– 0 |
– |
|
|
(158,730 |
) |
|
|
– 0 |
– |
|
|
(158,730 |
) |
| Centrally Cleared Credit Default Swaps |
|
|
– 0 |
– |
|
|
(187,626 |
) |
|
|
– 0 |
– |
|
|
(187,626 |
)† |
| Credit Default Swaps |
|
|
– 0 |
– |
|
|
(2,188,567 |
) |
|
|
– 0 |
– |
|
|
(2,188,567 |
) |
| Total Return Swaps |
|
|
– 0 |
– |
|
|
(90,096 |
) |
|
|
– 0 |
– |
|
|
(90,096 |
) |
| Reverse Repurchase Agreements |
|
|
(12,565,248 |
) |
|
|
– 0 |
– |
|
|
– 0 |
– |
|
|
(12,565,248 |
) |
|
|
|
|
|
|
|
|
|
|
|
|
|
|
|
|
|
| Total |
|
$ |
(7,992,748 |
) |
|
$ |
894,018,431 |
|
|
$ |
8,768,638 |
|
|
$ |
894,794,321 |
|
|
|
|
|
|
|
|
|
|
|
|
|
|
|
|
|
|
| # |
The Fund held securities with zero market value at period end. |
| * |
Other financial instruments are derivative instruments, such as futures, forwards and swaps, which are valued at the
unrealized appreciation (depreciation) on the instrument. Other financial instruments may also include swaps with upfront premiums, written options and written swaptions which are valued at market value. |
| † |
Only variation margin receivable (payable) at period end is reported within the statement of assets and liabilities. This
amount reflects cumulative unrealized appreciation (depreciation) on futures and centrally cleared swaps as reported in the portfolio of investments. Where applicable, centrally cleared swaps with upfront premiums are presented here at market value.
|
3. Currency Translation
Assets and liabilities
denominated in foreign currencies and commitments under forward currency exchange contracts are translated into U.S. dollars at the mean of the quoted bid and ask prices of such currencies against the U.S. dollar. Purchases and sales of portfolio
securities are translated into U.S. dollars at the rates of exchange prevailing when such securities were acquired or sold. Income and expenses are translated into U.S. dollars at the rates of exchange prevailing when accrued.
Net realized gain or loss on foreign currency transactions represents foreign exchange gains and losses from sales and maturities of foreign fixed income investments,
holding of foreign currencies, currency gains or losses realized between the trade and settlement dates on foreign investment transactions, and the difference between the amounts of dividends, interest and foreign withholding taxes recorded on the
Fund’s books and the U.S. dollar equivalent amounts actually received or paid. Net unrealized currency gains and losses from valuing foreign currency denominated assets and liabilities at period end exchange rates are reflected as a component
of net unrealized appreciation or depreciation of foreign currency denominated assets and liabilities.
4. Taxes
It is the Fund’s policy to meet the requirements of the Internal Revenue Code applicable to regulated investment companies and to distribute all of its investment
company taxable income and net realized gains, if any, to
|
|
|
|
|
| abfunds.com |
|
ALLIANCEBERNSTEIN GLOBAL HIGH INCOME FUND | 89 |
NOTES TO FINANCIAL STATEMENTS (continued)
shareholders. Therefore, no provisions for federal income or excise taxes are required. The Fund may be subject to taxes imposed by countries in which it invests. Such
taxes are generally based on income and/or capital gains earned or repatriated. Taxes are accrued and applied to net investment income, net realized gains and net unrealized appreciation/depreciation as such income and/or gains are earned.
In accordance with U.S. GAAP requirements regarding accounting for uncertainties in income taxes, management has analyzed the Fund’s tax positions taken or
expected to be taken on federal and state income tax returns for all open tax years (the current and the prior three tax years) and has concluded that no provision for income tax is required in the Fund’s financial statements.
5. Investment Income and Investment Transactions
Dividend income is
recorded on the ex-dividend date or as soon as the Fund is informed of the dividend. Interest income is accrued daily. Investment transactions are accounted for on the date the securities are purchased or
sold. Investment gains or losses are determined on the identified cost basis. Non-cash dividends, if any, are recorded on the ex-dividend date at the fair value of the
securities received. The Fund amortizes premiums and accretes discounts as adjustments to interest income. The Fund accounts for distributions received from REIT investments or from regulated investment companies as dividend income,
realized gain, or return of capital based on information provided by the REIT or the investment company.
6. Dividends and Distributions
Dividends and distributions to shareholders, if any, are recorded on the ex-dividend date. Income dividends and capital gains
distributions are determined in accordance with federal tax regulations and may differ from those determined in accordance with U.S. GAAP. To the extent these differences are permanent, such amounts are reclassified within the capital accounts based
on their federal tax basis treatment; temporary differences do not require such reclassification.
NOTE B
Advisory Fee and Other Transactions with Affiliates
Under the terms of the investment advisory agreement, the Fund pays the Adviser an advisory fee at an annual rate of .90% of the Fund’s average weekly net assets.
Such fee is accrued daily and paid monthly.
Pursuant to the administration agreement, the Fund may reimburse the Adviser for certain legal and accounting services
provided to the Fund by the Adviser, provided, however, that the reimbursement may not exceed
|
|
|
|
|
| 90 | ALLIANCEBERNSTEIN
GLOBAL HIGH INCOME FUND |
|
abfunds.com |
NOTES TO FINANCIAL STATEMENTS (continued)
.15%
annualized of average weekly net assets. For the six months ended September 30, 2023, the reimbursement for such services amounted to $49,040.
Under the
terms of a Shareholder Inquiry Agency Agreement with AllianceBernstein Investor Services, Inc. (“ABIS”), a wholly owned subsidiary of the Adviser, the Fund reimburses ABIS for costs relating to servicing phone inquiries on behalf of the
Fund. During the six months ended September 30, 2023, there was no such reimbursement paid to ABIS.
The Fund may invest in AB Government Money Market
Portfolio (the “Government Money Market Portfolio”) which has a contractual annual advisory fee rate of .20% of the portfolio’s average daily net assets and bears its own expenses. The Adviser had contractually agreed to waive .10% of
the advisory fee of Government Money Market Portfolio (resulting in a net advisory fee of .10%) until August 31, 2023. Effective September 1, 2023, the Adviser has contractually agreed to waive .05% of the advisory fee of Government Money
Market Portfolio (resulting in a net advisory fee of .15%) until August 31, 2024. In connection with the investment by the Fund in Government Money Market Portfolio, the Adviser has contractually agreed to waive its advisory fee from the Fund
in an amount equal to the Fund’s pro rata share of the effective advisory fee of Government Money Market Portfolio, as borne indirectly by the Fund as an acquired fund fee and expense. For the six months ended September 30, 2023, such
waiver amounted to $4,841.
A summary of the Fund’s transactions in AB mutual funds for the six months ended September 30, 2023 is as follows:
|
|
|
|
|
|
|
|
|
|
|
|
|
|
|
|
|
|
|
|
|
| Fund |
|
Market Value
3/31/23
(000) |
|
|
Purchases
at Cost
(000) |
|
|
Sales
Proceeds
(000) |
|
|
Market Value
9/30/23
(000) |
|
|
Dividend
Income
(000) |
|
| Government Money Market Portfolio |
|
$ |
10,074 |
|
|
$ |
94,007 |
|
|
$ |
100,243 |
|
|
$ |
3,838 |
|
|
$ |
224 |
|
NOTE C
Investment Transactions
Purchases and sales of investment securities (excluding short-term investments) for the six months ended
September 30, 2023, were as follows:
|
|
|
|
|
|
|
|
|
| |
|
Purchases |
|
|
Sales |
|
| Investment securities (excluding U.S. government securities) |
|
$ |
163,943,575 |
|
|
$ |
151,847,254 |
|
| U.S. government securities |
|
|
– 0 |
– |
|
|
4,251,406 |
|
|
|
|
|
|
| abfunds.com |
|
ALLIANCEBERNSTEIN GLOBAL HIGH INCOME FUND | 91 |
NOTES TO FINANCIAL STATEMENTS (continued)
The cost of
investments for federal income tax purposes was substantially the same as the cost for financial reporting purposes. Accordingly, gross unrealized appreciation and unrealized depreciation are as follows:
|
|
|
|
|
| Gross unrealized appreciation |
|
$ |
14,174,434 |
|
| Gross unrealized depreciation |
|
|
(128,476,011 |
) |
|
|
|
|
|
| Net unrealized depreciation |
|
$ |
(114,301,577 |
) |
|
|
|
|
|
1. Derivative Financial Instruments
The
Fund may use derivatives in an effort to earn income and enhance returns, to replace more traditional direct investments, to obtain exposure to otherwise inaccessible markets (collectively, “investment purposes”), or to hedge or adjust the
risk profile of its portfolio.
The principal types of derivatives utilized by the Fund, as well as the methods in which they may be used are:
| |
• |
|
Forward Currency Exchange Contracts |
The Fund may enter into forward currency exchange contracts in order to hedge its exposure to changes in foreign currency exchange rates on its foreign
portfolio holdings, to hedge certain firm purchase and sale commitments denominated in foreign currencies and for non-hedging purposes as a means of making direct investments in foreign currencies, as
described below under “Currency Transactions”.
A forward currency exchange contract is a commitment to purchase or sell a foreign
currency at a future date at a negotiated forward rate. The gain or loss arising from the difference between the original contract and the closing of such contract would be included in net realized gain or loss on forward currency exchange
contracts. Fluctuations in the value of open forward currency exchange contracts are recorded for financial reporting purposes as unrealized appreciation and/or depreciation by the Fund. Risks may arise from the potential inability of a counterparty
to meet the terms of a contract and from unanticipated movements in the value of a foreign currency relative to the U.S. dollar.
During the six
months ended September 30, 2023, the Fund held forward currency exchange contracts for hedging purposes.
The Fund may buy or sell futures for investment purposes or for the purpose of hedging its portfolio against adverse effects of potential movements in
the market. The Fund bears the market risk that arises from changes in the value of these instruments and the imperfect correlation between movements in the price of the futures and movements in the price of the assets, reference rates or indices
which they are designed to track. Among other things, the Fund may purchase
|
|
|
|
|
| 92 | ALLIANCEBERNSTEIN
GLOBAL HIGH INCOME FUND |
|
abfunds.com |
NOTES TO FINANCIAL STATEMENTS (continued)
or sell futures for foreign currencies or options thereon for non-hedging purposes as a means of making direct
investment in foreign currencies, as described below under “Currency Transactions”.
At the time the Fund enters into futures, the Fund
deposits and maintains as collateral an initial margin with the broker, as required by the exchange on which the transaction is effected. Such amount is shown as cash collateral due from broker on the statement of assets and liabilities. Pursuant to
the contract, the Fund agrees to receive from or pay to the broker an amount of cash equal to the daily fluctuation in the value of the contract. Such receipts or payments are known as variation margin and are recorded by the Fund as unrealized
gains or losses. Risks may arise from the potential inability of a counterparty to meet the terms of the contract. The credit/counterparty risk for exchange-traded futures is generally less than privately negotiated futures, since the clearinghouse,
which is the issuer or counterparty to each exchange-traded future, has robust risk mitigation standards, including the requirement to provide initial and variation margin. When the contract is closed, the Fund records a realized gain or loss equal
to the difference between the value of the contract at the time it was opened and the time it was closed.
Use of long futures subjects the Fund to
risk of loss in excess of the amounts shown on the statement of assets and liabilities, up to the notional value of the futures. Use of short futures subjects the Fund to unlimited risk of loss. Under some circumstances, futures exchanges may
establish daily limits on the amount that the price of futures can vary from the previous day’s settlement price, which could effectively prevent liquidation of unfavorable positions.
During the six months ended September 30, 2023, the Fund held futures for hedging and non-hedging
purposes.
For hedging and investment purposes, the Fund may purchase and write (sell) put and call options on U.S. and foreign securities, including government
securities, and foreign currencies that are traded on U.S. and foreign securities exchanges and over-the-counter markets. Among other things, the Fund may use options
transactions for non-hedging purposes as a means of making direct investments in foreign currencies, as described below under “Currency Transactions” and may use options strategies involving the
purchase and/or writing of various combinations of call and/or put options, for hedging and investment purposes.
The risk associated with
purchasing an option is that the Fund pays a premium whether or not the option is exercised. Additionally, the Fund
|
|
|
|
|
| abfunds.com |
|
ALLIANCEBERNSTEIN GLOBAL HIGH INCOME FUND | 93 |
NOTES TO FINANCIAL STATEMENTS (continued)
bears the risk of loss of the premium and change in market value should the counterparty not perform under the contract. If a put or call purchased
option by the Fund were permitted to expire without being sold or exercised, its premium would represent a loss to the Fund. Put and call purchased options are accounted for in the same manner as portfolio securities. The cost of securities acquired
through the exercise of call options is increased by premiums paid. The proceeds from securities sold through the exercise of put options are decreased by the premiums paid.
When the Fund writes an option, the premium received by the Fund is recorded as a liability and is subsequently adjusted to the current market value of
the written option. The Fund’s maximum payment for written put options equates to the number of shares multiplied by the strike price. In certain circumstances maximum payout amounts may be partially offset by recovery values of the respective
referenced assets and upfront premium received upon entering into the contract. Premiums received from written options which expire unexercised are recorded by the Fund on the expiration date as realized gains from written options. The difference
between the premium received and the amount paid on effecting a closing purchase transaction, including brokerage commissions, is also treated as a realized gain, or if the premium received is less than the amount paid for the closing purchase
transaction, as a realized loss. If a call option is exercised, the premium received is added to the proceeds from the sale of the underlying security or currency in determining whether the Fund has realized a gain or loss. If a put option is
exercised, the premium received reduces the cost basis of the security or currency purchased by the Fund. In writing an option, the Fund bears the market risk of an unfavorable change in the price of the security or currency underlying the written
option. Exercise of a written option by the Fund could result in the Fund selling or buying a security or currency at a price different from the current market value.
The Fund may also invest in options on swap agreements, also called “swaptions”. A swaption is an option that gives the buyer the right, but
not the obligation, to enter into a swap on a future date in exchange for paying a market-based “premium”. A receiver swaption gives the owner the right to receive the total return of a specified asset, reference rate, or index. A payer
swaption gives the owner the right to pay the total return of a specified asset, reference rate, or index. Swaptions also include options that allow an existing swap to be terminated or extended by one of the counterparties. The Fund’s maximum
payment for written put swaptions equates to the notional amount of the underlying swap. In certain circumstances maximum
|
|
|
|
|
| 94 | ALLIANCEBERNSTEIN
GLOBAL HIGH INCOME FUND |
|
abfunds.com |
NOTES TO FINANCIAL STATEMENTS (continued)
payout amounts may be partially offset by recovery values of the respective referenced assets and upfront premium received upon entering into the
contract.
During the six months ended September 30, 2023, the Fund held purchased options for
non-hedging purposes.
During the six months ended September 30, 2023, the Fund held written options
for non-hedging purposes.
The Fund may enter into swaps to hedge its exposure to interest rates, credit risk or currencies. The Fund may also enter into swaps for non-hedging purposes as a means of gaining market exposures including by making direct investments in foreign currencies, as described below under “Currency Transactions” or in order to take a
“long” or “short” position with respect to an underlying referenced asset described below under “Total Return Swaps”. A swap is an agreement that obligates two parties to exchange a series of cash flows at specified
intervals based upon or calculated by reference to changes in specified prices or rates for a specified amount of an underlying asset. The payment flows are usually netted against each other, with the difference being paid by one party to the other.
In addition, collateral may be pledged or received by the Fund in accordance with the terms of the respective swaps to provide value and recourse to the Fund or its counterparties in the event of default, bankruptcy or insolvency by one of the
parties to the swap.
Risks may arise as a result of the failure of the counterparty to the swap to comply with the terms of the swap. The loss
incurred by the failure of a counterparty is generally limited to the net interim payment to be received by the Fund, and/or the termination value at the end of the contract. Therefore, the Fund considers the creditworthiness of each counterparty to
a swap in evaluating potential counterparty risk. This risk is mitigated by having a netting arrangement between the Fund and the counterparty and by the posting of collateral by the counterparty to the Fund to cover the Fund’s exposure to the
counterparty. Additionally, risks may arise from unanticipated movements in interest rates or in the value of the underlying securities. The Fund accrues for the interim payments on swaps on a daily basis, with the net amount recorded within
unrealized appreciation/depreciation of swaps on the statement of assets and liabilities, where applicable. Once the interim payments are settled in cash, the net amount is recorded as realized gain/(loss) on swaps on the statement of operations, in
addition to any realized gain/(loss) recorded upon the termination of swaps. Upfront premiums paid or received for swaps are recognized as cost or proceeds on the statement of assets and liabilities and are amortized
|
|
|
|
|
| abfunds.com |
|
ALLIANCEBERNSTEIN GLOBAL HIGH INCOME FUND | 95 |
NOTES TO FINANCIAL STATEMENTS (continued)
on a straight line basis over the life of the contract. Amortized upfront premiums are included in net realized gain/(loss) from swaps on the statement
of operations. Fluctuations in the value of swaps are recorded as a component of net change in unrealized appreciation/depreciation of swaps on the statement of operations.
Certain standardized swaps, including certain interest rate swaps and credit default swaps, are (or soon will be) subject to mandatory central clearing.
Cleared swaps are transacted through futures commission merchants (“FCMs”) that are members of central clearinghouses, with the clearinghouse serving as central counterparty, similar to transactions in futures contracts. Centralized
clearing will be required for additional categories of swaps on a phased-in basis based on requirements published by the Securities and Exchange Commission and Commodity Futures Trading Commission.
At the time the Fund enters into a centrally cleared swap, the Fund deposits and maintains as collateral an initial margin with the broker, as required
by the clearinghouse on which the transaction is effected. Such amount is shown as cash collateral due from broker on the statement of assets and liabilities. Pursuant to the contract, the Fund agrees to receive from or pay to the broker an amount
of cash equal to the daily fluctuation in the value of the contract. Such receipts or payments are known as variation margin and are recorded by the Fund as unrealized gains or losses. Risks may arise from the potential inability of a counterparty
to meet the terms of the contract. The credit/counterparty risk for centrally cleared swaps is generally less than non-centrally cleared swaps, since the clearinghouse, which is the issuer or counterparty to
each centrally cleared swap, has robust risk mitigation standards, including the requirement to provide initial and variation margin. When the contract is closed, the Fund records a realized gain or loss equal to the difference between the value of
the contract at the time it was opened and the time it was closed.
Credit Default Swaps:
The Fund may enter into credit default swaps, including to manage its exposure to the market or certain sectors of the market, to reduce its risk
exposure to defaults by corporate and sovereign issuers held by the Fund, or to create exposure to corporate or sovereign issuers to which it is not otherwise exposed. The Fund may purchase credit protection (“Buy Contract”) or provide
credit protection (“Sale Contract”) on the referenced obligation of the credit default swap. During the term of the swap, the Fund receives/(pays) fixed payments from/(to) the respective counterparty, calculated at the agreed upon rate
applied to the notional amount. If the Fund is a buyer/(seller) of protection and a credit event occurs, as defined under the terms of
|
|
|
|
|
| 96 | ALLIANCEBERNSTEIN
GLOBAL HIGH INCOME FUND |
|
abfunds.com |
NOTES TO FINANCIAL STATEMENTS (continued)
the swap, the Fund will either (i) receive from the seller/(pay to the buyer) of protection an amount equal to the notional amount of the swap
(the “Maximum Payout Amount”) and deliver/(take delivery of) the referenced obligation or (ii) receive/(pay) a net settlement amount in the form of cash or securities equal to the notional amount of the swap less the recovery value of
the referenced obligation. In certain circumstances Maximum Payout Amounts may be partially offset by recovery values of the respective referenced obligations, upfront premium received upon entering into the agreement, or net amounts received from
settlement of buy protection credit default swaps entered into by the Fund for the same referenced obligation with the same counterparty.
Credit
default swaps may involve greater risks than if the Fund had invested in the referenced obligation directly. Credit default swaps are subject to general market risk, liquidity risk, counterparty risk and credit risk. If the Fund is a buyer of
protection and no credit event occurs, it will lose the payments it made to its counterparty. If the Fund is a seller of protection and a credit event occurs, the value of the referenced obligation received by the Fund coupled with the periodic
payments previously received may be less than the Maximum Payout Amount it pays to the buyer, resulting in a net loss to the Fund.
Implied credit
spreads over U.S. Treasuries of comparable maturity utilized in determining the market value of credit default swaps on issuers as of period end are disclosed in the portfolio of investments. The implied spreads serve as an indicator of the current
status of the payment/performance risk and typically reflect the likelihood of default by the issuer of the referenced obligation. The implied credit spread of a particular reference obligation also reflects the cost of buying/selling protection and
may reflect upfront payments required to be made to enter into the agreement. Widening credit spreads typically represent a deterioration of the referenced obligation’s credit soundness and greater likelihood of default or other credit event
occurring as defined under the terms of the agreement. A credit spread identified as “Defaulted” indicates a credit event has occurred for the referenced obligation.
During the six months ended September 30, 2023, the Fund held credit default swaps for non-hedging
purposes.
Total Return Swaps:
The Fund
may enter into total return swaps in order to take a “long” or “short” position with respect to an underlying referenced asset. The Fund is subject to market price volatility of the underlying referenced asset. A total return
swap involves commitments to pay interest in exchange for a market linked return based on a notional amount. To the extent that the total return of the security, group of securities or
|
|
|
|
|
| abfunds.com |
|
ALLIANCEBERNSTEIN GLOBAL HIGH INCOME FUND | 97 |
NOTES TO FINANCIAL STATEMENTS (continued)
index underlying the transaction exceeds or falls short of the offsetting interest obligation, the Fund will receive a payment from or make a payment to
the counterparty.
During the six months ended September 30, 2023, the Fund held total return swaps for
non-hedging purposes.
The Fund typically enters into International Swaps and Derivatives Association, Inc. Master
Agreements (“ISDA Master Agreement”) with its OTC derivative contract counterparties in order to, among other things, reduce its credit risk to OTC counterparties. ISDA Master Agreements include provisions for general obligations,
representations, collateral and events of default or termination. Under an ISDA Master Agreement, the Fund typically may offset with the OTC counterparty certain derivative financial instruments’ payables and/or receivables with collateral held
and/or posted and create one single net payment (close-out netting) in the event of default or termination. In the event of a default by an OTC counterparty, the return of collateral with market value in
excess of the Fund’s net liability, held by the defaulting party, may be delayed or denied.
The Fund’s ISDA Master Agreements may contain provisions for
early termination of OTC derivative transactions in the event the net assets of the Fund decline below specific levels (“net asset contingent features”). If these levels are triggered, the Fund’s OTC counterparty has the right to
terminate such transaction and require the Fund to pay or receive a settlement amount in connection with the terminated transaction. If OTC derivatives were held at period end, please refer to netting arrangements by the OTC counterparty tables
below for additional details.
During the six months ended September 30, 2023, the Fund had entered into the following derivatives:
|
|
|
|
|
|
|
|
|
|
|
|
|
| |
|
Asset Derivatives |
|
|
Liability Derivatives |
|
| Derivative Type |
|
Statement of
Assets and
Liabilities
Location |
|
Fair Value |
|
|
Statement of
Assets and
Liabilities
Location |
|
Fair Value |
|
| Interest rate
contracts |
|
|
|
|
|
|
|
Payable
for variation margin
on futures |
|
$ |
1,434,281 |
* |
|
|
|
|
|
| Foreign currency
contracts |
|
Unrealized
appreciation on
forward
currency
exchange contracts |
|
$ |
2,130,736 |
|
|
Unrealized
depreciation on
forward
currency
exchange contracts |
|
|
20,572 |
|
|
|
|
|
|
| Credit contracts |
|
Market value of
credit default
swaps |
|
|
6,071 |
|
|
Market value of
credit default
swaps |
|
|
2,188,567 |
|
|
|
|
|
|
| 98 | ALLIANCEBERNSTEIN
GLOBAL HIGH INCOME FUND |
|
abfunds.com |
NOTES TO FINANCIAL STATEMENTS (continued)
|
|
|
|
|
|
|
|
|
|
|
|
|
| |
|
Asset Derivatives |
|
|
Liability Derivatives |
|
| Derivative Type |
|
Statement of
Assets and
Liabilities
Location |
|
Fair Value |
|
|
Statement of
Assets and
Liabilities
Location |
|
Fair Value |
|
|
|
|
|
|
| Credit contracts |
|
Receivable for variation margin on centrally cleared swaps |
|
$ |
544,495 |
* |
|
Payable for variation margin on centrally cleared swaps |
|
$ |
310,867 |
* |
|
|
|
|
|
| Credit contracts |
|
|
|
|
|
|
|
Unrealized depreciation on
total return swaps |
|
|
90,096 |
|
|
|
|
|
|
| Equity contracts |
|
Investment in
securities, at value |
|
|
475,820 |
|
|
Written options, at value |
|
|
158,730 |
|
|
|
|
|
|
|
|
|
|
|
|
|
|
| Total |
|
|
|
$ |
3,157,122 |
|
|
|
|
$ |
4,203,113 |
|
|
|
|
|
|
|
|
|
|
|
|
|
|
| * |
Only variation margin receivable (payable) at period end is reported within the statement of assets and liabilities. This
amount reflects cumulative unrealized appreciation (depreciation) on futures and centrally cleared swaps as reported in the portfolio of investments. |
|
|
|
|
|
|
|
|
|
|
|
| Derivative Type |
|
Location of Gain
or (Loss)
on
Derivatives Within
Statement of
Operations |
|
Realized Gain
or (Loss) on
Derivatives |
|
|
Change in
Unrealized
Appreciation or
(Depreciation) |
|
| Interest rate contracts |
|
Net realized gain/(loss) on futures; Net change in unrealized appreciation (depreciation) on futures |
|
$ |
(2,351,300 |
) |
|
$ |
(3,881,499 |
) |
|
|
|
|
| Foreign currency
contracts |
|
Net realized gain/(loss) on forward currency exchange contracts; Net
change in unrealized appreciation (depreciation) on forward currency exchange contracts |
|
|
(1,994,823 |
) |
|
|
3,269,607 |
|
|
|
|
|
| Credit contracts |
|
Net realized gain/(loss) on swaps; Net change in unrealized appreciation (depreciation) on swaps |
|
|
6,779,848 |
|
|
|
(669,526 |
) |
|
|
|
|
| Equity contracts |
|
Net realized gain/(loss) on written options; Net change in unrealized appreciation (depreciation) on purchased options |
|
|
– 0 |
– |
|
|
167,016 |
|
|
|
|
|
| Equity contracts |
|
Net realized gain/(loss) on written options; Net change in unrealized appreciation (depreciation) on written options |
|
|
– 0 |
– |
|
|
20,274 |
|
|
|
|
|
|
|
|
|
|
|
|
| Total |
|
|
|
$ |
2,433,725 |
|
|
$ |
(1,094,128 |
) |
|
|
|
|
|
|
|
|
|
|
|
|
|
|
|
|
| abfunds.com |
|
ALLIANCEBERNSTEIN GLOBAL HIGH INCOME FUND | 99 |
NOTES TO FINANCIAL STATEMENTS (continued)
The
following table represents the average monthly volume of the Fund’s derivative transactions during the six months ended September 30, 2023:
|
|
|
|
|
| Centrally Cleared Credit Default Swaps: |
|
|
|
|
| Average notional amount of sale contracts |
|
$ |
185,091,708 |
|
|
|
|
|
|
| Credit Default Swaps: |
|
|
|
|
| Average notional amount of sale contracts |
|
$ |
17,602,768 |
|
|
|
|
|
|
| Forward Currency Exchange Contracts: |
|
|
|
|
| Average principal amount of buy contracts |
|
$ |
11,161,247 |
|
| Average principal amount of sale contracts |
|
$ |
64,665,134 |
|
|
|
|
|
|
| Futures: |
|
|
|
|
| Average notional amount of buy contracts |
|
$ |
100,047,032 |
|
|
|
|
|
|
| Total Return Swaps: |
|
|
|
|
| Average notional amount |
|
$ |
9,679,610 |
|
|
|
|
|
|
| Written Options: |
|
|
|
|
| Average notional amount |
|
$ |
29,452,000 |
(a) |
|
|
|
|
|
| Purchased Options: |
|
|
|
|
| Average notional amount |
|
$ |
31,228,000 |
(a) |
| (a) |
Positions were open for two months during the reporting period. |
For financial reporting purposes, the Fund does not offset derivative assets and derivative liabilities that are subject to netting arrangements in the statement of
assets and liabilities.
All OTC derivatives held at period end were subject to netting arrangements. The following table presents the Fund’s derivative
assets and liabilities by OTC counterparty net of amounts available for offset under ISDA Master Agreements (“MA”) and net of the related collateral received/pledged by the Fund as of September 30, 2023. Exchange-traded derivatives
and centrally cleared swaps are not subject to netting arrangements and as such are excluded from the tables.
|
|
|
|
|
| 100 | ALLIANCEBERNSTEIN
GLOBAL HIGH INCOME FUND |
|
abfunds.com |
NOTES TO FINANCIAL STATEMENTS (continued)
|
|
|
|
|
|
|
|
|
|
|
|
|
|
|
|
|
|
|
|
|
| Counterparty |
|
Derivative
Assets
Subject to a
MA |
|
|
Derivatives
Available
for Offset |
|
|
Cash
Collateral
Received* |
|
|
Security
Collateral
Received* |
|
|
Net Amount
of Derivative
Assets |
|
| Bank of America, NA |
|
$ |
241 |
|
|
$ |
(241 |
) |
|
$ |
– 0 |
– |
|
$ |
– 0 |
– |
|
$ |
– 0 |
– |
| BNP Paribas SA |
|
|
48,725 |
|
|
|
(48,725 |
) |
|
|
– 0 |
– |
|
|
– 0 |
– |
|
|
– 0 |
– |
| Brown Brothers Harriman & Co. |
|
|
33,819 |
|
|
|
(9,459 |
) |
|
|
– 0 |
– |
|
|
– 0 |
– |
|
|
24,360 |
|
| Citibank, NA/ Citigroup Global Markets, Inc. |
|
|
79,086 |
|
|
|
(36,516 |
) |
|
|
– 0 |
– |
|
|
– 0 |
– |
|
|
42,570 |
|
| Goldman Sachs International |
|
|
6,071 |
|
|
|
(6,071 |
) |
|
|
– 0 |
– |
|
|
– 0 |
– |
|
|
– 0 |
– |
| Morgan Stanley Capital Services LLC |
|
|
1,968,053 |
|
|
|
(408,393 |
) |
|
|
– 0 |
– |
|
|
– 0 |
– |
|
|
1,559,660 |
|
| UBS AG |
|
|
812 |
|
|
|
(447 |
) |
|
|
– 0 |
– |
|
|
– 0 |
– |
|
|
365 |
|
|
|
|
|
|
|
|
|
|
|
|
|
|
|
|
|
|
|
|
|
|
| Total |
|
$ |
2,136,807 |
|
|
$ |
(509,852 |
) |
|
$ |
– 0 |
– |
|
$ |
– 0 |
– |
|
$ |
1,626,955 |
^ |
|
|
|
|
|
|
|
|
|
|
|
|
|
|
|
|
|
|
|
|
|
|
|
|
|
|
|
|
|
|
|
|
|
|
|
|
|
|
|
|
|
|
| Counterparty |
|
Derivative
Liabilities
Subject to a
MA |
|
|
Derivatives
Available
for Offset |
|
|
Cash
Collateral
Pledged* |
|
|
Security
Collateral
Pledged* |
|
|
Net Amount
of Derivative
Liabilities |
|
| Bank of America, NA |
|
$ |
249 |
|
|
$ |
(241 |
) |
|
$ |
– 0 |
– |
|
$ |
– 0 |
– |
|
$ |
8 |
|
| BNP Paribas SA |
|
|
93,611 |
|
|
|
(48,725 |
) |
|
|
– 0 |
– |
|
|
– 0 |
– |
|
|
44,886 |
|
| Brown Brothers Harriman & Co. |
|
|
9,459 |
|
|
|
(9,459 |
) |
|
|
– 0 |
– |
|
|
– 0 |
– |
|
|
– 0 |
– |
| Citibank, NA/ Citigroup Global Markets, Inc. |
|
|
36,516 |
|
|
|
(36,516 |
) |
|
|
– 0 |
– |
|
|
– 0 |
– |
|
|
– 0 |
– |
| Deutsche Bank AG |
|
|
43,760 |
|
|
|
– 0 |
– |
|
|
– 0 |
– |
|
|
– 0 |
– |
|
|
43,760 |
|
| Goldman Sachs International |
|
|
411,748 |
|
|
|
(6,071 |
) |
|
|
(390,000 |
) |
|
|
– 0 |
– |
|
|
15,677 |
|
| HSBC Bank USA |
|
|
1,707 |
|
|
|
– 0 |
– |
|
|
– 0 |
– |
|
|
– 0 |
– |
|
|
1,707 |
|
| JPMorgan Securities, LLC |
|
|
1,293,345 |
|
|
|
– 0 |
– |
|
|
– 0 |
– |
|
|
(1,293,345 |
) |
|
|
– 0 |
– |
| Morgan Stanley Capital Services LLC |
|
|
408,393 |
|
|
|
(408,393 |
) |
|
|
– 0 |
– |
|
|
– 0 |
– |
|
|
– 0 |
– |
| UBS AG |
|
|
447 |
|
|
|
(447 |
) |
|
|
– 0 |
– |
|
|
– 0 |
– |
|
|
– 0 |
– |
|
|
|
|
|
|
|
|
|
|
|
|
|
|
|
|
|
|
|
|
|
| Total |
|
$ |
2,299,235 |
|
|
$ |
(509,852 |
) |
|
$ |
(390,000 |
) |
|
$ |
(1,293,345 |
) |
|
$ |
106,038 |
^ |
|
|
|
|
|
|
|
|
|
|
|
|
|
|
|
|
|
|
|
|
|
| * |
The actual collateral received/pledged may be more than the amount reported due to overcollateralization.
|
| ^ |
Net amount represents the net receivable (payable) that would be due from/to the counterparty in the event of default or
termination. The net amount from OTC financial derivative instruments can only be netted across transactions governed under the same master agreement with the same counterparty. |
| |
See Note C.3 for additional disclosure of netting arrangements regarding reverse repurchase agreements.
|
2. Currency Transactions
The Fund may invest in non-U.S. Dollar-denominated securities on a currency hedged or unhedged basis. The Fund may seek investment opportunities by taking long or short positions in currencies through the use of currency-related
derivatives, including forward currency exchange con-
|
|
|
|
|
| abfunds.com |
|
ALLIANCEBERNSTEIN GLOBAL HIGH INCOME FUND | 101 |
NOTES TO FINANCIAL STATEMENTS (continued)
tracts,
futures and options on futures, swaps, and other options. The Fund may enter into transactions for investment opportunities when it anticipates that a foreign currency will appreciate or depreciate in value but securities denominated in that
currency are not held by the Fund and do not present attractive investment opportunities. Such transactions may also be used when the Adviser believes that it may be more efficient than a direct investment in a foreign currency-denominated security.
The Fund may also conduct currency exchange contracts on a spot basis (i.e., for cash at the spot rate prevailing in the currency exchange market for buying or selling currencies).
3. Reverse Repurchase Agreements
The Fund may enter into reverse
repurchase transactions (“RVP”) in accordance with the terms of a Master Repurchase Agreement (“MRA”), under which the Fund sells securities and agrees to repurchase them at a mutually agreed upon date and price. At the time the
Fund enters into a reverse repurchase agreement, it will establish a segregated account with the custodian containing liquid assets having a value comparable to the repurchase price. Under the MRA and other Master Agreements, the Fund is permitted
to offset payables and/or receivables with collateral held and/or posted to the counterparty and create one single net payment due to or from the Fund in the event of a default. In the event of a default by a MRA counterparty, the Fund may be
considered an unsecured creditor with respect to any excess collateral (collateral with a market value in excess of the repurchase price) held by and/or posted to the counterparty, and as such the return of such excess collateral may be delayed or
denied. For the six months ended September 30, 2023, the average amount of reverse repurchase agreements outstanding was $11,404,374 and the daily weighted average interest rate was 2.44%. At September 30, 2023, the Fund had reverse
repurchase agreements outstanding in the amount of $12,565,248 as reported in the statement of assets and liabilities.
The following table presents the
Fund’s RVP liabilities by counterparty net of the related collateral pledged by the Fund as of September 30, 2023:
|
|
|
|
|
|
|
|
|
|
|
|
|
| Counterparty |
|
RVP Liabilities
Subject to a
MRA |
|
|
Securities
Collateral
Pledged†* |
|
|
Net Amount of
RVP Liabilities |
|
| Barclays Capital, Inc |
|
$ |
7,664,864 |
|
|
$ |
(7,626,663 |
) |
|
$ |
38,201 |
|
| Jefferies LLC |
|
|
4,900,384 |
|
|
|
(4,793,073 |
) |
|
|
107,311 |
|
|
|
|
|
|
|
|
|
|
|
|
|
|
|
|
$ |
12,565,248 |
|
|
$ |
(12,419,736 |
) |
|
$ |
145,512 |
|
|
|
|
|
|
|
|
|
|
|
|
|
|
| † |
Including accrued interest. |
| * |
The actual collateral pledged may be more than the amount reported due to overcollateralization. |
|
|
|
|
|
| 102 | ALLIANCEBERNSTEIN
GLOBAL HIGH INCOME FUND |
|
abfunds.com |
NOTES TO FINANCIAL STATEMENTS (continued)
NOTE D
Capital Stock
During the six months ended September 30, 2023 and the year ended March 31, 2023, the Fund issued no shares in connection with the Fund’s dividend
reinvestment plan.
NOTE E
Risks Involved in Investing in the Fund
Market Risk—The market value of a security may move up or down, sometimes rapidly and unpredictably. These fluctuations may cause a security to be worth
less than the price originally paid for it, or less than it was worth at an earlier time. Market risk may affect a single issuer, industry, sector of the economy or the market as a whole. Global economies and financial markets are increasingly
interconnected, which increases the probabilities that conditions in one country or region might adversely impact issuers in a different country or region. Conditions affecting the general economy, including political, social, or economic
instability at the local, regional, or global level may also affect the market value of a security. Health crises, such as pandemic and epidemic diseases, as well as other incidents that interrupt the expected course of events, such as natural
disasters, including fires, earthquakes and flooding, war or civil disturbance, acts of terrorism, power outages and other unforeseeable and external events, and the public response to or fear of such diseases or events, have had, and may in the
future have, an adverse effect on the Fund’s investments and net asset value and can lead to increased market volatility. For example, the diseases or events themselves or any preventative or protective actions that governments may take in
respect of such diseases or events may result in periods of business disruption, inability to obtain raw materials, supplies and component parts, and reduced or disrupted operations for the Fund’s portfolio companies. The occurrence and
pendency of such diseases or events could adversely affect the economies and financial markets either in specific countries or worldwide.
Interest-Rate
Risk—Changes in interest rates will affect the value of investments in fixed-income securities. When interest rates rise, the value of existing investments in fixed-income securities tends to fall and this decrease in value may not be
offset by higher income from new investments. Interest-rate risk is generally greater for fixed-income securities with longer maturities or durations. The Fund may be subject to a greater risk of rising interest rates than would normally be the case
due to the recent end of a period of historically low rates and the effect of potential central bank monetary policy, and government fiscal policy, initiatives and resulting market reactions to those initiatives.
|
|
|
|
|
| abfunds.com |
|
ALLIANCEBERNSTEIN GLOBAL HIGH INCOME FUND | 103 |
NOTES TO FINANCIAL STATEMENTS (continued)
Credit
Risk—An issuer or guarantor of a fixed-income security, or the counterparty to a derivatives or other contract, may be unable or unwilling to make timely payments of interest or principal, or to otherwise honor its obligations. The issuer
or guarantor may default, causing a loss of the full principal amount of a security and accrued interest. The degree of risk for a particular security may be reflected in its credit rating. There is the possibility that the credit rating of a
fixed-income security may be downgraded after purchase, which may adversely affect the value of the security.
Below Investment-Grade Securities
Risk—Investments in fixed-income securities with lower ratings (commonly known as “junk bonds”) are subject to a higher probability that an issuer will default or fail to meet its payment obligations. These securities may be
subject to greater price volatility due to such factors as specific corporate developments and negative perceptions of the junk bond market generally and may be more difficult to trade than other types of securities.
Duration Risk—Duration is a measure that relates the expected price volatility of a fixed-income security to changes in interest rates. The duration of a
fixed-income security may be shorter than or equal to full maturity of a fixed-income security. Fixed-income securities with longer durations have more risk and will decrease in price as interest rates rise.
Inflation Risk—This is the risk that the value of assets or income from investments will be less in the future as inflation decreases the value of money.
As inflation increases, the value of the Fund’s assets can decline as can the value of the Fund’s distributions. This risk is significantly greater for fixed-income securities with longer maturities.
Foreign (Non-US) Risk—Investments in securities of non-US issuers may
involve more risk than those of US issuers. These securities may fluctuate more widely in price and may be more difficult to trade due to adverse market, economic, political, regulatory or other factors.
Emerging-Market Risk—Investments in emerging-market countries may have more risk because the markets are less developed and less liquid and are subject to
increased economic, political, regulatory or other uncertainties.
Currency Risk—Fluctuations in currency exchange rates may negatively affect the
value of the Fund’s investments or reduce its returns.
Leverage Risk—As a result of the Fund’s use of leveraging techniques, its NAV may be
more volatile because leverage tends to exaggerate the effect of changes in interest rates and any increase or decrease in the value of the Fund’s investments.
|
|
|
|
|
| 104 | ALLIANCEBERNSTEIN
GLOBAL HIGH INCOME FUND |
|
abfunds.com |
NOTES TO FINANCIAL STATEMENTS (continued)
Derivatives Risk—Derivatives may be difficult to price or unwind and leveraged so that small changes may produce disproportionate losses for the Fund. A
short position in a derivative instrument involves the risk of a theoretically unlimited increase in the value of the underlying instrument, which could cause the Fund to suffer a (potentially unlimited) loss. Derivatives, especially over-the-counter derivatives, are also subject to counterparty risk, which is the risk that the counterparty (the party on the other side of the transaction) on a derivative
transaction will be unable or unwilling to honor its contractual obligations to the Fund.
Illiquid Investments Risk—Illiquid investments risk exists
when certain investments become difficult to purchase or sell. Difficulty in selling such investments may result in sales at disadvantageous prices affecting the value of your investment in the Fund. Causes of illiquid investments risk may include
low trading volumes, large positions and heavy redemptions of Fund shares. Illiquid investments risk may be higher in a rising interest rate environment, when the value and liquidity of fixed-income securities generally decline.
Mortgage-Related and/or Other Asset-Backed Securities Risk—The Fund may invest in mortgage-backed and/or other asset-backed securities, including
securities backed by mortgages and assets with an international or emerging-markets origination and securities backed by non-performing loans at the time of investment. Investments in mortgage-related and
other asset-backed securities are subject to certain additional risks. The value of these securities may be particularly sensitive to changes in interest rates. These risks include “extension risk”, which is the risk that, in periods of
rising interest rates, issuers may delay the payment of principal, and “prepayment risk”, which is the risk that, in periods of falling interest rates, issuers may pay principal sooner than expected, exposing the Fund to a lower rate of
return upon reinvestment of principal. Mortgage-backed securities offered by nongovernmental issuers and other asset-backed securities may be subject to other risks, such as higher rates of default in the mortgages or assets backing the securities
or risks associated with the nature and servicing of mortgages or assets backing the securities.
LIBOR Replacement Risk—The Fund may be exposed to
debt securities, derivatives or other financial instruments that recently transitioned from the London Interbank Offered Rate, or “LIBOR,” as a “benchmark” or “reference rate” for various interest rate calculations.
LIBOR’s administrator, ICE Benchmark Administration, ceased publishing most LIBOR settings (including some U.S. LIBOR settings) by the end of 2021 and the remaining (and most widely used) U.S. Dollar LIBOR settings after June 30,
2023. The United Kingdom Financial Conduct Authority, which regulates LIBOR, will permit the use of synthetic U.S. Dollar LIBOR rates
|
|
|
|
|
| abfunds.com |
|
ALLIANCEBERNSTEIN GLOBAL HIGH INCOME FUND | 105 |
NOTES TO FINANCIAL STATEMENTS (continued)
for non-U.S. contracts through September 30, 2024, but any such rates would be considered non-representative of the underlying market. Since 2018 the Federal Reserve Bank of
New York has published the Secured Overnight Financing Rate (referred to as SOFR), which is intended to replace U.S. Dollar LIBOR. SOFR is a broad measure of the cost of borrowing cash overnight collateralized by U.S. Treasury securities in the
repurchase agreement (repo) market. There is no assurance that the composition or characteristics of SOFR or any such alternative reference rate will be similar to or produce the same value or economic equivalence as LIBOR or that the market for
SOFR-linked financial instruments will have the same volume or liquidity as did the market for LIBOR-linked financial instruments prior to LIBOR’s discontinuance or unavailability. Neither the long-term effects of the LIBOR transition process
nor its ultimate success can yet be known.
Indemnification Risk—In the ordinary course of business, the Fund enters into contracts that contain a
variety of indemnifications. The Fund’s maximum exposure under these arrangements is unknown. However, the Fund has not had prior claims or losses pursuant to these indemnification provisions and expects the risk of loss thereunder to be
remote. Therefore, the Fund has not accrued any liability in connection with these indemnification provisions.
Management
Risk—The Fund is subject to management risk because it is an actively-managed investment fund. The Adviser will apply its investment techniques and risk analyses in making investment decisions, but there is no guarantee that its techniques
will produce the intended results. Some of these techniques may incorporate, or rely upon, quantitative models, but there is no guarantee that these models will generate accurate forecasts, reduce risk or otherwise perform as expected. These models
may not work as intended and may not enable a Fund to achieve its investment objective. In addition, certain models may be constructed using data from external providers, and these inputs may be incorrect or incomplete, thus potentially limiting the
effectiveness of the models. Finally, the Adviser may change, enhance and update its models and its usage of existing models at its discretion.
|
|
|
|
|
| 106 | ALLIANCEBERNSTEIN
GLOBAL HIGH INCOME FUND |
|
abfunds.com |
NOTES TO FINANCIAL STATEMENTS (continued)
NOTE F
Distributions to Shareholders
The tax character of distributions paid for the year ending March 31, 2024 will be determined at the end of the current fiscal year. The tax character of
distributions paid during the fiscal years ended March 31, 2023 and March 31, 2022 were as follows:
|
|
|
|
|
|
|
|
|
| |
|
2023 |
|
|
2022 |
|
| Distributions paid from: |
|
|
|
|
|
|
|
|
| Ordinary income |
|
$ |
76,201,166 |
|
|
$ |
67,035,667 |
|
|
|
|
|
|
|
|
|
|
| Total taxable distributions paid |
|
$ |
76,201,166 |
|
|
$ |
67,035,667 |
|
| Return of Capital |
|
|
– 0 |
– |
|
|
740,859 |
|
|
|
|
|
|
|
|
|
|
| Total distributions paid |
|
$ |
76,201,166 |
|
|
$ |
67,776,526 |
|
|
|
|
|
|
|
|
|
|
As of March 31, 2023, the components of accumulated earnings (deficit) on a tax basis were as follows:
|
|
|
|
|
| Accumulated capital losses |
|
$ |
(105,586,035 |
)(a) |
| Other losses |
|
|
(3,106,003 |
)(b) |
| Unrealized appreciation (depreciation) |
|
|
(126,210,243 |
)(c) |
|
|
|
|
|
| Total accumulated earnings (deficit) |
|
$ |
(234,902,281 |
)(d) |
|
|
|
|
|
| (a) |
As of March 31, 2023, the Fund had a net capital loss carryforward of $105,586,035. |
| (b) |
As of March 31, 2023, the Fund had a qualified late-year ordinary loss deferral of $3,106,003. |
| (c) |
The differences between book-basis and tax-basis unrealized appreciation
(depreciation) are attributable primarily to the recognition for tax purposes of unrealized gains/losses on certain derivative instruments, the tax treatment of passive foreign investment companies (PFICs), the tax treatment of hyper-inflationary
currency contracts, the tax treatment of swaps, the tax deferral of losses on wash sales, the tax treatment of partnership investments, and the tax treatment of callable bonds. |
| (d) |
The differences between book-basis and tax-basis components of accumulated
earnings (deficit) are attributable primarily to the accrual of foreign capital gains tax and the tax treatment of defaulted securities. |
For tax
purposes, net realized capital losses may be carried over to offset future capital gains, if any. Funds are permitted to carry forward capital losses for an indefinite period, and such losses will retain their character as either short-term or
long-term capital losses. As of March 31, 2023, the Fund had a net short-term capital loss carryforward of $29,826,191 and a net long-term capital loss carryforward of $75,759,844, which may be carried forward for an indefinite period.
NOTE G
Recent
Accounting Pronouncements
In December 2022, the Financial Accounting Standards Board issued an Accounting Standards Update, ASU 2022-06, “Reference Rate Reform (Topic 848) – Deferral of the Sunset Date of Topic 848”. ASU 2022-06 is an amendment to ASU
2020-04, which provided optional guidance to ease the potential accounting burden due to the discontinuation of the
|
|
|
|
|
| abfunds.com |
|
ALLIANCEBERNSTEIN GLOBAL HIGH INCOME FUND | 107 |
NOTES TO FINANCIAL STATEMENTS (continued)
LIBOR and
other interbank-offered based reference rates and which was effective as of March 12, 2020 through December 31, 2022. ASU 2022-06 extends the effective period through December 31, 2024.
Management is currently evaluating the impact, if any, of applying ASU 2022-06.
NOTE H
Subsequent Events
Management
has evaluated subsequent events for possible recognition or disclosure in the financial statements through the date the financial statements are issued. Management has determined that there are no material events that would require disclosure in the
Fund’s financial statements through this date.
|
|
|
|
|
| 108 | ALLIANCEBERNSTEIN
GLOBAL HIGH INCOME FUND |
|
abfunds.com |
FINANCIAL HIGHLIGHTS
Selected Data For A Share of Capital Stock Outstanding Throughout Each Period
|
|
|
|
|
|
|
|
|
|
|
|
|
|
|
|
|
|
|
|
|
|
|
|
|
| |
|
Six Months
Ended
September 30,
2023
(unaudited) |
|
|
Year Ended March 31, |
|
| |
|
2023 |
|
|
2022 |
|
|
2021 |
|
|
2020 |
|
|
2019 |
|
|
|
|
|
|
|
|
|
|
|
|
|
|
|
|
|
|
|
|
|
|
|
|
|
|
|
|
|
|
|
| Net asset value, beginning of period |
|
|
$ 10.56 |
|
|
|
$ 12.02 |
|
|
|
$ 12.78 |
|
|
|
$ 10.74 |
|
|
|
$ 12.95 |
|
|
|
$ 13.56 |
|
|
|
|
|
|
| Income From Investment Operations |
|
|
|
|
|
|
|
|
|
|
|
|
|
|
|
|
|
|
|
|
|
|
|
|
|
|
|
|
|
|
|
| Net investment income(a) |
|
|
.36 |
|
|
|
.69 |
|
|
|
.61 |
|
|
|
.59 |
|
|
|
.67 |
|
|
|
.75 |
|
|
|
|
|
|
|
|
| Net realized and unrealized gain (loss) on investment and foreign currency transactions |
|
|
(.00 |
)(b) |
|
|
(1.27 |
) |
|
|
(.58 |
) |
|
|
2.24 |
|
|
|
(2.09 |
) |
|
|
(.52 |
) |
|
|
|
|
|
|
|
| Contributions from Affiliates |
|
|
– 0 |
– |
|
|
– 0 |
– |
|
|
– 0 |
– |
|
|
.00 |
(b) |
|
|
.00 |
(b) |
|
|
.00 |
(b) |
|
|
|
|
|
|
|
|
|
|
|
|
| Net increase (decrease) in net asset value from operations |
|
|
.36 |
|
|
|
(.58 |
) |
|
|
.03 |
|
|
|
2.83 |
|
|
|
(1.42 |
) |
|
|
.23 |
|
|
|
|
|
|
| Less: Dividends and Distributions |
|
|
|
|
|
|
|
|
|
|
|
|
|
|
|
|
|
|
|
|
|
|
|
|
|
|
|
|
|
|
|
| Dividends from net investment income |
|
|
(.39 |
) |
|
|
(.88 |
) |
|
|
(.78 |
) |
|
|
(.69 |
) |
|
|
(.75 |
) |
|
|
(.75 |
) |
|
|
|
|
|
|
|
| Return of capital |
|
|
– 0 |
– |
|
|
– 0 |
– |
|
|
(.01 |
) |
|
|
(.10 |
) |
|
|
(.04 |
) |
|
|
(.09 |
) |
|
|
|
|
|
|
|
|
|
|
|
|
|
|
|
|
|
|
|
|
|
|
|
|
|
|
|
|
|
|
|
|
| Total dividends and distributions |
|
|
(.39 |
) |
|
|
(.88 |
) |
|
|
(.79 |
) |
|
|
(.79 |
) |
|
|
(.79 |
) |
|
|
(.84 |
) |
|
|
|
|
|
| Net asset value, end of period |
|
|
$ 10.53 |
|
|
|
$ 10.56 |
|
|
|
$ 12.02 |
|
|
|
$ 12.78 |
|
|
|
$ 10.74 |
|
|
|
$ 12.95 |
|
|
|
|
|
|
| Market value, end of period |
|
|
$ 9.70 |
|
|
|
$ 9.72 |
|
|
|
$ 11.18 |
|
|
|
$ 11.85 |
|
|
|
$ 9.26 |
|
|
|
$ 11.59 |
|
|
|
|
|
|
|
|
|
|
|
|
|
| (Discount), end of period |
|
|
(7.88 |
)% |
|
|
(7.95 |
)% |
|
|
(6.99 |
)% |
|
|
(7.28 |
)% |
|
|
(13.78 |
)% |
|
|
(10.50 |
)% |
|
|
|
|
|
|
|
| Total Return |
|
|
|
|
|
|
|
|
|
|
|
|
|
|
|
|
|
|
|
|
|
|
|
|
|
|
|
|
|
|
|
| Total investment return
based on:(c) |
|
|
|
|
|
|
|
|
|
|
|
|
|
|
|
|
|
|
|
|
|
|
|
|
|
|
|
|
|
|
|
| Market value |
|
|
3.84 |
% |
|
|
(5.00 |
)% |
|
|
.79 |
% |
|
|
37.57 |
% |
|
|
(14.43 |
)% |
|
|
4.91 |
% |
|
|
|
|
|
|
|
| Net asset value |
|
|
3.76 |
% |
|
|
(4.01 |
)%^ |
|
|
.48 |
%^ |
|
|
27.92 |
% |
|
|
(11.18 |
)% |
|
|
2.78 |
% |
|
|
|
|
|
|
|
| Ratios/Supplemental Data |
|
|
|
|
|
|
|
|
|
|
|
|
|
|
|
|
|
|
|
|
|
|
|
|
|
|
|
|
|
|
|
| Net assets, end of period (000’s omitted) |
|
|
$907,693 |
|
|
|
$910,949 |
|
|
|
$1,036,686 |
|
|
|
$1,102,273 |
|
|
|
$926,184 |
|
|
|
$1,116,970 |
|
|
|
|
|
|
|
|
| Ratio to average net assets of: |
|
|
|
|
|
|
|
|
|
|
|
|
|
|
|
|
|
|
|
|
|
|
|
|
|
|
|
|
|
|
|
| Expenses, net of waivers/ reimbursements(d)(e)† |
|
|
1.06 |
%(f) |
|
|
1.04 |
% |
|
|
1.00 |
% |
|
|
1.02 |
% |
|
|
1.00 |
% |
|
|
1.04 |
% |
|
|
|
|
|
|
|
| Expenses, before waivers/ reimbursements(d)(e)† |
|
|
1.06 |
%(f) |
|
|
1.04 |
% |
|
|
1.00 |
% |
|
|
1.02 |
% |
|
|
1.01 |
% |
|
|
1.05 |
% |
|
|
|
|
|
|
|
| Net investment income |
|
|
6.70 |
%(f) |
|
|
6.39 |
% |
|
|
4.77 |
% |
|
|
4.88 |
% |
|
|
5.16 |
% |
|
|
5.72 |
% |
|
|
|
|
|
|
|
| Portfolio turnover rate |
|
|
17 |
% |
|
|
40 |
% |
|
|
40 |
% |
|
|
51 |
% |
|
|
32 |
% |
|
|
40 |
% |
|
|
|
|
|
|
|
|
|
|
|
|
|
|
|
|
|
|
|
|
|
|
|
|
|
| |
| † Expense ratios exclude the estimated acquired fund fees of
affiliated/unaffiliated underlying |
|
| portfolios |
|
|
.00 |
%(f) |
|
|
.00 |
% |
|
|
.00 |
% |
|
|
.00 |
% |
|
|
.01 |
% |
|
|
.01 |
% |
See footnote summary on page 109.
|
|
|
|
|
| abfunds.com |
|
ALLIANCEBERNSTEIN GLOBAL HIGH INCOME FUND | 109 |
FINANCIAL HIGHLIGHTS (continued)
Selected Data For A Share of Capital Stock Outstanding
Throughout Each Period
| (a) |
Based on average shares outstanding. |
| (b) |
Amount is less than $0.005. |
| (c) |
Total investment return is calculated assuming a purchase of common stock on the opening of the first day and a sale on
the closing of the last day of each period reported. Dividends and distributions, if any, are assumed, for purposes of this calculation, to be reinvested at prices obtained under the Fund’s Dividend Reinvestment Plan. Generally, Total
investment return based on net asset value will be higher than total investment return based on market value to the net asset value from the beginning to the end of such periods. Conversely, total investment return based on net asset value will be
lower than total investment return based on market value in periods where there is a decrease in the discount or an increase in the premium of the market value to the net asset value from the beginning to the end of such periods. Total investment
return calculated for a period of less than one year is not annualized. |
| (d) |
The expense ratios presented below exclude interest expense: |
|
|
|
|
|
|
|
|
|
|
|
|
|
|
|
|
|
|
|
|
|
|
|
|
|
| |
|
Six Months
Ended
September 30,
2023
(unaudited)(f) |
|
|
Year Ended March 31, |
|
| |
2023 |
|
|
2022 |
|
|
2021 |
|
|
2020 |
|
|
2019 |
|
| Net of waivers/reimbursements |
|
|
1.02 |
% |
|
|
1.02 |
% |
|
|
.99 |
% |
|
|
1.02 |
% |
|
|
.99 |
% |
|
|
.99 |
% |
| Before waivers/reimbursements |
|
|
1.02 |
% |
|
|
1.02 |
% |
|
|
.99 |
% |
|
|
1.02 |
% |
|
|
1.00 |
% |
|
|
1.00 |
% |
| (e) |
In connection with the Fund’s investments in affiliated underlying portfolios, the Fund incurs no direct expenses but
bears proportionate shares of the acquired fund fees and expenses (i.e. operating, administrative and investment advisory fees) of the affiliated underlying portfolios. The Adviser has contractually agreed to waive its fees from the Fund in an
amount equal to the Fund’s pro rata share of certain acquired fund fees and expenses, and for the years ended March 31, 2020 and March 31, 2019, such waiver amounted to 0.01% and 0.01%, respectively. |
| ^ |
The net asset value and total return include adjustments in accordance with accounting principles generally accepted in
the United States of America for financial reporting purposes. As such, the net asset value and total return for shareholder transactions may differ from financial statements. |
See notes to financial statements.
|
|
|
|
|
| 110 | ALLIANCEBERNSTEIN
GLOBAL HIGH INCOME FUND |
|
abfunds.com |
ADDITIONAL INFORMATION
(unaudited)
AllianceBernstein Global High Income Fund
Shareholders whose shares are registered in their own names will automatically be participants in the Dividend Reinvestment Plan (the “Plan”), pursuant to
which distributions to shareholders will be paid in or reinvested in additional shares of the Fund, unless they elect to receive cash. Computershare Trust Company N.A. (the “Agent”) will act as agent for participants under the Plan.
Shareholders whose shares are held in the name of a broker or nominee should contact such broker or nominee to determine whether or how they may participate in the Plan.
If the Board declares a distribution payable either in shares or in cash, as holders of the Common Stock may have elected,
non-participants in the Plan will receive cash and participants in the Plan will receive the equivalent in shares of Common Stock of the Fund valued as follows:
| |
(i) |
If the shares of Common Stock are trading at net asset value or at a premium above net asset value at the time of
valuation, the Fund will issue new shares at the greater of net asset value or 95% of the then current market price. |
| |
(ii) |
If the shares of Common Stock are trading at a discount from net asset value at the time of valuation, the Agent will
receive the distribution in cash and apply it to the purchase of the Fund’s shares of Common Stock in the open market on the New York Stock Exchange or elsewhere, for the participants’ accounts. Such purchases will be made on or shortly
after the payment date for such distribution and in no event more than 30 days after such date except where temporary curtailment or suspension of purchase is necessary to comply with Federal securities laws. If, before the Agent has completed its
purchases, the market price exceeds the net asset value of a share of Common Stock, the average purchase price per share paid by the Agent may exceed the net asset value of the Fund’s shares of Common Stock, resulting in the acquisition of
fewer shares than if the distribution had been paid in shares issued by the Fund. |
The Agent will maintain all shareholders’ accounts in the
Plan and furnish written confirmation of all transactions in the account, including information needed by shareholders for tax records. Shares in the account of each Plan participant will be held by the Agent in
non-certificate form in the name of the participant, and each shareholder’s proxy will include those shares purchased or received pursuant to the Plan.
There will be no charges with respect to shares issued directly by the Fund to satisfy the dividend reinvestment requirements. However, each participant
|
|
|
|
|
| abfunds.com |
|
ALLIANCEBERNSTEIN GLOBAL HIGH INCOME FUND | 111 |
ADDITIONAL INFORMATION (continued)
will pay a pro rata
share of brokerage commissions incurred with respect to the Agent’s open market purchases of shares.
The automatic reinvestment of distributions will not
relieve participants of any income taxes that may be payable (or required to be withheld) on distributions.
Experience under the Plan
may indicate that changes are desirable. Accordingly, the Fund reserves the right to amend or terminate the Plan as applied to any voluntary cash payments made and any dividend or distribution paid subsequent to written notice of the change sent to
participants in the Plan at least 90 days before the record date for such dividend or distribution. The Plan may also be amended or terminated by the Agent on at least 90 days written notice to participants in the Plan. All correspondence concerning
the Plan should be directed to the Agent at Computershare Trust Company N.A., P.O. Box 30170 College Point, TX 77842-3170.
|
|
|
|
|
| 112 | ALLIANCEBERNSTEIN
GLOBAL HIGH INCOME FUND |
|
abfunds.com |
BOARD OF DIRECTORS
|
|
|
| Garry L. Moody(1),
Chairman
Jorge A. Bermudez(1)
Michael J. Downey(1)
Onur Erzan, President and Chief Executive Officer |
|
Nancy P. Jacklin(1)
Jeanette W. Loeb(1)
Carol C. McMullen(1)
Marshall C. Turner, Jr.(1) |
OFFICERS
|
|
|
| Christian DiClementi(2), Vice President
Gershon M. Distenfeld(2), Vice President
Fahd Malik(2), Vice President
Matthew S. Sheridan(2), Vice President
William Smith(2), Vice President |
|
Nancy E. Hay, Secretary Michael B. Reyes,
Senior Vice President Stephen M. Woetzel, Treasurer and Chief Financial Officer
Phyllis J. Clarke, Controller Jennifer Friedland, Chief Compliance Officer |
|
|
|
| Administrator
AllianceBernstein, L.P. 501 Commerce Street
Nashville, TN 37203
Custodian and Accounting Agent Brown Brothers
Harriman & Co. 50 Post Office Square Boston, MA 02110
Dividend Paying Agent,
Transfer Agent and Registrar Computershare Trust
Company, N.A. P.O. Box 505000 Louisville, KY 40233 |
|
Independent Registered Public Accounting Firm
Ernst & Young LLP One Manhattan West
New York, NY 10001
Legal Counsel Seward & Kissel LLP
One Battery Park Plaza New York, NY 10004 |
| 1 |
Member of the Audit Committee, the Governance and Nominating Committee and the Independent Directors Committee.
|
| 2 |
The day-to-day management of, and
investment decisions for, the Fund’s portfolio are made by the Adviser’s Global High Income Investment Team. While all members of the team work jointly to determine the majority of the investment strategy including stock selection for the
Fund, Messrs. DiClementi, Distenfeld, Malik, Sheridan and Smith, members of the Global High Income Investment Team, are primarily responsible for the day-to-day
management of the Fund’s portfolio. |
| |
Notice is hereby given in accordance with Section 23(c) of the Investment Company Act of 1940 that the Fund may
purchase from time to time at market prices shares of its Common Stock in the open market. |
| |
This report, including the financial statements herein, is transmitted to the shareholders of AllianceBernstein Global
High Income Fund for their information. The financial information included herein is taken from the records of the Fund. This is not a prospectus, circular or representation intended for use in the purchase of shares of the Fund or any securities
mentioned in this report. |
| |
Annual Certifications—As required, on April 19, 2023, the Fund submitted to the New York Stock Exchange
(“NYSE”) the annual certification of the Fund’s Chief Executive Officer certifying that he is not aware of any violation of the NYSE’s Corporate Governance listing standards. The Fund also has included the certifications of the
Fund’s Chief Executive Officer and Chief Financial Officer required by Section 302 of the Sarbanes-Oxley Act of 2002 as exhibits to the Fund’s Form N-CSR filed with the Securities and Exchange
Commission for the reporting period. |
|
|
|
|
|
| abfunds.com |
|
ALLIANCEBERNSTEIN GLOBAL HIGH INCOME FUND | 113 |
Information Regarding the Review and Approval of the Fund’s Advisory and Administration Agreements
The disinterested directors (the “directors”) of AllianceBernstein Global High Income Fund, Inc. (the “Fund”) unanimously approved the continuance
of the Fund’s Advisory Agreement with the Adviser and the continuance of the Fund’s Administration Agreement with the Adviser (in such capacity, the “Administrator”) at a meeting held
in-person on August 1-2, 2023 (the “Meeting”).
Prior to approval of the
continuance of the Advisory Agreement and the Administration Agreement, the directors had requested from the Adviser, and received and evaluated, extensive materials. They reviewed the proposed continuance of the Advisory Agreement and
Administration Agreement with the Adviser and with experienced counsel who are independent of the Adviser, who advised on the relevant legal standards. The directors also reviewed additional materials, including comparative analytical data prepared
by the Senior Vice President of the Fund. The directors also discussed the proposed continuance in private sessions with counsel.
The directors considered their
knowledge of the nature and quality of the services provided by the Adviser to the Fund gained from their experience as directors or trustees of most of the registered investment companies advised by the Adviser, their overall confidence in the
Adviser’s integrity and competence they have gained from that experience, the Adviser’s initiative in identifying and raising potential issues with the directors and its responsiveness, frankness and attention to concerns raised by the
directors in the past, including the Adviser’s willingness to consider and implement organizational and operational changes designed to improve investment results and the services provided to the AB Funds. The directors noted that they have
four regular meetings each year, at each of which they review extensive materials and information from the Adviser, including information on the investment performance of the Fund and the money market fund advised by the Adviser in which the Fund
invests a portion of its assets.
The directors also considered all factors they believed relevant, including the specific matters discussed below. During the
course of their deliberations, the directors evaluated, among other things, the reasonableness of the advisory fee. The directors did not identify any particular information that was all-important or
controlling, and different directors may have attributed different weights to the various factors. The directors determined that the selection of the Adviser to manage the Fund and the Administrator to provide administrative services to the Fund and
the overall arrangements (i) between the Fund and the Adviser, as provided in the Advisory Agreement, including the advisory fee and (ii) between the Fund and the Administrator, as provided in the Administration Agreement, including the
administration fee, were fair and reasonable in light of the services performed, expenses incurred and such other matters as the directors
|
|
|
|
|
| 114 | ALLIANCEBERNSTEIN
GLOBAL HIGH INCOME FUND |
|
abfunds.com |
considered relevant in the exercise of their business judgment. The material factors and conclusions that formed the basis for the directors’ determinations included the following:
Nature, Extent and Quality of Services Provided
The directors considered
the scope and quality of services provided by the Adviser under the Advisory Agreement and by the Administrator under the Administration Agreement, including the quality of the investment research capabilities of the Adviser and the other resources
it has dedicated to performing services for the Fund and the resources the Administrator has devoted to providing services to the Fund. The directors noted that the Adviser from time to time reviews the Fund’s investment strategies and from
time to time proposes changes intended to improve the Fund’s relative or absolute performance for the directors’ consideration. They also noted the professional experience and qualifications of the Fund’s portfolio management team and
other senior personnel of the Adviser. The directors noted that the Adviser receives reimbursements for certain clerical, accounting, administrative and other services provided to the Fund by the Adviser pursuant to the Administration Agreement. The
directors noted that the methodology used to determine the reimbursement amounts had been reviewed by an independent consultant at the request of the directors. The quality of administrative and other services, including the Adviser’s role in
coordinating the activities of the Fund’s other service providers, also was considered. The directors concluded that, overall, they were satisfied with the nature, extent and quality of services provided to the Fund under the Advisory Agreement
and the Administration Agreement.
Costs of Services Provided and Profitability
The directors reviewed a schedule of the revenues and expenses and related notes indicating the profitability of the Fund to the Adviser (including in its capacity as
Administrator) for calendar years 2021 and 2022 that had been prepared with an expense allocation methodology arrived at in consultation with an independent consultant at the request of the directors. The directors noted the assumptions and methods
of allocation used by the Adviser in preparing fund-specific profitability data and understood that there are a number of potentially acceptable allocation methodologies for information of this type. The directors noted that the profitability
information reflected all revenues and expenses of the Adviser’s relationship with the Fund, including those relating to its subsidiary that provides shareholder services to the Fund. The directors recognized that it is difficult to make
comparisons of the profitability of the Advisory Agreement with the profitability of fund advisory contracts for unaffiliated funds because comparative information is not generally publicly available and is affected by numerous factors. The
directors focused on the profitability of the Adviser’s relationship with the Fund before taxes. The directors concluded that the Adviser’s level of profitability from its relationship with the Fund was not unreasonable.
|
|
|
|
|
| abfunds.com |
|
ALLIANCEBERNSTEIN GLOBAL HIGH INCOME FUND | 115 |
Fall-Out Benefits
The directors considered the other benefits to the Adviser and its affiliates from their relationships with the Fund and the money market fund advised by the Adviser in
which the Fund invests, including, but not limited to, benefits relating to shareholder servicing fees paid by the Fund to a wholly owned subsidiary of the Adviser. The directors recognized that the Adviser’s profitability would be somewhat
lower without these benefits. The directors understood that the Adviser also might derive reputational and other benefits from its association with the Fund.
Investment Results
In addition to the information reviewed by the
directors in connection with the Meeting, the directors receive detailed performance information for the Fund at each regular Board meeting during the year.
At
the Meeting, the directors reviewed performance information prepared by an independent service provider (the “15(c) service provider”), showing the Fund’s performance against a group of similar funds (“peer group”) and a
larger group of similar funds (“peer universe”), each selected by the 15(c) service provider, and information prepared by the Adviser showing the Fund’s performance against a broad-based securities market index, in each case for the 1-, 3-, 5- and 10-year periods ended May 31, 2023. Based on their review, the directors
concluded that the Fund’s investment performance was acceptable.
Advisory Fees and Other Expenses
The directors considered the management fee rate payable by the Fund (the combined advisory fee payable to the Adviser and administration fee payable to the
Administrator) and information prepared by the 15(c) service provider concerning advisory fee rates payable by other funds in the same category as the Fund. They compared the combined advisory and administration fees payable by the Fund to the
advisory fees of other funds where there is no separate administrator. The directors recognized that it is difficult to make comparisons of advisory fees because there are variations in the services that are included in the fees payable by other
funds. The directors compared the Fund’s contractual total management fee rate (the combined advisory fee payable to the Adviser plus the administration fee payable to the Administrator) with a peer group median and noted that it was lower than
the median. The directors noted that the total management fee rate was expressed as a percentage of net assets and would have been somewhat lower if expressed as a percentage of average total assets (i.e., net assets plus assets supported by
leverage).
The directors also compared the Fund’s contractual advisory fee rate with the fee rate charged by the Adviser for advising an open-end high income fund that also invested globally, and noted historical differences in their fee structures.
|
|
|
|
|
| 116 | ALLIANCEBERNSTEIN
GLOBAL HIGH INCOME FUND |
|
abfunds.com |
The Adviser informed the directors that there were no institutional products managed by the Adviser that utilize
investment strategies similar to those of the Fund.
In connection with their review of the Fund’s advisory fee, the directors also considered the total
expense ratio of the Fund in comparison to the medians for a peer group and a peer universe selected by the 15(c) service provider. The expense ratio of the Fund was based on the Fund’s latest fiscal year. The directors noted that it was likely
that the expense ratios of some of the other funds in the Fund’s category were lowered by waivers or reimbursements by those funds’ investment advisers, which in some cases might be voluntary or temporary. The directors view expense ratio
information as relevant to their evaluation of the Adviser’s services because the Adviser is responsible for coordinating services provided to the Fund by others. Based on their review, the directors concluded that the Fund’s expense ratio
was acceptable.
Economies of Scale
The advisory fee schedule for the
Fund does not contain breakpoints that reduce the fee rates on assets above specified levels. The directors considered that the Fund is a closed-end fixed-income fund and was not expected to have meaningful
asset growth (absent a rights offering or an acquisition). In such circumstances, the directors did not view the potential for realization of economies of scale as the Fund’s assets grow to be a material factor in their deliberations. They
noted that, if the Fund’s net assets were to increase materially, they would review whether potential economies of scale were being realized.
|
|
|
|
|
| abfunds.com |
|
ALLIANCEBERNSTEIN GLOBAL HIGH INCOME FUND | 117 |
This page is not part of the Shareholder Report or the Financial Statements.
AB FAMILY OF FUNDS
US EQUITY
CORE
Core Opportunities Fund
Select US Equity Portfolio
Sustainable US Thematic Portfolio
GROWTH
Concentrated Growth Fund
Discovery Growth Fund
Growth Fund
Large
Cap Growth Fund
Small Cap Growth Portfolio
VALUE
Discovery Value Fund
Equity Income Fund
Relative Value Fund
Small Cap Value Portfolio
Value Fund
INTERNATIONAL/GLOBAL EQUITY
CORE
Global Core Equity Portfolio
International Low Volatility Equity Portfolio1
Sustainable Global Thematic Fund
Sustainable International Thematic Fund
Tax-Managed Wealth Appreciation Strategy
Wealth Appreciation Strategy
GROWTH
Concentrated International Growth Portfolio
VALUE
All China Equity Portfolio
International Value Fund
FIXED INCOME
MUNICIPAL
High Income Municipal Portfolio
Intermediate California Municipal Portfolio
Intermediate Diversified Municipal Portfolio
Intermediate New York Municipal Portfolio
Municipal Bond Inflation Strategy
Tax-Aware Fixed Income Opportunities Portfolio
National Portfolio
Arizona Portfolio
California Portfolio
Massachusetts Portfolio
Minnesota Portfolio
New Jersey Portfolio
New York Portfolio
Ohio Portfolio
Pennsylvania Portfolio
Virginia Portfolio
TAXABLE
Bond Inflation Strategy
Global Bond Fund
High Income Fund
Income Fund
Intermediate Duration Portfolio
Short Duration High Yield Portfolio1
Short Duration Income Portfolio
Short Duration Portfolio
Sustainable Thematic Credit Portfolio
Total Return Bond Portfolio
ALTERNATIVES
All Market Real Return Portfolio
Global Real Estate Investment Fund
Select US Long/Short Portfolio
MULTI-ASSET
All
Market Total Return Portfolio
Emerging Markets Multi-Asset Portfolio
Global Risk Allocation Fund
Sustainable Thematic Balanced Portfolio
CLOSED-END FUNDS
AllianceBernstein Global High Income Fund
AllianceBernstein National Municipal Income Fund
EXCHANGE-TRADED FUNDS
Disruptors ETF
High
Yield ETF
Tax-Aware Short Duration Municipal ETF
Ultra Short Income ETF
US High Dividend ETF
US Large Cap Strategic Equities ETF
US Low Volatility Equity ETF
We also offer Government Money Market Portfolio, which serves as the money market fund exchange vehicle for the AB
mutual funds. You could lose money by investing in the Fund. Although the Fund seeks to preserve the value of your investment at $1.00 per share, it cannot guarantee it will do so. The Fund may impose a fee upon sale of your shares or may
temporarily suspend your ability to sell shares if the Fund’s liquidity falls below required minimums because of market conditions or other factors. An investment in the Fund is not insured or guaranteed by the Federal Deposit Insurance
Corporation or any other government agency. The Fund’s sponsor has no legal obligation to provide financial support to the Fund, and you should not expect that the sponsor will provide financial support to the Fund at any time.
Investors should consider the investment objectives, risks, charges and expenses of the Fund carefully before investing. For copies of our prospectus or summary
prospectus, which contain this and other information, visit us online at www.abfunds.com or contact your AB representative. Please read the prospectus and/or summary prospectus carefully before investing.
| 1 |
Prior to July 5, 2023, International Low Volatility Equity Portfolio was named International Strategic Core Portfolio
and Short Duration High Yield Portfolio was named Limited Duration High Income Portfolio. |
|
|
|
|
|
| 118 | ALLIANCEBERNSTEIN
GLOBAL HIGH INCOME FUND |
|
abfunds.com |
NOTES
|
|
|
|
|
| abfunds.com |
|
ALLIANCEBERNSTEIN GLOBAL HIGH INCOME FUND | 119 |
NOTES
|
|
|
|
|
| 120 | ALLIANCEBERNSTEIN
GLOBAL HIGH INCOME FUND |
|
abfunds.com |
Privacy Notice
AllianceBernstein and its affiliates (collectively referred to as “AllianceBernstein”, “we”, “our”, and
similar pronouns) understand the importance of maintaining the confidentiality and security of our clients’ nonpublic personal information. Nonpublic personal information is personally identifiable financial information about our clients who
are natural persons. To provide financial products and services to our clients, we collect nonpublic personal information from a variety of sources, including: (1) information we receive from clients, such as through applications or other
forms, which can include a client’s name, address, phone number, social security number, assets, income and other household information, (2) information about client transactions with us, our affiliates and
non-affiliated third parties, which can include account balances and transactions history, and (3) information from visitors to our websites provided through online forms, site visitorship data and online
information-collecting devices known as “cookies.”
We may disclose all of the nonpublic personal information that we
collect about our current and former clients, as described above, to non-affiliated third parties to manage our business and as otherwise required or permitted by law, including those that perform transaction
processing or servicing functions, marketing services providers that provide marketing services on our behalf pursuant to a joint marketing agreement, and professional services firms that provide knowledge-based services such as accountants,
consultants, lawyers and auditors to help manage client accounts. We require all the third-party providers to adhere to our privacy policy or a functional equivalent.
We may also disclose the nonpublic personal information that we collect about current and former clients, as described above, to our
affiliated investment, brokerage, service and insurance companies for the purpose of marketing their products or services to clients under circumstances that are permitted by law, such as if our affiliate has its own relationship with you. We have
policies and procedures to ensure that certain conditions are met before an AllianceBernstein affiliated company may use information obtained from another affiliate to solicit clients for marketing purposes.
We will also use nonpublic personal information about our clients for our own internal analysis, analytics, research and development,
and to improve and add to our client offerings.
We have policies and procedures designed to safeguard the confidentiality and
security of nonpublic personal information about our clients that include restricting access to nonpublic personal information to personnel that have been screened and undergone security and privacy training; to personnel who need it to perform
their work functions such as our operations, customer service, account management, finance, quality, vendor management and compliance teams as required to provide services, communicate with you and fulfill our legal obligations.
We employ reasonably designed physical, electronic and procedural safeguards to secure and protect client nonpublic personal
information.
If you are in the European Economic Area (“EEA”) or Switzerland, we will comply with applicable legal
requirements providing adequate protection for the transfer of personal information to recipients in countries outside of the EEA and Switzerland.
For more information, our Privacy Policy statement can be viewed here:
https://www.alliancebernstein.com/abcom/Privacy_Terms/PrivacyPolicy.htm.
ALLIANCEBERNSTEIN GLOBAL HIGH INCOME FUND
1345
Avenue of the Americas
New York, NY 10105
800 221 5672
GHI-0152-0923

ITEM 2. CODE OF ETHICS.
Not applicable when filing a semi-annual report to shareholders.
ITEM 3. AUDIT COMMITTEE FINANCIAL EXPERT.
Not
applicable when filing a semi-annual report to shareholders.
ITEM 4. PRINCIPAL ACCOUNTANT FEES AND SERVICES.
Not applicable when filing a semi-annual report to shareholders.
ITEM 5. AUDIT COMMITTEE OF LISTED REGISTRANTS.
Not
applicable when filing a semi-annual report to shareholders.
ITEM 6. INVESTMENTS.
Please see Schedule of Investments contained in the Report to Shareholders included under Item 1 of this Form N-CSR.
ITEM 7. DISCLOSURE OF PROXY VOTING POLICIES AND PROCEDURES FOR CLOSED-END MANAGEMENT INVESTMENT
COMPANIES.
Not applicable when filing a semi-annual report to shareholders.
ITEM 8. PORTFOLIO MANAGERS OF CLOSED-END MANAGEMENT INVESTMENT COMPANIES.
Not applicable when filing a semi-annual report to shareholders.
ITEM 9. PURCHASES OF EQUITY SECURITIES BY CLOSED-END MANAGEMENT INVESTMENT COMPANY AND AFFILIATED PURCHASERS.
Not applicable when filing a semi-annual report to shareholders.
ITEM 10. SUBMISSION OF MATTERS TO A VOTE OF SECURITY HOLDERS.
There have been no material changes to the procedures by which shareholders may recommend nominees to the Fund’s Board of Directors since the Fund last
provided disclosure in response to this item.
ITEM 11. CONTROLS AND PROCEDURES.
(a) The registrant’s principal executive officer and principal financial officer have concluded that the registrant’s disclosure controls and
procedures (as defined in Rule 30a-2(c) under the Investment Company Act of 1940, as amended) are effective at the reasonable assurance level based on their evaluation of these controls and procedures as of a
date within 90 days of the filing date of this document.
(b) There were no changes in the registrant’s internal controls over financial reporting
that occurred during the period covered by this report that has materially affected, or is reasonably likely to materially affect, the registrant’s internal control over financial reporting.
ITEM 12. DISCLOSURE OF SECURITIES LENDING ACTIVITIES FOR CLOSED-END MANAGEMENT INVESTMENT COMPANIES.
The registrant did not engage in securities lending during its most recent fiscal year.
ITEM 13. EXHIBITS.
The following exhibits are
attached to this Form N-CSR:
SIGNATURES
Pursuant to the requirements of the Securities Exchange Act of 1934 and the Investment Company Act of 1940, the registrant has duly caused this report to be
signed on its behalf by the undersigned, thereunto duly authorized.
(Registrant): AllianceBernstein Global High Income Fund, Inc.
|
|
|
| By: |
|
/s/ Onur Erzan |
|
|
Onur Erzan |
|
|
President |
|
|
| Date: |
|
November 24, 2023 |
Pursuant to the requirements of the Securities Exchange Act of 1934 and the Investment Company Act of 1940, this report has
been signed below by the following persons on behalf of the registrant and in the capacities and on the dates indicated.
|
|
|
| By: |
|
/s/ Onur Erzan |
|
|
Onur Erzan |
|
|
President |
|
|
| Date: |
|
November 24, 2023 |
|
|
| By: |
|
/s/ Stephen M. Woetzel |
|
|
Stephen M. Woetzel |
|
|
Treasurer and Chief Financial Officer |
|
|
| Date: |
|
November 24, 2023 |
Exhibit 12(b)(1)
CERTIFICATION OF PRINCIPAL EXECUTIVE OFFICER
I, Onur Erzan, President of AllianceBernstein Global High Income Fund, Inc., certify that:
1. I have reviewed this report on Form N-CSR of AllianceBernstein Global High Income Fund, Inc.;
2. Based on my knowledge, this report does not contain any untrue statement of a material fact or omit to state a material fact necessary to make the
statements made, in light of the circumstances under which such statements were made, not misleading with respect to the period covered by this report;
3. Based on my knowledge, the financial statements, and other financial information included in this report, fairly present in all material respects the
financial condition, results of operations, changes in net assets, and cash flows (if the financial statements are required to include a statement of cash flows) of the registrant as of, and for, the periods presented in this report;
4. The registrant’s other certifying officers and I are responsible for establishing and maintaining disclosure controls and procedures (as defined in
Rule 30a-3(c) under the Investment Company Act of 1940) and internal control over financial reporting (as defined in Rule 30a-3(d) under the Investment Company Act of
1940) for the registrant and have:
| a) |
Designed such disclosure controls and procedures to ensure that material information relating to the
registrant, including its consolidated subsidiaries, is made known to us by others within those entities, particularly during the period in which this report is being prepared; |
| b) |
Designed such internal control over financial reporting to provide reasonable assurance regarding the
reliability of financial reporting and the preparation of financial statements for external purposes in accordance with generally accepted accounting principles; |
| c) |
Evaluated the effectiveness of the registrant’s disclosure controls and procedures and presented in this
report our conclusions about the effectiveness of the disclosure controls and procedures, as of a date within 90 days prior to the filing date of this report based on such evaluation; and |
| d) |
Disclosed in this report any change in the registrant’s internal control over financial reporting that
occurred during the period covered by this report that has materially affected, or is reasonably likely to materially affect, the registrant’s internal control over financial reporting; and |
5. The registrant’s other certifying officers and I have disclosed to the registrant’s auditors and the
audit committee of the registrant’s board of directors (or persons performing the equivalent functions):
a) All significant deficiencies and material
weaknesses in the design or operation of internal control over financial reporting which are reasonably likely to adversely affect the registrant’s ability to record, process, summarize, and report financial information; and
b) Any fraud, whether or not material, that involves management or other employees who have a significant role in the registrant’s internal control over
financial reporting.
Date: November 24, 2023
|
|
|
| By: |
|
/s/ Onur Erzan |
|
|
Onur Erzan |
|
|
President |
Exhibit 12(b)(2)
CERTIFICATION OF PRINCIPAL FINANCIAL OFFICER
I, Stephen M. Woetzel, Treasurer and Chief Financial Officer of AllianceBernstein Global High Income Fund, Inc., certify that:
1. I have reviewed this report on Form N-CSR of AllianceBernstein Global High Income Fund;
2. Based on my knowledge, this report does not contain any untrue statement of a material fact or omit to state a material fact necessary to make the
statements made, in light of the circumstances under which such statements were made, not misleading with respect to the period covered by this report;
3. Based on my knowledge, the financial statements, and other financial information included in this report, fairly present in all material respects the
financial condition, results of operations, changes in net assets, and cash flows (if the financial statements are required to include a statement of cash flows) of the registrant as of, and for, the periods presented in this report;
4. The registrant’s other certifying officers and I are responsible for establishing and maintaining disclosure controls and procedures (as defined in
Rule 30a-3(c) under the Investment Company Act of 1940) and internal control over financial reporting (as defined in Rule 30a-3(d) under the Investment Company Act of
1940) for the registrant and have:
| a) |
Designed such disclosure controls and procedures to ensure that material information relating to the
registrant, including its consolidated subsidiaries, is made known to us by others within those entities, particularly during the period in which this report is being prepared; |
| b) |
Designed such internal control over financial reporting to provide reasonable assurance regarding the
reliability of financial reporting and the preparation of financial statements for external purposes in accordance with generally accepted accounting principles; |
| c) |
Evaluated the effectiveness of the registrant’s disclosure controls and procedures presented in this
report our conclusions about the effectiveness of the disclosure controls and procedures, as of a date within 90 days prior to the filing date of this report based on such evaluation; and |
| d) |
Disclosed in this report any change in the registrant’s internal control over financial reporting that
occurred during the period covered by this report that has materially affected, or is reasonably likely to materially affect, the registrant’s internal control over financial reporting; and |
5. The registrant’s other certifying officers and I have disclosed to the registrant’s auditors and the
audit committee of the registrant’s board of directors (or persons performing the equivalent functions):
a) All significant deficiencies and material
weaknesses in the design or operation of internal control over financial reporting which are reasonably likely to adversely affect the registrant’s ability to record, process, summarize, and report financial information; and
b) Any fraud, whether or not material, that involves management or other employees who have a significant role in the registrant’s internal control over
financial reporting.
Date: November 24, 2023
|
|
|
| By: |
|
/s/ Stephen M. Woetzel |
|
|
Stephen M. Woetzel |
|
|
Treasurer and Chief Financial Officer |
EXHIBIT 12(c)
CERTIFICATION PURSUANT TO SECTION 906 OF THE
SARBANES-OXLEY ACT
Pursuant to 18 U.S.C.
1350, each of the undersigned, being the Principal Executive Officer and Principal Financial Officer of AllianceBernstein Global High Income Fund, Inc. (the “Registrant”), hereby certifies that the Registrant’s report on Form N-CSR for the period ended September 30, 2023 (the “Report”) fully complies with the requirements of Section 13(a) or 15(d) of the Securities Exchange Act of 1934 and that the information
contained in the Report fairly presents, in all material respects, the financial condition and results of operations of the Registrant.
Date:
November 24, 2023
|
|
|
| By: |
|
/s/ Onur Erzan |
|
|
Onur Erzan |
|
|
President |
|
|
| By: |
|
/s/ Stephen M. Woetzel |
|
|
Stephen M. Woetzel |
|
|
Treasurer and Chief Financial Officer |
This certification is being furnished solely pursuant to Section 906 of the Sarbanes-Oxley Act of 2002 and is not
being filed as part of the Report or as a separate disclosure document.
A signed original of this written statement required by Section 906 has been
provided to the Registrant and will be retained by the Registrant and furnished to the Securities and Exchange Commission or its staff upon request.
AllianceBernstein Global... (NYSE:AWF)
Graphique Historique de l'Action
De Avr 2024 à Mai 2024

AllianceBernstein Global... (NYSE:AWF)
Graphique Historique de l'Action
De Mai 2023 à Mai 2024
