Form 8-K - Current report
04 Mars 2024 - 1:42PM
Edgar (US Regulatory)
0001298675false8-K2024-03-045 Old Lancaster RoadMalvernPA19355610535-5000falsefalsefalsefalse0001300485false0001298675cube:CubesmartL.p.Member2024-03-042024-03-0400012986752024-03-042024-03-04
UNITED STATES
SECURITIES AND EXCHANGE COMMISSION
WASHINGTON, DC 20549
FORM 8-K
CURRENT REPORT PURSUANT TO
SECTION 13 OR 15(d) OF THE
SECURITIES EXCHANGE ACT OF 1934
Date of report (Date of earliest event reported): March 4, 2024
CUBESMART
CUBESMART, L.P.
(Exact Name of Registrant as Specified in Its Charter)
Maryland (CubeSmart) | 001-32324 | 20-1024732 |
Delaware (CubeSmart, L.P.) | 000-54462 | 34-1837021 |
(State or Other Jurisdiction of Incorporation) | (Commission File Number) | (IRS Employer Identification No.) |
|
5 Old Lancaster Road |
Malvern, |
Pennsylvania |
19355 |
(Address of Principal |
Executive Offices) |
(610) 535-5000
(Registrant’s telephone number, including area code)
Not applicable
(Former Name or Former Address, if Changed Since Last Report)
Securities registered pursuant to Section 12(b) of the Act:
Title of Each Class | | Trading Symbol(s) | | Name of Each Exchange on Which Registered |
Common Shares, $0.01 par value per share, of CubeSmart | | CUBE | | New York Stock Exchange |
Check the appropriate box below if the Form 8-K filing is intended to simultaneously satisfy the filing obligation of the registrant under any of the following provisions (see General Instruction A.2. below):
☐ | Written communications pursuant to Rule 425 under the Securities Act (17 CFR 230.425) |
☐ | Soliciting material pursuant to Rule 14a-12 under the Exchange Act (17 CFR 240.14a-12) |
☐ | Pre-commencement communications pursuant to Rule 14d-2(b) under the Exchange Act (17 CFR 240.14d-2(b)) |
☐ | Pre-commencement communications pursuant to Rule 13e-4(c) under the Exchange Act (17 CFR 240.13e-4(c)) |
Indicate by check mark whether the registrant is an emerging growth company as defined in Rule 405 of the Securities Act of 1933 (17 CFR 230.405) or Rule 12b-2 of the Securities Exchange Act of 1934 (17 CFR 240.12b-2).
Emerging Growth Company (CubeSmart) ☐
Emerging Growth Company (CubeSmart, L.P.) ☐
If an emerging growth company, indicate by check mark if the registrant has elected not to use the extended transition period for complying with any new or revised financial accounting standards provided pursuant to Section 13(a) of the Exchange Act.
CubeSmart ☐
CubeSmart, L.P. ☐
Item 2.02 Results of Operations and Financial Condition.
We are furnishing with this report a slide presentation (attached as Exhibit 99.1) that may be used in presentations to investors from time to time.
Item 7.01 Regulation FD Disclosure.
The information disclosed in Item 2.02 above is incorporated into this Item 7.01.
The information included in this Current Report on Form 8-K (including the exhibit hereto) is being furnished under Item 2.02, “Results of Operations and Financial Condition,” Item 7.01, “Regulation FD Disclosure” and Item 9.01 “Financial Statements and Exhibits” of Form 8-K. As such, the information (including the exhibit) herein shall not be deemed to be “filed” for the purposes of Section 18 of the Securities Exchange Act of 1934, as amended (the “Exchange Act”), or otherwise subject to the liabilities of that Section, nor shall it be incorporated by reference into a filing under the Securities Act of 1933, as amended, or the Exchange Act, regardless of any general incorporation language in such filing, except as shall be expressly set forth by specific reference in such a filing. This Current Report (including the exhibit hereto) will not be deemed an admission as to the materiality of any information required to be disclosed solely to satisfy the requirements of Regulation FD.
Item 9.01 Financial Statements and Exhibits.
(a) Not applicable.
(b) Not applicable.
(c) Not applicable.
(d) Exhibits.
Exhibit No. | | Description |
99.1 | | Slide Presentation Dated March 2024 |
104 | | Cover Page Interactive Data File – the cover page interactive data file does not appear in the Interactive Data File because its XBRL tags are embedded within the Inline XBRL document. |
SIGNATURES
Pursuant to the requirements of the Securities Exchange Act of 1934, the Registrant has duly caused this report to be signed on its behalf by the undersigned hereunto duly authorized.
| CUBESMART |
| |
| By: | /s/ Jeffrey P. Foster |
| Name: | Jeffrey P. Foster |
| Title: | Chief Legal Officer and Secretary |
Date: March 4, 2024 | |
| |
| CUBESMART, L.P. |
| |
| By CUBESMART, its general partner |
| |
| By: | /s/ Jeffrey P. Foster |
| Name: | Jeffrey P. Foster |
| Title: | Chief Legal Officer and Secretary |
| | |
Date: March 4, 2024 | | |
Exhibit 99.1
| March 2024
Investor
Presentation |
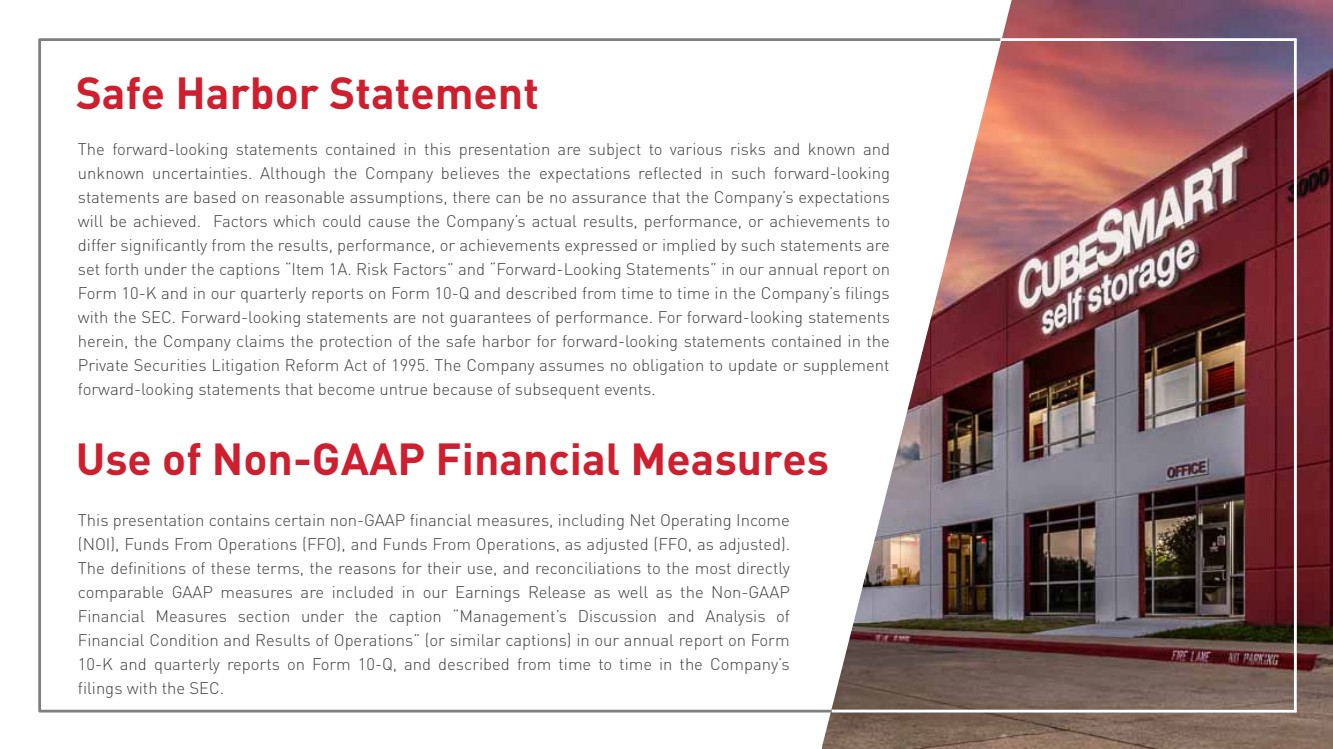
| Safe Harbor Statement
The forward-looking statements contained in this presentation are subject to various risks and known and
unknown uncertainties. Although the Company believes the expectations reflected in such forward-looking
statements are based on reasonable assumptions, there can be no assurance that the Company’s expectations
will be achieved. Factors which could cause the Company’s actual results, performance, or achievements to
differ significantly from the results, performance, or achievements expressed or implied by such statements are
set forth under the captions “Item 1A. Risk Factors” and “Forward-Looking Statements” in our annual report on
Form 10-K and in our quarterly reports on Form 10-Q and described from time to time in the Company’s filings
with the SEC. Forward-looking statements are not guarantees of performance. For forward-looking statements
herein, the Company claims the protection of the safe harbor for forward-looking statements contained in the
Private Securities Litigation Reform Act of 1995. The Company assumes no obligation to update or supplement
forward-looking statements that become untrue because of subsequent events.
This presentation contains certain non-GAAP financial measures, including Net Operating Income
(NOI), Funds From Operations (FFO), and Funds From Operations, as adjusted (FFO, as adjusted).
The definitions of these terms, the reasons for their use, and reconciliations to the most directly
comparable GAAP measures are included in our Earnings Release as well as the Non-GAAP
Financial Measures section under the caption “Management’s Discussion and Analysis of
Financial Condition and Results of Operations” (or similar captions) in our annual report on Form
10-K and quarterly reports on Form 10-Q, and described from time to time in the Company’s
filings with the SEC.
Use of Non-GAAP Financial Measures |
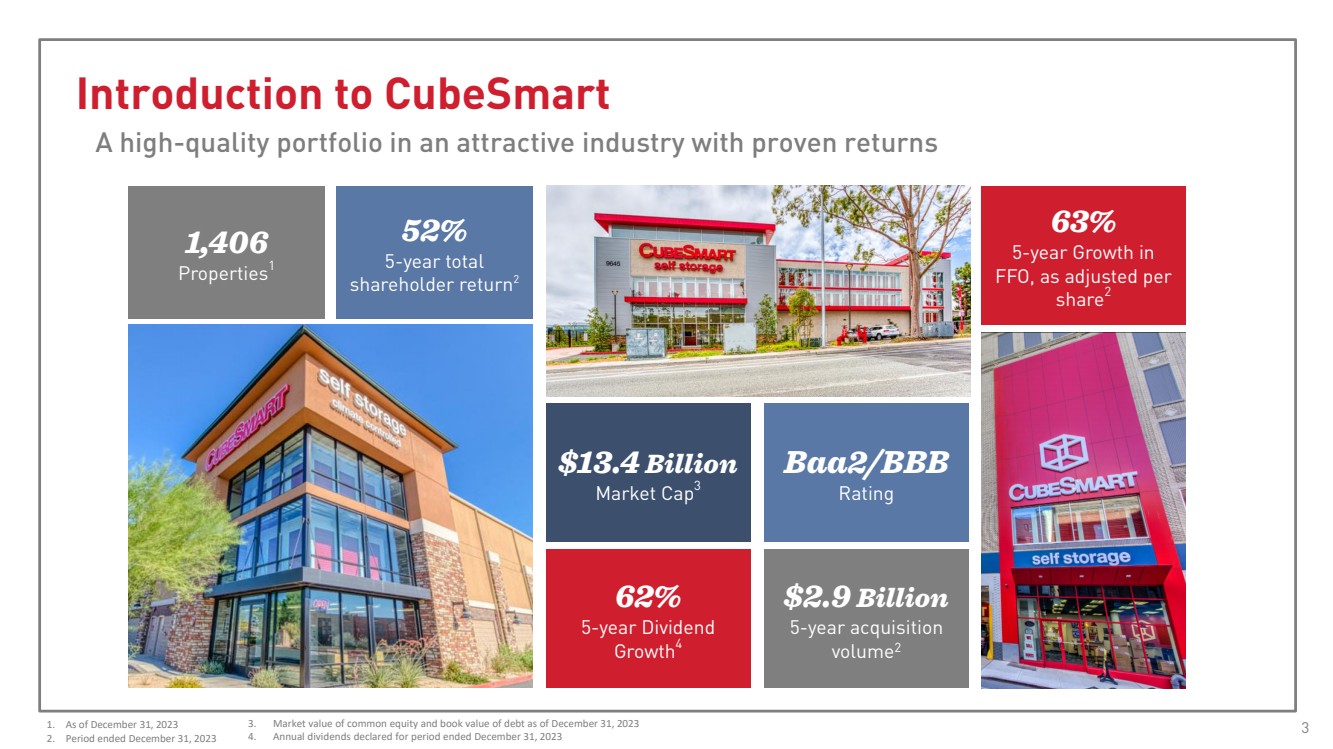
| Introduction to CubeSmart
A high-quality portfolio in an attractive industry with proven returns
1,406
Properties1
$13.4 Billion
Market Cap3
52%
5-year total
shareholder return2
62%
5-year Dividend
Growth4
63%
5-year Growth in
FFO, as adjusted per
share2
Baa2/BBB
Rating
$2.9 Billion
5-year acquisition
volume2
1. As of December 31, 2023
2. Period ended December 31, 2023
3 3. Market value of common equity and book value of debt as of December 31, 2023 4. Annual dividends declared for period ended December 31, 2023 |
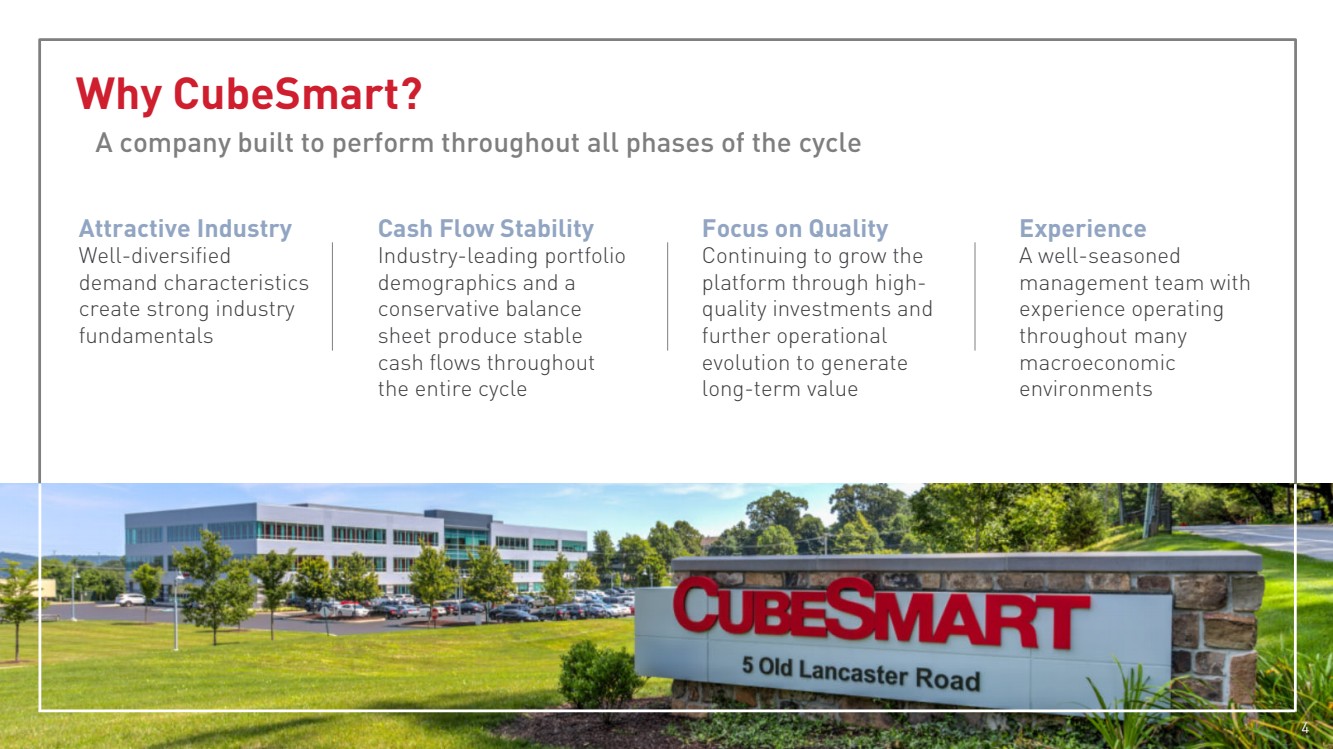
| Why CubeSmart?
A company built to perform throughout all phases of the cycle
Attractive Industry
Well-diversified
demand characteristics
create strong industry
fundamentals
Cash Flow Stability
Industry-leading portfolio
demographics and a
conservative balance
sheet produce stable
cash flows throughout
the entire cycle
Focus on Quality
Continuing to grow the
platform through high-quality investments and
further operational
evolution to generate
long-term value
Experience
A well-seasoned
management team with
experience operating
throughout many
macroeconomic
environments
4 |
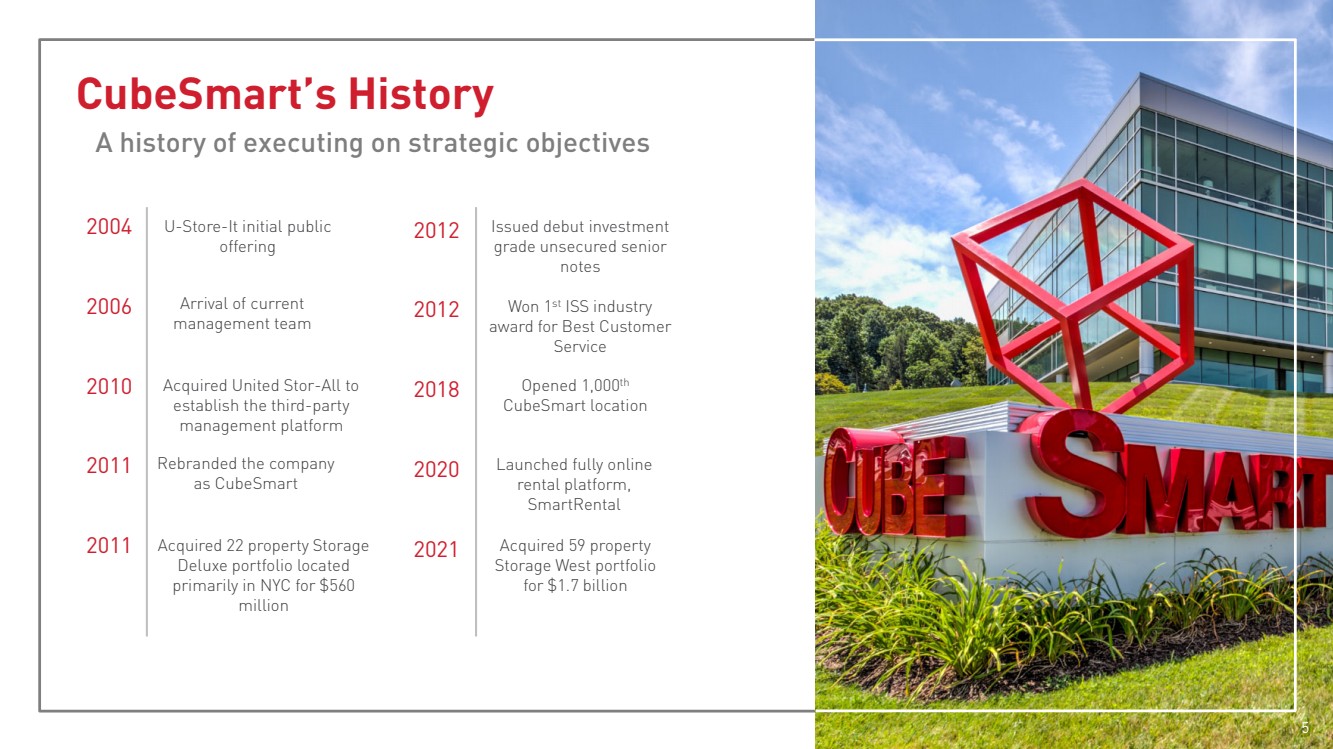
| CubeSmart’s History
A history of executing on strategic objectives
2004
2006
2010
2011
2011
U-Store-It initial public
offering
Arrival of current
management team
Acquired United Stor-All to
establish the third-party
management platform
Rebranded the company
as CubeSmart
Won 1st ISS industry
award for Best Customer
Service
Issued debut investment
grade unsecured senior
notes
Opened 1,000th
CubeSmart location
Launched fully online
rental platform,
SmartRental
Acquired 59 property
Storage West portfolio
for $1.7 billion
Acquired 22 property Storage
Deluxe portfolio located
primarily in NYC for $560
million
2012
2012
2018
2020
2021
5 |
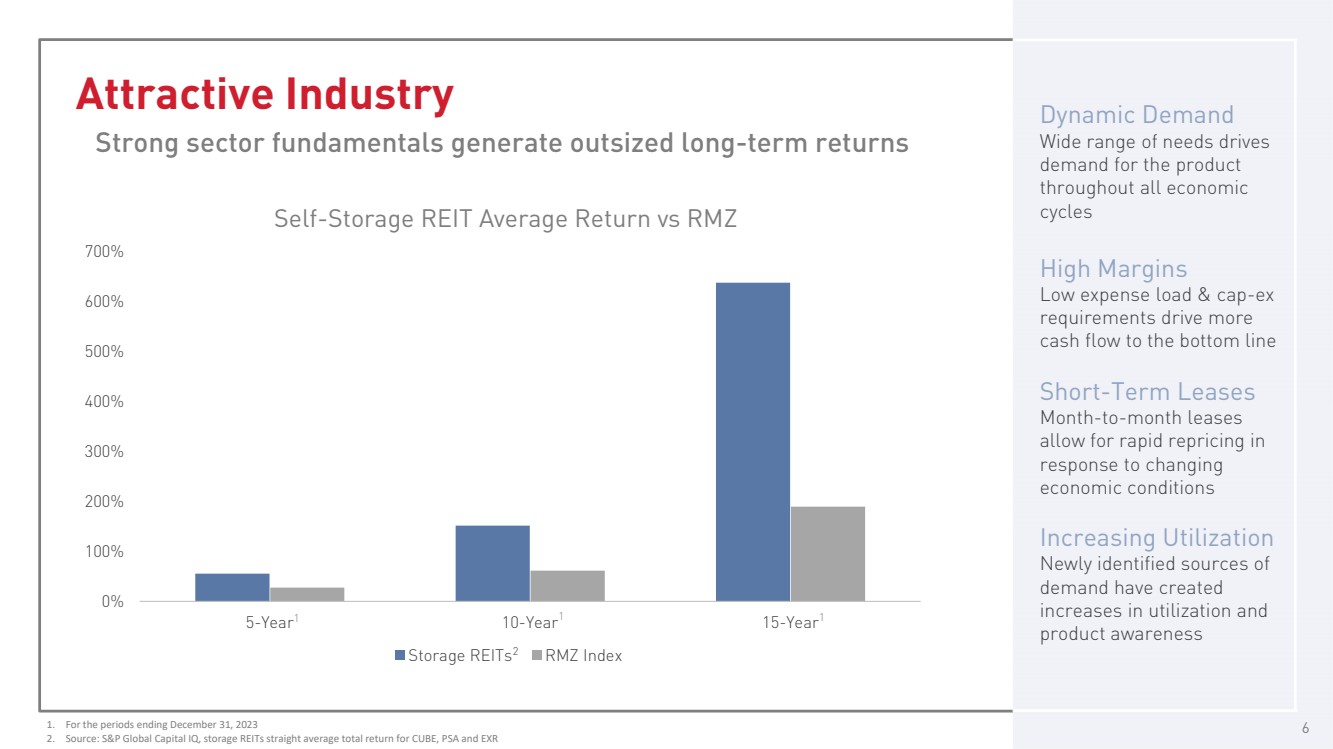
| Attractive Industry
Strong sector fundamentals generate outsized long-term returns
Dynamic Demand
Wide range of needs drives
demand for the product
throughout all economic
cycles
High Margins
Low expense load & cap-ex
requirements drive more
cash flow to the bottom line
Short-Term Leases
Month-to-month leases
allow for rapid repricing in
response to changing
economic conditions
Increasing Utilization
Newly identified sources of
demand have created
increases in utilization and
product awareness
6 1. For the periods ending December 31, 2023
2. Source: S&P Global Capital IQ, storage REITs straight average total return for CUBE, PSA and EXR
0%
100%
200%
300%
400%
500%
600%
700%
5-Year 10-Year 15-Year
Self-Storage REIT Average Return vs RMZ
Storage REITs RMZ Index
1 1 1
2 |
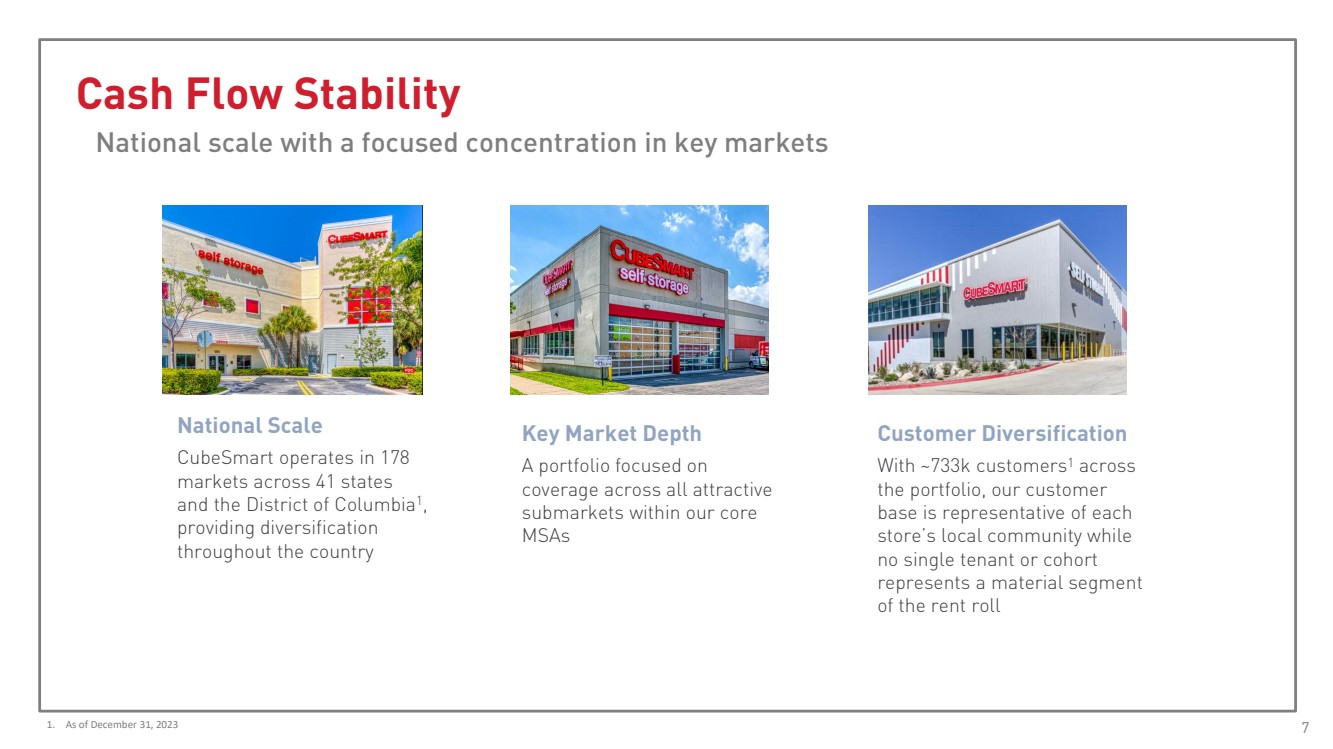
| Cash Flow Stability
National scale with a focused concentration in key markets
National Scale
CubeSmart operates in 178
markets across 41 states
and the District of Columbia1,
providing diversification
throughout the country
Key Market Depth
A portfolio focused on
coverage across all attractive
submarkets within our core
MSAs
Customer Diversification
With ~733k customers1 across
the portfolio, our customer
base is representative of each
store’s local community while
no single tenant or cohort
represents a material segment
of the rent roll
7 1. As of December 31, 2023 |
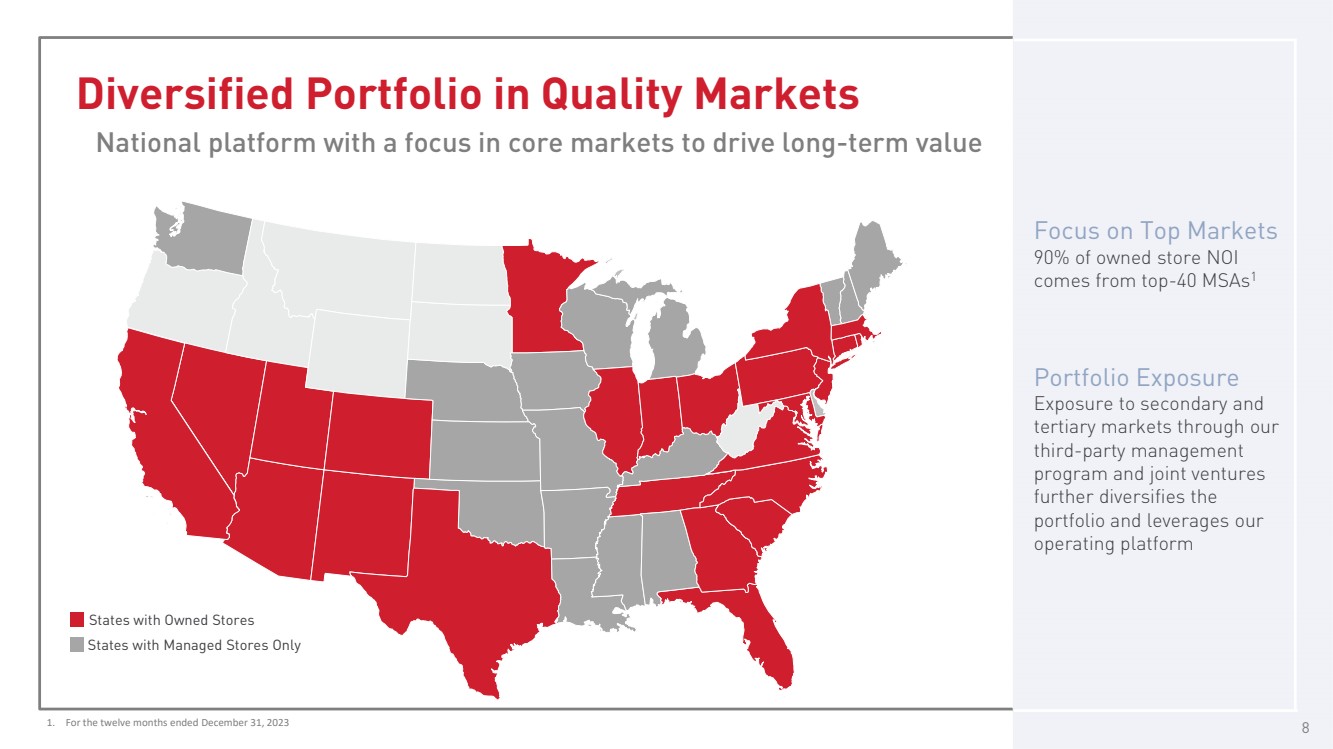
| Diversified Portfolio in Quality Markets
National platform with a focus in core markets to drive long-term value
States with Managed Stores Only
States with Owned Stores
Focus on Top Markets
90% of owned store NOI
comes from top-40 MSAs1
Portfolio Exposure
Exposure to secondary and
tertiary markets through our
third-party management
program and joint ventures
further diversifies the
portfolio and leverages our
operating platform
8 1. For the twelve months ended December 31, 2023 |
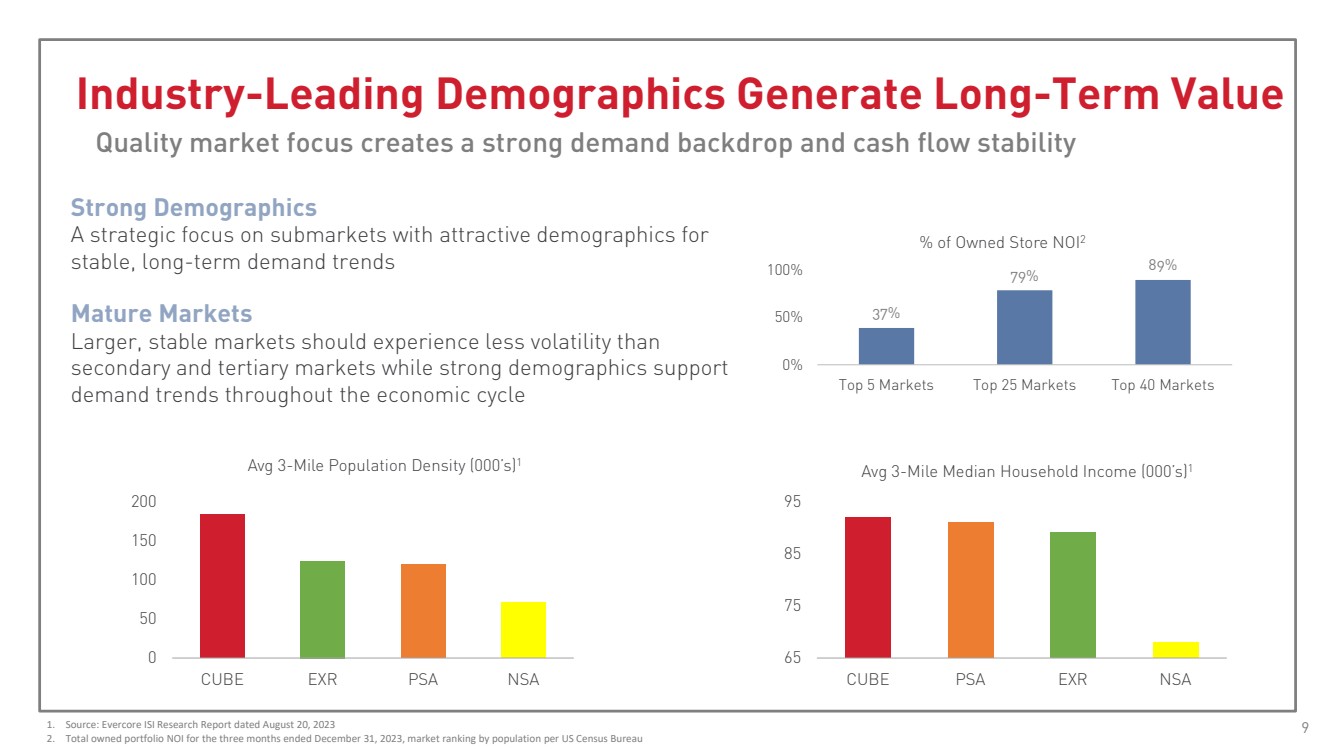
| Industry-Leading Demographics Generate Long-Term Value
Quality market focus creates a strong demand backdrop and cash flow stability
1. Source: Evercore ISI Research Report dated August 20, 2023
2. Total owned portfolio NOI for the three months ended December 31, 2023, market ranking by population per US Census Bureau 9
0
50
100
150
200
CUBE EXR PSA NSA
Avg 3-Mile Population Density (000’s)1
65
75
85
95
CUBE PSA EXR NSA
Avg 3-Mile Median Household Income (000’s)1
37%
79% 89%
0%
50%
100%
Top 5 Markets Top 25 Markets Top 40 Markets
% of Owned Store NOI2
Strong Demographics
A strategic focus on submarkets with attractive demographics for
stable, long-term demand trends
Mature Markets
Larger, stable markets should experience less volatility than
secondary and tertiary markets while strong demographics support
demand trends throughout the economic cycle |
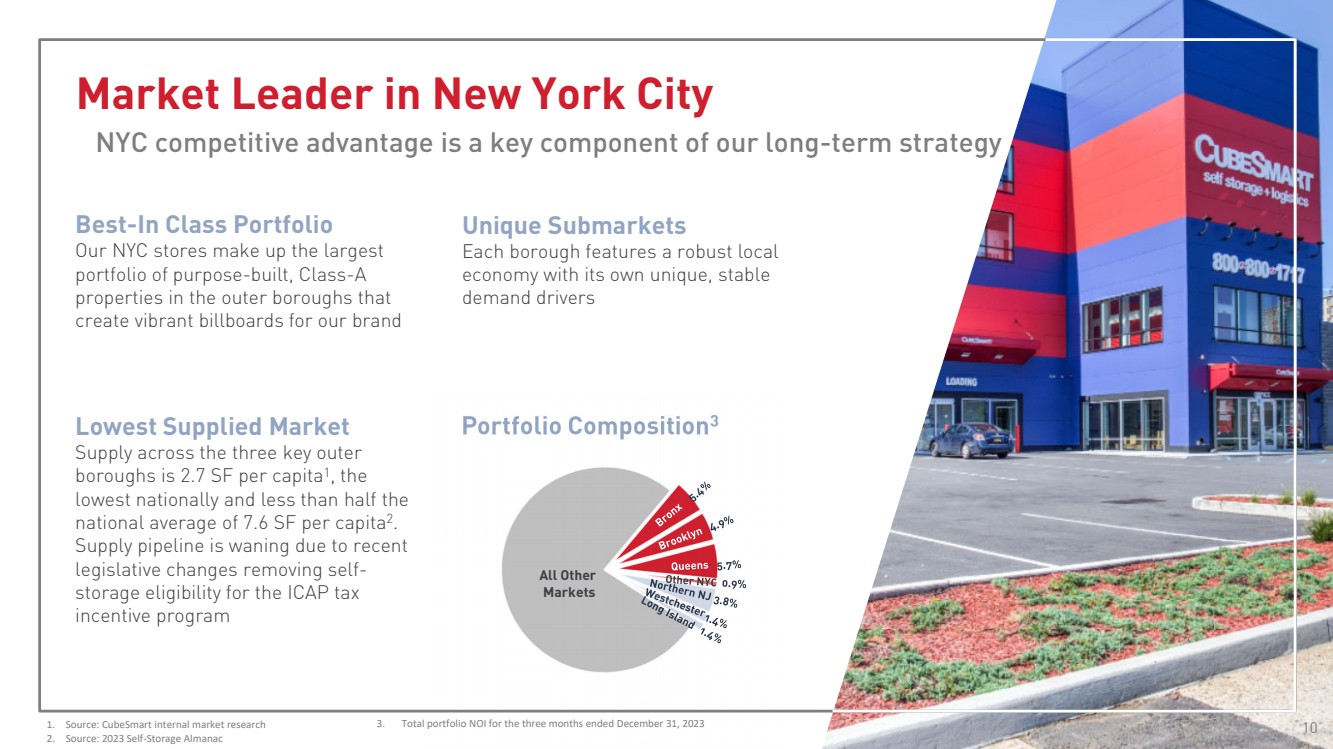
| Market Leader in New York City
Lowest Supplied Market
Supply across the three key outer
boroughs is 2.7 SF per capita1, the
lowest nationally and less than half the
national average of 7.6 SF per capita2.
Supply pipeline is waning due to recent
legislative changes removing self-storage eligibility for the ICAP tax
incentive program
Best-In Class Portfolio
Our NYC stores make up the largest
portfolio of purpose-built, Class-A
properties in the outer boroughs that
create vibrant billboards for our brand
Unique Submarkets
Each borough features a robust local
economy with its own unique, stable
demand drivers
Portfolio Composition
3
NYC competitive advantage is a key component of our long-term strategy
1. Source: CubeSmart internal market research
2. Source: 2023 Self-Storage Almanac
10
All Other
Markets
3. Total portfolio NOI for the three months ended December 31, 2023 |
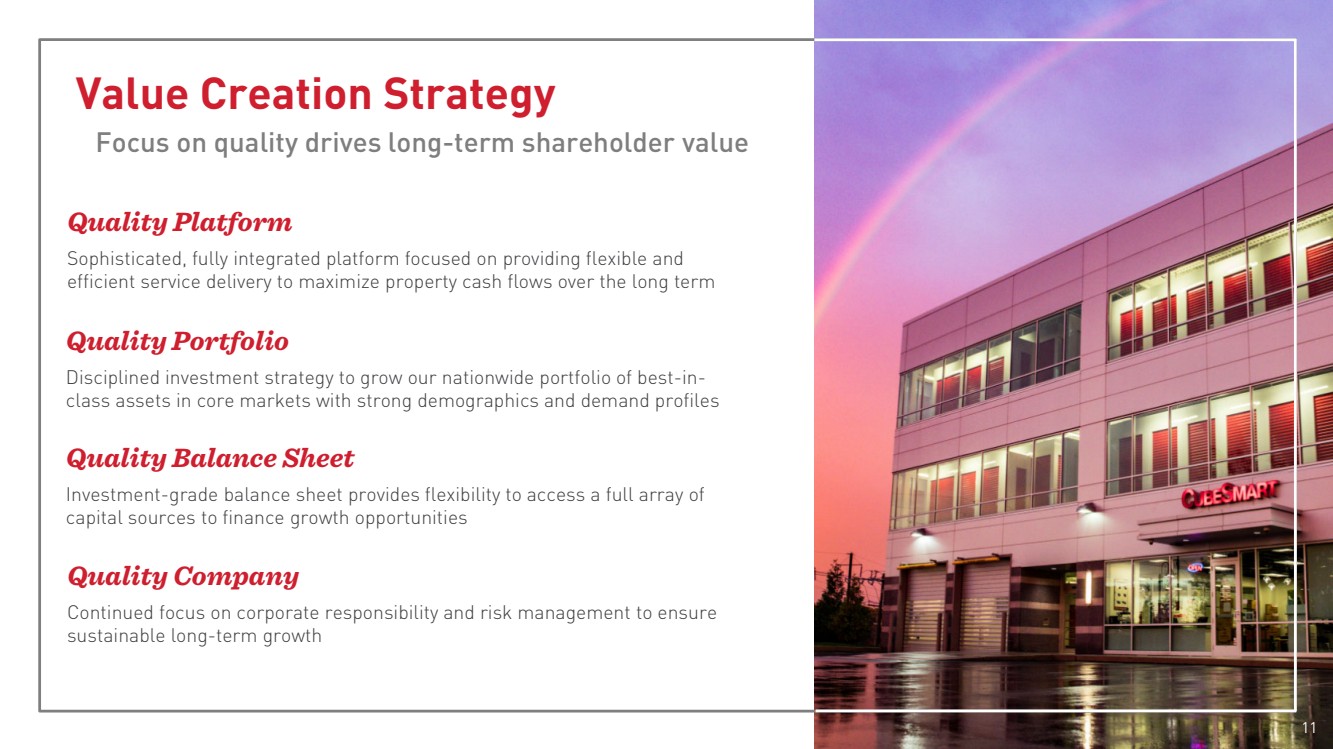
| Quality Platform
Sophisticated, fully integrated platform focused on providing flexible and
efficient service delivery to maximize property cash flows over the long term
Quality Company
Continued focus on corporate responsibility and risk management to ensure
sustainable long-term growth
Quality Balance Sheet
Investment-grade balance sheet provides flexibility to access a full array of
capital sources to finance growth opportunities
Value Creation Strategy
Focus on quality drives long-term shareholder value
11
Quality Portfolio
Disciplined investment strategy to grow our nationwide portfolio of best-in-class assets in core markets with strong demographics and demand profiles |
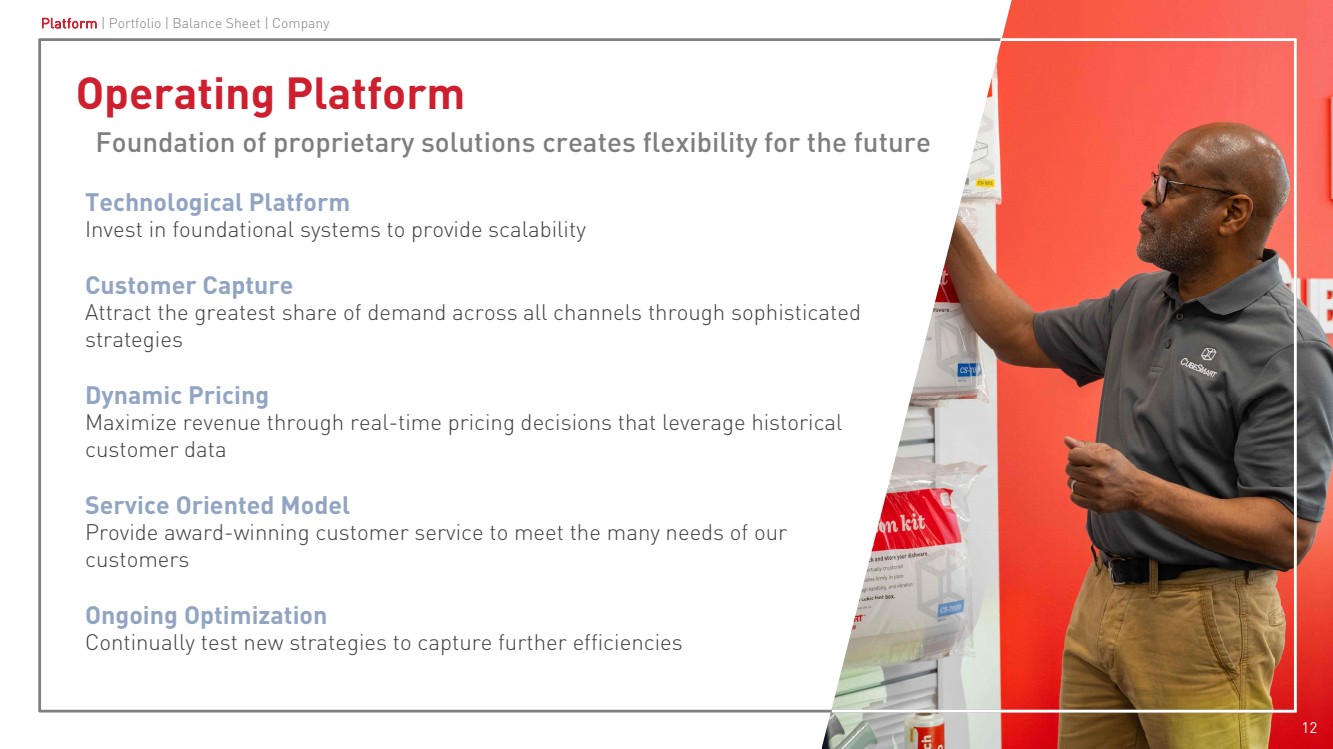
| Operating Platform
Foundation of proprietary solutions creates flexibility for the future
Technological Platform
Invest in foundational systems to provide scalability
Customer Capture
Attract the greatest share of demand across all channels through sophisticated
strategies
Dynamic Pricing
Maximize revenue through real-time pricing decisions that leverage historical
customer data
Service Oriented Model
Provide award-winning customer service to meet the many needs of our
customers
Ongoing Optimization
Continually test new strategies to capture further efficiencies
12
Platform | Portfolio | Balance Sheet | Company |
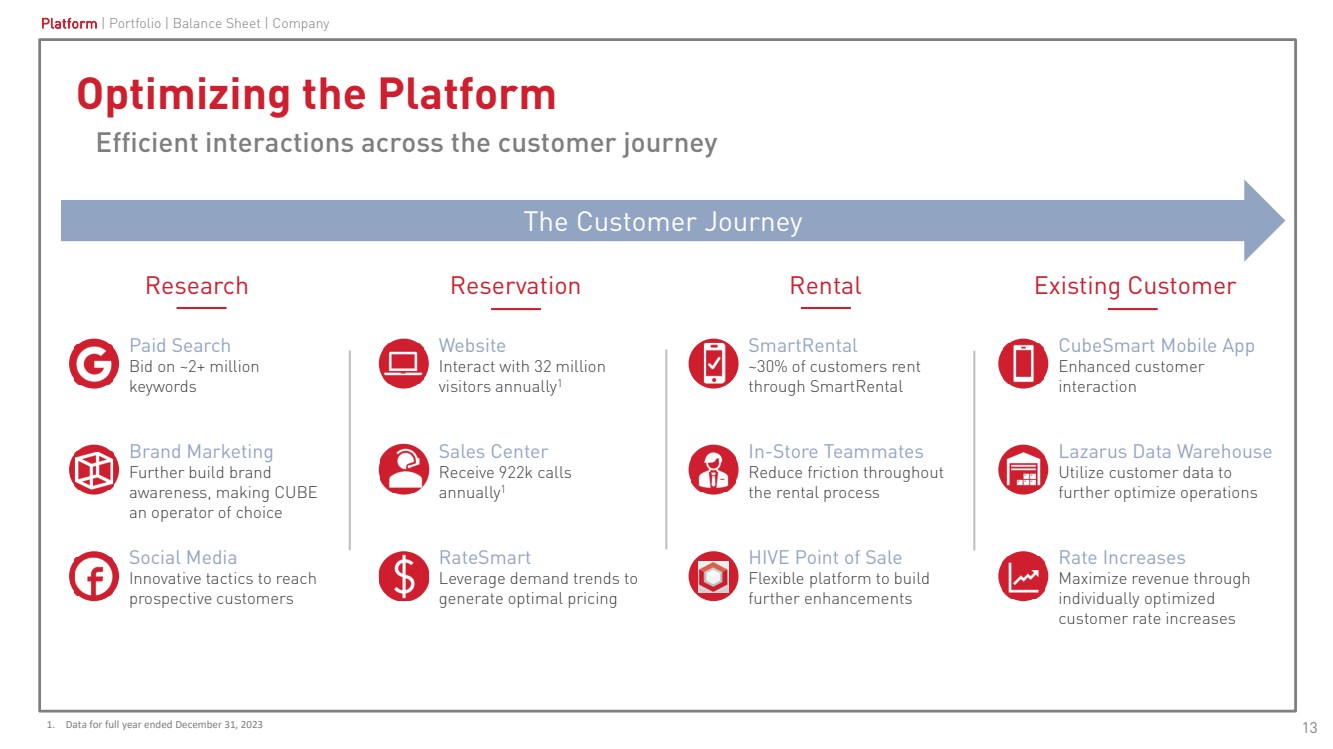
| The Customer Journey
Reservation Rental Existing Customer
Optimizing the Platform
Paid Search
Bid on ~2+ million
keywords
Brand Marketing
Further build brand
awareness, making CUBE
an operator of choice
Social Media
Innovative tactics to reach
prospective customers
Website
Interact with 32 million
visitors annually1
Sales Center
Receive 922k calls
annually1
RateSmart
Leverage demand trends to
generate optimal pricing
SmartRental
~30% of customers rent
through SmartRental
In-Store Teammates
Reduce friction throughout
the rental process
HIVE Point of Sale
Flexible platform to build
further enhancements
CubeSmart Mobile App
Enhanced customer
interaction
Lazarus Data Warehouse
Utilize customer data to
further optimize operations
Rate Increases
Maximize revenue through
individually optimized
customer rate increases
Research
Efficient interactions across the customer journey
13
Platform | Portfolio | Balance Sheet | Company
1. Data for full year ended December 31, 2023 |
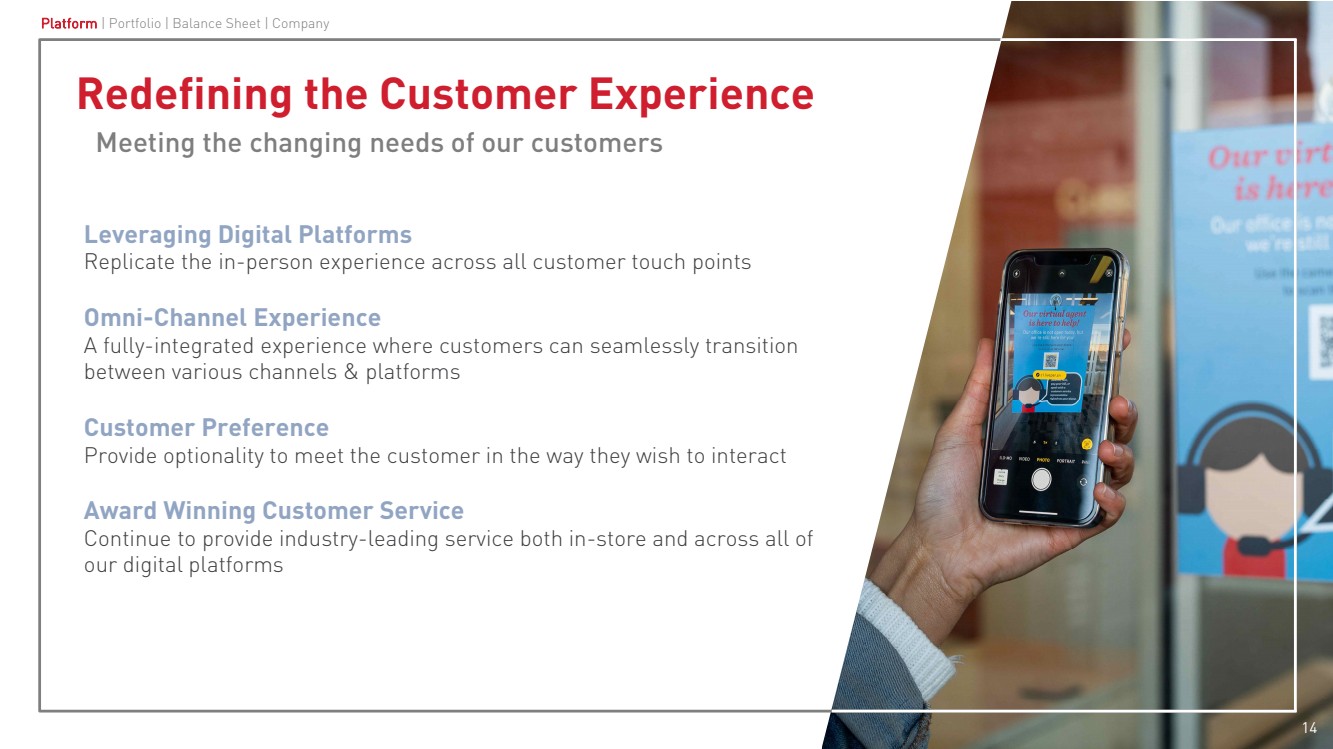
| Redefining the Customer Experience
Meeting the changing needs of our customers
Leveraging Digital Platforms
Replicate the in-person experience across all customer touch points
Omni-Channel Experience
A fully-integrated experience where customers can seamlessly transition
between various channels & platforms
Customer Preference
Provide optionality to meet the customer in the way they wish to interact
Award Winning Customer Service
Continue to provide industry-leading service both in-store and across all of
our digital platforms
14
Platform | Portfolio | Balance Sheet | Company |
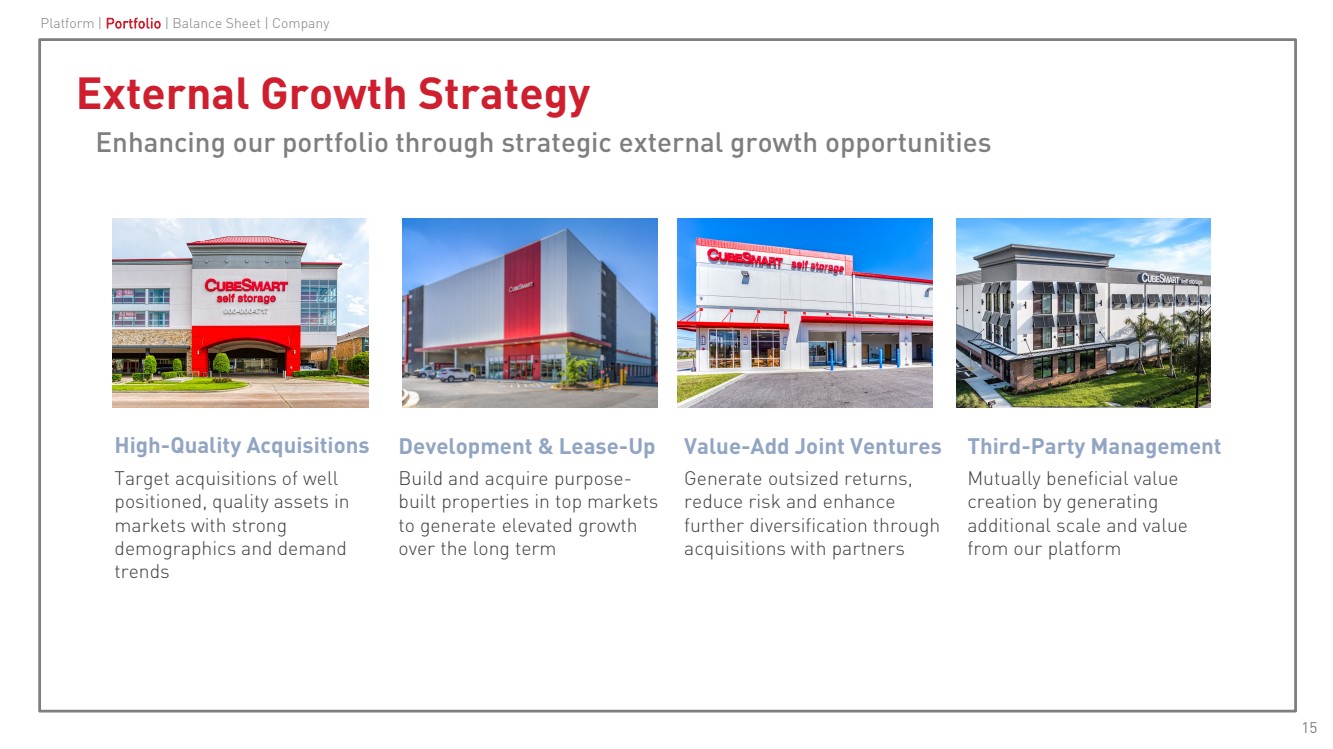
| External Growth Strategy
Enhancing our portfolio through strategic external growth opportunities
High-Quality Acquisitions
Target acquisitions of well
positioned, quality assets in
markets with strong
demographics and demand
trends
Development & Lease-Up
Build and acquire purpose-built properties in top markets
to generate elevated growth
over the long term
Value-Add Joint Ventures
Generate outsized returns,
reduce risk and enhance
further diversification through
acquisitions with partners
Third-Party Management
Mutually beneficial value
creation by generating
additional scale and value
from our platform
Platform | Portfolio | Balance Sheet | Company
15 |
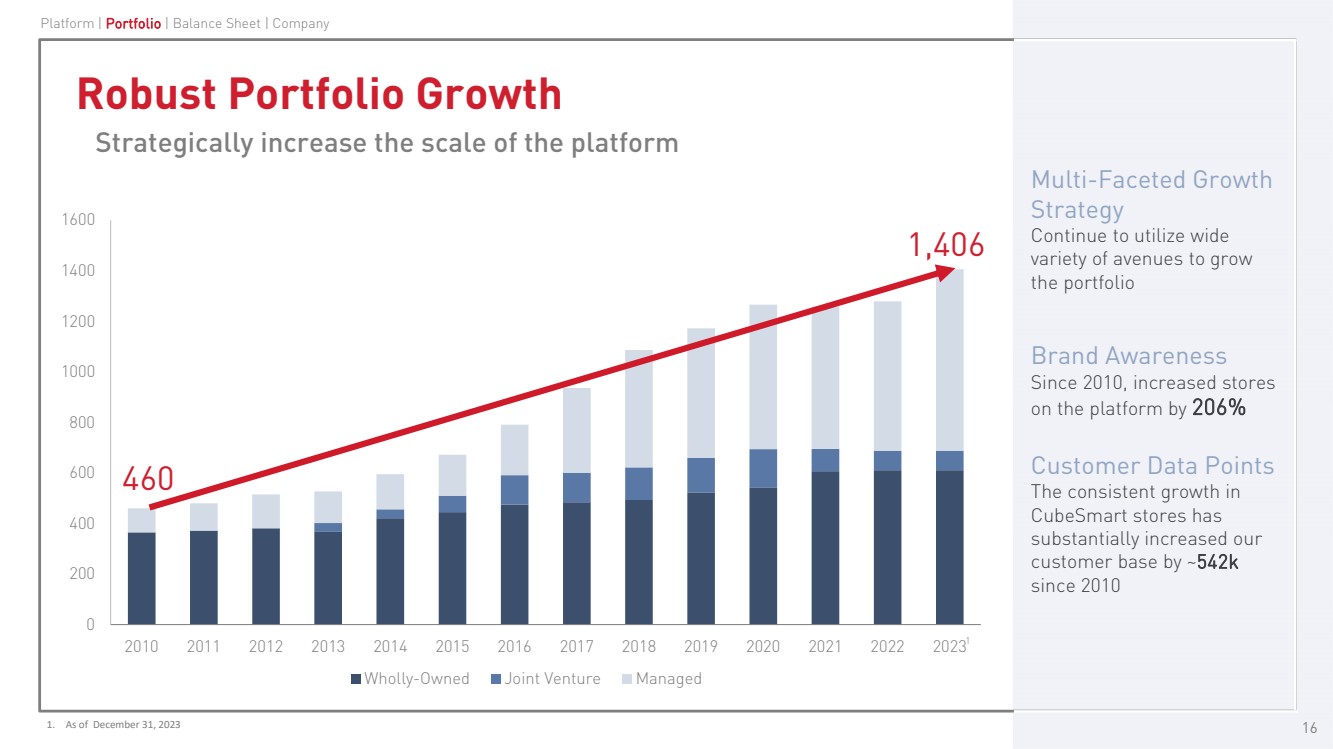
| 0
200
400
600
800
1000
1200
1400
1600
2010 2011 2012 2013 2014 2015 2016 2017 2018 2019 2020 2021 2022 2023
Wholly-Owned Joint Venture Managed
Robust Portfolio Growth
Strategically increase the scale of the platform
Multi-Faceted Growth
Strategy
Continue to utilize wide
variety of avenues to grow
the portfolio
Brand Awareness
Since 2010, increased stores
on the platform by 206%
Customer Data Points
The consistent growth in
CubeSmart stores has
substantially increased our
customer base by ~542k
since 2010
1,406
460
Platform | Portfolio | Balance Sheet | Company
16
1
1. As of December 31, 2023 |
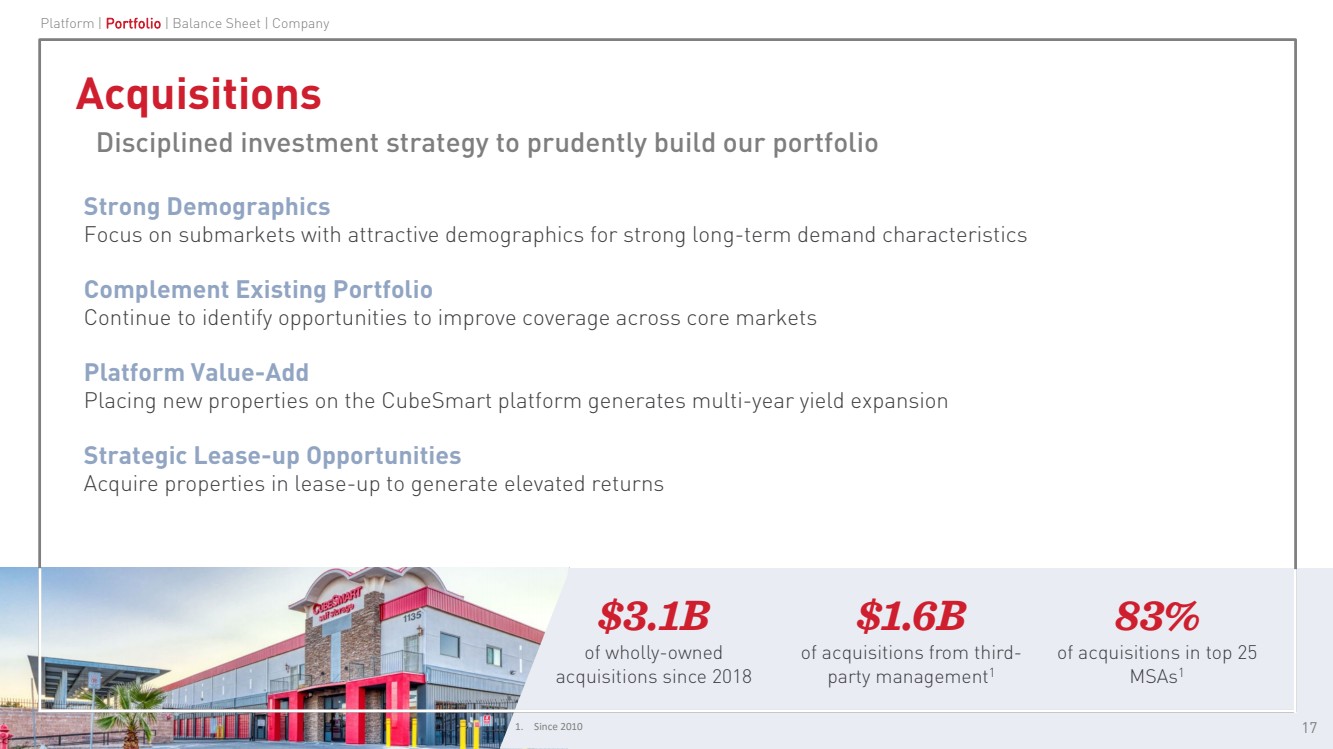
| Acquisitions
Disciplined investment strategy to prudently build our portfolio
83%
of acquisitions in top 25
MSAs1
$1.6B
of acquisitions from third-party management1
Strong Demographics
Focus on submarkets with attractive demographics for strong long-term demand characteristics
Complement Existing Portfolio
Continue to identify opportunities to improve coverage across core markets
Platform Value-Add
Placing new properties on the CubeSmart platform generates multi-year yield expansion
Strategic Lease-up Opportunities
Acquire properties in lease-up to generate elevated returns
$3.1B
of wholly-owned
acquisitions since 2018
1. Since 2010
Platform | Portfolio | Balance Sheet | Company
17 |
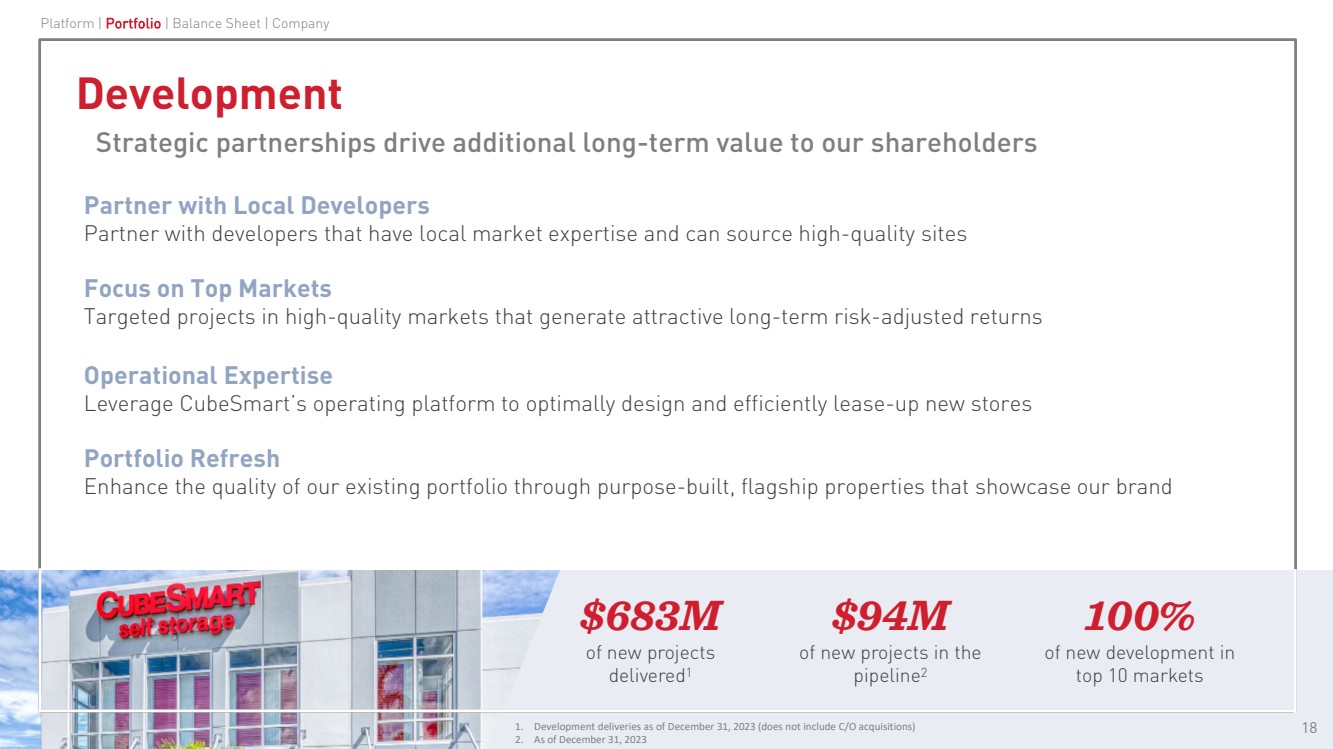
| Development
Strategic partnerships drive additional long-term value to our shareholders
Partner with Local Developers
Partner with developers that have local market expertise and can source high-quality sites
Focus on Top Markets
Targeted projects in high-quality markets that generate attractive long-term risk-adjusted returns
Operational Expertise
Leverage CubeSmart’s operating platform to optimally design and efficiently lease-up new stores
Portfolio Refresh
Enhance the quality of our existing portfolio through purpose-built, flagship properties that showcase our brand
$683M
of new projects
delivered1
100%
of new development in
top 10 markets
$94M
of new projects in the
pipeline2
Platform | Portfolio | Balance Sheet | Company
1. Development deliveries as of December 31, 2023 (does not include C/O acquisitions)
2. As of December 31, 2023
18 |
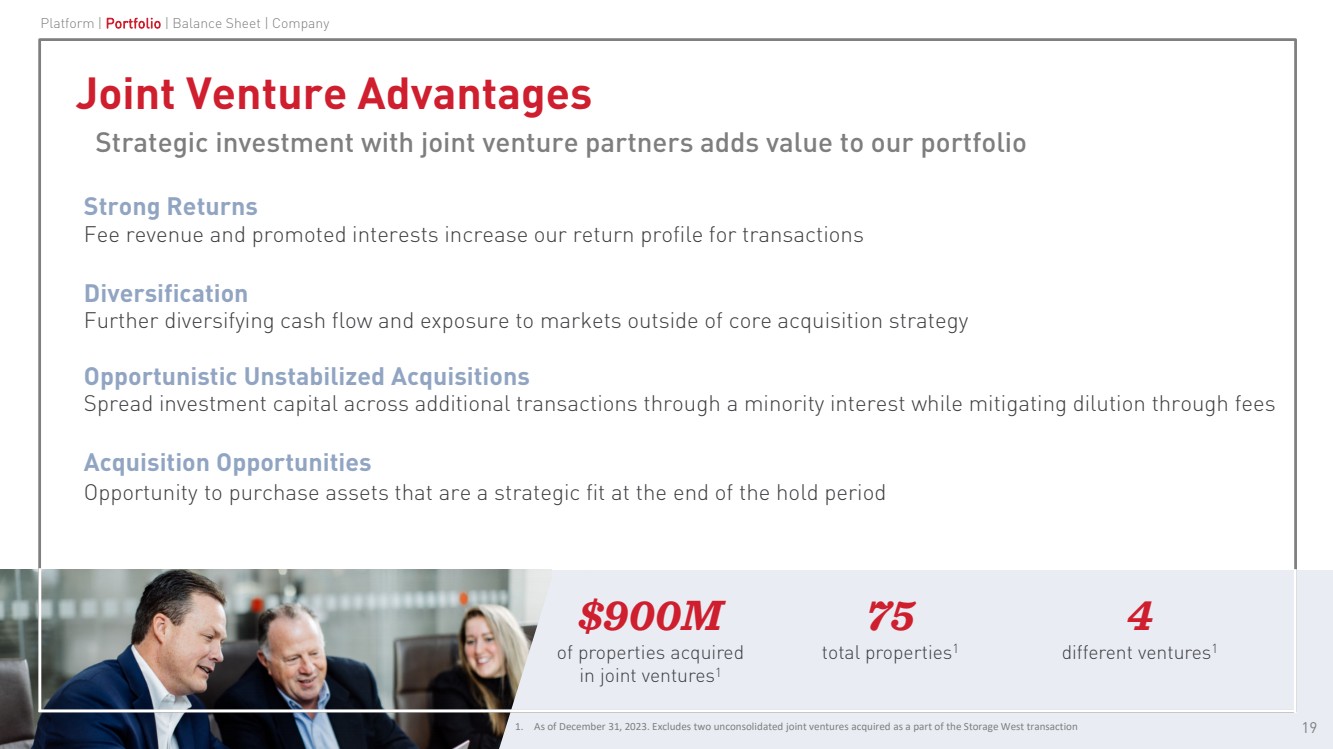
| Joint Venture Advantages
Strategic investment with joint venture partners adds value to our portfolio
4
different ventures1
75
total properties1
Strong Returns
Fee revenue and promoted interests increase our return profile for transactions
Diversification
Further diversifying cash flow and exposure to markets outside of core acquisition strategy
Opportunistic Unstabilized Acquisitions
Spread investment capital across additional transactions through a minority interest while mitigating dilution through fees
Acquisition Opportunities
Opportunity to purchase assets that are a strategic fit at the end of the hold period
Platform | Portfolio | Balance Sheet | Company
19
$900M
of properties acquired
in joint ventures1
1. As of December 31, 2023. Excludes two unconsolidated joint ventures acquired as a part of the Storage West transaction |
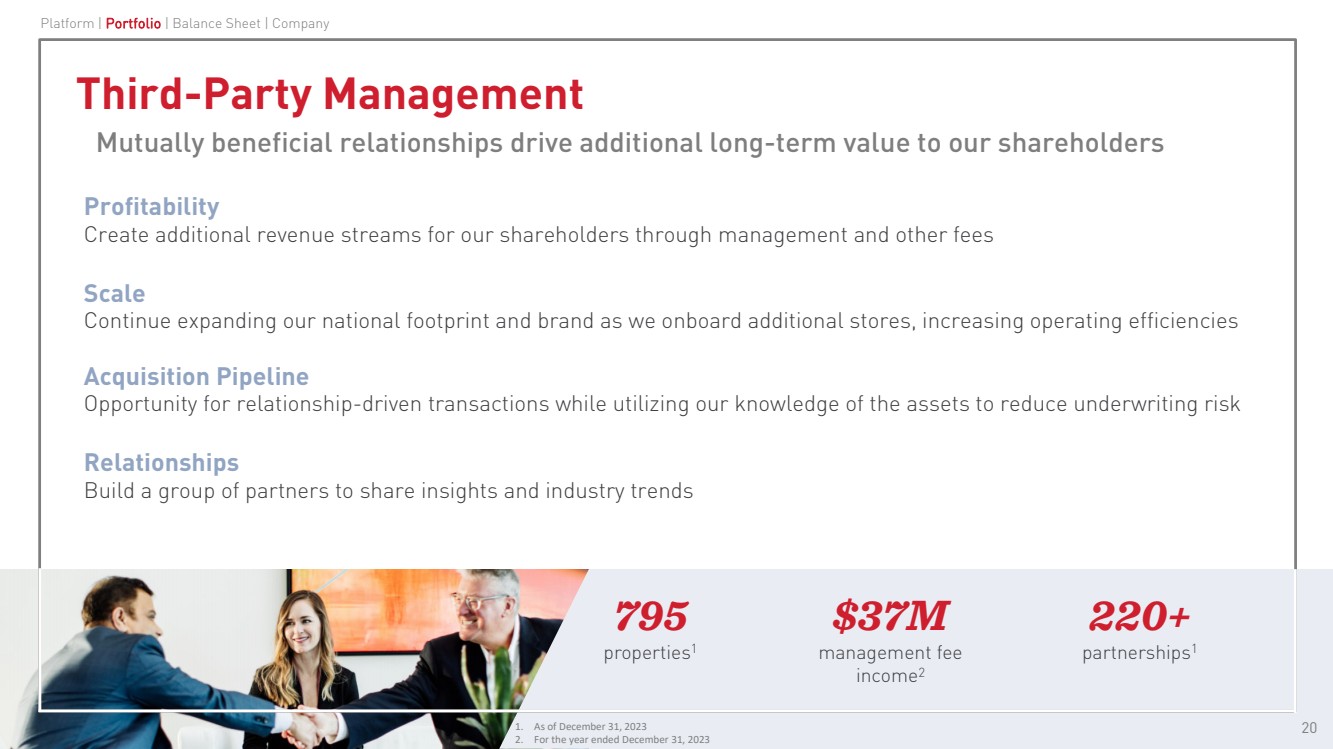
| Third-Party Management
Mutually beneficial relationships drive additional long-term value to our shareholders
795
properties1
220+
partnerships1
$37M
management fee
income2
Profitability
Create additional revenue streams for our shareholders through management and other fees
Scale
Continue expanding our national footprint and brand as we onboard additional stores, increasing operating efficiencies
Acquisition Pipeline
Opportunity for relationship-driven transactions while utilizing our knowledge of the assets to reduce underwriting risk
Relationships
Build a group of partners to share insights and industry trends
Platform | Portfolio | Balance Sheet | Company
1. As of December 31, 2023
2. For the year ended December 31, 2023
20 |
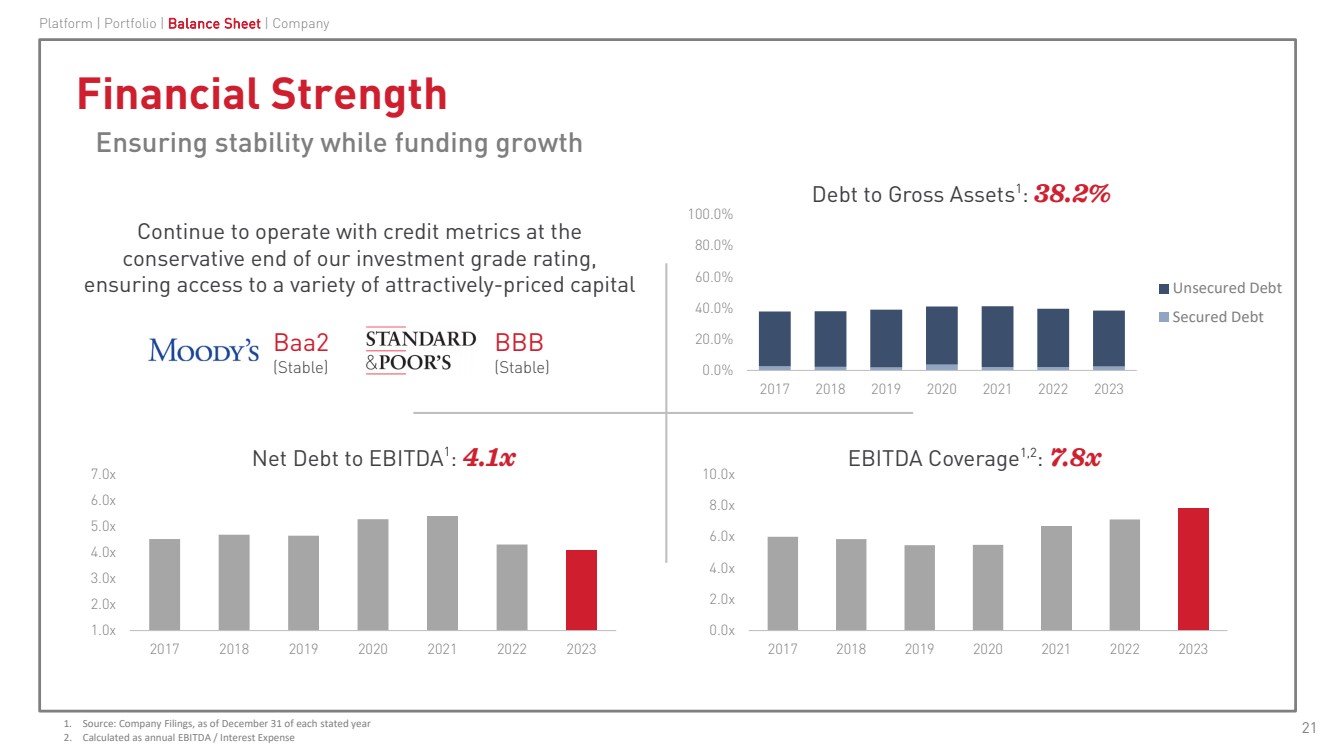
| Financial Strength
Ensuring stability while funding growth
Continue to operate with credit metrics at the
conservative end of our investment grade rating,
ensuring access to a variety of attractively-priced capital
Net Debt to EBITDA1: 4.1x EBITDA Coverage1,2: 7.8x
Debt to Gross Assets1: 38.2%
1. Source: Company Filings, as of December 31 of each stated year
2. Calculated as annual EBITDA / Interest Expense
BBB
(Stable)
Baa2
(Stable) 0.0%
20.0%
40.0%
60.0%
80.0%
100.0%
2017 2018 2019 2020 2021 2022 2023
Unsecured Debt
Secured Debt
1.0x
2.0x
3.0x
4.0x
5.0x
6.0x
7.0x
2017 2018 2019 2020 2021 2022 2023
0.0x
2.0x
4.0x
6.0x
8.0x
10.0x
2017 2018 2019 2020 2021 2022 2023
Platform | Portfolio | Balance Sheet | Company
21 |
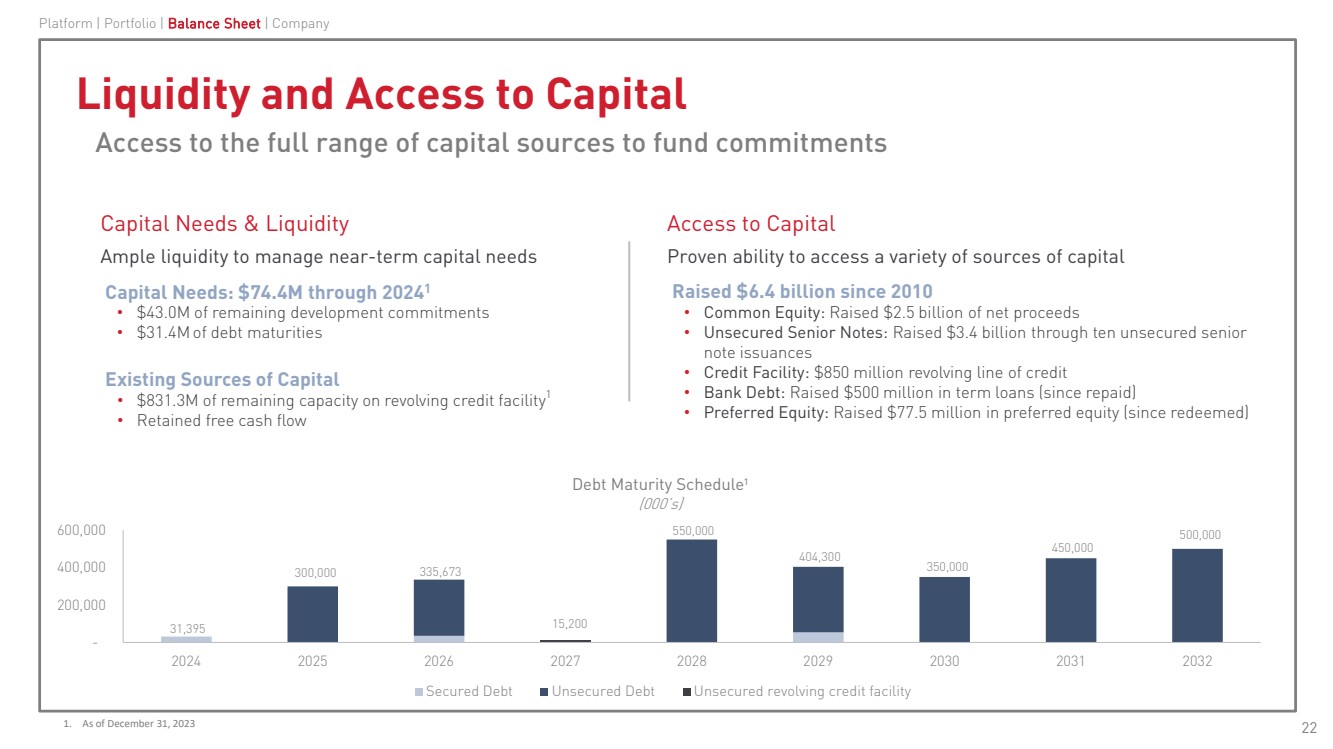
| Liquidity and Access to Capital
Access to the full range of capital sources to fund commitments
Capital Needs & Liquidity
Ample liquidity to manage near-term capital needs
Capital Needs: $74.4M through 20241
• $43.0M of remaining development commitments
• $31.4M of debt maturities
Existing Sources of Capital
• $831.3M of remaining capacity on revolving credit facility1
• Retained free cash flow
Access to Capital
Proven ability to access a variety of sources of capital
Raised $6.4 billion since 2010
• Common Equity: Raised $2.5 billion of net proceeds
• Unsecured Senior Notes: Raised $3.4 billion through ten unsecured senior
note issuances
• Credit Facility: $850 million revolving line of credit
• Bank Debt: Raised $500 million in term loans (since repaid)
• Preferred Equity: Raised $77.5 million in preferred equity (since redeemed)
31,395
300,000 335,673
15,200
550,000
404,300 350,000 450,000
500,000
-
200,000
400,000
600,000
2024 2025 2026 2027 2028 2029 2030 2031 2032
Debt Maturity Schedule1
(000’s)
Secured Debt Unsecured Debt Unsecured revolving credit facility
Platform | Portfolio | Balance Sheet | Company
1. As of December 31, 2023 22 |
| Experienced Management
Lengthy track record of experience through all phases of the cycle
Platform | Portfolio | Balance Sheet | Company
1. Represents averages for CubeSmart Senior Management
19 years
in self storage
14 years
with CubeSmart
18 years
at publicly-traded REITs
Senior Management1
23 |
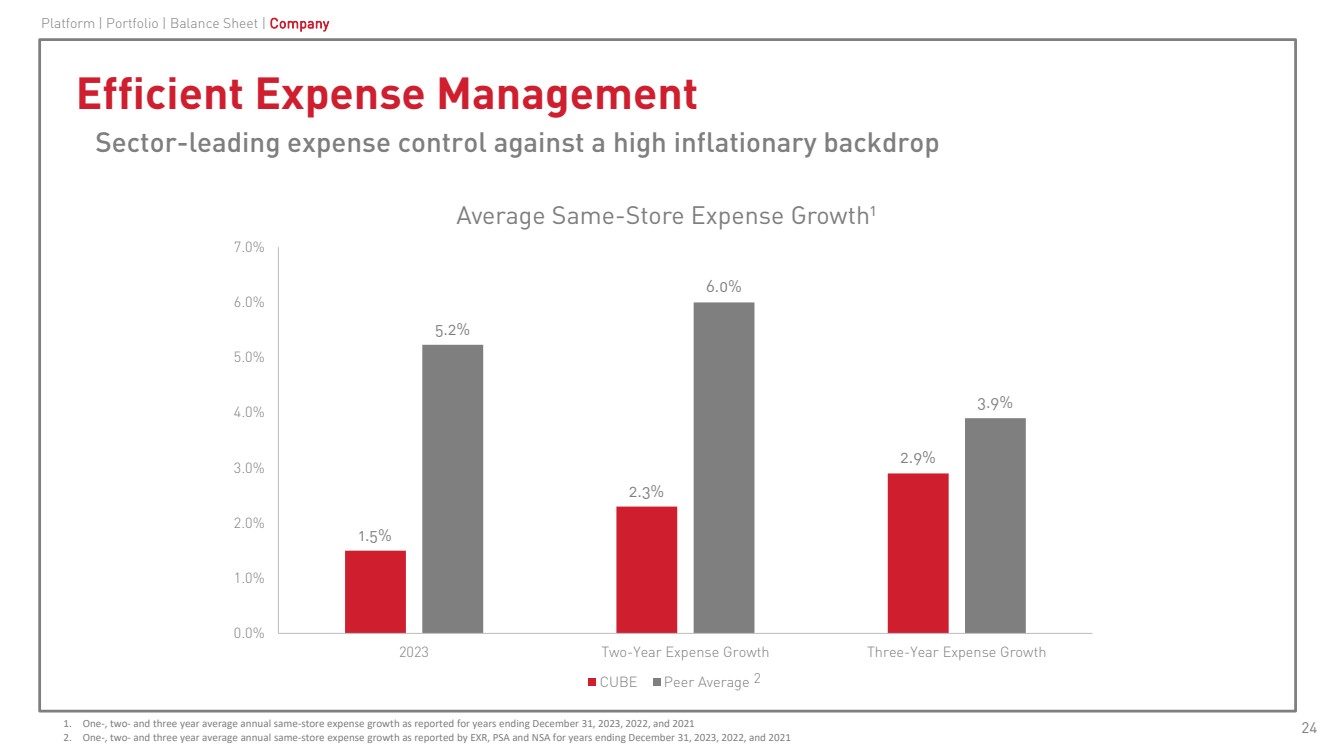
| Efficient Expense Management
Sector-leading expense control against a high inflationary backdrop
Platform | Portfolio | Balance Sheet | Company
24
1.5%
2.3%
2.9%
5.2%
6.0%
3.9%
0.0%
1.0%
2.0%
3.0%
4.0%
5.0%
6.0%
7.0%
2023 Two-Year Expense Growth Three-Year Expense Growth
Average Same-Store Expense Growth1
CUBE Peer Average 2
1. One-, two- and three year average annual same-store expense growth as reported for years ending December 31, 2023, 2022, and 2021
2. One-, two- and three year average annual same-store expense growth as reported by EXR, PSA and NSA for years ending December 31, 2023, 2022, and 2021 |
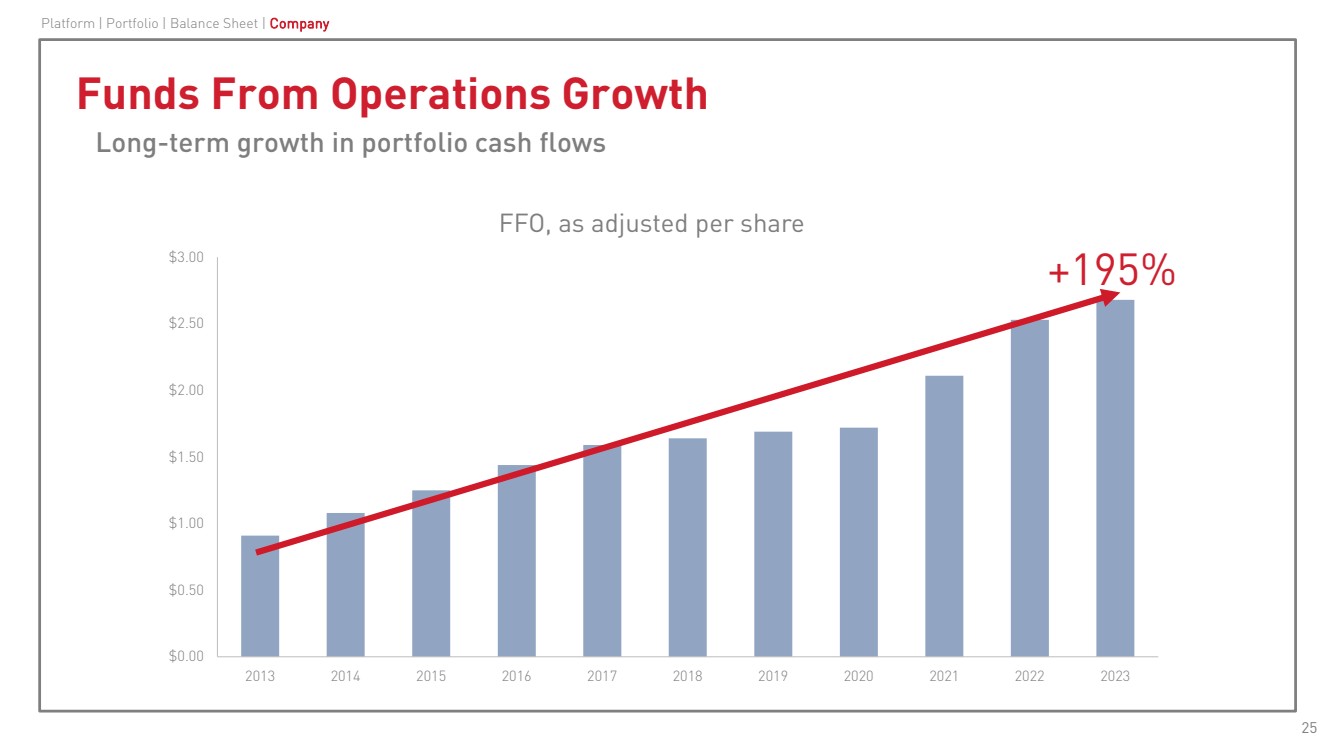
| $0.00
$0.50
$1.00
$1.50
$2.00
$2.50
$3.00
2013 2014 2015 2016 2017 2018 2019 2020 2021 2022 2023
FFO, as adjusted per share
Funds From Operations Growth
Long-term growth in portfolio cash flows
+195%
Platform | Portfolio | Balance Sheet | Company
25 |
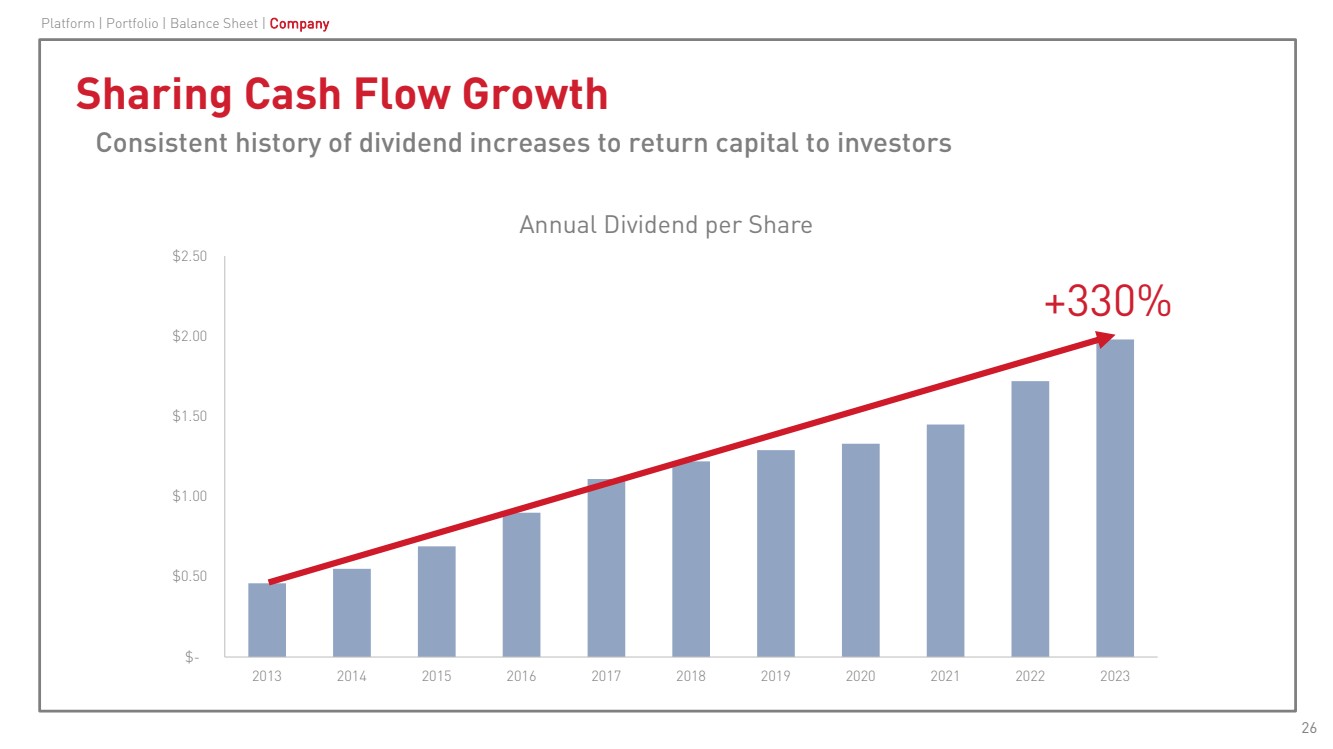
| $-
$0.50
$1.00
$1.50
$2.00
$2.50
2013 2014 2015 2016 2017 2018 2019 2020 2021 2022 2023
Annual Dividend per Share
Sharing Cash Flow Growth
Consistent history of dividend increases to return capital to investors
+330%
Platform | Portfolio | Balance Sheet | Company
26 |
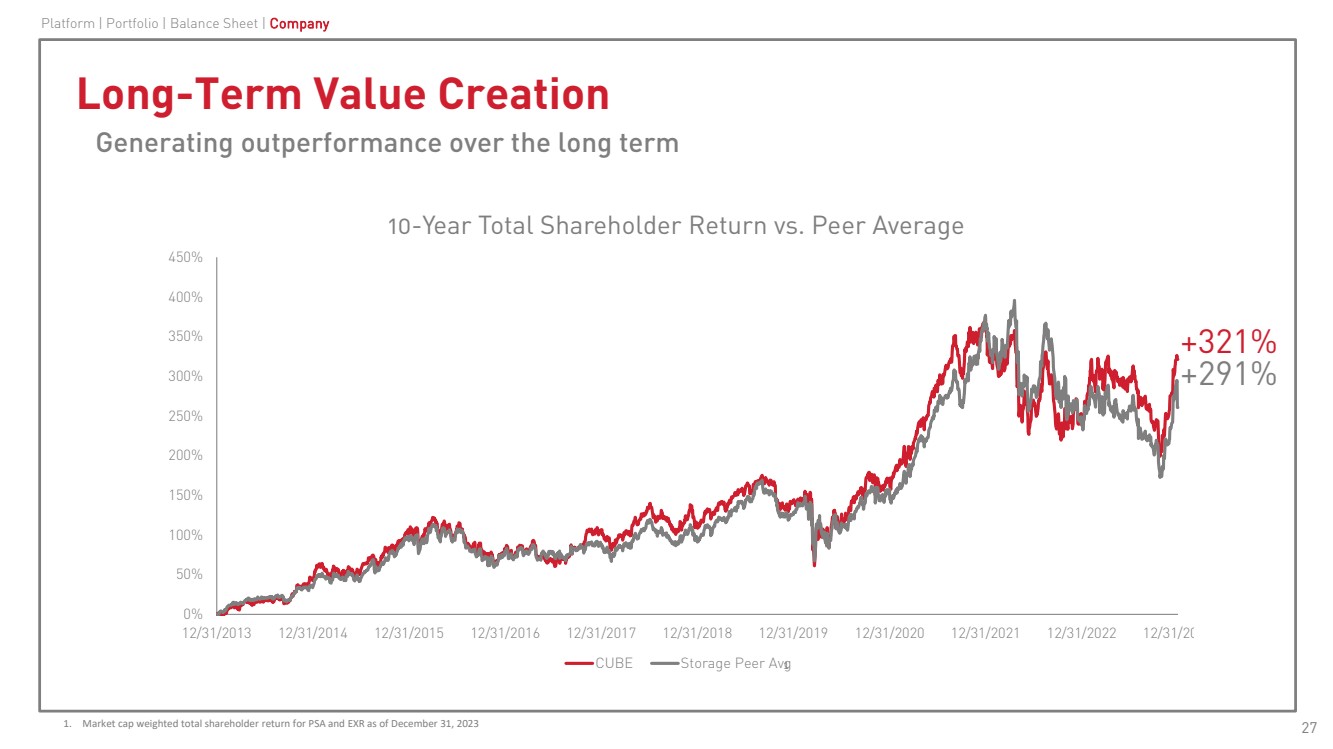
| Long-Term Value Creation
Generating outperformance over the long term
Platform | Portfolio | Balance Sheet | Company
27 1. Market cap weighted total shareholder return for PSA and EXR as of December 31, 2023
0%
50%
100%
150%
200%
250%
300%
350%
400%
450%
12/31/2013 12/31/2014 12/31/2015 12/31/2016 12/31/2017 12/31/2018 12/31/2019 12/31/2020 12/31/2021 12/31/2022 12/31/20
10-Year Total Shareholder Return vs. Peer Average
CUBE Storage Peer Avg
+321%
+291%
1 |
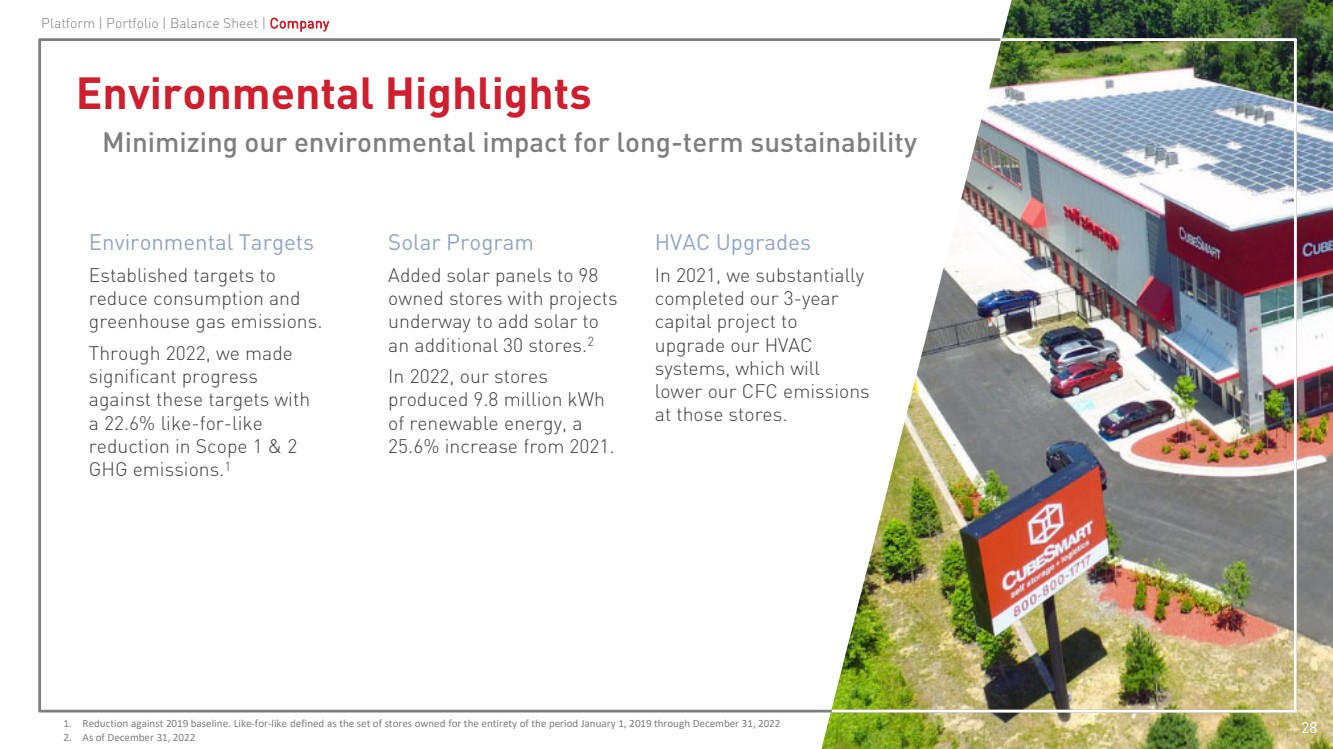
| Environmental Highlights
Minimizing our environmental impact for long-term sustainability
Environmental Targets
Established targets to
reduce consumption and
greenhouse gas emissions.
Through 2022, we made
significant progress
against these targets with
a 22.6% like-for-like
reduction in Scope 1 & 2
GHG emissions.1
Solar Program
Added solar panels to 98
owned stores with projects
underway to add solar to
an additional 30 stores.2
In 2022, our stores
produced 9.8 million kWh
of renewable energy, a
25.6% increase from 2021.
HVAC Upgrades
In 2021, we substantially
completed our 3-year
capital project to
upgrade our HVAC
systems, which will
lower our CFC emissions
at those stores.
Platform | Portfolio | Balance Sheet | Company
28 1. Reduction against 2019 baseline. Like-for-like defined as the set of stores owned for the entirety of the period January 1, 2019 through December 31, 2022 2. As of December 31, 2022 |
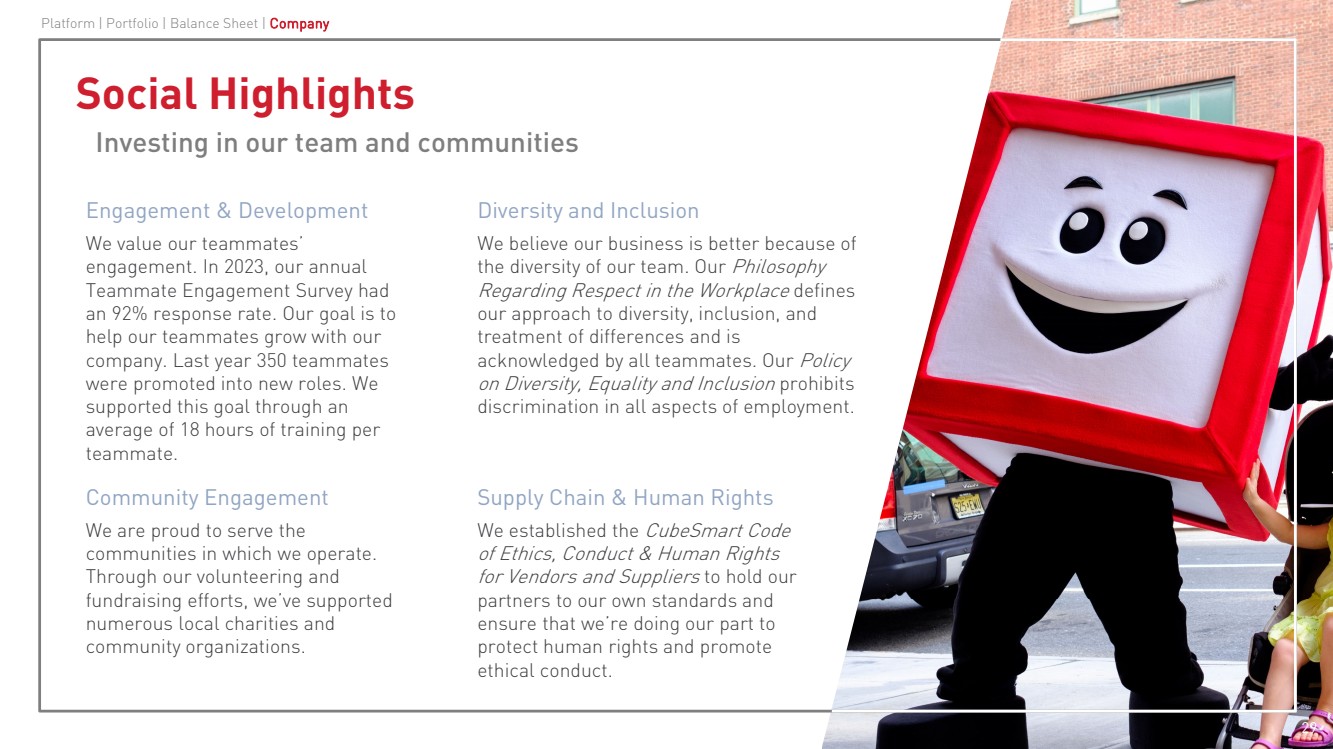
| Social Highlights
Investing in our team and communities
Engagement & Development
We value our teammates’
engagement. In 2023, our annual
Teammate Engagement Survey had
an 92% response rate. Our goal is to
help our teammates grow with our
company. Last year 350 teammates
were promoted into new roles. We
supported this goal through an
average of 18 hours of training per
teammate.
Diversity and Inclusion
We believe our business is better because of
the diversity of our team. Our Philosophy
Regarding Respect in the Workplace defines
our approach to diversity, inclusion, and
treatment of differences and is
acknowledged by all teammates. Our Policy
on Diversity, Equality and Inclusion prohibits
discrimination in all aspects of employment.
Community Engagement
We are proud to serve the
communities in which we operate.
Through our volunteering and
fundraising efforts, we’ve supported
numerous local charities and
community organizations.
Supply Chain & Human Rights
We established the CubeSmart Code
of Ethics, Conduct & Human Rights
for Vendors and Suppliers to hold our
partners to our own standards and
ensure that we’re doing our part to
protect human rights and promote
ethical conduct.
Platform | Portfolio | Balance Sheet | Company
29 |
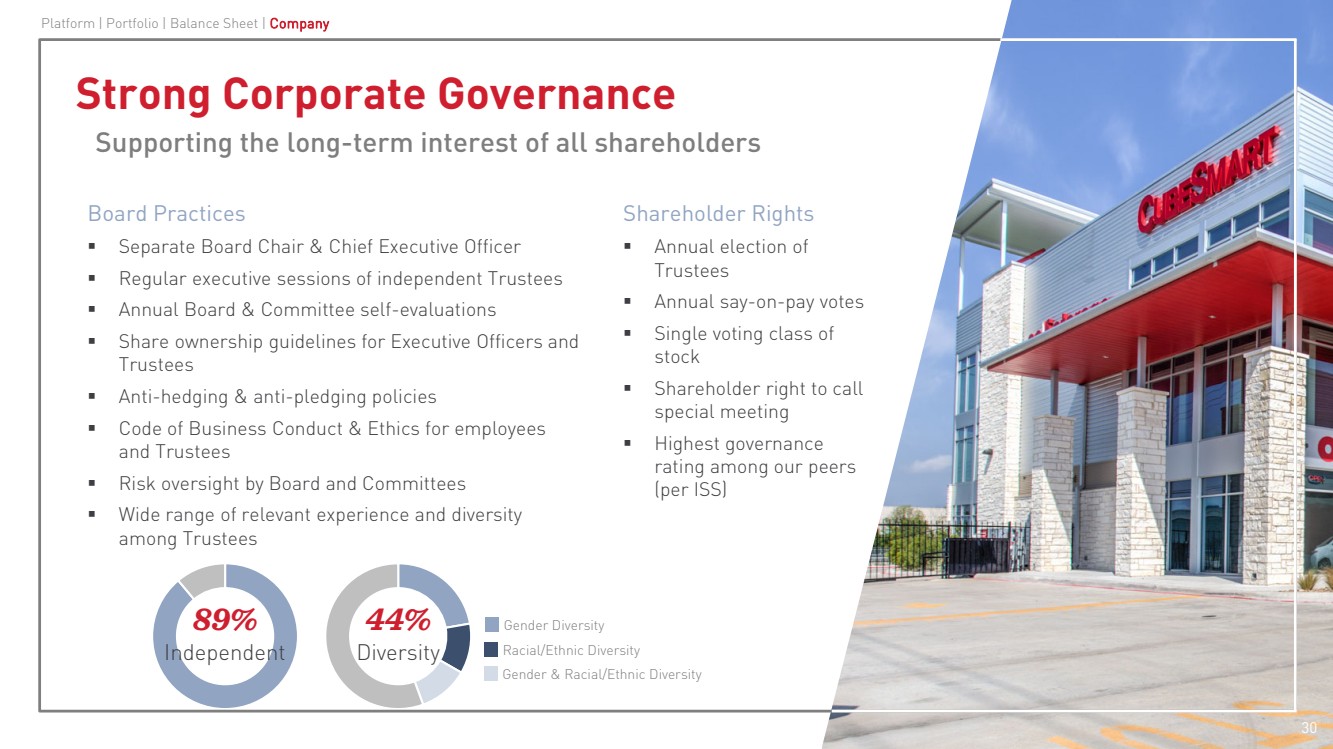
| Strong Corporate Governance
Supporting the long-term interest of all shareholders
Shareholder Rights
Annual election of
Trustees
Annual say-on-pay votes
Single voting class of
stock
Shareholder right to call
special meeting
Highest governance
rating among our peers
(per ISS)
Board Practices
Separate Board Chair & Chief Executive Officer
Regular executive sessions of independent Trustees
Annual Board & Committee self-evaluations
Share ownership guidelines for Executive Officers and
Trustees
Anti-hedging & anti-pledging policies
Code of Business Conduct & Ethics for employees
and Trustees
Risk oversight by Board and Committees
Wide range of relevant experience and diversity
among Trustees
44%
Diversity
89%
Independent
Platform | Portfolio | Balance Sheet | Company
30
Racial/Ethnic Diversity
Gender Diversity
Gender & Racial/Ethnic Diversity |
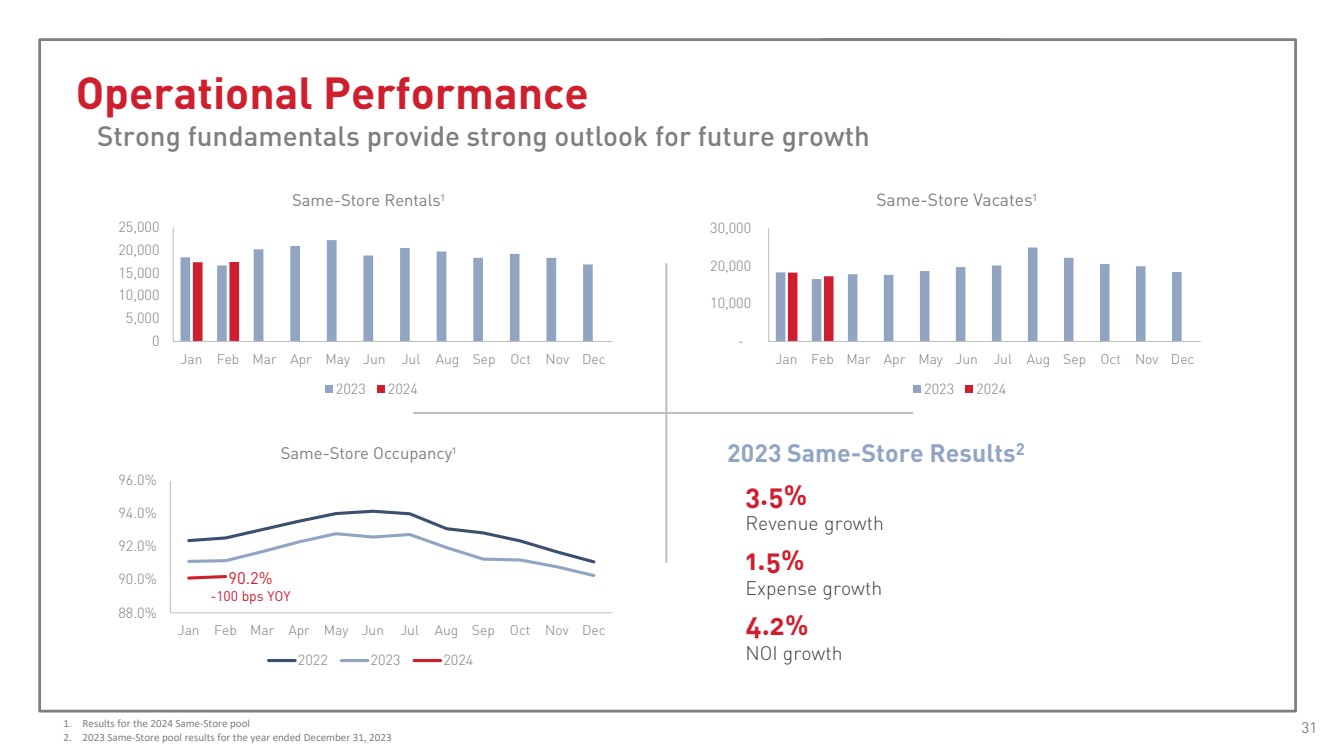
| Operational Performance
Strong fundamentals provide strong outlook for future growth
88.0%
90.0%
92.0%
94.0%
96.0%
Jan Feb Mar Apr May Jun Jul Aug Sep Oct Nov Dec
Same-Store Occupancy1
2022 2023 2024
0
5,000
10,000
15,000
20,000
25,000
Jan Feb Mar Apr May Jun Jul Aug Sep Oct Nov Dec
Same-Store Rentals1
2023 2024
-
10,000
20,000
30,000
Jan Feb Mar Apr May Jun Jul Aug Sep Oct Nov Dec
Same-Store Vacates1
2023 2024
31
1. Results for the 2024 Same-Store pool
2. 2023 Same-Store pool results for the year ended December 31, 2023
3.5%
Revenue growth
1.5%
Expense growth
4.2%
NOI growth
2023 Same-Store Results
2
90.2%
-100 bps YOY |
Document and Entity Information
|
Mar. 04, 2024 |
| Document Type |
8-K
|
| Document Period End Date |
Mar. 04, 2024
|
| Entity File Number |
001-32324
|
| Entity Registrant Name |
CUBESMART
|
| Entity Incorporation, State or Country Code |
MD
|
| Entity Tax Identification Number |
20-1024732
|
| Entity Address, Address Line One |
5 Old Lancaster Road
|
| Entity Address, City or Town |
Malvern
|
| Entity Address, State or Province |
PA
|
| Entity Address, Postal Zip Code |
19355
|
| City Area Code |
610
|
| Local Phone Number |
535-5000
|
| Title of 12(b) Security |
Common Shares, $0.01 par value per share, of CubeSmart
|
| Trading Symbol |
CUBE
|
| Security Exchange Name |
NYSE
|
| Written Communications |
false
|
| Soliciting Material |
false
|
| Pre-commencement Tender Offer |
false
|
| Pre-commencement Issuer Tender Offer |
false
|
| Entity Emerging Growth Company |
false
|
| Entity Central Index Key |
0001298675
|
| Amendment Flag |
false
|
| CUBESMART L.P. |
|
| Document Type |
8-K
|
| Document Period End Date |
Mar. 04, 2024
|
| Entity File Number |
000-54462
|
| Entity Registrant Name |
CUBESMART, L.P.
|
| Entity Incorporation, State or Country Code |
DE
|
| Entity Tax Identification Number |
34-1837021
|
| Entity Address, Address Line One |
5 Old Lancaster Road
|
| Entity Address, City or Town |
Malvern
|
| Entity Address, State or Province |
PA
|
| Entity Address, Postal Zip Code |
19355
|
| City Area Code |
610
|
| Local Phone Number |
535-5000
|
| Written Communications |
false
|
| Soliciting Material |
false
|
| Pre-commencement Tender Offer |
false
|
| Pre-commencement Issuer Tender Offer |
false
|
| Entity Emerging Growth Company |
false
|
| Entity Central Index Key |
0001300485
|
| Amendment Flag |
false
|
| X |
- DefinitionBoolean flag that is true when the XBRL content amends previously-filed or accepted submission.
| Name: |
dei_AmendmentFlag |
| Namespace Prefix: |
dei_ |
| Data Type: |
xbrli:booleanItemType |
| Balance Type: |
na |
| Period Type: |
duration |
|
| X |
- DefinitionFor the EDGAR submission types of Form 8-K: the date of the report, the date of the earliest event reported; for the EDGAR submission types of Form N-1A: the filing date; for all other submission types: the end of the reporting or transition period. The format of the date is YYYY-MM-DD.
| Name: |
dei_DocumentPeriodEndDate |
| Namespace Prefix: |
dei_ |
| Data Type: |
xbrli:dateItemType |
| Balance Type: |
na |
| Period Type: |
duration |
|
| X |
- DefinitionThe type of document being provided (such as 10-K, 10-Q, 485BPOS, etc). The document type is limited to the same value as the supporting SEC submission type, or the word 'Other'.
| Name: |
dei_DocumentType |
| Namespace Prefix: |
dei_ |
| Data Type: |
dei:submissionTypeItemType |
| Balance Type: |
na |
| Period Type: |
duration |
|
| X |
- DefinitionAddress Line 1 such as Attn, Building Name, Street Name
| Name: |
dei_EntityAddressAddressLine1 |
| Namespace Prefix: |
dei_ |
| Data Type: |
xbrli:normalizedStringItemType |
| Balance Type: |
na |
| Period Type: |
duration |
|
| X |
- Definition
+ References
+ Details
| Name: |
dei_EntityAddressCityOrTown |
| Namespace Prefix: |
dei_ |
| Data Type: |
xbrli:normalizedStringItemType |
| Balance Type: |
na |
| Period Type: |
duration |
|
| X |
- DefinitionCode for the postal or zip code
| Name: |
dei_EntityAddressPostalZipCode |
| Namespace Prefix: |
dei_ |
| Data Type: |
xbrli:normalizedStringItemType |
| Balance Type: |
na |
| Period Type: |
duration |
|
| X |
- DefinitionName of the state or province.
| Name: |
dei_EntityAddressStateOrProvince |
| Namespace Prefix: |
dei_ |
| Data Type: |
dei:stateOrProvinceItemType |
| Balance Type: |
na |
| Period Type: |
duration |
|
| X |
- DefinitionA unique 10-digit SEC-issued value to identify entities that have filed disclosures with the SEC. It is commonly abbreviated as CIK. Reference 1: http://www.xbrl.org/2003/role/presentationRef
-Publisher SEC
-Name Exchange Act
-Number 240
-Section 12
-Subsection b-2
| Name: |
dei_EntityCentralIndexKey |
| Namespace Prefix: |
dei_ |
| Data Type: |
dei:centralIndexKeyItemType |
| Balance Type: |
na |
| Period Type: |
duration |
|
| X |
- DefinitionIndicate if registrant meets the emerging growth company criteria. Reference 1: http://www.xbrl.org/2003/role/presentationRef
-Publisher SEC
-Name Exchange Act
-Number 240
-Section 12
-Subsection b-2
| Name: |
dei_EntityEmergingGrowthCompany |
| Namespace Prefix: |
dei_ |
| Data Type: |
xbrli:booleanItemType |
| Balance Type: |
na |
| Period Type: |
duration |
|
| X |
- DefinitionCommission file number. The field allows up to 17 characters. The prefix may contain 1-3 digits, the sequence number may contain 1-8 digits, the optional suffix may contain 1-4 characters, and the fields are separated with a hyphen.
| Name: |
dei_EntityFileNumber |
| Namespace Prefix: |
dei_ |
| Data Type: |
dei:fileNumberItemType |
| Balance Type: |
na |
| Period Type: |
duration |
|
| X |
- DefinitionTwo-character EDGAR code representing the state or country of incorporation.
| Name: |
dei_EntityIncorporationStateCountryCode |
| Namespace Prefix: |
dei_ |
| Data Type: |
dei:edgarStateCountryItemType |
| Balance Type: |
na |
| Period Type: |
duration |
|
| X |
- DefinitionThe exact name of the entity filing the report as specified in its charter, which is required by forms filed with the SEC. Reference 1: http://www.xbrl.org/2003/role/presentationRef
-Publisher SEC
-Name Exchange Act
-Number 240
-Section 12
-Subsection b-2
| Name: |
dei_EntityRegistrantName |
| Namespace Prefix: |
dei_ |
| Data Type: |
xbrli:normalizedStringItemType |
| Balance Type: |
na |
| Period Type: |
duration |
|
| X |
- DefinitionThe Tax Identification Number (TIN), also known as an Employer Identification Number (EIN), is a unique 9-digit value assigned by the IRS. Reference 1: http://www.xbrl.org/2003/role/presentationRef
-Publisher SEC
-Name Exchange Act
-Number 240
-Section 12
-Subsection b-2
| Name: |
dei_EntityTaxIdentificationNumber |
| Namespace Prefix: |
dei_ |
| Data Type: |
dei:employerIdItemType |
| Balance Type: |
na |
| Period Type: |
duration |
|
| X |
- DefinitionLocal phone number for entity.
| Name: |
dei_LocalPhoneNumber |
| Namespace Prefix: |
dei_ |
| Data Type: |
xbrli:normalizedStringItemType |
| Balance Type: |
na |
| Period Type: |
duration |
|
| X |
- DefinitionBoolean flag that is true when the Form 8-K filing is intended to satisfy the filing obligation of the registrant as pre-commencement communications pursuant to Rule 13e-4(c) under the Exchange Act. Reference 1: http://www.xbrl.org/2003/role/presentationRef
-Publisher SEC
-Name Exchange Act
-Number 240
-Section 13e
-Subsection 4c
| Name: |
dei_PreCommencementIssuerTenderOffer |
| Namespace Prefix: |
dei_ |
| Data Type: |
xbrli:booleanItemType |
| Balance Type: |
na |
| Period Type: |
duration |
|
| X |
- DefinitionBoolean flag that is true when the Form 8-K filing is intended to satisfy the filing obligation of the registrant as pre-commencement communications pursuant to Rule 14d-2(b) under the Exchange Act. Reference 1: http://www.xbrl.org/2003/role/presentationRef
-Publisher SEC
-Name Exchange Act
-Number 240
-Section 14d
-Subsection 2b
| Name: |
dei_PreCommencementTenderOffer |
| Namespace Prefix: |
dei_ |
| Data Type: |
xbrli:booleanItemType |
| Balance Type: |
na |
| Period Type: |
duration |
|
| X |
- DefinitionTitle of a 12(b) registered security. Reference 1: http://www.xbrl.org/2003/role/presentationRef
-Publisher SEC
-Name Exchange Act
-Number 240
-Section 12
-Subsection b
| Name: |
dei_Security12bTitle |
| Namespace Prefix: |
dei_ |
| Data Type: |
dei:securityTitleItemType |
| Balance Type: |
na |
| Period Type: |
duration |
|
| X |
- DefinitionName of the Exchange on which a security is registered. Reference 1: http://www.xbrl.org/2003/role/presentationRef
-Publisher SEC
-Name Exchange Act
-Number 240
-Section 12
-Subsection d1-1
| Name: |
dei_SecurityExchangeName |
| Namespace Prefix: |
dei_ |
| Data Type: |
dei:edgarExchangeCodeItemType |
| Balance Type: |
na |
| Period Type: |
duration |
|
| X |
- DefinitionBoolean flag that is true when the Form 8-K filing is intended to satisfy the filing obligation of the registrant as soliciting material pursuant to Rule 14a-12 under the Exchange Act. Reference 1: http://www.xbrl.org/2003/role/presentationRef
-Publisher SEC
-Name Exchange Act
-Section 14a
-Number 240
-Subsection 12
| Name: |
dei_SolicitingMaterial |
| Namespace Prefix: |
dei_ |
| Data Type: |
xbrli:booleanItemType |
| Balance Type: |
na |
| Period Type: |
duration |
|
| X |
- DefinitionTrading symbol of an instrument as listed on an exchange.
| Name: |
dei_TradingSymbol |
| Namespace Prefix: |
dei_ |
| Data Type: |
dei:tradingSymbolItemType |
| Balance Type: |
na |
| Period Type: |
duration |
|
| X |
- DefinitionBoolean flag that is true when the Form 8-K filing is intended to satisfy the filing obligation of the registrant as written communications pursuant to Rule 425 under the Securities Act. Reference 1: http://www.xbrl.org/2003/role/presentationRef
-Publisher SEC
-Name Securities Act
-Number 230
-Section 425
| Name: |
dei_WrittenCommunications |
| Namespace Prefix: |
dei_ |
| Data Type: |
xbrli:booleanItemType |
| Balance Type: |
na |
| Period Type: |
duration |
|
| X |
- Details
| Name: |
dei_LegalEntityAxis=cube_CubesmartL.p.Member |
| Namespace Prefix: |
|
| Data Type: |
na |
| Balance Type: |
|
| Period Type: |
|
|
CubeSmart (NYSE:CUBE)
Graphique Historique de l'Action
De Avr 2024 à Mai 2024

CubeSmart (NYSE:CUBE)
Graphique Historique de l'Action
De Mai 2023 à Mai 2024
