false
0001547546
0001547546
2024-11-12
2024-11-12
0001547546
us-gaap:CommonStockMember
2024-11-12
2024-11-12
0001547546
us-gaap:RedeemablePreferredStockMember
2024-11-12
2024-11-12
iso4217:USD
xbrli:shares
iso4217:USD
xbrli:shares
UNITED STATES
SECURITIES AND EXCHANGE COMMISSION
Washington, D.C. 20549
FORM 8-K
CURRENT REPORT
Pursuant to Section 13 or 15(d) of the Securities
Exchange Act of 1934
Date of Report (Date of earliest event
reported): November 12, 2024
LUMENT FINANCE TRUST, INC.
(Exact name of registrant as specified in its charter)
| Maryland |
|
001-35845 |
|
45-4966519 |
| (State or other jurisdiction of incorporation) |
|
(Commission File Number) |
|
(IRS Employer Identification No.) |
230 Park Avenue, 20th
Floor
New York, New York 10169
(Address of principal executive offices)
(212) 317-5700
(Registrant’s telephone number, including
area code)
Not Applicable
(Former name or former address, if changed since
last report)
Check the appropriate box below if the Form 8-K filing is intended
to simultaneously satisfy the filing obligation of the registrant under any of the following provisions:
| ¨ | Written communications pursuant to Rule 425 under the Securities
Act (17 CFR 230.425) |
| | |
| ¨ | Soliciting material pursuant to Rule 14a-12 under the Exchange
Act (17 CFR 240.14a-12) |
| | |
| ¨ | Pre-commencement communications pursuant to Rule 14d-2(b) under
the Exchange Act (17 CFR 240.14d-2(b)) |
| | |
| ¨ | Pre-commencement communications pursuant to Rule 13e-4(c) under
the Exchange Act (17 CFR 240.13e-4(c)) |
Securities registered pursuant to Section 12(b)
of the Act:
| Title of each class |
|
Trading Symbol(s) |
|
Name
of each exchange on which
registered |
| Common Stock, $0.01 par value per share |
|
LFT |
|
New York Stock Exchange |
| 7.875% Series A Cumulative Redeemable Preferred Stock, $0.01 par value per share |
|
LFTPrA |
|
New York Stock Exchange |
Indicate by check mark whether the registrant is an emerging growth
company as defined in Rule 405 of the Securities Act of 1933 (§230.405 of this chapter) or Rule 12b-2 of the Securities Exchange
Act of 1934 (§240.12b-2 of this chapter).
Emerging growth company ¨
If an emerging growth company, indicate by check mark if the registrant
has elected not to use the extended transition period for complying with any new or revised financial accounting standards provided pursuant
to Section 13(a) of the Exchange Act. ¨
Item 2.02 Results
of Operations and Financial Condition.
On November 12, 2024, Lument Finance Trust, Inc.
(the “Company”) issued a press release (the “Release”) and supplemental financial information announcing its financial
results for the quarter ended September 30, 2024. The Release and supplemental financial information are attached hereto as Exhibit 99.1
and Exhibit 99.2, respectively, and are incorporated herein by reference.
The information disclosed in “Item 2.02 Results
of Operations and Financial Condition,” including Exhibits 99.1 and 99.2 hereto, is being furnished and shall not be deemed “filed”
for purposes of Section 18 of the Securities Exchange Act of 1934, as amended (the “Exchange Act”), or otherwise subject
to the liabilities of such section, nor shall it be deemed incorporated by reference in any filing under the Securities Act of 1933, as
amended (the “Securities Act”), or the Exchange Act, except as shall be expressly set forth by specific reference in such
a filing.
Item 9.01
Exhibits.
SIGNATURE
Pursuant to the requirements of the Securities
Exchange Act of 1934, the registrant has duly caused this report to be signed on its behalf by the undersigned hereunto duly authorized.
| |
LUMENT Finance Trust, Inc. |
| |
|
| Date: November 12, 2024 |
By: |
/s/ James A. Briggs |
| |
|
James A. Briggs |
| |
|
Chief Financial Officer |
Exhibit 99.1
Lument Finance Trust Reports Third Quarter 2024 Results
NEW YORK, November 12, 2024 /PRNewswire/ — Lument
Finance Trust, Inc. (NYSE: LFT) (“we”, “LFT” or “the Company”) today reported its third
quarter results. GAAP net income attributable to common shareholders for the third quarter was $5.1 million, or $0.10 per share of common
stock. Distributable earnings for the third quarter were $5.5 million, or $0.10 per share of common stock. The Company has also issued
a detailed presentation of its results, which can be viewed at www.lumentfinancetrust.com.
Conference Call and Webcast Information
The Company will also host a conference call on Wednesday, November
13, 2024, at 8:30 a.m. ET to provide a business update and discuss the financial results for the third quarter of 2024. The conference
call may be accessed by dialing 1-800-836-8184 (U.S.) or 1-646-357-8785 (international). Note: there is no passcode; please ask the operator
to be joined into the Lument Finance Trust call. A live webcast, on a listen-only basis, is also available and can be accessed through
the URL:
https://app.webinar.net/lDnbp3nxz36
For those unable to listen to the live broadcast, a recorded
replay will be available for on-demand viewing approximately one hour after the end of the event through the Company’s website https://lumentfinancetrust.com/
and by telephone dial-in. The replay call-in number is 1-888-660-6345 (U.S.) or 1-646-517-4150 (international) with passcode
01454.
Non-GAAP Financial Measures
In this release, the Company
presents certain financial measures that are not calculated according to generally accepted accounting principles in the United States
(“GAAP”). Specifically, the Company is presenting distributable earnings, which constitutes a non-GAAP financial measure within
the meaning of Item 10(e) of Regulation S-K and is net income under GAAP. While we believe the non-GAAP information included in this press
release provides supplemental information to assist investors in analyzing our results, and to assist investors in comparing our results
with other peer issuers, these measures are not in accordance with GAAP, and they should not be considered a substitute for, or superior
to, our financial information calculated in accordance with GAAP. The methods of calculating non-GAAP financial measures may differ substantially
from similarly titled measures used by other companies. Our GAAP financial results and the reconciliations from these results should be
carefully evaluated.
Distributable Earnings
Distributable Earnings is a non-GAAP measure, which we define as GAAP
net income (loss) attributable to holders of common stock computed in accordance with GAAP, including realized losses not otherwise included
in GAAP net income (loss) and excluding (i) non-cash equity compensation, (ii) depreciation and amortization, (iii) any unrealized gains
or losses or other similar non-cash items that are included in net income for that applicable reporting period, regardless of whether
such items are included in other comprehensive income (loss) or net income (loss), and (iv) one-time events pursuant to changes in GAAP
and certain material non-cash income or expense items after discussions with the Company’s board of directors and approved by a
majority of the Company’s independent directors. Distributable Earnings mirrors how we calculate Core Earnings pursuant to
the terms of our management agreement between our manager Lument Investment Management, LLC (“Manager”) and us, or our management
agreement, for purposes of calculating the incentive fee payable to our Manager.
While Distributable Earnings excludes the impact of any unrealized
provisions for credit losses, any loan losses are charged off and realized through Distributable Earnings when deemed non-recoverable.
Non-recoverability is determined (i) upon the resolution of a loan (i.e. when the loan is repaid, fully or partially, or in the case of
foreclosures, when the underlying asset is sold), or (ii) with respect to any amount due under any loan, when such amount is determined
to be non-collectible.
We believe that Distributable Earnings provides meaningful information
to consider in addition to our net income (loss) and cash flows from operating activities determined in accordance with GAAP. We
believe Distributable Earnings is a useful financial metric for existing and potential future holders of our common stock as historically,
over time, Distributable Earnings has been a strong indicator of our dividends per share of common stock. As a REIT, we generally
must distribute annually at least 90% of our taxable income, subject to certain adjustments, and therefore we believe our dividends are
one of the principal reasons stockholders may invest in our common stock. Furthermore, Distributable Earnings help us to evaluate
our performance excluding the effects of certain transactions and GAAP adjustments that we believe are not necessarily indicative of our
current loan portfolio and operations and is a performance metric we consider when declaring our dividends.
Distributable Earnings does not represent net income (loss) or cash
generated from operating activities and should not be considered as an alternative to GAAP net income (loss), or an indication of GAAP
cash flows from operations, a measure of our liquidity, or an indication of funds available for our cash needs.
GAAP to Distributable Earnings Reconciliation
| | |
Three Months Ended | |
| | |
September 30, 2024 | |
| Reconciliation of GAAP to non-GAAP Information | |
| | |
| Net income attributable to common stockholders | |
$ | 5,095,684 | |
| Adjustments for non-Distributable Earnings | |
| | |
| Unrealized loss on mortgage servicing rights | |
| 46,017 | |
| Unrealized provision for credit losses | |
| 317,448 | |
| Subtotal | |
| 363,465 | |
| Other Adjustments | |
| | |
| Adjustment for income taxes | |
| 3,489 | |
| Subtotal | |
| 3,489 | |
| Distributable Earnings | |
$ | 5,462,638 | |
| | |
| | |
| Weighted-average shares outstanding, basic and diluted | |
| 52,283,669 | |
| Distributable Earnings per weighted share, basic and diluted | |
$ | 0.10 | |
About LFT
LFT is a Maryland corporation focused
on investing in, financing and managing a portfolio of commercial real estate debt investments. The Company primarily invests in transitional
floating rate commercial mortgage loans with an emphasis on middle-market multi-family assets.
LFT is externally managed and advised by Lument
Investment Management LLC, a Delaware limited liability company.
Additional Information and Where to Find
It
Investors, security holders and other interested
persons may find additional information regarding the Company at the SEC’s Internet site at http://www.sec.gov/ or
the Company website www.lumentfinancetrust.com or by directing requests to: Lument Finance Trust, 230 Park Avenue,
20th Floor, New York, NY 10169, Attention: Investor Relations.
Forward-Looking Statements
Certain statements included in this press
release constitute forward-looking statements intended to qualify for the safe harbor contained in Section 27A of the Securities Act of
1933, as amended, and Section 21E of the Securities Exchange Act, as amended. Forward-looking statements are subject to risks and uncertainties.
You can identify forward-looking statements by use of words such as "believe," "expect," "anticipate," "project,"
"estimate," "plan," "continue," "intend," "should," "may," "will,"
"seek," "would," "could," or similar expressions or other comparable terms, or by discussions of strategy,
plans or intentions. Forward-looking statements are based on the Company's beliefs, assumptions and expectations of its future performance,
taking into account all information currently available to the Company on the date of this press release or the date on which such statements
are first made. Actual results may differ from expectations, estimates and projections. You are cautioned not to place undue reliance
on forward-looking statements in this press release and should consider carefully the factors described in Part I, Item IA "Risk
Factors" in the Company's Annual Report on Form 10-K for the year ended December 31, 2023, which is available on the SEC’s
website at www.sec.gov, and in other current or periodic filings with the SEC, when evaluating these forward-looking statements. Forward-looking
statements are subject to substantial risks and uncertainties, many of which are difficult to predict and are generally beyond the Company's
control. Except as required by applicable law, the Company disclaims any intention or obligation to update or revise any forward-looking
statements, whether as a result of new information, future events or otherwise.
Investor Relations Contact:
James Briggs
Chief Financial Officer
(212) 521-6323
james.briggs@lument.com
Media Contact:
Tyler Howard
Associate Director
(513) 403-1911
tyler.howard@lument.com
Exhibit
99.2

| November 2024
Lument
Finance Trust
Q3 2024 Earnings Supplemental |
| Disclaimer
2
This presentation contains forward-looking statements within the meaning of Section 27A of the
Securities Act of 1933, as amended, and Section 21E of the Securities Exchange Act of 1934, as amended,
which reflect the current views of Lument Finance Trust, Inc. (NYSE: LFT) (“LFT,” the “Company,” “we,” “our,”
or “us”) with respect to, among other things, the Company’s operations and financial performance. You
can identify these forward-looking statements by the use of words such as “outlook,” “indicator,” “believes,”
“expects,” “potential,” “continues,” “may,” “will,” “should,” “seeks,” “approximately,” “predicts,” “projects,”
“intends,” “plans,” “estimates,” or “anticipates,” or the negative version of these words or other comparable
words or other statements that do not relate strictly to historical or factual matters. Such forward-looking
statements are subject to various risks and uncertainties. Accordingly, there are or will be important
factors that could cause actual outcomes or results to differ materially from those indicated in these
statements. The Company believes these factors include but are not limited to those described under the
section entitled “Risk Factors” in its Annual Report on Form 10-K for the year ended December 31, 2023,
which is available on the SEC’s website at www.sec.gov. These factors should not be construed as
exhaustive and should be read in conjunction with the other cautionary statements that are included in
this presentation and in the filings. The forward-looking statements contained in this presentation speak
only as of November 12th, 2024. The Company assumes no obligation to update or supplement
forward‐looking statements that become untrue because of subsequent events or circumstances.
This presentation includes non-GAAP financial measures, including Distributable Earnings. While we
believe the non-GAAP information included in this presentation provides supplemental information to
assist investors in analyzing our operating results and to assist investors in comparing our operating
results with other peer issuers, these measures are not in accordance with GAAP, and they should not be
considered a substitute for, or superior to, our financial information calculated in accordance with GAAP.
Please refer to this presentation’s Appendix for a reconciliation of the non-GAAP financial measures
included in this presentation to the most directly comparable financial measures prepared in accordance
with GAAP. |
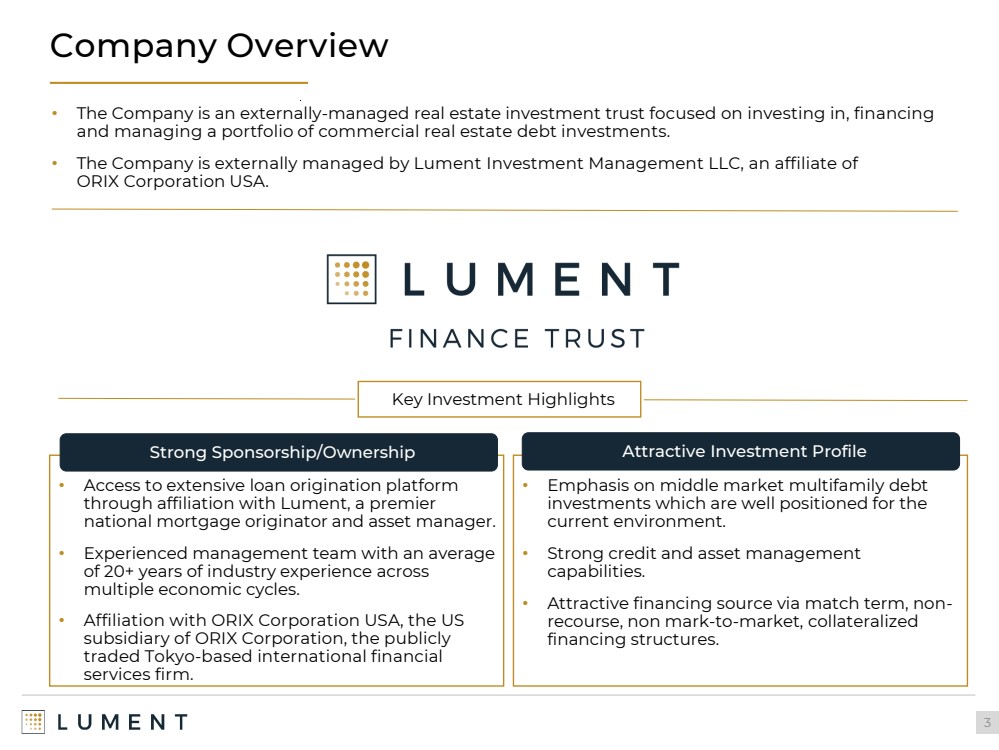
| Company Overview
3
Key Investment Highlights
Strong Sponsorship/Ownership
• Access to extensive loan origination platform
through affiliation with Lument, a premier
national mortgage originator and asset manager.
• Experienced management team with an average
of 20+ years of industry experience across
multiple economic cycles.
• Affiliation with ORIX Corporation USA, the US
subsidiary of ORIX Corporation, the publicly
traded Tokyo-based international financial
services firm.
• The Company is an externally-managed real estate investment trust focused on investing in, financing
and managing a portfolio of commercial real estate debt investments.
• The Company is externally managed by Lument Investment Management LLC, an affiliate of
ORIX Corporation USA.
Attractive Investment Profile
• Emphasis on middle market multifamily debt
investments which are well positioned for the
current environment.
• Strong credit and asset management
capabilities.
• Attractive financing source via match term, non-recourse, non mark-to-market, collateralized
financing structures. |
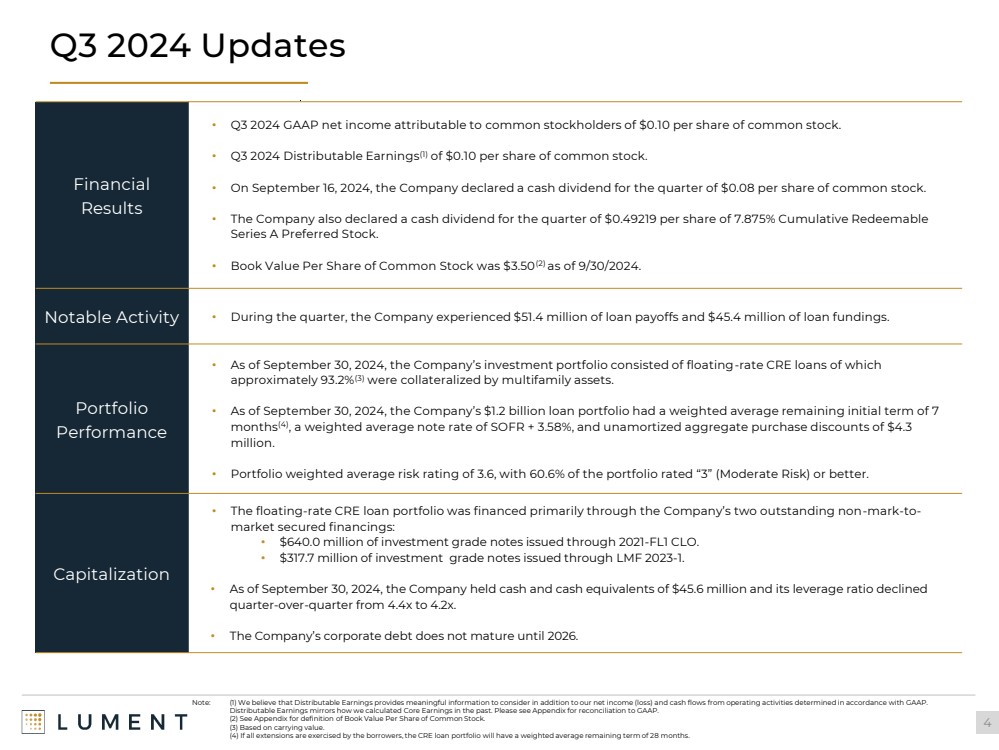
| Q3 2024 Updates
4
Note: (1) We believe that Distributable Earnings provides meaningful information to consider in addition to our net income (loss) and cash flows from operating activities determined in accordance with GAAP.
Distributable Earnings mirrors how we calculated Core Earnings in the past. Please see Appendix for reconciliation to GAAP.
(2) See Appendix for definition of Book Value Per Share of Common Stock.
(3) Based on carrying value.
(4) If all extensions are exercised by the borrowers, the CRE loan portfolio will have a weighted average remaining term of 28 months.
Financial
Results
• Q3 2024 GAAP net income attributable to common stockholders of $0.10 per share of common stock.
• Q3 2024 Distributable Earnings(1) of $0.10 per share of common stock.
• On September 16, 2024, the Company declared a cash dividend for the quarter of $0.08 per share of common stock.
• The Company also declared a cash dividend for the quarter of $0.49219 per share of 7.875% Cumulative Redeemable
Series A Preferred Stock.
• Book Value Per Share of Common Stock was $3.50(2) as of 9/30/2024.
Notable Activity • During the quarter, the Company experienced $51.4 million of loan payoffs and $45.4 million of loan fundings.
Portfolio
Performance
• As of September 30, 2024, the Company’s investment portfolio consisted of floating-rate CRE loans of which
approximately 93.2%(3) were collateralized by multifamily assets.
• As of September 30, 2024, the Company’s $1.2 billion loan portfolio had a weighted average remaining initial term of 7
months(4), a weighted average note rate of SOFR + 3.58%, and unamortized aggregate purchase discounts of $4.3
million.
• Portfolio weighted average risk rating of 3.6, with 60.6% of the portfolio rated “3” (Moderate Risk) or better.
Capitalization
• The floating-rate CRE loan portfolio was financed primarily through the Company’s two outstanding non-mark-to-market secured financings:
• $640.0 million of investment grade notes issued through 2021-FL1 CLO.
• $317.7 million of investment grade notes issued through LMF 2023-1.
• As of September 30, 2024, the Company held cash and cash equivalents of $45.6 million and its leverage ratio declined
quarter-over-quarter from 4.4x to 4.2x.
• The Company’s corporate debt does not mature until 2026. |
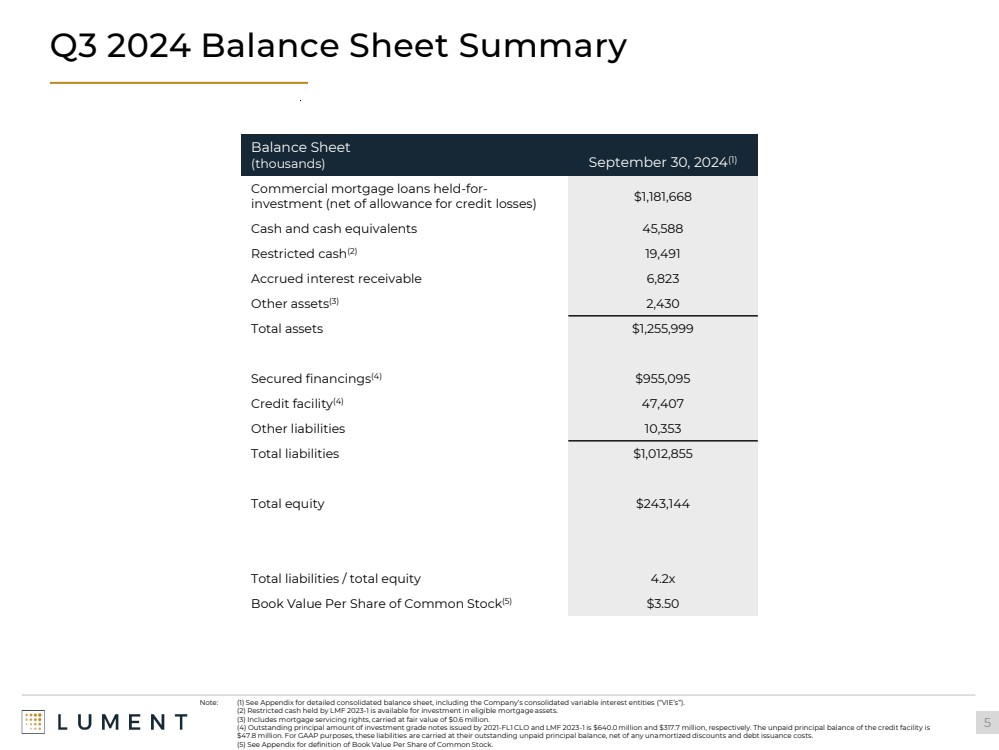
| Q3 2024 Balance Sheet Summary
5
Balance Sheet
(thousands) September 30, 2024(1)
Commercial mortgage loans held-for-investment (net of allowance for credit losses) $1,181,668
Cash and cash equivalents 45,588
Restricted cash(2) 19,491
Accrued interest receivable 6,823
Other assets(3) 2,430
Total assets $1,255,999
Secured financings(4) $955,095
Credit facility(4) 47,407
Other liabilities 10,353
Total liabilities $1,012,855
Total equity $243,144
Total liabilities / total equity 4.2x
Book Value Per Share of Common Stock(5) $3.50
Note: (1) See Appendix for detailed consolidated balance sheet, including the Company’s consolidated variable interest entities (“VIE’s”).
(2) Restricted cash held by LMF 2023-1 is available for investment in eligible mortgage assets.
(3) Includes mortgage servicing rights, carried at fair value of $0.6 million.
(4) Outstanding principal amount of investment grade notes issued by 2021-FL1 CLO and LMF 2023-1 is $640.0 million and $317.7 million, respectively. The unpaid principal balance of the credit facility is
$47.8 million. For GAAP purposes, these liabilities are carried at their outstanding unpaid principal balance, net of any unamortized discounts and debt issuance costs.
(5) See Appendix for definition of Book Value Per Share of Common Stock. |
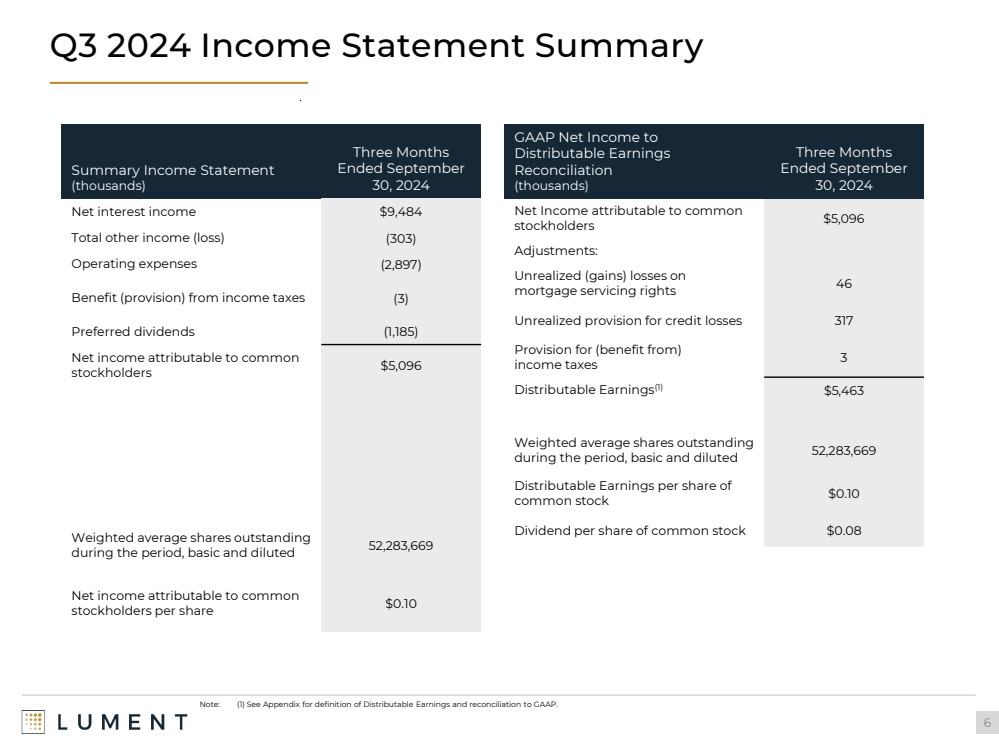
| Q3 2024 Income Statement Summary
6
Summary Income Statement
(thousands)
Three Months
Ended September
30, 2024
Net interest income $9,484
Total other income (loss) (303)
Operating expenses (2,897)
Benefit (provision) from income taxes (3)
Preferred dividends (1,185)
Net income attributable to common
stockholders $5,096
Weighted average shares outstanding
during the period, basic and diluted 52,283,669
Net income attributable to common
stockholders per share $0.10
GAAP Net Income to
Distributable Earnings
Reconciliation
(thousands)
Three Months
Ended September
30, 2024
Net Income attributable to common
stockholders $5,096
Adjustments:
Unrealized (gains) losses on
mortgage servicing rights 46
Unrealized provision for credit losses 317
Provision for (benefit from)
income taxes 3
Distributable Earnings(1) $5,463
Weighted average shares outstanding
during the period, basic and diluted 52,283,669
Distributable Earnings per share of
common stock $0.10
Dividend per share of common stock $0.08
Note: (1) See Appendix for definition of Distributable Earnings and reconciliation to GAAP. |
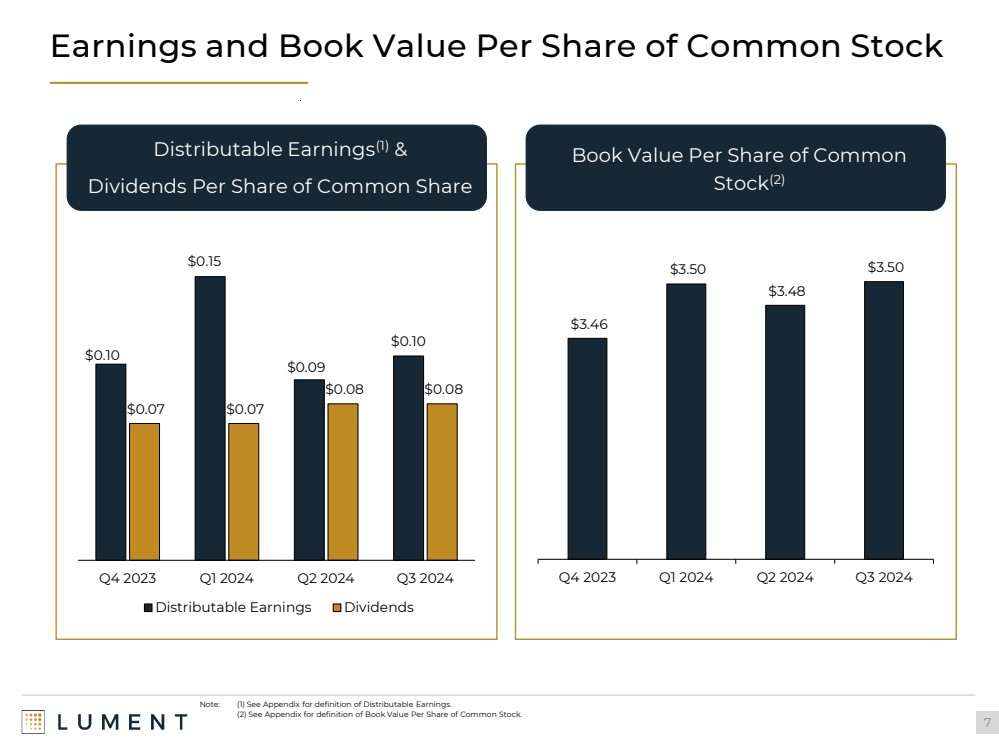
| Earnings and Book Value Per Share of Common Stock
7
$0.10
$0.15
$0.09
$0.10
$0.07 $0.07
$0.08 $0.08
Q4 2023 Q1 2024 Q2 2024 Q3 2024
Distributable Earnings Dividends
$3.46
$3.50
$3.48
$3.50
Q4 2023 Q1 2024 Q2 2024 Q3 2024
Distributable Earnings(1) &
Dividends Per Share of Common Share
Book Value Per Share of Common
Stock(2)
Note: (1) See Appendix for definition of Distributable Earnings.
(2) See Appendix for definition of Book Value Per Share of Common Stock. |
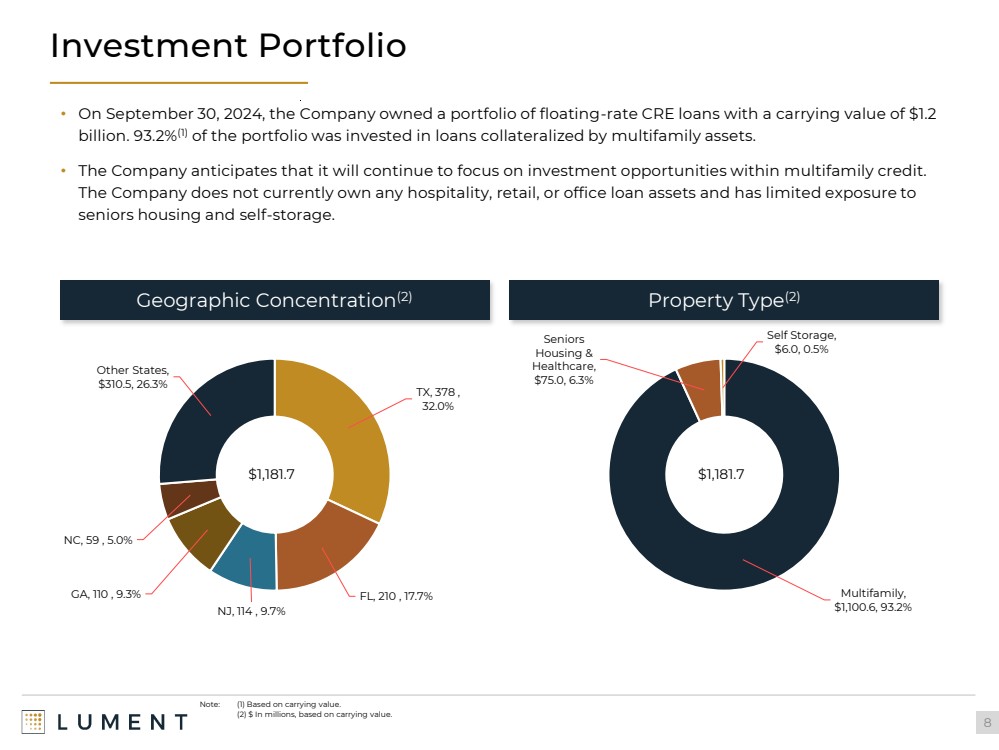
| Investment Portfolio
8
Geographic Concentration(2)
Multifamily,
$1,100.6, 93.2%
Seniors
Housing &
Healthcare,
$75.0, 6.3%
Self Storage,
$6.0, 0.5%
Property Type(2)
$1,181.7
Note: (1) Based on carrying value.
(2) $ In millions, based on carrying value.
• On September 30, 2024, the Company owned a portfolio of floating-rate CRE loans with a carrying value of $1.2
billion. 93.2%(1) of the portfolio was invested in loans collateralized by multifamily assets.
• The Company anticipates that it will continue to focus on investment opportunities within multifamily credit.
The Company does not currently own any hospitality, retail, or office loan assets and has limited exposure to
seniors housing and self-storage.
TX, 378 ,
32.0%
FL, 210 , 17.7%
NJ, 114 , 9.7%
GA, 110 , 9.3%
NC, 59 , 5.0%
Other States,
$310.5, 26.3%
$1,181.7 |
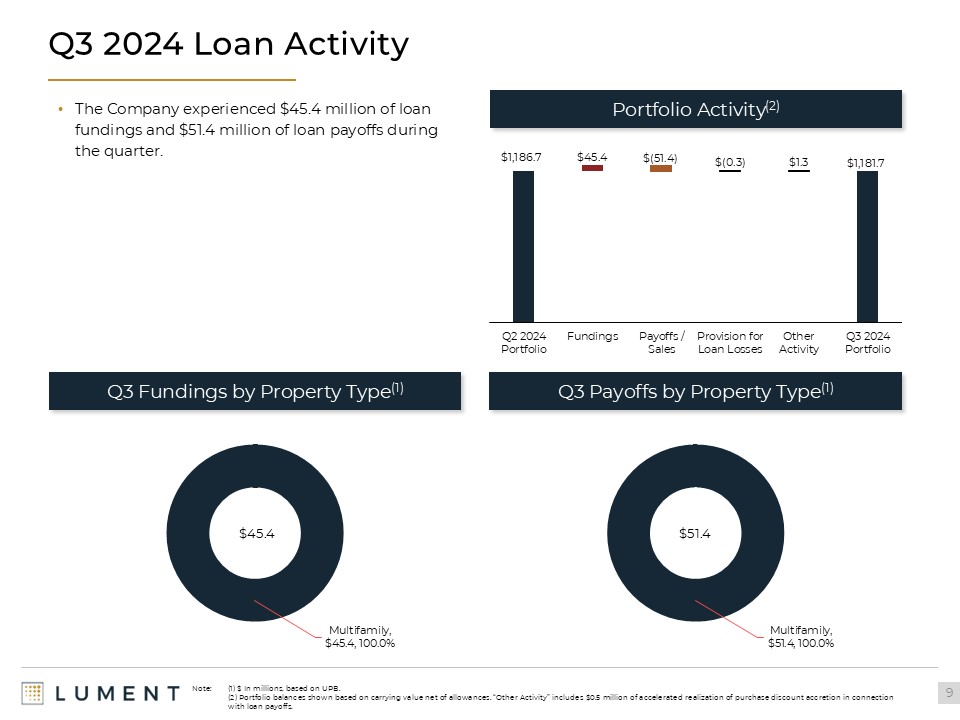
| Q3 2024 Loan Activity
9
Multifamily,
$51.4, 100.0%
Q3 Payoffs by Property Type(1)
$51.4
• The Company experienced $45.4 million of loan
fundings and $51.4 million of loan payoffs during
the quarter.
Note: (1) $ In millions, based on UPB.
(2) Portfolio balances shown based on carrying value net of allowances. “Other Activity” consists of accelerated realization of deferred origination fees and purchase discount
accretion in connection with loan payoffs.
Portfolio Activity(2)
$1,186.7 $45.4 $(51.4) $(0.3) $1.3 $1,181.7
Q2 2024
Portfolio
Fundings Payoffs /
Sales
Provision for
Loan Losses
Other
Activity
Q3 2024
Portfolio
Multifamily,
$45.4, 100.0%
Q3 Fundings by Property Type(1)
$45.4 |
| Portfolio Credit
10
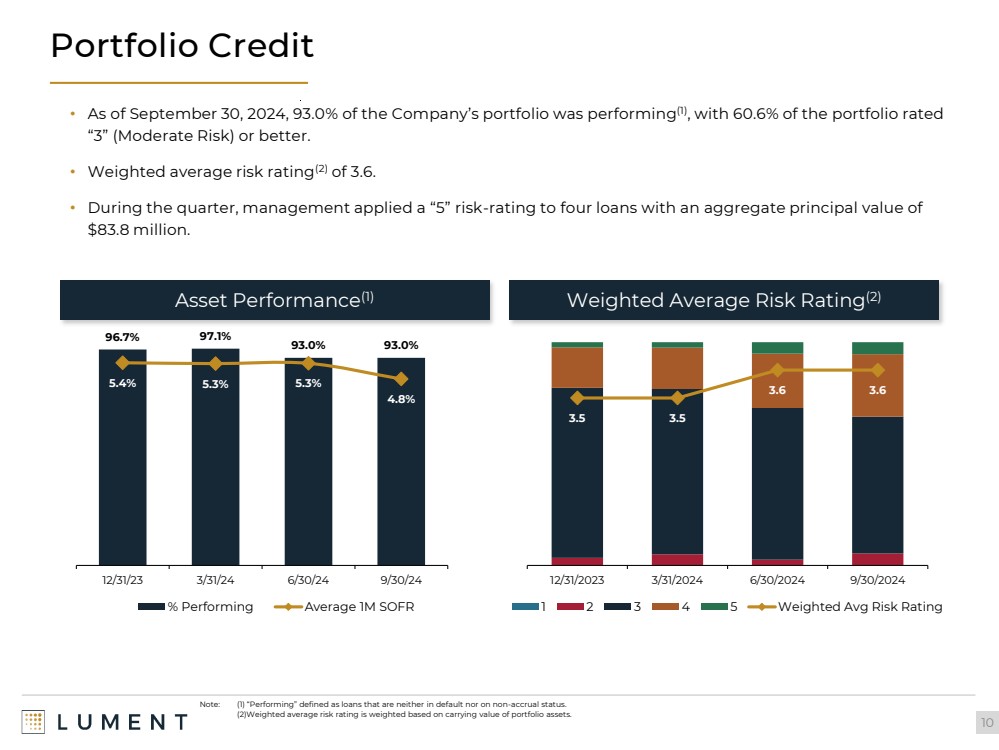
• As of September 30, 2024, 93.0% of the Company’s portfolio was performing(1), with 60.6% of the portfolio rated
“3” (Moderate Risk) or better.
• Weighted average risk rating(2) of 3.6.
• During the quarter, management applied a “5” risk-rating to four loans with an aggregate principal value of
$83.8 million.
96.7% 97.1%
93.0% 93.0%
5.4% 5.3% 5.3%
4.8%
-1.0000%
0.0000%
1.0000%
2.0000%
3.0000%
4.0000%
5.0000%
6.0000%
0%
10%
20%
30%
40%
50%
60%
70%
80%
90%
100%
12/31/23 3/31/24 6/30/24 9/30/24
% Performing Average 1M SOFR
Asset Performance(1) Weighted Average Risk Rating(2)
Note: (1) “Performing” defined as loans that are neither in default nor on non-accrual status.
(2)Weighted average risk rating is weighted based on carrying value of portfolio assets.
3.5 3.5
3.6 3.6
2.90
3.00
3.10
3.20
3.30
3.40
3.50
3.60
3.70
0%
10%
20%
30%
40%
50%
60%
70%
80%
90%
100%
12/31/2023 3/31/2024 6/30/2024 9/30/2024
1 2 3 4 5 Weighted Avg Risk Rating |
| Q3 2024 Capital Structure Overview
11
76.7%
14.7%
4.8%
3.8%
Secured Financing Common Equity
Preferred Equity Term Loan
$1,248.5
Capital Structure Composition(1) Capital Structure Detail
Note: (1) In millions. LFT total capitalization is a non-GAAP measure which excludes certain Balance Sheet items; Please see Appendix for reconciliation to GAAP.
(2) Secured financing shown at par value. 2021-FL1 CLO GAAP carrying value of $640.0 million includes $0.0 million of unamortized debt issuance costs. LMF 2023-1 carrying value of $315.1
million includes $2.6 million of unamortized debt issuance costs.
(3) Term loan shown at par value. GAAP carrying value of $47.4 million includes $0.3 million of unamortized debt issuance costs.
(4) Preferred equity shown at $60 million liquidation preference.
(5) Noncontrolling interest was $99,500 as of 9/30/2024 and is excluded from common equity above.
Match Term
Non-Recourse
Financing
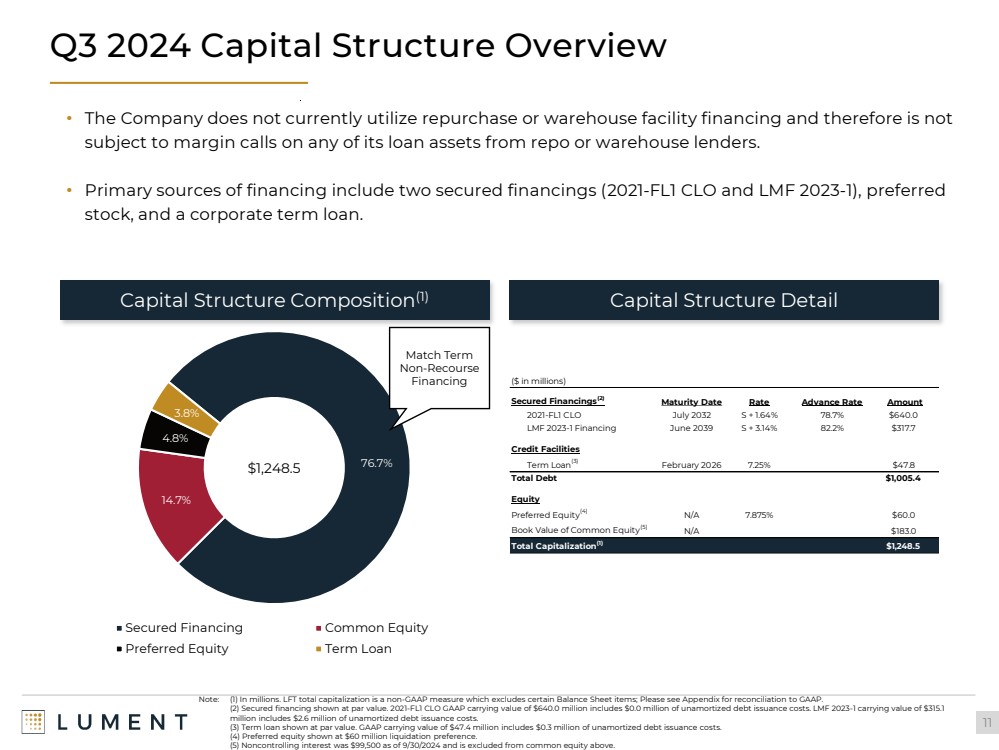
• The Company does not currently utilize repurchase or warehouse facility financing and therefore is not
subject to margin calls on any of its loan assets from repo or warehouse lenders.
• Primary sources of financing include two secured financings (2021-FL1 CLO and LMF 2023-1), preferred
stock, and a corporate term loan.
($ in millions)
Secured Financings(2) Maturity Date Rate Advance Rate Amount
2021-FL1 CLO July 2032 S + 1.64% 78.7% $640.0
LMF 2023-1 Financing June 2039 S + 3.14% 82.2% $317.7
Credit Facilities
Term Loan(3) February 2026 7.25% $47.8
Total Debt $1,005.4
Equity
Preferred Equity(4) N/A 7.875% $60.0
Book Value of Common Equity(5) N/A $183.0
Total Capitalization(1) $1,248.5 |
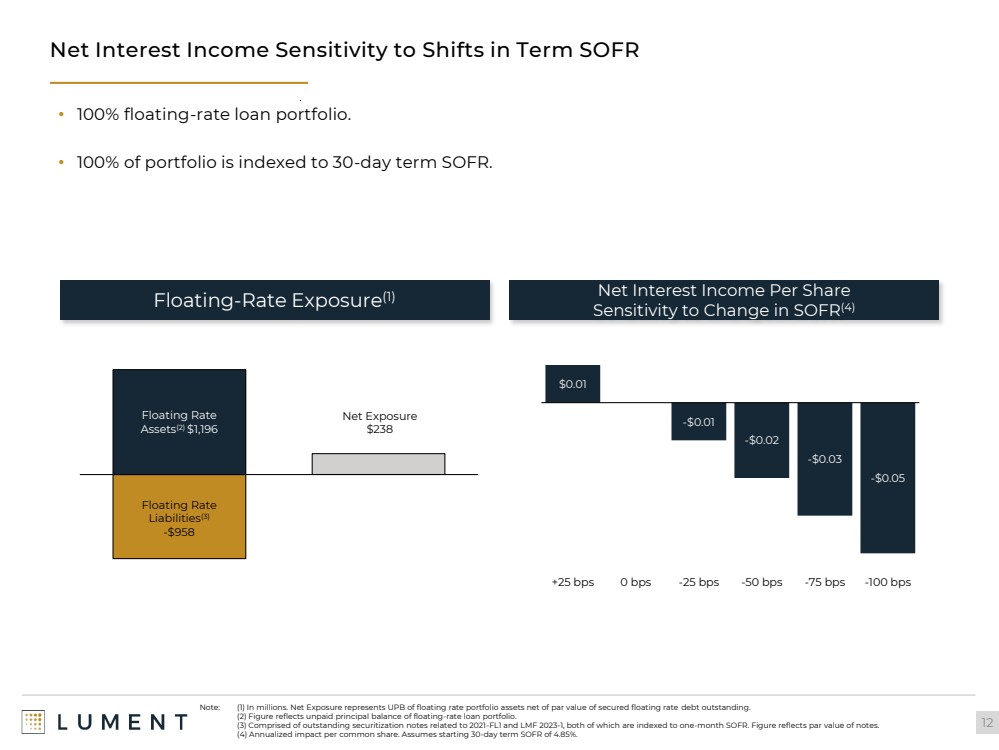
| $0.01
-$0.01
-$0.02
-$0.03
-$0.05
+25 bps 0 bps -25 bps -50 bps -75 bps -100 bps
Net Interest Income Sensitivity to Shifts in Term SOFR
12
Floating Rate
Assets(2) $1,196
Floating Rate
Liabilities(3)
-$958
Net Exposure
$238
Floating-Rate Exposure(1) Net Interest Income Per Share
Sensitivity to Change in SOFR(4)
Note: (1) In millions. Net Exposure represents UPB of floating rate portfolio assets net of par value of secured floating rate debt outstanding.
(2) Figure reflects unpaid principal balance of floating-rate loan portfolio.
(3) Comprised of outstanding securitization notes related to 2021-FL1 and LMF 2023-1, both of which are indexed to one-month SOFR. Figure reflects par value of notes.
(4) Annualized impact per common share. Assumes starting 30-day term SOFR of 4.85%.
• 100% floating-rate loan portfolio.
• 100% of portfolio is indexed to 30-day term SOFR. |

| Appendix |
| # Loan Name
Closing
Date
Maturity
Date
Property Type City State
Unpaid Principal
Balance
Note
Spread
Unamortized
Discount/Premium
Initial Term
(months)
As-Is LTV at
Origination(1)
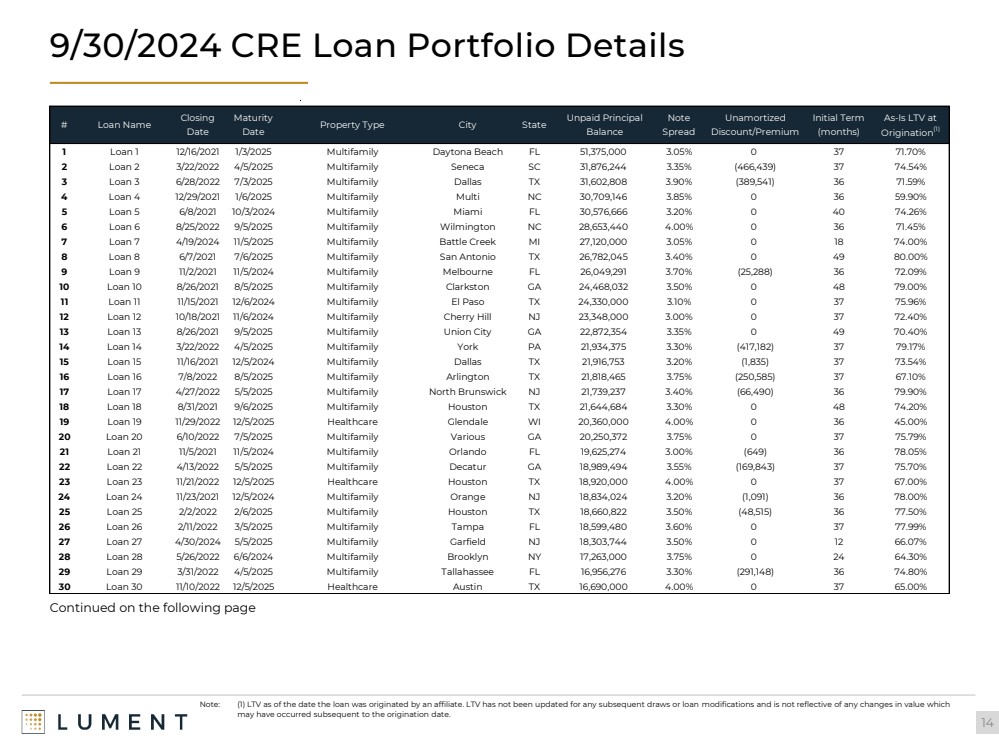
1 Loan 1 12/16/2021 1/3/2025 Multifamily Daytona Beach FL 51,375,000 3.05% 0 37 71.70%
2 Loan 2 3/22/2022 4/5/2025 Multifamily Seneca S C 31,876,244 3.35% (466,439) 37 74.54%
3 Loan 3 6/28/2022 7/3/2025 Multifamily Dallas T X 31,602,808 3.90% (389,541) 36 71.59%
4 Loan 4 12/29/2021 1/6/2025 Multifamily Multi NC 30,709,146 3.85% 0 36 59.90%
5 Loan 5 6/8/2021 10/3/2024 Multifamily Miami FL 30,576,666 3.20% 0 40 74.26%
6 Loan 6 8/25/2022 9/5/2025 Multifamily Wilmington NC 28,653,440 4.00% 0 36 71.45%
7 Loan 7 4/19/2024 11/5/2025 Multifamily Battle Creek MI 27,120,000 3.05% 0 18 74.00%
8 Loan 8 6/7/2021 7/6/2025 Multifamily San Antonio T X 26,782,045 3.40% 0 49 80.00%
9 Loan 9 11/2/2021 11/5/2024 Multifamily Melbourne FL 26,049,291 3.70% (25,288) 36 72.09%
10 Loan 10 8/26/2021 8/5/2025 Multifamily Clarkston GA 24,468,032 3.50% 0 48 79.00%
11 Loan 11 11/15/2021 12/6/2024 Multifamily El Paso T X 24,330,000 3.10% 0 37 75.96%
12 Loan 12 10/18/2021 11/6/2024 Multifamily Cherry Hill NJ 23,348,000 3.00% 0 37 72.40%
13 Loan 13 8/26/2021 9/5/2025 Multifamily Union City GA 22,872,354 3.35% 0 49 70.40%
14 Loan 14 3/22/2022 4/5/2025 Multifamily York PA 21,934,375 3.30% (417,182) 37 79.17%
15 Loan 15 11/16/2021 12/5/2024 Multifamily Dallas T X 21,916,753 3.20% (1,835) 37 73.54%
16 Loan 16 7/8/2022 8/5/2025 Multifamily Arlington T X 21,818,465 3.75% (250,585) 37 67.10%
17 Loan 17 4/27/2022 5/5/2025 Multifamily North Brunswick NJ 21,739,237 3.40% (66,490) 36 79.90%
18 Loan 18 8/31/2021 9/6/2025 Multifamily Houston T X 21,644,684 3.30% 0 48 74.20%
19 Loan 19 11/29/2022 12/5/2025 Healthcare Glendale WI 20,360,000 4.00% 0 36 45.00%
20 Loan 20 6/10/2022 7/5/2025 Multifamily Various GA 20,250,372 3.75% 0 37 75.79%
21 Loan 21 11/5/2021 11/5/2024 Multifamily Orlando FL 19,625,274 3.00% (649) 36 78.05%
22 Loan 22 4/13/2022 5/5/2025 Multifamily Decatur GA 18,989,494 3.55% (169,843) 37 75.70%
23 Loan 23 11/21/2022 12/5/2025 Healthcare Houston T X 18,920,000 4.00% 0 37 67.00%
24 Loan 24 11/23/2021 12/5/2024 Multifamily Orange NJ 18,834,024 3.20% (1,091) 36 78.00%
25 Loan 25 2/2/2022 2/6/2025 Multifamily Houston T X 18,660,822 3.50% (48,515) 36 77.50%
26 Loan 26 2/11/2022 3/5/2025 Multifamily Tampa FL 18,599,480 3.60% 0 37 77.99%
27 Loan 27 4/30/2024 5/5/2025 Multifamily Garfield NJ 18,303,744 3.50% 0 12 66.07%
28 Loan 28 5/26/2022 6/6/2024 Multifamily Brooklyn NY 17,263,000 3.75% 0 24 64.30%
29 Loan 29 3/31/2022 4/5/2025 Multifamily Tallahassee FL 16,956,276 3.30% (291,148) 36 74.80%
30 Loan 30 11/10/2022 12/5/2025 Healthcare Austin T X 16,690,000 4.00% 0 37 65.00%
9/30/2024 CRE Loan Portfolio Details
14
Continued on the following page
Note: (1) LTV as of the date the loan was originated by an affiliate. LTV has not been updated for any subsequent draws or loan modifications and is not reflective of any changes in value which
may have occurred subsequent to the origination date. |
| # Loan Name
Closing
Date
Maturity
Date
Property Type City State
Unpaid Principal
Balance
Note
Spread
Unamortized
Discount/Premium
Initial Term
(months)
As-Is LTV at
Origination(1)
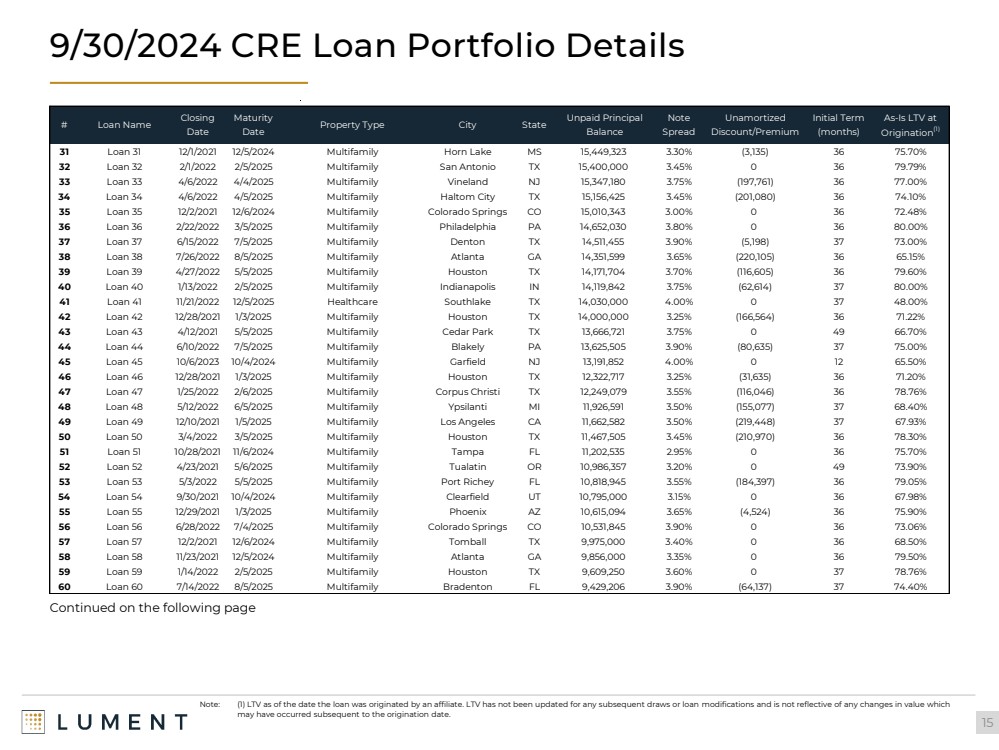
31 Loan 31 12/1/2021 12/5/2024 Multifamily Horn Lake MS 15,449,323 3.30% (3,135) 36 75.70%
32 Loan 32 2/1/2022 2/5/2025 Multifamily San Antonio T X 15,400,000 3.45% 0 36 79.79%
33 Loan 33 4/6/2022 4/4/2025 Multifamily Vineland NJ 15,347,180 3.75% (197,761) 36 77.00%
34 Loan 34 4/6/2022 4/5/2025 Multifamily Haltom City T X 15,156,425 3.45% (201,080) 36 74.10%
35 Loan 35 12/2/2021 12/6/2024 Multifamily Colorado Springs CO 15,010,343 3.00% 0 36 72.48%
36 Loan 36 2/22/2022 3/5/2025 Multifamily Philadelphia PA 14,652,030 3.80% 0 36 80.00%
37 Loan 37 6/15/2022 7/5/2025 Multifamily Denton T X 14,511,455 3.90% (5,198) 37 73.00%
38 Loan 38 7/26/2022 8/5/2025 Multifamily Atlanta GA 14,351,599 3.65% (220,105) 36 65.15%
39 Loan 39 4/27/2022 5/5/2025 Multifamily Houston T X 14,171,704 3.70% (116,605) 36 79.60%
40 Loan 40 1/13/2022 2/5/2025 Multifamily Indianapolis IN 14,119,842 3.75% (62,614) 37 80.00%
41 Loan 41 11/21/2022 12/5/2025 Healthcare Southlake T X 14,030,000 4.00% 0 37 48.00%
42 Loan 42 12/28/2021 1/3/2025 Multifamily Houston T X 14,000,000 3.25% (166,564) 36 71.22%
43 Loan 43 4/12/2021 5/5/2025 Multifamily Cedar Park T X 13,666,721 3.75% 0 49 66.70%
44 Loan 44 6/10/2022 7/5/2025 Multifamily Blakely PA 13,625,505 3.90% (80,635) 37 75.00%
45 Loan 45 10/6/2023 10/4/2024 Multifamily Garfield NJ 13,191,852 4.00% 0 12 65.50%
46 Loan 46 12/28/2021 1/3/2025 Multifamily Houston T X 12,322,717 3.25% (31,635) 36 71.20%
47 Loan 47 1/25/2022 2/6/2025 Multifamily Corpus Christi T X 12,249,079 3.55% (116,046) 36 78.76%
48 Loan 48 5/12/2022 6/5/2025 Multifamily Ypsilanti MI 11,926,591 3.50% (155,077) 37 68.40%
49 Loan 49 12/10/2021 1/5/2025 Multifamily Los Angeles CA 11,662,582 3.50% (219,448) 37 67.93%
50 Loan 50 3/4/2022 3/5/2025 Multifamily Houston T X 11,467,505 3.45% (210,970) 36 78.30%
51 Loan 51 10/28/2021 11/6/2024 Multifamily Tampa FL 11,202,535 2.95% 0 36 75.70%
52 Loan 52 4/23/2021 5/6/2025 Multifamily Tualatin OR 10,986,357 3.20% 0 49 73.90%
53 Loan 53 5/3/2022 5/5/2025 Multifamily Port Richey FL 10,818,945 3.55% (184,397) 36 79.05%
54 Loan 54 9/30/2021 10/4/2024 Multifamily Clearfield UT 10,795,000 3.15% 0 36 67.98%
55 Loan 55 12/29/2021 1/3/2025 Multifamily Phoenix AZ 10,615,094 3.65% (4,524) 36 75.90%
56 Loan 56 6/28/2022 7/4/2025 Multifamily Colorado Springs CO 10,531,845 3.90% 0 36 73.06%
57 Loan 57 12/2/2021 12/6/2024 Multifamily Tomball T X 9,975,000 3.40% 0 36 68.50%
58 Loan 58 11/23/2021 12/5/2024 Multifamily Atlanta GA 9,856,000 3.35% 0 36 79.50%
59 Loan 59 1/14/2022 2/5/2025 Multifamily Houston T X 9,609,250 3.60% 0 37 78.76%
60 Loan 60 7/14/2022 8/5/2025 Multifamily Bradenton FL 9,429,206 3.90% (64,137) 37 74.40%
9/30/2024 CRE Loan Portfolio Details
15
Note: (1) LTV as of the date the loan was originated by an affiliate. LTV has not been updated for any subsequent draws or loan modifications and is not reflective of any changes in value which
may have occurred subsequent to the origination date.
Continued on the following page |
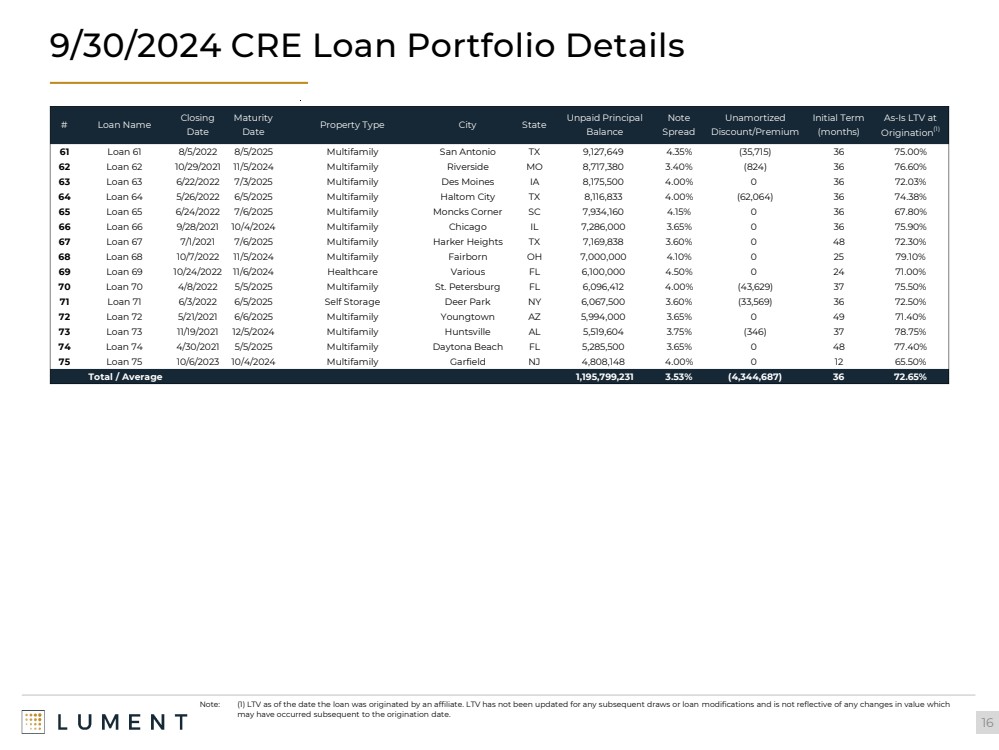
| 9/30/2024 CRE Loan Portfolio Details
16
Note: (1) LTV as of the date the loan was originated by an affiliate. LTV has not been updated for any subsequent draws or loan modifications and is not reflective of any changes in value which
may have occurred subsequent to the origination date.
# Loan Name
Closing
Date
Maturity
Date
Property Type City State
Unpaid Principal
Balance
Note
Spread
Unamortized
Discount/Premium
Initial Term
(months)
As-Is LTV at
Origination(1)
61 Loan 61 8/5/2022 8/5/2025 Multifamily San Antonio T X 9,127,649 4.35% (35,715) 36 75.00%
62 Loan 62 10/29/2021 11/5/2024 Multifamily Riverside MO 8,717,380 3.40% (824) 36 76.60%
63 Loan 63 6/22/2022 7/3/2025 Multifamily Des Moines IA 8,175,500 4.00% 0 36 72.03%
64 Loan 64 5/26/2022 6/5/2025 Multifamily Haltom City T X 8,116,833 4.00% (62,064) 36 74.38%
65 Loan 65 6/24/2022 7/6/2025 Multifamily Moncks Corner SC 7,934,160 4.15% 0 36 67.80%
66 Loan 66 9/28/2021 10/4/2024 Multifamily Chicago IL 7,286,000 3.65% 0 36 75.90%
67 Loan 67 7/1/2021 7/6/2025 Multifamily Harker Heights T X 7,169,838 3.60% 0 48 72.30%
68 Loan 68 10/7/2022 11/5/2024 Multifamily Fairborn OH 7,000,000 4.10% 0 25 79.10%
69 Loan 69 10/24/2022 11/6/2024 Healthcare Various FL 6,100,000 4.50% 0 24 71.00%
70 Loan 70 4/8/2022 5/5/2025 Multifamily St. Petersburg FL 6,096,412 4.00% (43,629) 37 75.50%
71 Loan 71 6/3/2022 6/5/2025 Self Storage Deer Park NY 6,067,500 3.60% (33,569) 36 72.50%
72 Loan 72 5/21/2021 6/6/2025 Multifamily Youngtown AZ 5,994,000 3.65% 0 49 71.40%
73 Loan 73 11/19/2021 12/5/2024 Multifamily Huntsville AL 5,519,604 3.75% (346) 37 78.75%
74 Loan 74 4/30/2021 5/5/2025 Multifamily Daytona Beach FL 5,285,500 3.65% 0 48 77.40%
75 Loan 75 10/6/2023 10/4/2024 Multifamily Garfield NJ 4,808,148 4.00% 0 12 65.50%
Total / Average 1,195,799,231 3.53% (4,344,687) 36 72.65% |
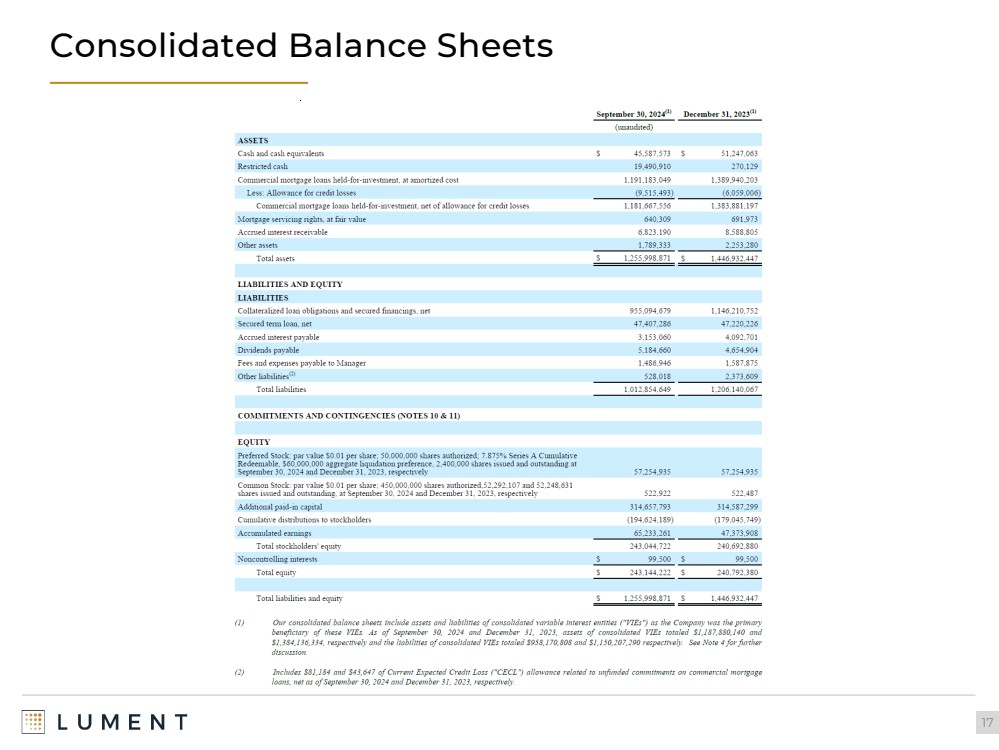
| Consolidated Balance Sheets
17 |
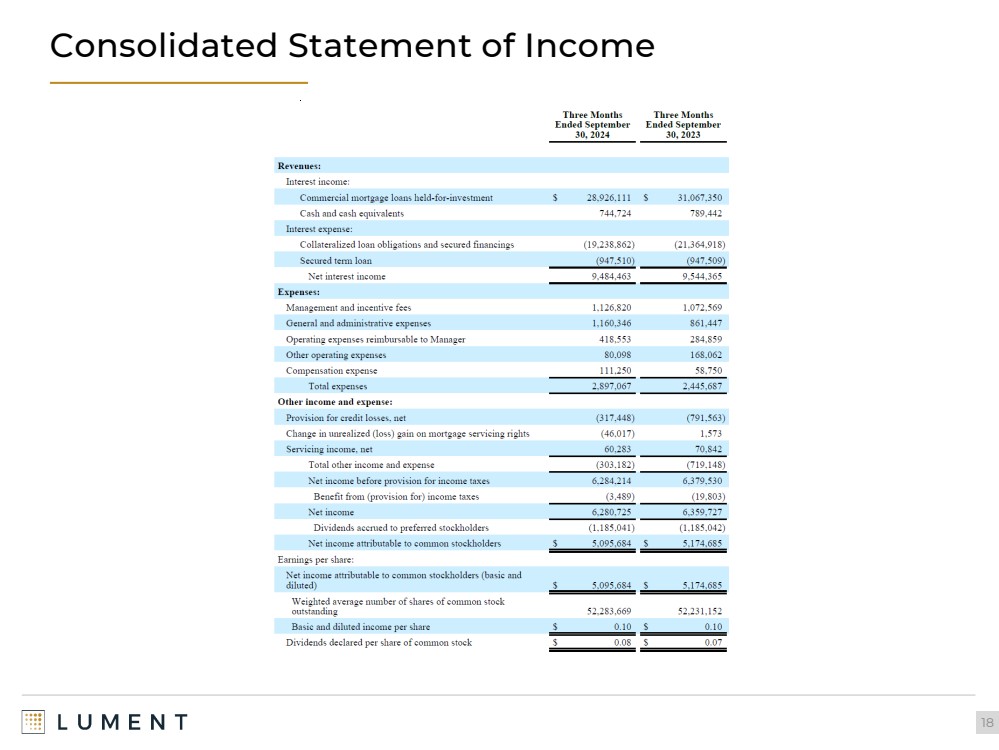
| Consolidated Statement of Income
18 |
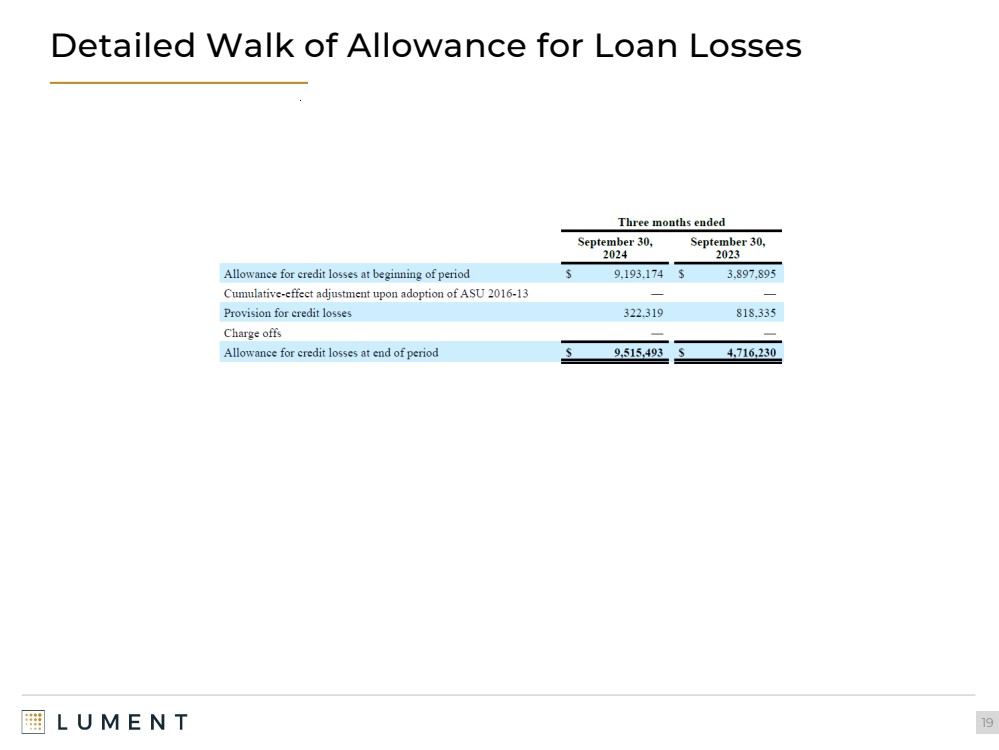
| Detailed Walk of Allowance for Loan Losses
19 |
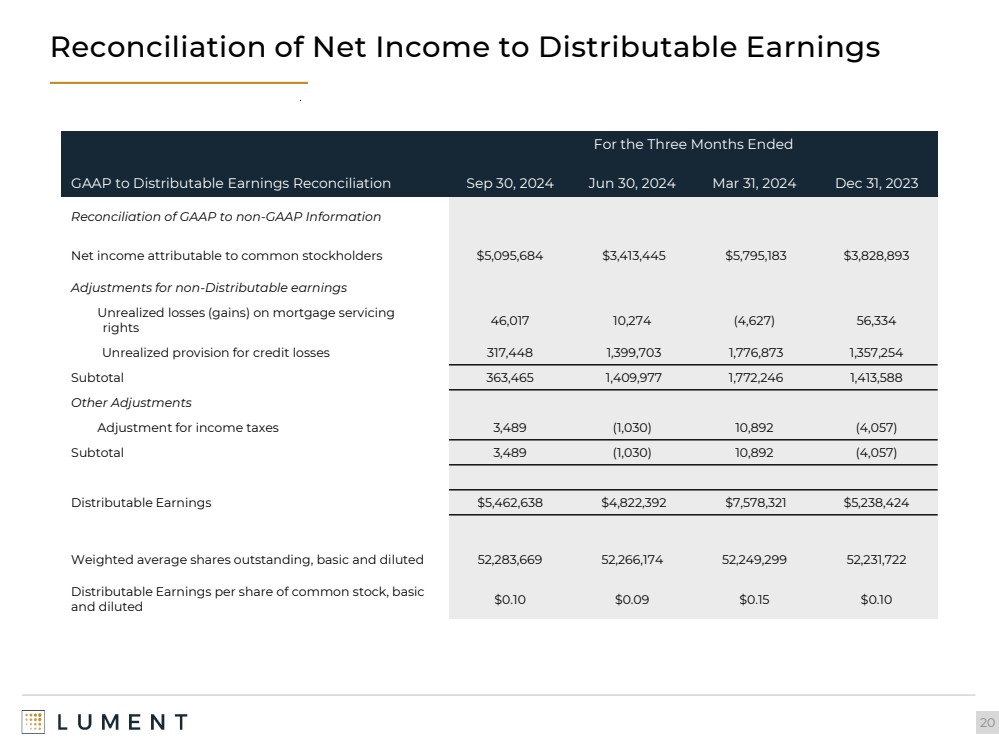
| Reconciliation of Net Income to Distributable Earnings
20
For the Three Months Ended
GAAP to Distributable Earnings Reconciliation Sep 30, 2024 Jun 30, 2024 Mar 31, 2024 Dec 31, 2023
Reconciliation of GAAP to non-GAAP Information
Net income attributable to common stockholders $5,095,684 $3,413,445 $5,795,183 $3,828,893
Adjustments for non-Distributable earnings
Unrealized losses (gains) on mortgage servicing
rights 46,017 10,274 (4,627) 56,334
Unrealized provision for credit losses 317,448 1,399,703 1,776,873 1,357,254
Subtotal 363,465 1,409,977 1,772,246 1,413,588
Other Adjustments
Adjustment for income taxes 3,489 (1,030) 10,892 (4,057)
Subtotal 3,489 (1,030) 10,892 (4,057)
Distributable Earnings $5,462,638 $4,822,392 $7,578,321 $5,238,424
Weighted average shares outstanding, basic and diluted 52,283,669 52,266,174 52,249,299 52,231,722
Distributable Earnings per share of common stock, basic
and diluted $0.10 $0.09 $0.15 $0.10 |
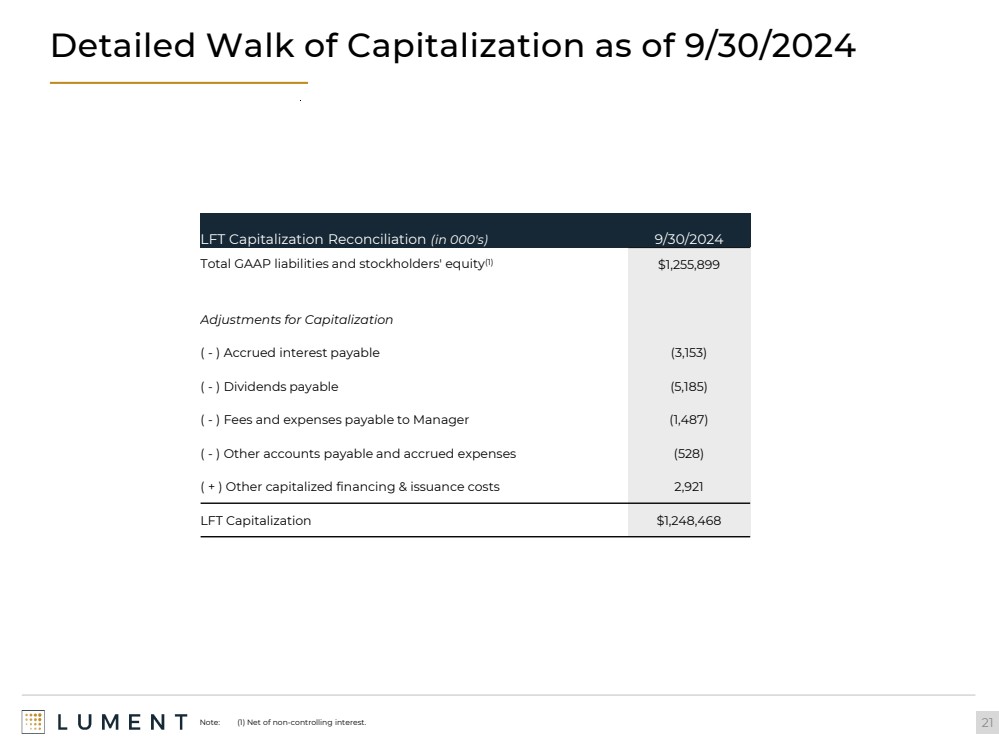
| Detailed Walk of Capitalization as of 9/30/2024
21
LFT Capitalization Reconciliation (in 000's) 9/30/2024
Total GAAP liabilities and stockholders' equity(1) $1,255,899
Adjustments for Capitalization
( - ) Accrued interest payable (3,153)
( - ) Dividends payable (5,185)
( - ) Fees and expenses payable to Manager (1,487)
( - ) Other accounts payable and accrued expenses (528)
( + ) Other capitalized financing & issuance costs 2,921
LFT Capitalization $1,248,468
Note: (1) Net of non-controlling interest. |
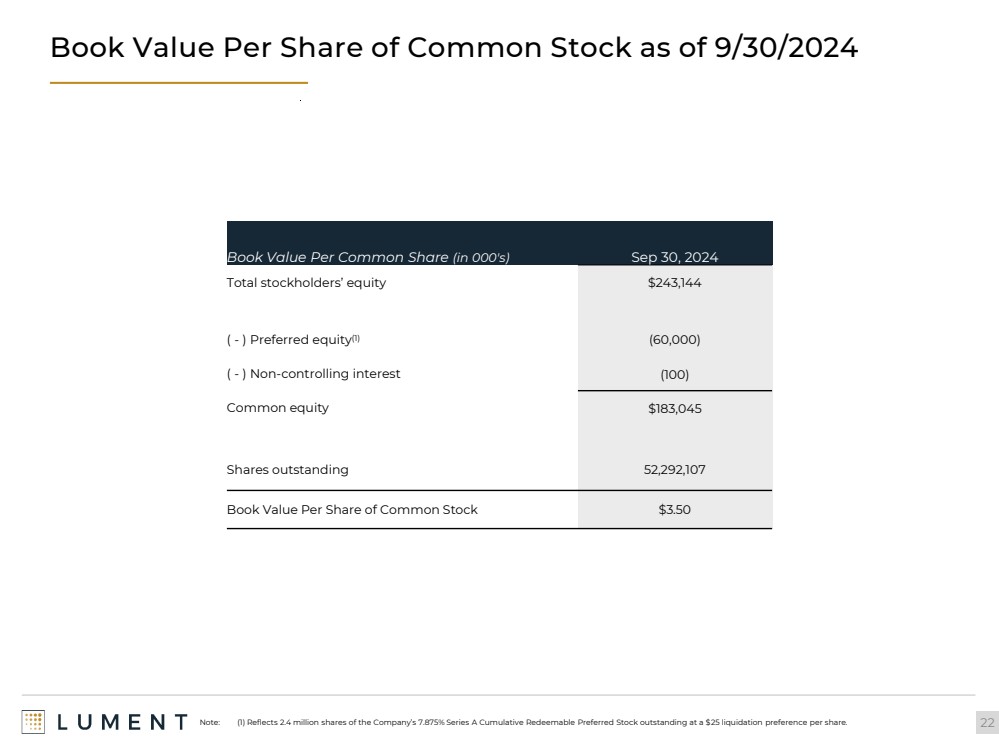
| Book Value Per Share of Common Stock as of 9/30/2024
22
Book Value Per Common Share (in 000's) Sep 30, 2024
Total stockholders’ equity $243,144
( - ) Preferred equity(1) (60,000)
( - ) Non-controlling interest (100)
Common equity $183,045
Shares outstanding 52,292,107
Book Value Per Share of Common Stock $3.50
Note: (1) Reflects 2.4 million shares of the Company’s 7.875% Series A Cumulative Redeemable Preferred Stock outstanding at a $25 liquidation preference per share. |
| Key Definitions
23
“Book Value Per Share of Common Stock” is calculated as: a) total stockholders’ equity computed in accordance with GAAP less the value of
the issued and outstanding preferred stock at its stated liquidation preference of $25.00 per share, divided by b) the weighted average
number of shares of common stock issued and outstanding during the period, basic and diluted.
“Distributable Earnings” is a non-GAAP measure, which we define as GAAP net income (loss) attributable to holders' of common stock, or,
without duplication, owners of the Company's subsidiaries, computed in accordance with GAAP, including realized losses not otherwise
included in GAAP net income (loss) and excluding (i) non-cash equity compensation, (ii) depreciation and amortization, (iii) any unrealized
gains or losses or other similar non-cash items that are included in net income for that applicable reporting period, regardless of whether
such items are included in other comprehensive income (loss) or net income (loss), and (iv) one-time events pursuant to changes in GAAP
and certain material non-cash income or expense items after discussions with the Company's board of directors and approved by a majority
of the Company's independent directors. We also add back one-time charges such as acquisition costs and one-time gains/losses on the early
extinguishment of debt and redemption of preferred stock. Distributable Earnings mirrors how we calculate Core Earnings pursuant to the
terms of our management agreement between our Manager and us, or our Management Agreement, for purposes of calculating the
incentive fee payable to our Manager. While Distributable Earnings excludes the impact of any unrealized provisions for credi t losses, any loan
losses are charged off and realized through Distributable Earnings when deemed non-recoverable. Non-recoverability is determined (i) upon
the resolution of a loan (i.e. when the loan is repaid, fully or partially, or in the case of foreclosures, when the underlying asset is sold), or (ii)
with respect to any amount due under any loan, when such amount is determined to be non-collectible.
We believe that Distributable Earnings provides meaningful information to consider in addition to our net income (loss) and cash flows from
operating activities determined in accordance with GAAP. We believe Distributable Earnings is a useful financial metric for existing and
potential future holders of our common stock as historically, over time, Distributable Earnings has been a strong indicator of our dividends
per share. As a REIT, we generally must distribute annually at least 90% of our taxable income, subject to certain adjustment s, and therefore
we believe our dividends are one of the principal reasons stockholders may invest in our common stock. Refer to Note 16 to our consolidated
financial statements for further discussion of our distribution requirements as a REIT. Furthermore, Distributable Earnings help us to evaluate
our performance excluding the effects of certain transactions and GAAP adjustments that we believe are not necessarily indica tive of our
current loan portfolio and operations and is a performance metric we consider when declaring our dividends.
Distributable Earnings does not represent net income (loss) or cash generated from operating activities and should not be considered as an
alternative to GAAP net income (loss), or an indication of GAAP cash flows from operations, a measure of our liquidity, or an indication of
funds available for our cash needs. In addition, our methodology for calculating Distributable Earnings may differ from the methodologies
employed by other companies to calculate the same or similar performance measures, and accordingly, our reported Distributable Earnings
may not be comparable to the Distributable Earnings reported by other companies. |

| November 2024 |
Cover
|
Nov. 12, 2024 |
| Document Information [Line Items] |
|
| Document Type |
8-K
|
| Amendment Flag |
false
|
| Document Period End Date |
Nov. 12, 2024
|
| Entity File Number |
001-35845
|
| Entity Registrant Name |
LUMENT FINANCE TRUST, INC.
|
| Entity Central Index Key |
0001547546
|
| Entity Tax Identification Number |
45-4966519
|
| Entity Incorporation, State or Country Code |
MD
|
| Entity Address, Address Line One |
230 Park Avenue
|
| Entity Address, Address Line Two |
20th
Floor
|
| Entity Address, City or Town |
New York
|
| Entity Address, State or Province |
NY
|
| Entity Address, Postal Zip Code |
10169
|
| City Area Code |
212
|
| Local Phone Number |
317-5700
|
| Written Communications |
false
|
| Soliciting Material |
false
|
| Pre-commencement Tender Offer |
false
|
| Pre-commencement Issuer Tender Offer |
false
|
| Entity Emerging Growth Company |
false
|
| Common Stock [Member] |
|
| Document Information [Line Items] |
|
| Title of 12(b) Security |
Common Stock, $0.01 par value per share
|
| Trading Symbol |
LFT
|
| Security Exchange Name |
NYSE
|
| Redeemable Preferred Stock [Member] |
|
| Document Information [Line Items] |
|
| Title of 12(b) Security |
7.875% Series A Cumulative Redeemable Preferred Stock, $0.01 par value per share
|
| Trading Symbol |
LFTPrA
|
| Security Exchange Name |
NYSE
|
| X |
- DefinitionBoolean flag that is true when the XBRL content amends previously-filed or accepted submission.
| Name: |
dei_AmendmentFlag |
| Namespace Prefix: |
dei_ |
| Data Type: |
xbrli:booleanItemType |
| Balance Type: |
na |
| Period Type: |
duration |
|
| X |
- DefinitionFor the EDGAR submission types of Form 8-K: the date of the report, the date of the earliest event reported; for the EDGAR submission types of Form N-1A: the filing date; for all other submission types: the end of the reporting or transition period. The format of the date is YYYY-MM-DD.
| Name: |
dei_DocumentPeriodEndDate |
| Namespace Prefix: |
dei_ |
| Data Type: |
xbrli:dateItemType |
| Balance Type: |
na |
| Period Type: |
duration |
|
| X |
- DefinitionThe type of document being provided (such as 10-K, 10-Q, 485BPOS, etc). The document type is limited to the same value as the supporting SEC submission type, or the word 'Other'.
| Name: |
dei_DocumentType |
| Namespace Prefix: |
dei_ |
| Data Type: |
dei:submissionTypeItemType |
| Balance Type: |
na |
| Period Type: |
duration |
|
| X |
- DefinitionAddress Line 1 such as Attn, Building Name, Street Name
| Name: |
dei_EntityAddressAddressLine1 |
| Namespace Prefix: |
dei_ |
| Data Type: |
xbrli:normalizedStringItemType |
| Balance Type: |
na |
| Period Type: |
duration |
|
| X |
- DefinitionAddress Line 2 such as Street or Suite number
| Name: |
dei_EntityAddressAddressLine2 |
| Namespace Prefix: |
dei_ |
| Data Type: |
xbrli:normalizedStringItemType |
| Balance Type: |
na |
| Period Type: |
duration |
|
| X |
- Definition
+ References
+ Details
| Name: |
dei_EntityAddressCityOrTown |
| Namespace Prefix: |
dei_ |
| Data Type: |
xbrli:normalizedStringItemType |
| Balance Type: |
na |
| Period Type: |
duration |
|
| X |
- DefinitionCode for the postal or zip code
| Name: |
dei_EntityAddressPostalZipCode |
| Namespace Prefix: |
dei_ |
| Data Type: |
xbrli:normalizedStringItemType |
| Balance Type: |
na |
| Period Type: |
duration |
|
| X |
- DefinitionName of the state or province.
| Name: |
dei_EntityAddressStateOrProvince |
| Namespace Prefix: |
dei_ |
| Data Type: |
dei:stateOrProvinceItemType |
| Balance Type: |
na |
| Period Type: |
duration |
|
| X |
- DefinitionA unique 10-digit SEC-issued value to identify entities that have filed disclosures with the SEC. It is commonly abbreviated as CIK. Reference 1: http://www.xbrl.org/2003/role/presentationRef
-Publisher SEC
-Name Exchange Act
-Number 240
-Section 12
-Subsection b-2
| Name: |
dei_EntityCentralIndexKey |
| Namespace Prefix: |
dei_ |
| Data Type: |
dei:centralIndexKeyItemType |
| Balance Type: |
na |
| Period Type: |
duration |
|
| X |
- DefinitionIndicate if registrant meets the emerging growth company criteria. Reference 1: http://www.xbrl.org/2003/role/presentationRef
-Publisher SEC
-Name Exchange Act
-Number 240
-Section 12
-Subsection b-2
| Name: |
dei_EntityEmergingGrowthCompany |
| Namespace Prefix: |
dei_ |
| Data Type: |
xbrli:booleanItemType |
| Balance Type: |
na |
| Period Type: |
duration |
|
| X |
- DefinitionCommission file number. The field allows up to 17 characters. The prefix may contain 1-3 digits, the sequence number may contain 1-8 digits, the optional suffix may contain 1-4 characters, and the fields are separated with a hyphen.
| Name: |
dei_EntityFileNumber |
| Namespace Prefix: |
dei_ |
| Data Type: |
dei:fileNumberItemType |
| Balance Type: |
na |
| Period Type: |
duration |
|
| X |
- DefinitionTwo-character EDGAR code representing the state or country of incorporation.
| Name: |
dei_EntityIncorporationStateCountryCode |
| Namespace Prefix: |
dei_ |
| Data Type: |
dei:edgarStateCountryItemType |
| Balance Type: |
na |
| Period Type: |
duration |
|
| X |
- DefinitionThe exact name of the entity filing the report as specified in its charter, which is required by forms filed with the SEC. Reference 1: http://www.xbrl.org/2003/role/presentationRef
-Publisher SEC
-Name Exchange Act
-Number 240
-Section 12
-Subsection b-2
| Name: |
dei_EntityRegistrantName |
| Namespace Prefix: |
dei_ |
| Data Type: |
xbrli:normalizedStringItemType |
| Balance Type: |
na |
| Period Type: |
duration |
|
| X |
- DefinitionThe Tax Identification Number (TIN), also known as an Employer Identification Number (EIN), is a unique 9-digit value assigned by the IRS. Reference 1: http://www.xbrl.org/2003/role/presentationRef
-Publisher SEC
-Name Exchange Act
-Number 240
-Section 12
-Subsection b-2
| Name: |
dei_EntityTaxIdentificationNumber |
| Namespace Prefix: |
dei_ |
| Data Type: |
dei:employerIdItemType |
| Balance Type: |
na |
| Period Type: |
duration |
|
| X |
- DefinitionLocal phone number for entity.
| Name: |
dei_LocalPhoneNumber |
| Namespace Prefix: |
dei_ |
| Data Type: |
xbrli:normalizedStringItemType |
| Balance Type: |
na |
| Period Type: |
duration |
|
| X |
- DefinitionBoolean flag that is true when the Form 8-K filing is intended to satisfy the filing obligation of the registrant as pre-commencement communications pursuant to Rule 13e-4(c) under the Exchange Act. Reference 1: http://www.xbrl.org/2003/role/presentationRef
-Publisher SEC
-Name Exchange Act
-Number 240
-Section 13e
-Subsection 4c
| Name: |
dei_PreCommencementIssuerTenderOffer |
| Namespace Prefix: |
dei_ |
| Data Type: |
xbrli:booleanItemType |
| Balance Type: |
na |
| Period Type: |
duration |
|
| X |
- DefinitionBoolean flag that is true when the Form 8-K filing is intended to satisfy the filing obligation of the registrant as pre-commencement communications pursuant to Rule 14d-2(b) under the Exchange Act. Reference 1: http://www.xbrl.org/2003/role/presentationRef
-Publisher SEC
-Name Exchange Act
-Number 240
-Section 14d
-Subsection 2b
| Name: |
dei_PreCommencementTenderOffer |
| Namespace Prefix: |
dei_ |
| Data Type: |
xbrli:booleanItemType |
| Balance Type: |
na |
| Period Type: |
duration |
|
| X |
- DefinitionTitle of a 12(b) registered security. Reference 1: http://www.xbrl.org/2003/role/presentationRef
-Publisher SEC
-Name Exchange Act
-Number 240
-Section 12
-Subsection b
| Name: |
dei_Security12bTitle |
| Namespace Prefix: |
dei_ |
| Data Type: |
dei:securityTitleItemType |
| Balance Type: |
na |
| Period Type: |
duration |
|
| X |
- DefinitionName of the Exchange on which a security is registered. Reference 1: http://www.xbrl.org/2003/role/presentationRef
-Publisher SEC
-Name Exchange Act
-Number 240
-Section 12
-Subsection d1-1
| Name: |
dei_SecurityExchangeName |
| Namespace Prefix: |
dei_ |
| Data Type: |
dei:edgarExchangeCodeItemType |
| Balance Type: |
na |
| Period Type: |
duration |
|
| X |
- DefinitionBoolean flag that is true when the Form 8-K filing is intended to satisfy the filing obligation of the registrant as soliciting material pursuant to Rule 14a-12 under the Exchange Act. Reference 1: http://www.xbrl.org/2003/role/presentationRef
-Publisher SEC
-Name Exchange Act
-Section 14a
-Number 240
-Subsection 12
| Name: |
dei_SolicitingMaterial |
| Namespace Prefix: |
dei_ |
| Data Type: |
xbrli:booleanItemType |
| Balance Type: |
na |
| Period Type: |
duration |
|
| X |
- DefinitionTrading symbol of an instrument as listed on an exchange.
| Name: |
dei_TradingSymbol |
| Namespace Prefix: |
dei_ |
| Data Type: |
dei:tradingSymbolItemType |
| Balance Type: |
na |
| Period Type: |
duration |
|
| X |
- DefinitionBoolean flag that is true when the Form 8-K filing is intended to satisfy the filing obligation of the registrant as written communications pursuant to Rule 425 under the Securities Act. Reference 1: http://www.xbrl.org/2003/role/presentationRef
-Publisher SEC
-Name Securities Act
-Number 230
-Section 425
| Name: |
dei_WrittenCommunications |
| Namespace Prefix: |
dei_ |
| Data Type: |
xbrli:booleanItemType |
| Balance Type: |
na |
| Period Type: |
duration |
|
| X |
- Details
| Name: |
us-gaap_StatementClassOfStockAxis=us-gaap_CommonStockMember |
| Namespace Prefix: |
|
| Data Type: |
na |
| Balance Type: |
|
| Period Type: |
|
|
| X |
- Details
| Name: |
us-gaap_StatementClassOfStockAxis=us-gaap_RedeemablePreferredStockMember |
| Namespace Prefix: |
|
| Data Type: |
na |
| Balance Type: |
|
| Period Type: |
|
|
Lument Finance (NYSE:LFT-A)
Graphique Historique de l'Action
De Jan 2025 à Fév 2025

Lument Finance (NYSE:LFT-A)
Graphique Historique de l'Action
De Fév 2024 à Fév 2025

