0001818383FALSE00018183832024-02-202024-02-20
UNITED STATES
SECURITIES AND EXCHANGE COMMISSION
WASHINGTON, DC 20549
_____________________________
FORM 8-K
_____________________________
CURRENT REPORT
PURSUANT TO SECTION 13 OR 15(d) OF THE SECURITIES EXCHANGE ACT OF 1934
Date of Report (Date of earliest event reported): February 20, 2024
_____________________________
MediaAlpha, Inc.
(Exact Name of Registrant as Specified in Its Charter)
_____________________________
| | | | | | | | |
| Delaware | 001-39671 | 85-1854133 |
(State or other jurisdiction of incorporation) | (Commission File Number) | (IRS Employer Identification No.) |
| | | | | |
700 South Flower Street, Suite 640 Los Angeles, California | 90017 |
| (Address of Principal Executive Offices) | (Zip Code) |
(213) 316-6256
(Registrant’s telephone number, including area code)
(Not Applicable)
(Former name or former address, if changed since last report)
| | | | | |
| Check the appropriate box below if the Form 8-K filing is intended to simultaneously satisfy the filing obligation of the registrant under any of the following provisions (see General Instruction A.2. below): |
| |
| o | Written communications pursuant to Rule 425 under the Securities Act (17 CFR 230.425) |
| |
| o | Soliciting material pursuant to Rule 14a-12 under the Exchange Act (17 CFR 240.14a-12) |
| |
| o | Pre-commencement communications pursuant to Rule 14d-2(b) under the Exchange Act (17 CFR 240.14d-2(b)) |
| |
| o | Pre-commencement communications pursuant to Rule 13e-4(c) under the Exchange Act (17 CFR 240.13e-4(c)) |
Securities registered pursuant to Section 12(b) of the Act:
| | | | | | | | | | | | | | |
| Title of each class | | Trading Symbol(s) | | Name of each exchange on which registered |
| Class A common stock, $0.01 par value | | MAX | | New York Stock Exchange |
| | | | | |
| Indicate by check mark whether the registrant is an emerging growth company as defined in Rule 405 of the Securities Act of 1933 (§230.405 of this chapter) or Rule 12b-2 of the Securities Exchange Act of 1934 (§240.12b-2 of this chapter). Emerging growth company o If an emerging growth company, indicate by check mark if the registrant has elected not to use the extended transition period for complying with any new or revised financial accounting standards provided pursuant to Section 13(a) of the Exchange Act. o |
ITEM 2.02 – Results of Operations and Financial Condition.
On February 20, 2024, MediaAlpha, Inc. (“MediaAlpha”) issued a press release and an accompanying shareholder letter announcing its financial results as of and for the fourth quarter and full year ended December 31, 2023, and its financial outlook for the first quarter of 2024. Copies of the press release and shareholder letter are furnished as Exhibit 99.1 and Exhibit 99.2, respectively, to this Form 8-K and are incorporated by reference herein.
This information shall not be deemed “filed” for purposes of Section 18 of the Securities Exchange Act of 1934, as amended (the “Exchange Act”), or incorporated by reference in any filing under the Securities Act of 1933, as amended, or the Exchange Act, except as shall be expressly set forth by specific reference in such a filing.
MediaAlpha refers to non-GAAP financial information in the press release and shareholder letter. A reconciliation of these non-GAAP financial measures to the comparable GAAP financial measures is contained in each document.
ITEM 9.01 – Financial Statements and Exhibits.
(d) Exhibits
| | | | | |
Exhibit No. | Description |
99.1 | |
99.2 | |
| 104 | Cover Page Interactive Data File (embedded within the Inline XBRL document). |
SIGNATURES
Pursuant to the requirements of the Securities Exchange Act of 1934, the registrant has duly caused this report to be signed on its behalf by the undersigned hereunto duly authorized.
| | | | | | | | | | | |
| MediaAlpha, Inc. |
| | |
| Date: February 20, 2024 | By: | /s/ Jeffrey B. Coyne |
| | Name: | Jeffrey B. Coyne |
| | Title: | General Counsel & Secretary |
MEDIAALPHA ANNOUNCES FOURTH QUARTER AND FULL YEAR 2023
FINANCIAL RESULTS
•Fourth quarter revenue of $117 million, down 6% year over year; Full year revenue of $388 million, down 15% year over year
•Fourth quarter Transaction Value of $165 million, down 2% year over year; Full year Transaction Value of $593 million, down 20% year over year
•Fourth quarter Transaction Value from Property & Casualty down 4% year over year to $54 million; Full year Transaction Value from Property & Casualty down 31% year over year to $278 million
•Fourth quarter Transaction Value from Health flat year over year at $98 million; Full year Transaction Value from Health up 3% year over year to $260 million
Los Angeles, CA (February 20, 2024) – MediaAlpha, Inc. (NYSE: MAX), today announced its financial results for the fourth quarter and full year ended December 31, 2023.
“Our fourth quarter results exceeded expectations, driven primarily by improving conditions in our Property & Casualty (P&C) insurance vertical,” said MediaAlpha co-founder and CEO Steve Yi. “While our P&C vertical has been challenged by difficult market conditions for the past several years, we are seeing the market turn and expect first quarter Transaction Value to nearly double sequentially. We believe our growth will accelerate as more auto insurance carriers restore profitability and increase their marketing investments, driving strong results for MediaAlpha this year and beyond.”
Fourth Quarter 2023 Financial Results
•Revenue of $117.2 million, a decrease of 6% year over year;
•Transaction Value of $165.3 million, a decrease of 2% year over year;
•Gross margin of 19.0%, compared with 16.2% in the fourth quarter of 2022;
•Contribution Margin(1) of 21.4%, compared with 18.5% in the fourth quarter of 2022;
•Net loss of $(3.3) million, compared with $(28.4) million in the fourth quarter of 2022; and
•Adjusted EBITDA(1) of 12.7 million, compared with 9.0 million in the fourth quarter of 2022.
Full Year 2023 Financial Results
•Revenue of $388.1 million, a decrease of 15% year over year;
•Transaction Value of $593.4 million, a decrease of 20% year over year;
•Gross margin of 17.2%, compared with 15.3% in 2022;
•Contribution Margin(1) of 20.1%, compared with 17.6% in 2022;
•Net loss of $(56.6) million, compared with $(72.4) million in 2022; and
•Adjusted EBITDA(1) of $27.1 million, compared with $22.9 million in 2022.
(1)A reconciliation of GAAP to Non-GAAP financial measures has been provided at the end of this press release. An explanation of these measures is also included below under the heading “Non-GAAP Financial Measures.”
Financial Outlook
Our guidance for Q1 2024 reflects an improvement in market conditions in our P&C insurance vertical compared with Q4 2023. In our Health vertical, we expect mid- to high-single digit year-over-year growth in Transaction Value. In our Life and Other verticals, we expect Transaction Value to be slightly down year over year. Due to the uncertainty around the timing and slope of the P&C market recovery, we are not providing full year 2024 guidance.
For the first quarter of 2024, MediaAlpha currently expects the following:
•Transaction Value between $175 million - $190 million, representing a 6% year-over-year decline at the midpoint of the guidance range. We expect P&C Transaction Value to nearly double in Q1 2024 compared with Q4 2023, driven by both an accelerating recovery in carrier marketing spending and normal seasonality;
•Revenue between $105 million - $115 million, representing a 1% year-over-year decline at the midpoint of the guidance range;
•Adjusted EBITDA between $9.5 million - $11.5 million, representing a 45% year-over-year increase at the midpoint of the guidance range. We expect Adjusted EBITDA to grow at a greater rate than Transaction Value, Revenue and Contribution in Q1 2024 due to our primarily fixed operating expense profile. We expect Contribution less Adjusted EBITDA in Q1 2024 to be approximately $0.5 - $1.0 million higher than Q4 2023.
With respect to the Company’s projections of Adjusted EBITDA and Contribution under “Financial Outlook,” MediaAlpha is not providing a reconciliation of Adjusted EBITDA to net income (loss), or of Contribution to gross profit, because the Company is unable to predict with reasonable certainty the reconciling items that may affect the corresponding GAAP measures without unreasonable effort. These reconciling items are uncertain, depend on various factors and could significantly impact, either individually or in the aggregate, the corresponding GAAP measures for the applicable period.
For a detailed explanation of the Company’s non-GAAP measures, please refer to the appendix section of this press release.
Conference Call Information
MediaAlpha will host a Q&A conference call today to discuss the Company's fourth quarter and full year 2023 results and its financial outlook for the first quarter of 2024 at 2:00 p.m. Pacific Time (5:00 p.m. Eastern Time). A live audio webcast of the call will be available on the MediaAlpha Investor Relations website at https://investors.mediaalpha.com. To register for the webcast, click here. Participants may also dial-in, toll-free, at (888) 330-2022 or (646) 960-0690, with passcode 3195092. An audio replay of the conference call will be available following the call and available on the MediaAlpha Investor Relations website at https://investors.mediaalpha.com.
We have also posted to our investor relations website a letter to shareholders. We have used, and intend to continue to use, our investor relations website at https://investors.mediaalpha.com as a means of disclosing material nonpublic information and for complying with our disclosure obligations under Regulation FD.
Forward-Looking Statements
This press release contains forward-looking statements within the meaning of the Private Securities Litigation Reform Act of 1995, including without limitation statements regarding our expectation that Transaction Value in our P&C vertical will nearly double in the first quarter on a sequential basis; our expectation that our growth will accelerate as more auto insurance carriers restore profitability and increase their marketing investments; and our financial outlook for the first quarter of 2024. These forward-looking statements reflect our current views with respect to, among other things, future events and our financial performance. These statements are often, but not always, made through the use of words or phrases such as “may,” “should,” “could,” “predict,” “potential,” “believe,” “will likely result,” “expect,” “continue,” “will,” “anticipate,” “seek,” “estimate,” “intend,” “plan,” “projection,” “would,” and “outlook,” or the negative version of those words or other comparable words or phrases of a future or forward-looking nature. These forward-looking statements are not historical facts, and are based on current expectations, estimates and projections about our industry, management’s beliefs and certain assumptions made by management, many of which, by their nature, are inherently uncertain and beyond our control. Accordingly, we caution you that any such forward-looking statements are not guarantees of future performance and are subject to risks, assumptions and uncertainties that are difficult to predict. Although we believe that the expectations reflected in these forward-looking statements are reasonable as of the date made, actual results may prove to be materially different from the results expressed or implied by the forward-looking statements.
There are or will be important factors that could cause our actual results to differ materially from those indicated in these forward-looking statements, including those more fully described in MediaAlpha’s filings with the Securities and Exchange Commission (“SEC”), including the Form 10-K as of and for the year ended December 31, 2023 to be filed on or about February 22, 2024. These factors should not be construed as exhaustive. MediaAlpha disclaims any obligation to update any forward-looking statements to reflect events or circumstances that occur after the date of this press release.
Non-GAAP Financial Measures and Operating Metrics
This press release includes Adjusted EBITDA and Contribution Margin, which are non-GAAP financial measures. The Company also presents Transaction Value, which is an operating metric not presented in accordance with GAAP. See the appendix for definitions of Adjusted EBITDA, Contribution, Contribution Margin and Transaction Value, as well as reconciliations to the corresponding GAAP financial metrics, as applicable.
We present Transaction Value, Adjusted EBITDA and Contribution Margin because they are used extensively by our management and board of directors to manage our operating performance, including evaluating our operational performance against budget and assessing our overall operating efficiency and operating leverage. Accordingly, we believe that Transaction Value, Adjusted EBITDA and Contribution Margin provide useful information to investors and others in understanding and evaluating our operating results in the same manner as our management team and board of directors. Each of Transaction Value, Adjusted EBITDA and Contribution Margin has limitations as a financial measure and investors should not consider it in isolation or as a substitute for analysis of our results as reported under GAAP.
Contacts:
Investors
Denise Garcia
Hayflower Partners
Denise@HayflowerPartners.com
MediaAlpha, Inc. and subsidiaries
Consolidated Balance Sheets
(In thousands, except share data and per share amounts)
| | | | | | | | | | | |
| As of December 31, |
| 2023 (unaudited) | | 2022 |
| Assets | | | |
| Current assets | | | |
| Cash and cash equivalents | $ | 17,271 | | | $ | 14,542 | |
| Accounts receivable, net of allowance for credit losses of $537 and $575, respectively | 53,773 | | | 59,998 | |
| Prepaid expenses and other current assets | 3,529 | | | 5,880 | |
| Total current assets | $ | 74,573 | | | $ | 80,420 | |
| Intangible assets, net | 26,015 | | | 32,932 | |
| Goodwill | 47,739 | | | 47,739 | |
| | | |
| Other assets | 5,598 | | | 8,990 | |
| Total assets | $ | 153,925 | | | $ | 170,081 | |
| Liabilities and stockholders' deficit | | | |
| Current liabilities | | | |
| Accounts payable | 56,279 | | | 53,992 | |
| Accrued expenses | 11,588 | | | 14,130 | |
| Current portion of long-term debt | 11,854 | | | 8,770 | |
| Total current liabilities | $ | 79,721 | | | $ | 76,892 | |
| Long-term debt, net of current portion | 162,445 | | | 174,300 | |
| | | |
| Other long-term liabilities | 6,184 | | | 4,973 | |
| Total liabilities | $ | 248,350 | | | $ | 256,165 | |
| Commitments and contingencies (Note 8) | | | |
| Stockholders' (deficit): | | | |
| Class A common stock, $0.01 par value - 1.0 billion shares authorized; 47.4 million and 43.7 million shares issued and outstanding as of December 31, 2023 and December 31, 2022, respectively | 474 | | | 437 | |
| Class B common stock, $0.01 par value - 100 million shares authorized; 18.1 million and 18.9 million shares issued and outstanding as of December 31, 2023 and December 31, 2022, respectively | 181 | | | 189 | |
| Preferred stock, $0.01 par value - 50 million shares authorized; 0 shares issued and outstanding as of December 31, 2023 and December 31, 2022 | — | | | — | |
| Additional paid-in capital | 511,613 | | | 465,523 | |
| Accumulated deficit | (522,562) | | | (482,142) | |
| Total stockholders' (deficit) attributable to MediaAlpha, Inc. | $ | (10,294) | | | $ | (15,993) | |
| Non-controlling interests | (84,131) | | | (70,091) | |
| Total stockholders' (deficit) | $ | (94,425) | | | $ | (86,084) | |
| Total liabilities and stockholders' deficit | $ | 153,925 | | | $ | 170,081 | |
MediaAlpha, Inc. and subsidiaries
Consolidated Statements of Operations
(In thousands, except share data and per share amounts)
| | | | | | | | | | | | | |
| Year ended December 31, |
| 2023 (unaudited) | | 2022 | | |
| Revenue | $ | 388,149 | | | $ | 459,072 | | | |
| Costs and operating expenses | | | | | |
| Cost of revenue | 321,437 | | | 389,013 | | | |
| Sales and marketing | 25,432 | | | 28,816 | | | |
| Product development | 18,458 | | | 21,077 | | | |
| General and administrative | 62,746 | | | 55,556 | | | |
| Total costs and operating expenses | 428,073 | | | 494,462 | | | |
(Loss) from operations | (39,924) | | | (35,390) | | | |
| Other expense (income), net | 1,779 | | | (75,094) | | | |
| Interest expense | 15,315 | | | 9,245 | | | |
| Total other expense (income), net | 17,094 | | | (65,849) | | | |
| (Loss) income before income taxes | (57,018) | | | 30,459 | | | |
| Income tax (benefit) expense | (463) | | | 102,905 | | | |
| Net (loss) | $ | (56,555) | | | $ | (72,446) | | | |
| | | | | |
| Net (loss) attributable to non-controlling interest | (16,135) | | | (14,780) | | | |
| Net (loss) attributable to MediaAlpha, Inc. | $ | (40,420) | | | $ | (57,666) | | | |
| Net (loss) per share of Class A common stock | | | | | |
| -Basic and diluted | $ | (0.89) | | | $ | (1.37) | | | |
| | | | | |
| Weighted average shares of Class A common stock outstanding | | | | | |
| -Basic and diluted | 45,573,416 | | | 41,944,874 | | | |
| | | | | |
MediaAlpha, Inc. and subsidiaries
Consolidated Statements of Operations
(In thousands, except share data and per share amounts)
| | | | | | | | | | | |
| Three months ended December 31, |
| 2023 (unaudited) | | 2022 (unaudited) |
| Revenue | $ | 117,174 | | | $ | 124,007 | |
| Costs and operating expenses | | | |
| Cost of revenue | 94,892 | | | 103,864 | |
| Sales and marketing | 5,630 | | | 6,782 | |
| Product development | 3,933 | | | 4,909 | |
| General and administrative | 12,273 | | | 14,987 | |
| Total costs and operating expenses | 116,728 | | | 130,542 | |
Income (loss) from operations | 446 | | | (6,535) | |
| Other expense (income), net | 614 | | | (83,217) | |
| Interest expense | 3,918 | | | 3,337 | |
| Total other expense (income), net | 4,532 | | | (79,880) | |
| (Loss) income before income taxes | (4,086) | | | 73,345 | |
| Income tax (benefit) expense | (793) | | | 101,695 | |
| Net (loss) | $ | (3,293) | | | $ | (28,350) | |
| | | |
| Net (loss) attributable to non-controlling interest | (927) | | | (1,385) | |
| Net (loss) attributable to MediaAlpha, Inc. | $ | (2,366) | | | $ | (26,965) | |
| Net (loss) per share of Class A common stock | | | |
| -Basic and diluted | $ | (0.05) | | | $ | (0.63) | |
| | | |
| Weighted average shares of Class A common stock outstanding | | | |
| -Basic and diluted | 46,991,824 | | | 42,989,666 | |
| | | |
MediaAlpha, Inc. and subsidiaries
Consolidated Statements of Cash Flows
(In thousands)
| | | | | | | | | | | | | |
| Year ended December 31, |
| 2023 (unaudited) | | 2022 | | |
| Cash Flows from operating activities | | | | | |
| Net (loss) | $ | (56,555) | | | $ | (72,446) | | | |
| Adjustments to reconcile net (loss) to net cash provided by operating activities: | | | | | |
| Equity-based compensation expense | 53,321 | | | 58,472 | | | |
| Non-cash lease expense | 695 | | | 753 | | | |
| Depreciation expense on property and equipment | 353 | | | 392 | | | |
| Amortization of intangible assets | 6,917 | | | 5,755 | | | |
| Amortization of deferred debt issuance costs | 793 | | | 832 | | | |
| Change in fair value of contingent consideration | — | | | (7,007) | | | |
| Impairment of cost method investment | 1,406 | | | 8,594 | | | |
| | | | | |
| Credit losses | 5 | | | 136 | | | |
| Deferred taxes | — | | | 102,656 | | | |
| Tax receivables agreement liability related adjustments | 6 | | | (83,832) | | | |
| Changes in operating assets and liabilities: | | | | | |
| Accounts receivable | 6,220 | | | 17,335 | | | |
| Prepaid expenses and other current assets | 2,287 | | | 4,507 | | | |
| Other assets | 500 | | | 417 | | | |
| Accounts payable | 2,287 | | | (7,796) | | | |
| Accrued expenses | 1,996 | | | (494) | | | |
| Net cash provided by operating activities | $ | 20,231 | | | $ | 28,274 | | | |
| Cash flows from investing activities | | | | | |
| Purchases of property and equipment | (73) | | | (98) | | | |
| Cash consideration paid in connection with CHT acquisition | — | | | (49,677) | | | |
| | | | | |
| | | | | |
| Net cash (used in) investing activities | $ | (73) | | | $ | (49,775) | | | |
| Cash flows from financing activities | | | | | |
| Proceeds received from: | | | | | |
| | | | | |
| | | | | |
| Revolving line of credit | — | | | 25,000 | | | |
| | | | | |
| Payments made for: | | | | | |
| Repayments on revolving line of credit | — | | | (20,000) | | | |
| Repayments on long-term debt | (9,500) | | | (9,500) | | | |
| | | | | |
| | | | | |
| | | | | |
| Payments pursuant to tax receivable agreement | (2,822) | | | (216) | | | |
| Shares withheld for taxes on vesting of restricted stock units | (3,721) | | | (4,023) | | | |
| Repurchases of Class A common stock | — | | | (5,008) | | | |
| | | | | |
| Contributions from QLH’s members | 1,464 | | | 1,360 | | | |
| Distributions | (2,850) | | | (2,134) | | | |
| Net cash (used in) financing activities | $ | (17,429) | | | $ | (14,521) | | | |
| Net increase (decrease) in cash and cash equivalents | 2,729 | | | (36,022) | | | |
| Cash and cash equivalents, beginning of period | 14,542 | | | 50,564 | | | |
| Cash and cash equivalents, end of period | $ | 17,271 | | | $ | 14,542 | | | |
Key business and operating metrics and Non-GAAP financial measures
Transaction Value
We define “Transaction Value” as the total gross dollars transacted by our partners on our platform. Transaction Value is an operating metric not presented in accordance with GAAP, and is a driver of revenue based on the economic relationships we have with our partners. Our partners use our platform to transact via Open and Private Marketplace transactions. In our Open Marketplace model, Transaction Value is equal to revenue recognized and revenue share payments to our supply partners represent costs of revenue. In our Private Marketplace model, revenue recognized represents a platform fee billed to the demand partner or supply partner based on an agreed-upon percentage of the Transaction Value for the Consumer Referrals transacted, and accordingly there are no associated costs of revenue. We utilize Transaction Value to assess revenue and to assess the overall level of transaction activity through our platform. We believe it is useful to investors to assess the overall level of activity on our platform and to better understand the sources of our revenue across our different transaction models and verticals.
The following table presents Transaction Value by platform model for the three months and full years ended December 31, 2023 and 2022:
| | | | | | | | | | | | | | | | | | | | | | | | | | |
| | Three months ended
December 31, | | Full year ended December 31, |
| (dollars in thousands) | | 2023 | | 2022 | | 2023 | | 2022 |
| Open Marketplace transactions | | $ | 115,162 | | | $ | 121,942 | | | $ | 378,730 | | | $ | 445,950 | |
| Percentage of total Transaction Value | | 69.6 | % | | 72.2 | % | | 63.8 | % | | 60.5 | % |
| Private Marketplace transactions | | 50,184 | | | 46,972 | | | 214,708 | | | 291,564 | |
| Percentage of total Transaction Value | | 30.4 | % | | 27.8 | % | | 36.2 | % | | 39.5 | % |
| Total Transaction Value | | $ | 165,346 | | | $ | 168,914 | | | $ | 593,438 | | | $ | 737,514 | |
The following table presents Transaction Value by vertical for the three months and full years ended December 31, 2023 and 2022:
| | | | | | | | | | | | | | | | | | | | | | | | | | |
| | Three months ended
December 31, | | Full year ended December 31, |
| (dollars in thousands) | | 2023 | | 2022 | | 2023 | | 2022 |
| Property & Casualty insurance | | $ | 54,247 | | | $ | 56,682 | | | $ | 277,552 | | | $ | 399,861 | |
| Percentage of total Transaction Value | | 32.8 | % | | 33.6 | % | | 46.8 | % | | 54.2 | % |
| Health insurance | | 98,372 | | | 98,561 | | | 259,822 | | | 251,400 | |
| Percentage of total Transaction Value | | 59.5 | % | | 58.3 | % | | 43.8 | % | | 34.1 | % |
| Life insurance | | 8,015 | | | 8,181 | | | 34,057 | | | 44,619 | |
| Percentage of total Transaction Value | | 4.8 | % | | 4.8 | % | | 5.7 | % | | 6.0 | % |
Other(1) | | 4,712 | | | 5,490 | | | 22,007 | | | 41,634 | |
| Percentage of total Transaction Value | | 2.9 | % | | 3.3 | % | | 3.7 | % | | 5.6 | % |
| Total Transaction Value | | $ | 165,346 | | | $ | 168,914 | | | $ | 593,438 | | | $ | 737,514 | |
(1)Our other verticals include Travel, Education and Consumer Finance.
Contribution and Contribution Margin
We define “Contribution” as revenue less revenue share payments and online advertising costs, or, as reported in our consolidated statements of operations, revenue less cost of revenue (i.e., gross profit), as adjusted to exclude the following items from cost of revenue: equity-based compensation; salaries, wages, and related costs; internet and hosting costs; amortization; depreciation; other services; and merchant-related fees. We define “Contribution Margin” as Contribution expressed as a percentage of revenue for the same period. Contribution and Contribution Margin are non-GAAP financial measures that we present to supplement the financial information we present on a GAAP basis. We use Contribution and Contribution Margin to measure the return on our relationships with our supply partners (excluding certain fixed costs), the financial return on and efficacy of our online advertising costs to drive consumers to our proprietary websites, and our operating leverage. We do not use Contribution and Contribution Margin as measures of overall profitability. We present Contribution and Contribution Margin because they are used by our management and board of directors to manage our operating performance, including evaluating our operational performance against budget and assessing our overall operating efficiency and operating leverage. For example, if Contribution increases and our headcount costs and other operating expenses remain steady, our Adjusted EBITDA and operating leverage increase. If Contribution Margin decreases, we may choose to re-evaluate and re-negotiate our revenue share agreements with our supply partners, to make optimization and pricing changes with respect to our bids for keywords from primary traffic acquisition sources, or to change our overall cost structure with respect to headcount, fixed costs and other costs. Other companies may calculate Contribution and Contribution Margin differently than we do. Contribution and Contribution Margin have their limitations as analytical tools, and you should not consider them in isolation or as substitutes for analysis of our results presented in accordance with GAAP.
The following table reconciles Contribution with gross profit, the most directly comparable financial measure calculated and presented in accordance with GAAP, for the three months and full years ended December 31, 2023 and 2022:
| | | | | | | | | | | | | | | | | | | | | | | | | | |
| | Three months ended
December 31, | | Full year ended December 31, |
| (in thousands) | | 2023 | | 2022 | | 2023 | | 2022 |
| Revenue | | $ | 117,174 | | | $ | 124,007 | | | $ | 388,149 | | | $ | 459,072 | |
| Less cost of revenue | | (94,892) | | | (103,864) | | | (321,437) | | | (389,013) | |
| Gross profit | | 22,282 | | | 20,143 | | | 66,712 | | | 70,059 | |
| Adjusted to exclude the following (as related to cost of revenue): | | | | | | | | |
| Equity-based compensation | | 916 | | | 997 | | | 3,875 | | | 3,634 | |
| Salaries, wages, and related | | 850 | | | 877 | | | 3,682 | | | 3,556 | |
| Internet and hosting | | 161 | | | 147 | | | 579 | | | 496 | |
| Depreciation | | 8 | | | 11 | | | 38 | | | 41 | |
| Other expenses | | 179 | | | 189 | | | 692 | | | 720 | |
| Other services | | 696 | | | 573 | | | 2,491 | | | 2,171 | |
| Merchant-related fees | | 18 | | | 10 | | | 32 | | | 109 | |
| Contribution | | 25,110 | | | 22,947 | | | 78,101 | | | 80,786 | |
| Gross Margin | | 19.0 | % | | 16.2 | % | | 17.2 | % | | 15.3 | % |
| Contribution Margin | | 21.4 | % | | 18.5 | % | | 20.1 | % | | 17.6 | % |
| | | | | | | | |
Adjusted EBITDA
We define “Adjusted EBITDA” as net income excluding interest expense, income tax benefit (expense), depreciation expense on property and equipment, amortization of intangible assets, as well as equity-based compensation expense and certain other adjustments as listed in the table below. Adjusted EBITDA is a non-GAAP financial measure that we present to supplement the financial information we present on a GAAP basis. We monitor and present Adjusted EBITDA because it is a key measure used by our management to understand and evaluate our operating performance, to establish budgets and to develop operational goals for managing our business. We believe that Adjusted EBITDA helps identify underlying trends in our business that could otherwise be masked by the effect of the expenses that we exclude in the calculations of Adjusted EBITDA. Accordingly, we believe that Adjusted EBITDA provides useful information to investors and others in understanding and evaluating our operating results, enhancing the overall understanding of our past performance and future prospects. In addition, presenting Adjusted EBITDA provides investors with a metric to evaluate the capital efficiency of our business.
Adjusted EBITDA is not presented in accordance with GAAP and should not be considered in isolation of, or as an alternative to, measures presented in accordance with GAAP. There are a number of limitations related to the use of Adjusted EBITDA rather than net income, which is the most directly comparable financial measure calculated and presented in accordance with GAAP. These limitations include the fact that Adjusted EBITDA excludes interest expense on debt, income tax benefit (expense), equity-based compensation expense, depreciation and amortization, and certain other adjustments that we consider to be useful to investors and others in understanding and evaluating our operating results. In addition, other companies may use other measures to evaluate their performance, including different definitions of “Adjusted EBITDA,” which could reduce the usefulness of our Adjusted EBITDA as a tool for comparison.
The following table reconciles Adjusted EBITDA with net (loss), the most directly comparable financial measure calculated and presented in accordance with GAAP, for the three months and full years ended December 31, 2023 and 2022.
| | | | | | | | | | | | | | | | | | | | | | | | | | |
| | Three months ended
December 31, | | Full year ended December 31, |
| (in thousands) | | 2023 | | 2022 | | 2023 | | 2022 |
| Net (loss) | | $ | (3,293) | | | $ | (28,350) | | | $ | (56,555) | | | $ | (72,446) | |
| Equity-based compensation expense | | 9,378 | | | 14,256 | | | 53,321 | | | 58,472 | |
| Interest expense | | 3,918 | | | 3,337 | | | 15,315 | | | 9,245 | |
Income tax (benefit) expense (1) | | (793) | | | 101,695 | | | (463) | | | 102,905 | |
| Depreciation expense on property and equipment | | 78 | | | 97 | | | 353 | | | 392 | |
| Amortization of intangible assets | | 1,729 | | | 1,691 | | | 6,917 | | | 5,755 | |
Transaction expenses(2) | | 88 | | | — | | | 641 | | | 636 | |
| | | | | | | | |
SOX implementation costs(3) | | — | | | — | | | — | | | 110 | |
Fair value adjustment to contingent consideration(4) | | — | | | (416) | | | — | | | (7,007) | |
| Impairment of cost method investment | | — | | | — | | | 1,406 | | | 8,594 | |
| | | | | | | | |
Changes in TRA related liability(5) | | — | | | (83,255) | | | 6 | | | (83,832) | |
Changes in Tax Indemnification Receivable(6) | | 687 | | | (14) | | | 639 | | | (58) | |
| | | | | | | | |
| | | | | | | | |
Settlement of federal and state income tax refunds(7) | | 2 | | | — | | | 5 | | | 92 | |
Legal expenses(8) | | 885 | | | — | | | 4,303 | | | — | |
Reduction in force costs (9) | | — | | | — | | | 1,233 | | | — | |
| Adjusted EBITDA | | $ | 12,679 | | | $ | 9,041 | | | $ | 27,121 | | | $ | 22,858 | |
(1)Income tax (benefit) expense for the three months and year ended December 31, 2022, consists primarily of $86.4 million and $84.5 million, respectively, of tax expense related to recording a valuation allowance on our deferred tax assets as we determined that the negative evidence outweighs the positive evidence and so it is more likely than not that our deferred tax assets will not be utilized.
(2)Transaction expenses for the three months and year ended December 31, 2023 consist of $0.1 million and $0.6 million, respectively, of legal and accounting fees incurred by us in connection with the amendment to the 2021 Credit Facilities, the tender offer filed by the Company's largest shareholder in May 2023, and a resale registration statement filed with the SEC. Transaction expenses for the year ended December 31, 2022 consist of $0.6 million of legal, accounting and other consulting fees incurred by us in connection with our acquisition of CHT.
(3)SOX implementation costs consist of $0.1 million of expenses incurred by us for the year ended December 31, 2022 for third-party consultants to assist us with the development, implementation, and documentation of new and enhanced internal controls and processes for compliance with SOX Section 404(b).
(4)Fair value adjustment to contingent consideration for the three months and year ended December 31, 2022 consists of $0.4 million and $7.0 million, respectively, of gain in connection with the remeasurement of the contingent consideration for the acquisition of CHT as of December 31, 2022.
(5)Changes in TRA related liability for the year ended December 31, 2023 consist of immaterial expense. Changes in TRA related liability for the three months and year ended December 31, 2022 consist of $83.3 million of gain on reduction of liability pursuant to the TRA resulting from remeasuring of the non-current portion of liability to zero as we no longer consider the payments under the agreement to be probable.
(6)Changes in Tax Indemnification Receivable consists of $0.7 million and $0.6 million of expense incurred by us for the three months and year ended December 31, 2023, respectively, and immaterial income and $0.1 million of income incurred by us for the three months and year ended December 31, 2022, respectively, related to changes in the tax indemnification receivable recorded in connection with the Reorganization Transactions. The change also resulted in an expense/benefit of the same amount, which has been recorded within income tax (benefit) expense for the same periods.
(7)Settlement of federal and state tax refunds consist of immaterial expense incurred by us for the three months and year ended December 31, 2023, and $0.1 million of expenses incurred by us for the year ended December 31, 2022, related to reimbursement to White Mountains for federal and state tax refunds for the period prior to the Reorganization Transactions related to 2020 federal and state tax returns. The settlement also resulted in a benefit of the same amount, which has been recorded within income tax (benefit) expense for the same periods.
(8)Legal expenses of $0.9 million and $4.3 million for the three months and year ended December 31, 2023, respectively, consist of legal fees incurred in connection with the civil investigative demand received from the Federal Trade Commission (FTC) in February 2023 and costs associated with a legal settlement unrelated to our core operations.
(9)Reduction in force costs for the year ended December 31, 2023 consist of $1.2 million of severance benefits provided to the terminated employees in connection with the RIF Plan. Additionally, equity-based compensation expense includes $0.3 million of charges related to the RIF Plan for the year ended December 31, 2023.
| | | | | |
| |
|
|
SHAREHOLDER LETTER Q4 & FULL YEAR 2023 |
|
| |
| |
| | | | | | | | | | | | | | | | | | | | | | | |
| Q4 | | | Year Ended | |
| (in millions, except percentages) | 2023 | 2022 | YoY Change | | 2023 | 2022 | YoY Change |
| | | | | | | |
| Revenue | $117.2 | $124.0 | (6)% | | $388.1 | $459.1 | (15)% |
Transaction Value 1 | $165.3 | $168.9 | (2)% | | $593.4 | $737.5 | (20)% |
| | | | | | | | |
| | | | | | | | |
| Gross Profit | $22.3 | $20.1 | 11% | | $66.7 | $70.1 | (5)% |
Contribution 1 | $25.1 | $22.9 | 9% | | $78.1 | $80.8 | (3)% |
| | | | | | | |
| | | | | | | | |
| Net (Loss) | $(3.3) | $(28.4) | 88% | | $(56.6) | $(72.4) | 22% |
Adjusted EBITDA 1 | $12.7 | $9.0 | 40% | | $27.1 | $22.9 | 19% |
__________________1.See “Key Business and Operating Metrics and Non-GAAP Financial Measures” for additional information regarding non-GAAP metrics used in this shareholder letter.
Our fourth quarter 2023 results exceeded our expectations across all metrics, driven primarily by better than expected top-line performance in our Property & Casualty (P&C) insurance vertical as a major carrier made meaningful increases to their marketing investments at the end of the quarter. These positive trends contributed to a 21% quarter-over-quarter increase in P&C Transaction Value, defying normal seasonality. While our top-line was down slightly year over year, Adjusted EBITDA increased year over year by $3.6 million, or 40%, reflecting higher Contribution and continued expense discipline.
The past several years have been unprecedented for the auto insurance industry. During this period, auto insurance carriers struggled to keep up with claims cost inflation and slashed advertising spend to minimize losses. In the second half of 2023, we saw P&C insurance industry profitability begin to steadily improve from these historically low levels as rate increases began to outpace loss cost inflation. We expect this improvement to continue in 2024, which should result in significant increases in advertising spend as carriers turn their focus to acquiring new customers.
In our P&C vertical, we are encouraged by increased carrier activity in the first quarter following the annual reset of carrier marketing budgets in January. Accordingly, our first quarter guidance reflects P&C Transaction Value nearly doubling quarter over quarter, far in excess of typical seasonality, driven by increased marketing spend as carriers refocus on growth. Despite these increases, we expect Transaction Value in our P&C vertical to be down modestly year over year, as a major carrier is ramping customer acquisition at a more measured pace this year relative to their dramatic increase in the first quarter of 2023.
Turning to our Health insurance vertical, fourth quarter Transaction Value was roughly flat year over year, in line with our expectations. Overall, strong Under 65 health performance during the Affordable Care Act (ACA) Open Enrollment Period (OEP) offset the headwinds encountered by our partners during the Medicare Annual Enrollment Period (AEP) as the industry worked through new Centers for Medicare and Medicaid Services (CMS) marketing regulations. Looking ahead to what is typically a seasonally weaker first quarter in this vertical, we expect these dynamics to continue, resulting in mid- to high-single digit growth year over year.
Our business has significant operating leverage due to our technology-focused approach and lean team of 137 employees at the end of 2023. As a bootstrapped business, efficiency is in our DNA, and we will remain lean as growth ramps. As a result, we expect limited overhead growth for the full year and believe we are well positioned to deliver strong bottom line growth as P&C carrier advertising spend recovers and the top-line accelerates.
Following a historic downturn, we believe the P&C underwriting cycle has finally turned. While most carriers have yet to reach rate adequacy and fully resume their marketing investments, we are seeing clear signs of a market recovery and believe we are entering a period of sustained growth in P&C carrier marketing investments. Longer term, we expect to drive robust growth as insurance advertisers allocate an increasing share of their budgets to online marketing and as more publishers leverage our platform to provide insurers with access to in-market shoppers. As a result, we believe the network effects of our marketplace model will continue to grow and provide us with a durable competitive advantage, driving long-term shareholder value.
| | |
| Financial Discussion - Transaction Value and Revenue Metrics |
During Q4 2023, Transaction Value declined 2% year over year to $165.3 million, as our P&C vertical stabilized and our Health vertical remained roughly flat year over year as our Medicare partners encountered headwinds during AEP due to challenges in adapting to recent regulatory changes and medical cost inflationary pressures. For the full year 2023, Transaction Value declined 20% year over year to $593.4 million. Transaction Value represents the total gross investment in customer acquisition executed by our partners on our platform and is one of the key metrics that reflects our ability to drive value for our partners and increase our share of wallet as budgets increasingly migrate online.
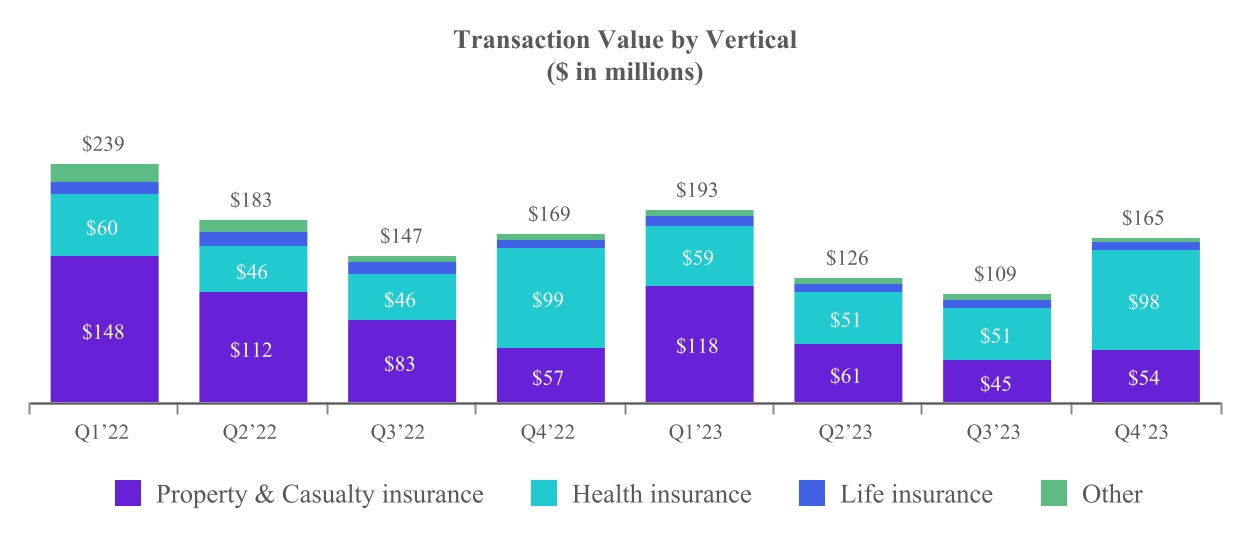
Transaction Value from our P&C vertical declined 4% year over year to $54.2 million in Q4 2023, driven by lower customer acquisition spend as carriers continued to prioritize profitability over growth. For the full year 2023, Transaction Value from our P&C vertical declined 31% year over year to $277.6 million.
Transaction Value from our Health vertical was $98.4 million in Q4 2023, flat year over year, driven by challenges experienced by partners during the Medicare AEP, which were offset by strong under 65 performance. Q4 is typically seasonally strong in this vertical due to the annual and open enrollment periods for Medicare and under 65 Health insurance. For the full year 2023, Transaction Value from our Health vertical grew 3% year over year to $259.8 million.
Transaction Value from our Life vertical declined 2% year over year to $8.0 million in Q4 2023. For the full year 2023, Transaction Value from our Life vertical declined 24% year over year to $34.1 million.
Transaction Value from our Other vertical, which includes travel and consumer finance, declined 14% year over year to $4.7 million in Q4 2023, driven primarily by continued weakness in our travel vertical. For the full year 2023, Transaction Value from our Other vertical declined 47% year over year to $22.0 million.
We generated $117.2 million of total revenue in Q4 2023, down 6% year over year, driven primarily by lower revenue from our Health vertical. For the full year 2023, we generated $388.1 million of total revenue, down 15% year over year, driven primarily by lower revenue from our P&C vertical.
Revenue from our P&C vertical increased 6% year over year to $37.7 million in Q4 2023, driven by an increase in the share of transactions coming from our Open Marketplace. For the full year 2023, revenue from our P&C vertical declined 27% year over year to $164.2 million.
Revenue from our Health vertical decreased 10% year over year to $71.1 million in Q4 2023, driven by an increase in the share of transactions coming from our Private Marketplaces, where Revenue is recognized on a net basis. For the full year 2023, revenue from our Health vertical declined 1% year over year to $186.3 million.
Revenue from our Life vertical increased 5% year over year to $6.0 million in Q4 2023. For the full year 2023, revenue from our Life vertical declined 9% year over year to $24.3 million.
Revenue from our Other vertical, which consists of travel and consumer finance, declined 41% year over year to $2.4 million in Q4 2023, driven by declines in our travel vertical. For the full year 2023, revenue from our Other vertical declined 35% year over year to $13.4 million.
| | |
Financial Discussion - Profitability |
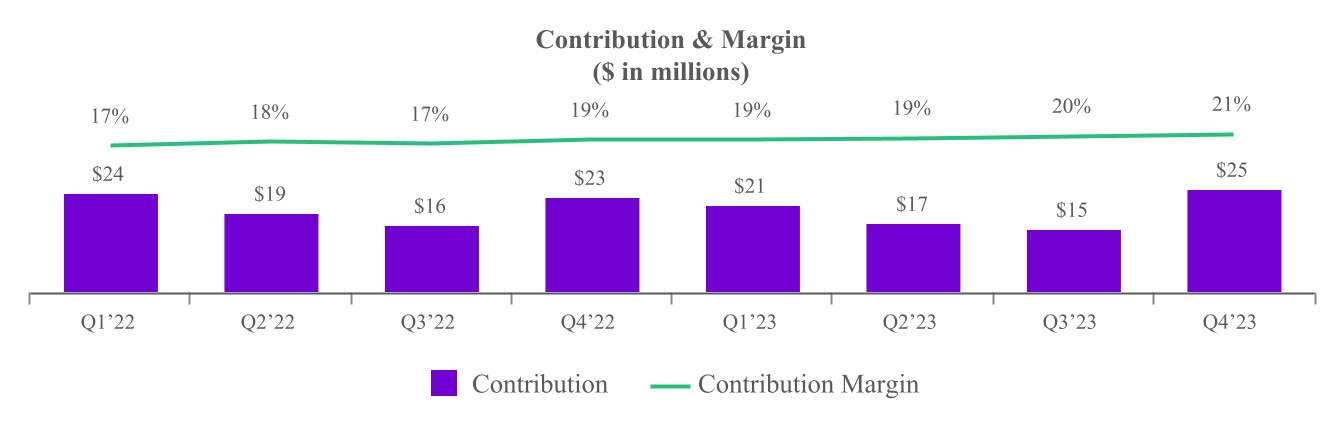
Gross profit was $22.3 million in Q4 2023, a year-over-year increase of 11%. For the full year 2023, gross profit was $66.7 million, a year-over-year decline of 5%. For the full year 2023, Gross Profit Margin was 17.2% compared with 15.3% in 2022. Contribution, which generally represents revenue less revenue share payments and online advertising costs, was $25.1 million in Q4 2023, a year-over-year increase of 9%. For the full year 2023, Contribution was $78.1 million, a year-over-year decline of 3%. Contribution Margin was 21.4% in Q4 2023, compared with 18.5% in Q4 2022. For the full year 2023, Contribution Margin was 20.1%, compared with 17.6% in 2022. The increases in Gross Profit Margin and Contribution Margin were due primarily to mix driven increases in our P&C vertical as well as increases in Health Transaction Value.
Net loss was $3.3 million in Q4 2023, compared with a net loss of $28.4 million in Q4 2022, driven primarily by certain items in Q4 2022 that did not recur in the current period, including higher tax expenses of $102.5 million due to recognition of a full valuation allowance against our deferred tax asset, which were offset in part by a gain on reduction of liability under our Tax Receivables Agreement of $83.3 million. In addition, during Q4 2023 we had a reduction in equity-based compensation of $4.9 million and higher Contribution of $2 million. For the full year 2023, net loss was $56.6 million, compared with net loss of $72.4 million in 2022.
Adjusted EBITDA was $12.7 million in Q4 2023, a year-over-year increase of 40%. Adjusted EBITDA margin was 10.8%, compared with 7.3% in Q4 2022. The increase was due primarily to stronger Contribution performance and continued expense discipline. For the full year 2023, Adjusted EBITDA was $27.1 million, a year-over-year increase of 19%.
Financial Discussion - Q1 2024 Outlook 1
Our guidance for Q1 2024 reflects an improvement in market conditions in our P&C insurance vertical compared with Q4 2023. In our Health vertical, we expect mid- to high-single digit year-over-year growth in Transaction Value. In our Life and Other verticals, we expect Transaction Value to be down slightly year over year. Due to the uncertainty around the timing and slope of the P&C market recovery, we are not providing full year 2024 guidance.
| | | | | | | | | | | | | | |
| | Q1 2024 |
Transaction Value 2 | | $175 million | - | $190 million |
| Y/Y Growth | | (9)% | | (2)% |
| | | | |
| | | | |
| Revenue | | $105 million | - | $115 million |
| Y/Y Growth | | (6)% | | 3% |
| | | | |
| | | | |
Adjusted EBITDA 2 | | $9.5 million | - | $11.5 million |
| Y/Y Growth | | 31% | | 58% |
Transaction Value: For Q1 2024, we expect Transaction Value to be in the range of $175 million - $190 million, representing a year-over-year decrease of 6% at the midpoint. We expect P&C Transaction Value to nearly double in Q1 2024 compared with Q4 2023, driven by both an accelerating recovery in carrier marketing spending and normal seasonality.
Revenue: For Q1 2024, we expect revenue to be in the range of $105 million - $115 million, representing a year-over-year decrease of 1% at the midpoint.
Adjusted EBITDA: For Q1 2024, we expect Adjusted EBITDA to be in the range of $9.5 million - $11.5 million, representing a year-over-year increase of 45% at the midpoint. We expect Adjusted EBITDA to grow at a greater rate than Transaction Value, Revenue and Contribution in Q1 2024 due to our primarily fixed operating expense profile. We expect Contribution less Adjusted EBITDA in Q1 2024 to be approximately $0.5 - $1.0 million higher than Q4 2023.
Thank you, | | | | | | | | |
| Steve Yi | | Patrick Thompson |
| Chief Executive Officer, President and Co-Founder | | Chief Financial Officer & Treasurer |
1 With respect to the Company’s projections of Adjusted EBITDA and Contribution under “Financial Discussion – Q1 2024 Outlook”, MediaAlpha is not providing a reconciliation of Adjusted EBITDA to net income (loss), or of Contribution to gross profit, because the Company is unable to predict with reasonable certainty the reconciling items that may affect the corresponding GAAP measures without unreasonable effort. These reconciling items are uncertain, depend on various factors and could significantly impact, either individually or in the aggregate, the GAAP measures for the applicable period.
2 See “Key Business and Operating Metrics and Non-GAAP Financial Measures” for additional information regarding non-GAAP metrics used in this shareholder letter.
| | |
Key Business and Operating Metrics and Non-GAAP Financial Measures |
In addition to traditional financial metrics, we rely upon certain business and operating metrics that are not presented in accordance with GAAP to estimate the volume of spending on our platform, estimate and recognize revenue, evaluate our business performance and facilitate our operations. Such business and operating metrics should not be considered in isolation from, or as an alternative to, measures presented in accordance with GAAP and should be considered together with other operating and financial performance measures presented in accordance with GAAP. Also, such business and operating metrics may not necessarily be comparable to similarly titled measures presented by other companies.
Transaction Value
We define “Transaction Value” as the total gross dollars transacted by our partners on our platform. Transaction Value is an operating metric not presented in accordance with GAAP, and is a driver of revenue based on the economic relationships we have with our partners. Our partners use our platform to transact via Open and Private Marketplace transactions. In our Open Marketplace model, Transaction Value is equal to revenue recognized and revenue share payments to our supply partners represent costs of revenue. In our Private Marketplace model, revenue recognized represents a platform fee billed to the demand partner or supply partner based on an agreed-upon percentage of the Transaction Value for the Consumer Referrals transacted, and accordingly there are no associated costs of revenue. We utilize Transaction Value to assess revenue and to assess the overall level of transaction activity through our platform. We believe it is useful to investors to assess the overall level of activity on our platform and to better understand the sources of our revenue across our different transaction models and verticals.
The following table presents Transaction Value by platform model for the three months and full years ended December 31, 2023 and 2022:
| | | | | | | | | | | | | | | | | | | | | | | |
| Three months ended
December 31, | | Full year ended December 31, |
| (in thousands) | 2023 | | 2022 | | 2023 | | 2022 |
| Open Marketplace transactions | $ | 115,162 | | | $ | 121,942 | | | $ | 378,730 | | | $ | 445,950 | |
| Percentage of total Transaction Value | 69.6 | % | | 72.2 | % | | 63.8 | % | | 60.5 | % |
| Private Marketplace transactions | 50,184 | | | 46,972 | | | 214,708 | | | 291,564 | |
| Percentage of total Transaction Value | 30.4 | % | | 27.8 | % | | 36.2 | % | | 39.5 | % |
| Total Transaction Value | $ | 165,346 | | | $ | 168,914 | | | $ | 593,438 | | | $ | 737,514 | |
The following table presents Transaction Value by vertical for the three months and full years ended December 31, 2023 and 2022:
| | | | | | | | | | | | | | | | | | | | | | | |
| Three months ended
December 31, | | Full year ended December 31, |
| (in thousands) | 2023 | | 2022 | | 2023 | | 2022 |
| Property & Casualty insurance | $ | 54,247 | | | $ | 56,682 | | | $ | 277,552 | | | $ | 399,861 | |
| Percentage of total Transaction Value | 32.8 | % | | 33.6 | % | | 46.8 | % | | 54.2 | % |
| Health insurance | 98,372 | | | 98,561 | | | 259,822 | | | 251,400 | |
| Percentage of total Transaction Value | 59.5 | % | | 58.3 | % | | 43.8 | % | | 34.1 | % |
| Life insurance | 8,015 | | | 8,181 | | | 34,057 | | | 44,619 | |
| Percentage of total Transaction Value | 4.8 | % | | 4.8 | % | | 5.7 | % | | 6.0 | % |
| Other | 4,712 | | | 5,490 | | | 22,007 | | | 41,634 | |
| Percentage of total Transaction Value | 2.9 | % | | 3.3 | % | | 3.7 | % | | 5.6 | % |
| Total Transaction Value | $ | 165,346 | | | $ | 168,914 | | | $ | 593,438 | | | $ | 737,514 | |
Contribution and Contribution Margin
We define “Contribution” as revenue less revenue share payments and online advertising costs, or, as reported in our consolidated statements of operations, revenue less cost of revenue (i.e., gross profit), as adjusted to exclude the following items from cost of revenue: equity-based compensation; salaries, wages, and related costs; internet and hosting costs; amortization; depreciation; other services; and merchant-related fees. We define “Contribution Margin” as Contribution expressed as a percentage of revenue for the same period. Contribution and Contribution Margin are non-GAAP financial measures that we present to supplement the financial information we present on a GAAP basis. We use Contribution and Contribution Margin to measure the return on our relationships with our supply partners (excluding certain fixed costs), the financial return on and efficacy of our online advertising costs to drive consumers to our proprietary websites, and our operating leverage. We do not use Contribution and Contribution Margin as measures of overall profitability. We present Contribution and Contribution Margin because they are used by our management and board of directors to manage our operating performance, including evaluating our operational performance against budget and assessing our overall operating efficiency and operating leverage. For example, if Contribution increases and our headcount costs and other operating expenses remain steady, our Adjusted EBITDA and operating leverage increase. If Contribution Margin decreases, we may choose to re-evaluate and re-negotiate our revenue share agreements with our supply partners, to make optimization and pricing changes with respect to our bids for keywords from primary traffic acquisition sources, or to change our overall cost structure with respect to headcount, fixed costs and other costs. Other companies may calculate Contribution and Contribution Margin differently than we do. Contribution and Contribution Margin have their limitations as analytical tools, and you should not consider them in isolation or as substitutes for analysis of our results presented in accordance with GAAP.
The following table reconciles Contribution with gross profit, the most directly comparable financial measure calculated and presented in accordance with GAAP, for the three months and full years ended December 31, 2023 and 2022:
| | | | | | | | | | | | | | | | | | | | | | | |
| Three months ended
December 31, | | Full year ended December 31, |
| (in thousands) | 2023 | | 2022 | | 2023 | | 2022 |
| Revenue | $ | 117,174 | | | $ | 124,007 | | | $ | 388,149 | | | $ | 459,072 | |
| Less cost of revenue | (94,892) | | | (103,864) | | | (321,437) | | | (389,013) | |
| Gross profit | $ | 22,282 | | | $ | 20,143 | | | $ | 66,712 | | | $ | 70,059 | |
| Adjusted to exclude the following (as related to cost of revenue): | | | | | | | |
| Equity-based compensation | 916 | | | 997 | | | 3,875 | | | 3,634 | |
| Salaries, wages, and related | 850 | | | 877 | | | 3,682 | | | 3,556 | |
| Internet and hosting | 161 | | | 147 | | | 579 | | | 496 | |
| Depreciation | 8 | | | 11 | | | 38 | | | 41 | |
| Other expenses | 179 | | | 189 | | | 692 | | | 720 | |
| Other services | 696 | | | 573 | | | 2,491 | | | 2,171 | |
| Merchant-related fees | 18 | | | 10 | | | 32 | | | 109 | |
| Contribution | $ | 25,110 | | | $ | 22,947 | | | $ | 78,101 | | | $ | 80,786 | |
| Gross margin | 19.0 | % | | 16.2 | % | | 17.2 | % | | 15.3 | % |
| Contribution Margin | 21.4 | % | | 18.5 | % | | 20.1 | % | | 17.6 | % |
Consumer Referrals
We define “Consumer Referral” as any consumer click, call or lead purchased by a buyer on our platform. Click revenue is recognized on a pay-per-click basis and revenue is earned and recognized when a consumer clicks on a listed buyer’s advertisement that is presented subsequent to the consumer’s search (e.g., auto insurance quote search or health insurance quote search). Call revenue is earned and recognized when a consumer transfers to a buyer and remains engaged for a requisite duration of time, as specified by each buyer. Lead revenue is recognized when we deliver data leads to buyers. Data leads are generated either through insurance carriers, insurance-focused research destination websites or other financial websites that make the data leads available for purchase through our platform, or when consumers complete a full quote request on our proprietary websites. Delivery occurs at the time of lead transfer. The data we generate from each Consumer Referral feeds into our analytics model to generate conversion probabilities for each unique consumer, enabling discovery of predicted return and cost per sale across the platform and helping us to improve our platform technology. We monitor the number of Consumer Referrals on our platform in order to measure Transaction Value, revenue and overall business performance across our verticals and platform models.
The following table presents the percentages of total Transaction Value generated from clicks, calls and leads for the years ended December 31, 2023 and 2022:
| | | | | | | | | | | | | | |
| | Year Ended December 31, |
| | 2023 | | 2022 |
| Clicks | | 69.4 | % | | 75.3 | % |
| Calls | | 18.6 | % | | 15.3 | % |
| Leads | | 12.0 | % | | 9.4 | % |
Adjusted EBITDA
We define “Adjusted EBITDA” as net income excluding interest expense, income tax benefit (expense), depreciation expense on property and equipment, amortization of intangible assets, as well as equity-based compensation expense and certain other adjustments as listed in the table below. We define “Adjusted EBITDA Margin” as Adjusted EBITDA as a percentage of revenue. Adjusted EBITDA is a non-GAAP financial measure that we present to supplement the financial information we present on a GAAP basis. We monitor and present Adjusted EBITDA because it is a key measure used by our management to understand and evaluate our operating performance, to establish budgets and to develop operational goals for managing our business. We believe that Adjusted EBITDA helps identify underlying trends in our business that could otherwise be masked by the effect of the expenses that we exclude in the calculations of Adjusted EBITDA. Accordingly, we believe that Adjusted EBITDA provides useful information to investors and others in understanding and evaluating our operating results, enhancing the overall understanding of our past performance and future prospects. In addition, presenting Adjusted EBITDA provides investors with a metric to evaluate the capital efficiency of our business.
Adjusted EBITDA is not presented in accordance with GAAP and should not be considered in isolation of, or as an alternative to, measures presented in accordance with GAAP. There are a number of limitations related to the use of Adjusted EBITDA rather than net income, which is the most directly comparable financial measure calculated and presented in accordance with GAAP. These limitations include the fact that Adjusted EBITDA excludes interest expense on debt, income tax benefit (expense), equity-based compensation expense, depreciation and amortization, and certain other adjustments that we consider to be useful to investors and others in understanding and evaluating our operating results. In addition, other companies may use other measures to evaluate their performance, including different definitions of “Adjusted EBITDA,” which could reduce the usefulness of our Adjusted EBITDA as a tool for comparison.
The following table reconciles Adjusted EBITDA with net (loss), the most directly comparable financial measure calculated and presented in accordance with GAAP, for the three months and full years ended December 31, 2023 and 2022.
| | | | | | | | | | | | | | | | | | | | | | | |
| Three months ended
December 31, | | Full year ended December 31, |
| (in thousands) | 2023 | | 2022 | | 2023 | | 2022 |
Net (loss) | $ | (3,293) | | | $ | (28,350) | | | $ | (56,555) | | | $ | (72,446) | |
| Equity-based compensation expense | 9,378 | | | 14,256 | | | 53,321 | | | 58,472 | |
| Interest expense | 3,918 | | | 3,337 | | | 15,315 | | | 9,245 | |
Income tax (benefit) expense(1) | (793) | | | 101,695 | | | (463) | | | 102,905 | |
| Depreciation expense on property and equipment | 78 | | | 97 | | | 353 | | | 392 | |
| Amortization of intangible assets | 1,729 | | | 1,691 | | | 6,917 | | | 5,755 | |
Transaction expenses(2) | 88 | | | — | | | 641 | | | 636 | |
SOX implementation costs(3) | — | | | — | | | — | | | 110 | |
Fair value adjustment to contingent consideration(4) | — | | | (416) | | | — | | | (7,007) | |
| Impairment of cost method investment | — | | | — | | | 1,406 | | | 8,594 | |
Changes in TRA related liability(5) | — | | | (83,255) | | | 6 | | | (83,832) | |
Changes in Tax Indemnification Receivable(6) | 687 | | | (14) | | | 639 | | | (58) | |
Settlement of federal and state income tax refunds(7) | 2 | | | — | | | 5 | | | 92 | |
Legal expenses(8) | 885 | | | — | | | 4,303 | | | — | |
Reduction in force costs (9) | — | | | — | | | 1,233 | | | — | |
| Adjusted EBITDA | $ | 12,679 | | | $ | 9,041 | | | $ | 27,121 | | | $ | 22,858 | |
(1)Income tax (benefit) expense for the three months and year ended December 31, 2022, consists primarily of $86.4 million and $84.5 million, respectively, of tax expense related to recording a valuation allowance on our deferred tax assets as we determined that the negative evidence outweighs the positive evidence and so it is more likely than not that our deferred tax assets will not be utilized.
(2)Transaction expenses for the three months and year ended December 31, 2023 consist of $0.1 million and $0.6 million, respectively, of legal and accounting fees incurred by us in connection with the amendment to the 2021 Credit Facilities, the tender offer filed by the Company's largest shareholder in May 2023, and a resale registration statement filed with the SEC. Transaction expenses for the year ended December 31, 2022 consist of $0.6 million of legal, accounting and other consulting fees incurred by us in connection with our acquisition of CHT.
(3)SOX implementation costs consist of $0.1 million of expenses incurred by us for the year ended December 31, 2022 for third-party consultants to assist us with the development, implementation, and documentation of new and enhanced internal controls and processes for compliance with SOX Section 404(b).
(4)Fair value adjustment to contingent consideration for the three months and year ended December 31, 2022 consists of $0.4 million and $7.0 million, respectively, of gain in connection with the remeasurement of the contingent consideration for the acquisition of CHT as of December 31, 2022.
(5)Changes in TRA related liability for the year ended December 31, 2023 consist of immaterial expense. Changes in TRA related liability for the three months and year ended December 31, 2022 consist of $83.3 million of gain on reduction of liability pursuant to the TRA resulting from remeasuring of the non-current portion of liability to zero as we no longer consider the payments under the agreement to be probable.
(6)Changes in Tax Indemnification Receivable consists of $0.7 million and $0.6 million of expense incurred by us for the three months and year ended December 31, 2023, respectively, and immaterial income and $0.1 million of income incurred by us for the three months and year ended December 31, 2022, respectively, related to changes in the tax indemnification receivable recorded in connection with the Reorganization Transactions. The change also resulted in an expense/benefit of the same amount, which has been recorded within income tax (benefit) expense for the same periods.
(7)Settlement of federal and state tax refunds consist of immaterial expense incurred by us for the three months and year ended December 31, 2023, and $0.1 million of expenses incurred by us for the year ended December 31, 2022, related to reimbursement to White Mountains for federal and state tax refunds for the period prior to the Reorganization Transactions related to 2020 federal and state tax returns. The settlement also resulted in a benefit of the same amount, which has been recorded within income tax (benefit) expense for the same periods.
(8)Legal expenses of $0.9 million and $4.3 million for the three months and year ended December 31, 2023, respectively, consist of legal fees incurred in connection with the civil investigative demand received from the Federal Trade Commission (FTC) in February 2023 and costs associated with a legal settlement unrelated to our core operations.
(9)Reduction in force costs for the year ended December 31, 2023 consist of $1.2 million of severance benefits provided to the terminated employees in connection with the RIF Plan. Additionally, equity-based compensation expense includes $0.3 million of charges related to the RIF Plan for the year ended December 31, 2023.
Forward-Looking Statements
This shareholder letter contains forward-looking statements within the meaning of the Private Securities Litigation Reform Act of 1995, including without limitation statements regarding our expectation of significant increases in P&C advertising spend as carriers turn their focus to acquiring new customers; our expectation of limited overhead growth and strong bottom line growth for the full year 2024; our expectation that we are entering a period of sustained growth in P&C carrier marketing investments; our expectation of attractive long-term growth as insurance advertisers allocate an increasing share of their budgets to online marketing and as more publishers leverage our platform; our belief that the network effects of our marketplace model will continue to grow and provide us with a durable competitive advantage, driving long-term shareholder value; and our financial outlook for the first quarter of 2024. These forward-looking statements reflect our current views with respect to, among other things, future events and our financial performance. These statements are often, but not always, made through the use of words or phrases such as “may,” “should,” “could,” “predict,” “potential,” “believe,” “will likely result,” “expect,” “continue,” “will,” “anticipate,” “seek,” “estimate,” “intend,” “plan,” “projection,” “would,” and “outlook,” or the negative version of those words or other comparable words or phrases of a future or forward-looking nature. These forward-looking statements are not historical facts, and are based on current expectations, estimates and projections about our industry, management’s beliefs and certain assumptions made by management, many of which, by their nature, are inherently uncertain and beyond our control. Accordingly, we caution you that any such forward-looking statements are not guarantees of future performance and are subject to risks, assumptions and uncertainties that are difficult to predict. Although we believe that the expectations reflected in these forward-looking statements are reasonable as of the date made, actual results may prove to be materially different from the results expressed or implied by the forward-looking statements.
There are or will be important factors that could cause our actual results to differ materially from those indicated in these forward-looking statements, including those more fully described in MediaAlpha’s filings with the Securities and Exchange Commission (“SEC”), including the Form 10-K as of and for the year ended December 31, 2023 to be filed on or about February 22, 2024. These factors should not be construed as exhaustive. MediaAlpha disclaims any obligation to update any forward-looking statements to reflect events or circumstances that occur after the date of this shareholder letter.
v3.24.0.1
Cover
|
Feb. 20, 2024 |
| Cover [Abstract] |
|
| Document Type |
8-K
|
| Document Period End Date |
Feb. 20, 2024
|
| Entity Registrant Name |
MediaAlpha, Inc.
|
| Entity Incorporation, State or Country Code |
DE
|
| Entity File Number |
001-39671
|
| Entity Tax Identification Number |
85-1854133
|
| Entity Address, Address Line One |
700 South Flower Street
|
| Entity Address, Address Line Two |
Suite 640
|
| Entity Address, City or Town |
Los Angeles
|
| Entity Address, State or Province |
CA
|
| Entity Address, Postal Zip Code |
90017
|
| City Area Code |
213
|
| Local Phone Number |
316-6256
|
| Written Communications |
false
|
| Soliciting Material |
false
|
| Pre-commencement Tender Offer |
false
|
| Pre-commencement Issuer Tender Offer |
false
|
| Title of 12(b) Security |
Class A common stock, $0.01 par value
|
| Trading Symbol |
MAX
|
| Security Exchange Name |
NYSE
|
| Entity Emerging Growth Company |
false
|
| Entity Central Index Key |
0001818383
|
| Amendment Flag |
false
|
| X |
- DefinitionBoolean flag that is true when the XBRL content amends previously-filed or accepted submission.
| Name: |
dei_AmendmentFlag |
| Namespace Prefix: |
dei_ |
| Data Type: |
xbrli:booleanItemType |
| Balance Type: |
na |
| Period Type: |
duration |
|
| X |
- DefinitionFor the EDGAR submission types of Form 8-K: the date of the report, the date of the earliest event reported; for the EDGAR submission types of Form N-1A: the filing date; for all other submission types: the end of the reporting or transition period. The format of the date is YYYY-MM-DD.
| Name: |
dei_DocumentPeriodEndDate |
| Namespace Prefix: |
dei_ |
| Data Type: |
xbrli:dateItemType |
| Balance Type: |
na |
| Period Type: |
duration |
|
| X |
- DefinitionThe type of document being provided (such as 10-K, 10-Q, 485BPOS, etc). The document type is limited to the same value as the supporting SEC submission type, or the word 'Other'.
| Name: |
dei_DocumentType |
| Namespace Prefix: |
dei_ |
| Data Type: |
dei:submissionTypeItemType |
| Balance Type: |
na |
| Period Type: |
duration |
|
| X |
- DefinitionAddress Line 1 such as Attn, Building Name, Street Name
| Name: |
dei_EntityAddressAddressLine1 |
| Namespace Prefix: |
dei_ |
| Data Type: |
xbrli:normalizedStringItemType |
| Balance Type: |
na |
| Period Type: |
duration |
|
| X |
- DefinitionAddress Line 2 such as Street or Suite number
| Name: |
dei_EntityAddressAddressLine2 |
| Namespace Prefix: |
dei_ |
| Data Type: |
xbrli:normalizedStringItemType |
| Balance Type: |
na |
| Period Type: |
duration |
|
| X |
- Definition
+ References
+ Details
| Name: |
dei_EntityAddressCityOrTown |
| Namespace Prefix: |
dei_ |
| Data Type: |
xbrli:normalizedStringItemType |
| Balance Type: |
na |
| Period Type: |
duration |
|
| X |
- DefinitionCode for the postal or zip code
| Name: |
dei_EntityAddressPostalZipCode |
| Namespace Prefix: |
dei_ |
| Data Type: |
xbrli:normalizedStringItemType |
| Balance Type: |
na |
| Period Type: |
duration |
|
| X |
- DefinitionName of the state or province.
| Name: |
dei_EntityAddressStateOrProvince |
| Namespace Prefix: |
dei_ |
| Data Type: |
dei:stateOrProvinceItemType |
| Balance Type: |
na |
| Period Type: |
duration |
|
| X |
- DefinitionA unique 10-digit SEC-issued value to identify entities that have filed disclosures with the SEC. It is commonly abbreviated as CIK. Reference 1: http://www.xbrl.org/2003/role/presentationRef
-Publisher SEC
-Name Exchange Act
-Number 240
-Section 12
-Subsection b-2
| Name: |
dei_EntityCentralIndexKey |
| Namespace Prefix: |
dei_ |
| Data Type: |
dei:centralIndexKeyItemType |
| Balance Type: |
na |
| Period Type: |
duration |
|
| X |
- DefinitionIndicate if registrant meets the emerging growth company criteria. Reference 1: http://www.xbrl.org/2003/role/presentationRef
-Publisher SEC
-Name Exchange Act
-Number 240
-Section 12
-Subsection b-2
| Name: |
dei_EntityEmergingGrowthCompany |
| Namespace Prefix: |
dei_ |
| Data Type: |
xbrli:booleanItemType |
| Balance Type: |
na |
| Period Type: |
duration |
|
| X |
- DefinitionCommission file number. The field allows up to 17 characters. The prefix may contain 1-3 digits, the sequence number may contain 1-8 digits, the optional suffix may contain 1-4 characters, and the fields are separated with a hyphen.
| Name: |
dei_EntityFileNumber |
| Namespace Prefix: |
dei_ |
| Data Type: |
dei:fileNumberItemType |
| Balance Type: |
na |
| Period Type: |
duration |
|
| X |
- DefinitionTwo-character EDGAR code representing the state or country of incorporation.
| Name: |
dei_EntityIncorporationStateCountryCode |
| Namespace Prefix: |
dei_ |
| Data Type: |
dei:edgarStateCountryItemType |
| Balance Type: |
na |
| Period Type: |
duration |
|
| X |
- DefinitionThe exact name of the entity filing the report as specified in its charter, which is required by forms filed with the SEC. Reference 1: http://www.xbrl.org/2003/role/presentationRef
-Publisher SEC
-Name Exchange Act
-Number 240
-Section 12
-Subsection b-2
| Name: |
dei_EntityRegistrantName |
| Namespace Prefix: |
dei_ |
| Data Type: |
xbrli:normalizedStringItemType |
| Balance Type: |
na |
| Period Type: |
duration |
|
| X |
- DefinitionThe Tax Identification Number (TIN), also known as an Employer Identification Number (EIN), is a unique 9-digit value assigned by the IRS. Reference 1: http://www.xbrl.org/2003/role/presentationRef
-Publisher SEC
-Name Exchange Act
-Number 240
-Section 12
-Subsection b-2
| Name: |
dei_EntityTaxIdentificationNumber |
| Namespace Prefix: |
dei_ |
| Data Type: |
dei:employerIdItemType |
| Balance Type: |
na |
| Period Type: |
duration |
|
| X |
- DefinitionLocal phone number for entity.
| Name: |
dei_LocalPhoneNumber |
| Namespace Prefix: |
dei_ |
| Data Type: |
xbrli:normalizedStringItemType |
| Balance Type: |
na |
| Period Type: |
duration |
|
| X |
- DefinitionBoolean flag that is true when the Form 8-K filing is intended to satisfy the filing obligation of the registrant as pre-commencement communications pursuant to Rule 13e-4(c) under the Exchange Act. Reference 1: http://www.xbrl.org/2003/role/presentationRef
-Publisher SEC
-Name Exchange Act
-Number 240
-Section 13e
-Subsection 4c
| Name: |
dei_PreCommencementIssuerTenderOffer |
| Namespace Prefix: |
dei_ |
| Data Type: |
xbrli:booleanItemType |
| Balance Type: |
na |
| Period Type: |
duration |
|
| X |
- DefinitionBoolean flag that is true when the Form 8-K filing is intended to satisfy the filing obligation of the registrant as pre-commencement communications pursuant to Rule 14d-2(b) under the Exchange Act. Reference 1: http://www.xbrl.org/2003/role/presentationRef
-Publisher SEC
-Name Exchange Act
-Number 240
-Section 14d
-Subsection 2b
| Name: |
dei_PreCommencementTenderOffer |
| Namespace Prefix: |
dei_ |
| Data Type: |
xbrli:booleanItemType |
| Balance Type: |
na |
| Period Type: |
duration |
|
| X |
- DefinitionTitle of a 12(b) registered security. Reference 1: http://www.xbrl.org/2003/role/presentationRef
-Publisher SEC
-Name Exchange Act
-Number 240
-Section 12
-Subsection b
| Name: |
dei_Security12bTitle |
| Namespace Prefix: |
dei_ |
| Data Type: |
dei:securityTitleItemType |
| Balance Type: |
na |
| Period Type: |
duration |
|
| X |
- DefinitionName of the Exchange on which a security is registered. Reference 1: http://www.xbrl.org/2003/role/presentationRef
-Publisher SEC
-Name Exchange Act
-Number 240
-Section 12
-Subsection d1-1
| Name: |
dei_SecurityExchangeName |
| Namespace Prefix: |
dei_ |
| Data Type: |
dei:edgarExchangeCodeItemType |
| Balance Type: |
na |
| Period Type: |
duration |
|
| X |
- DefinitionBoolean flag that is true when the Form 8-K filing is intended to satisfy the filing obligation of the registrant as soliciting material pursuant to Rule 14a-12 under the Exchange Act. Reference 1: http://www.xbrl.org/2003/role/presentationRef
-Publisher SEC
-Name Exchange Act
-Section 14a
-Number 240
-Subsection 12
| Name: |
dei_SolicitingMaterial |
| Namespace Prefix: |
dei_ |
| Data Type: |
xbrli:booleanItemType |
| Balance Type: |
na |
| Period Type: |
duration |
|
| X |
- DefinitionTrading symbol of an instrument as listed on an exchange.
| Name: |
dei_TradingSymbol |
| Namespace Prefix: |
dei_ |
| Data Type: |
dei:tradingSymbolItemType |
| Balance Type: |
na |
| Period Type: |
duration |
|
| X |
- DefinitionBoolean flag that is true when the Form 8-K filing is intended to satisfy the filing obligation of the registrant as written communications pursuant to Rule 425 under the Securities Act. Reference 1: http://www.xbrl.org/2003/role/presentationRef
-Publisher SEC
-Name Securities Act
-Number 230
-Section 425
| Name: |
dei_WrittenCommunications |
| Namespace Prefix: |
dei_ |
| Data Type: |
xbrli:booleanItemType |
| Balance Type: |
na |
| Period Type: |
duration |
|
MediaAlpha (NYSE:MAX)
Graphique Historique de l'Action
De Avr 2024 à Mai 2024

MediaAlpha (NYSE:MAX)
Graphique Historique de l'Action
De Mai 2023 à Mai 2024
