Form NPORT-P - Monthly Portfolio Investments Report on Form N-PORT (Public)
29 Novembre 2023 - 5:16PM
Edgar (US Regulatory)
The
GDL
Fund
Schedule
of
Investments
—
September
30,
2023
(Unaudited)
Shares
Market
Value
COMMON
STOCKS
—
39.2%
Aerospace
—
0.1%
3,500
Hexcel
Corp.
.....................
$
227,990
1,088
Spire
Global
Inc.†
.................
5,318
233,308
Automotive
—
0.2%
20,000
Iveco
Group
NV†
.................
187,387
600,000
Pendragon
plc†
..................
243,776
431,163
Broadcasting
—
0.8%
100,000
TEGNA
Inc.
.....................
1,457,000
Building
and
Construction
—
2.1%
37,500
Lennar
Corp.,
Cl. B
................
3,833,625
Business
Services
—
2.8%
3,000
Applus
Services
SA
................
31,400
100,000
Clear
Channel
Outdoor
Holdings
Inc.†
...
158,000
75,000
Dawson
Geophysical
Co.†
...........
177,000
2,000
Ework
Group
AB
..................
20,173
40,000
Heritage-Crystal
Clean
Inc.†
..........
1,814,000
100,000
PFSweb
Inc.
.....................
744,000
3,000
Triton
International
Ltd.
.............
246,420
11,000
Veritiv
Corp.
.....................
1,857,900
5,048,893
Cable
and
Satellite
—
0.5%
3,000
Lee
Enterprises
Inc.†
...............
32,130
34,000
Liberty
Global
plc,
Cl. A†
............
582,080
30,000
Liberty
Latin
America
Ltd.,
Cl. A†
......
244,800
5,351
Liberty
Latin
America
Ltd.,
Cl. C†
......
43,664
902,674
Computer
Software
and
Services
—
3.7%
78,000
Avid
Technology
Inc.†
..............
2,095,860
60,000
Computer
Task
Group
Inc.†
..........
619,800
14,000
EMIS
Group
plc
..................
330,013
5,000
ESI
Group†
.....................
800,867
7,200
Gen
Digital
Inc.
...................
127,296
22,000
New
Relic
Inc.†
..................
1,883,640
6,000
Playtech
plc†
....................
33,089
2,000
Splunk
Inc.†
.....................
292,500
14,000
Stratasys
Ltd.†
...................
190,540
1,500
VMware
Inc.,
Cl. A†
................
249,720
6,623,325
Consumer
Products
—
1.0%
18,000
Capri
Holdings
Ltd.†
...............
946,980
25,000
iRobot
Corp.†
....................
947,500
1,894,480
Diversified
Industrial
—
0.3%
10,000
JSR
Corp.
......................
268,804
Shares
Market
Value
3,600
Valmet
Oyj
......................
$
82,440
20,000
Velan
Inc.
.......................
163,004
514,248
Electronics
—
4.7%
50,300
Bel
Fuse
Inc.,
Cl. A
................
2,370,639
2,000
MKS
Instruments
Inc.
..............
173,080
65,000
National
Instruments
Corp.
..........
3,875,300
14,000
Rogers
Corp.†
...................
1,840,580
200
Schaffner
Holding
AG
..............
107,937
62,000
Yamada
Holdings
Co.
Ltd.
...........
190,638
8,558,174
Energy
and
Utilities
—
5.1%
12,500
Alvopetro
Energy
Ltd.
..............
81,171
12,500
Avista
Corp.
.....................
404,625
3,000
Crestwood
Equity
Partners
LP
........
87,750
22,000
Denbury
Inc.†
....................
2,156,220
40,000
Endesa
SA
......................
815,140
7,000
Green
Plains
Partners
LP
............
104,160
460,000
Gulf
Coast
Ultra
Deep
Royalty
Trust
.....
6,785
3,000
Holly
Energy
Partners
LP
............
65,880
9,005
ONEOK
Inc.
.....................
571,155
94,000
PNM
Resources
Inc.
...............
4,193,340
12,000
Southwest
Gas
Holdings
Inc.
.........
724,920
2,000
TransAlta
Renewables
Inc.
...........
18,097
9,229,243
Entertainment
—
0.8%
4,000
Activision
Blizzard
Inc.
..............
374,520
35,000
Fox
Corp.,
Cl. B
...................
1,010,800
70,000
IMAX
China
Holding
Inc.
............
75,087
1,460,407
Financial
Services
—
2.2%
30,000
Argo
Group
International
Holdings
Ltd.
..
895,200
875
Brookfield
Asset
Management
Ltd.,
Cl. A
.
29,172
3,500
Brookfield
Corp.
..................
109,445
12,000
Cadence
Bank
....................
254,640
1,000
Cincinnati
Bancorp
Inc.†
............
13,750
2,237
CNFinance
Holdings
Ltd.,
ADR†
.......
8,456
8,000
Columbia
Banking
System
Inc.
........
162,400
11,000
Fanhua
Inc.,
ADR†
................
79,310
6,186
First
Bank
......................
66,685
34,500
First
Horizon
Corp.
................
380,190
40,000
Greenhill
&
Co.
Inc.
................
592,000
2,000
Gresham
House
plc
................
25,988
7,500
Numis
Corp.
plc
..................
31,296
25,000
Sculptor
Capital
Management
Inc.
......
290,000
4,657
Shore
Bancshares
Inc.
..............
48,992
23,200
Steel
Partners
Holdings
LP†
..........
986,466
2,000
Webster
Financial
Corp.
.............
80,620
4,054,610
The
GDL
Fund
Schedule
of
Investments
(Continued)
—
September
30,
2023
(Unaudited)
Shares
Market
Value
COMMON
STOCKS
(Continued)
Food
and
Beverage
—
1.3%
10,000
Blue
Apron
Holdings
Inc.,
Cl. A†
.......
$
128,750
10,000
Chr.
Hansen
Holding
A/S
............
612,947
10,000
Finsbury
Food
Group
plc
............
13,360
4,500
Hostess
Brands
Inc.†
..............
149,895
61,133
Sovos
Brands
Inc.†
................
1,378,549
2,283,501
Health
Care
—
5.3%
10,000
Abcam
plc,
ADR†
.................
226,300
2,000
Amedisys
Inc.†
...................
186,800
5,700
AstraZeneca
plc,
ADR
..............
386,004
9,000
Biohaven
Ltd.†
...................
234,090
8,000
Bioventus
Inc.,
Cl. A†
..............
26,400
20,000
Dechra
Pharmaceuticals
plc
..........
924,348
5,000
Dialogue
Health
Technologies
Inc.†
.....
18,885
4,500
Globus
Medical
Inc.,
Cl. A†
..........
223,425
19,000
Horizon
Therapeutics
plc†
...........
2,198,110
35,000
Idorsia
Ltd.†
.....................
99,033
25,000
Intercept
Pharmaceuticals
Inc.†
.......
463,500
795
Kenvue
Inc.
.....................
15,968
20,000
NextGen
Healthcare
Inc.†
............
474,600
7,000
QIAGEN
NV†
....................
283,500
4,400
Seagen
Inc.†
....................
933,460
70,000
Tabula
Rasa
HealthCare
Inc.†
.........
721,700
17,000
TherapeuticsMD
Inc.†
..............
51,340
213,208
Thorne
HealthTech
Inc.†
............
2,172,589
9,640,052
Hotels
and
Gaming
—
1.9%
500
Flutter
Entertainment
plc†
...........
81,686
3,000
NEOGAMES
SA†
..................
81,000
145,000
Sciplay
Corp.,
Cl. A†
...............
3,301,650
3,464,336
Machinery
—
1.6%
25,000
CFT
SpA†(a)
.....................
121,584
44,000
CIRCOR
International
Inc.†
..........
2,453,000
10,000
CNH
Industrial
NV
.................
122,006
2,000
Xylem
Inc.
......................
182,060
2,878,650
Metals
and
Mining
—
0.6%
46,000
Alamos
Gold
Inc.,
Cl. A
.............
519,340
20,000
Artemis
Gold
Inc.†
................
85,404
21,000
Newcrest
Mining
Ltd.,
ADR
..........
332,640
85,000
PolyMet
Mining
Corp.†
.............
176,800
80,000
Sierra
Metals
Inc.†
................
23,104
1,137,288
Real
Estate
—
0.6%
10,000
Corem
Property
Group
AB,
Cl. B
.......
5,542
Shares
Market
Value
100,000
Hersha
Hospitality
Trust,
Cl. A,
REIT
....
$
986,000
991,542
Retail
—
0.9%
4,000
Albertsons
Companies
Inc.,
Cl. A
......
91,000
110,000
Fiesta
Restaurant
Group
Inc.†
........
930,600
22,000
Lookers
plc
.....................
34,787
10,000
Self
Storage
Group
ASA†
............
36,834
100,000
Sportsman's
Warehouse
Holdings
Inc.†
.
449,000
69,000
The
Fresh
Market
Inc.†(a)
...........
0
1,542,221
Semiconductors
—
0.1%
600
Silicon
Motion
Technology
Corp.,
ADR†
.
30,750
800
Siltronic
AG
.....................
68,467
400
Tower
Semiconductor
Ltd.†
..........
9,824
109,041
Specialty
Chemicals
—
1.2%
15,000
Chase
Corp.
.....................
1,908,450
10,000
Mativ
Holdings
Inc.
................
142,600
4,000
SGL
Carbon
SE†
..................
27,933
800
Tronox
Holdings
plc
...............
10,752
2,089,735
Telecommunications
—
1.2%
280,000
HKBN
Ltd.
......................
114,060
175,000
Koninklijke
KPN
NV
................
577,073
47,000
Orange
Belgium
SA†
...............
682,751
21,000
Parrot
SA†
......................
75,266
6,000
Telephone
and
Data
Systems
Inc.
......
109,860
42,047
Telesat
Corp.†
...................
601,272
2,160,282
Transportation
—
0.1%
40,000
Abertis
Infraestructuras
SA†(a)
.......
177,195
Wireless
Communications
—
0.1%
713,121
NII
Holdings
Inc.,
Escrow†
...........
249,592
TOTAL
COMMON
STOCKS
.........
70,964,585
CLOSED-END
FUNDS
—
0.5%
425,000
Altaba
Inc.,
Escrow†
...............
994,500
RIGHTS
—
0.3%
Computer
Software
and
Services
—
0.0%
1,000
Flexion
Therapeutics
Inc.,
CVR†
.......
650
Health
Care
—
0.1%
21,000
ABIOMED
Inc.,
CVR†
...............
36,750
70,000
Achillion
Pharmaceuticals
Inc.,
CVR†
...
35,000
104,000
Adamas
Pharmaceuticals
Inc.,
CVR†
....
5,200
104,000
Adamas
Pharmaceuticals
Inc.,
CVR†
....
5,200
40,000
Akouos
Inc.,
CVR†
................
30,000
The
GDL
Fund
Schedule
of
Investments
(Continued)
—
September
30,
2023
(Unaudited)
Shares
Market
Value
RIGHTS
(Continued)
Health
Care
(Continued)
6,000
Albireo
Pharma
Inc.,
CVR†
...........
$
13,500
79,391
Ambit
Biosciences
Corp.,
CVR†(a)
.....
0
35,000
Amryt
Pharma
plc,
CVR†
............
700
35,000
Amryt
Pharma
plc,
CVR†
............
700
64,000
Chinook
Therapeutics
Inc.,
CVR†
......
25,600
4,000
CinCor
Pharma
Inc.,
CVR†
...........
12,000
25,000
Decibel
Therapeutics
Inc.,
CVR†
.......
18,750
28,000
Epizyme
Inc.,
CVR†
................
560
300,000
Innocoll,
CVR†(a)
.................
0
125,000
Ipsen
SA/Clementia,
CVR†(a)
.........
0
23,000
Ocera
Therapeutics,
CVR†(a)
.........
3,910
3,000
Opiant
Pharmaceuticals
Inc.,
CVR†
.....
1,500
100,000
Paratek
Pharmaceuticals
Inc.,
CVR†
....
2,000
3,000
Prevail
Therapeutics
Inc.,
CVR†
.......
1,500
2,000
Radius
Health
Inc.,
CVR†
............
200
1,000
Sigilon
Therapeutics
Inc.,
CVR†
.......
7,550
346,322
Teva
Pharmaceutical
Industries
Ltd.,
CCCP,
expire
01/02/24†(a)
..............
0
11,000
Tobira
Therapeutics
Inc.,
CVR†(a)
......
0
200,620
Metals
and
Mining
—
0.1%
10,000
Kinross
Gold
Corp.,
CVR†(a)
.........
0
419,000
Pan
American
Silver
Corp.,
CVR†
......
224,165
224,165
Paper
and
Forest
Products
—
0.1%
24,000
Resolute
Forest
Products
Inc.,
CVR†
....
48,000
TOTAL
RIGHTS
................
473,435
Principal
Amount
U.S.
GOVERNMENT
OBLIGATIONS
—
60.1%
$
110,055,000
U.S.
Treasury
Bills,
4.993%
to
5.499%††,
10/19/23
to
03/14/24(b)
...................
108,791,460
TOTAL
INVESTMENTS
BEFORE
SECURITIES
SOLD
SHORT
—
100.1%
(Cost
$182,304,710)
.............
$
181,223,980
Shares
Market
Value
SECURITIES
SOLD
SHORT
—
(2.9)%
Building
and
Construction
—
(1.5)%
24,000
Lennar
Corp.,
Cl. A
.........................
$
2,693,520
Energy
and
Utilities
—
(1.2)%
18,480
Exxon
Mobil
Corp.
.........................
2,172,878
Financial
Services
—
(0.1)%
6,186
First
Bank
..................................
66,685
4,657
Shore
Bancshares
Inc.
.....................
48,992
115,677
Health
Care
—
(0.0)%
795
Kenvue
Inc.
................................
15,964
Machinery
—
(0.1)%
2,000
Xylem
Inc.
.................................
182,060
Semiconductors
—
(0.0)%
94
Broadcom
Inc.
.............................
78,074
TOTAL
SECURITIES
SOLD
SHORT
(Proceeds
received
$3,999,816)(c)
......
$
5,258,173
(a)
Security
is
valued
using
significant
unobservable
inputs
and
is
classified
as
Level
3
in
the
fair
value
hierarchy.
(b)
At
September
30,
2023,
$5,000,000
of
the
principal
amount
was
pledged
as
collateral
for
securities
sold
short
and
forward
foreign
exchange
contracts.
(c)
At
September
30,
2023,
these
proceeds
are
being
held
at
Pershing
LLC.
†
Non-income
producing
security.
††
Represents
annualized
yields
at
dates
of
purchase.
ADR
American
Depositary
Receipt
CCCP
Contingent
Cash
Consideration
Payment
CVR
Contingent
Value
Right
REIT
Real
Estate
Investment
Trust
Geographic
Diversification
%
of
Total
Investments
Market
Value
Long
Positions
North
America
......................
93.9
%
$
170,096,610
Europe
..............................
4.9
8,886,005
Latin
America
.......................
0.6
1,141,620
Asia/Pacific
.........................
0.4
640,303
Japan
...............................
0.2
459,442
Total
Investments
—
Long
Positions
100.0%
$
181,223,980
Short
Positions
North
America
......................
(2.9)
%
$
(5,258,173)
Total
Investments
—
Short
Positions
(2.9)%
$
(5,258,173)
The
GDL
Fund
Schedule
of
Investments
(Continued)
—
September
30,
2023
(Unaudited)
As
of
September
30,
2023,
forward
foreign
exchange
contracts
outstanding
were
as
follows:
Currency
Purchased
Currency
Sold
Counterparty
Settlement
Date
Unrealized
Appreciation/
(Depreciation)
USD
4,771,454
EUR
4,500,000
State
Street
Bank
and
Trust
Co.
10/27/23
$
8,167
EUR
1,400,000
USD
1,480,241
State
Street
Bank
and
Trust
Co.
10/27/23
1,671
USD
608,957
GBP
500,000
State
Street
Bank
and
Trust
Co.
10/27/23
(1,202)
TOTAL
FORWARD
FOREIGN
EXCHANGE
CONTRACTS
$
8,636
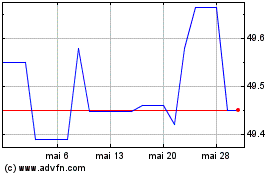
GDL (NYSE:GDL-C)
Graphique Historique de l'Action
De Avr 2024 à Mai 2024

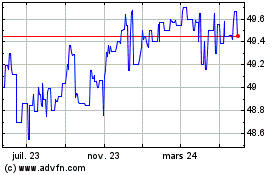
GDL (NYSE:GDL-C)
Graphique Historique de l'Action
De Mai 2023 à Mai 2024
