UNITED STATES
SECURITIES AND EXCHANGE COMMISSION
Washington, D.C. 20549
FORM
N-CSR
CERTIFIED SHAREHOLDER REPORT OF REGISTERED
MANAGEMENT INVESTMENT COMPANIES
|
|
|
| Investment Company Act file number |
|
811-22988 |
Nuveen Global High Income Fund
(Exact name of registrant as
specified in charter)
Nuveen Investments
333 West Wacker Drive, Chicago, IL 60606
(Address of principal executive
offices) (Zip code)
Mark L. Winget
Nuveen Investments
333 West Wacker
Drive, Chicago, IL 60606
(Name
and address of agent for service)
|
|
|
| Registrant’s telephone number, including area code: |
|
(312) 917-7700 |
|
|
|
| Date of fiscal year end: |
|
December 31 |
|
|
|
| Date of reporting period: |
|
June 30, 2023 |
Form N-CSR is to
be used by management investment companies to file reports with the Commission not later than 10 days after the transmission to stockholders of any report that is required to be transmitted to stockholders under Rule 30e-1 under the Investment
Company Act of 1940 (17 CFR 270.30e-1). The Commission may use the information provided on Form N-CSR in its regulatory, disclosure review, inspection, and policy making roles.
A registrant is required to disclose the information specified by Form N-CSR, and the Commission will make this information public. A registrant is not
required to respond to the collection of information contained in Form N-CSR unless the Form displays a currently valid Office of Management and Budget (“OMB”) control number. Please direct comments concerning the accuracy of the
information collection burden estimate and any suggestions for reducing the burden to Secretary, Securities and Exchange Commission, 450 Fifth Street, NW, Washington, DC 20549-0609. The OMB has reviewed this collection of information under the
clearance requirements of 44 U.S.C. ss.3507.
| ITEM 1. |
REPORTS TO STOCKHOLDERS. |

Closed-End Funds
June 30, 2023
Nuveen Closed-End Funds
This semi-annual report
contains the Funds’ unaudited financial statements.
|
|
|
| JGH |
|
Nuveen Global High Income Fund |
| NPCT |
|
Nuveen Core Plus Impact Fund |
| JLS |
|
Nuveen Mortgage and Income Fund |
Semi-annual Report
Table of Contents
2
Chair’s Letter to Shareholders

Dear Shareholders,
The
significant measures taken by the U.S. Federal Reserve (Fed) and other global central banks since 2022 to contain inflation have begun to take effect. From March 2022 to July 2023, the Fed raised the target fed funds rate by 5.25% to a range of
5.25% to 5.50%. Even with a brief pause in June 2023, this has been one of the fastest interest rate hiking cycles in the Fed’s history. Inflation rates in the U.S. and across most of the world have fallen from their post-pandemic highs but
currently remain above the levels that central banks consider supportive of their economies’ long-term growth, particularly when looking at core inflation measures, which exclude volatile food and energy prices.
At the same time, the U.S. and other large economies have remained relatively resilient, even as financial conditions have tightened. U.S. gross domestic product
accelerated to 2.4% in the second quarter of 2023 from 2.0% in the first quarter of 2023, after growing 2.1% in 2022 overall compared to 2021. A relatively strong jobs market has helped support consumer sentiment and spending despite historically
high inflation. Markets are concerned that these conditions could keep upward pressure on prices and wages and continue to assess the impact of the collapse of three regional U.S. banks (Silicon Valley Bank, Signature Bank and First Republic Bank)
and major European bank Credit Suisse in March 2023.
Fed officials are closely monitoring inflation data and other economic measures to modify their rate setting
activity based upon these factors on a meeting-by-meeting basis, including pausing rate adjustments at the June 2023 meeting to assess the effects of monetary policy on
the economy. While uncertainty has increased given the unpredictable outcome of tighter credit conditions on the economy, the Fed remains committed to acting until it sees sustainable progress toward its inflation goals. Additionally, market
concerns surrounding the U.S. debt ceiling faded after the government agreed in June 2023 to suspend the nation’s borrowing limit until January 2025, averting a near-term default scenario. In the meantime, markets are likely to continue
reacting in the short term to news about inflation data, economic indicators and central bank policy. We encourage investors to keep a long-term perspective amid the short-term turbulence. Your financial professional can help you review how well
your portfolio is aligned with your time horizon, risk tolerance and investment goals.
On behalf of the other members of the Nuveen Fund Board, we look forward to
continuing to earn your trust in the months and years ahead.
Sincerely,

Terence J. Toth
Chair of the Board
August 22, 2023
3
Important Notices
Portfolio Manager Commentaries in Semi-annual Shareholder Reports
The Funds include portfolio manager commentary in their annual shareholder reports. For the Funds’ most recent annual portfolio manager discussion, please refer to
the Portfolio Managers’ Comments section of each Fund’s December 31, 2022 annual shareholder report.
For current information on your Fund’s
investment objectives, portfolio management team and average annual total returns please refer to the Fund’s website at www.nuveen.com.
For changes that
occurred to your Fund both during and subsequent to this reporting period, please refer to the Notes to Financial Statements section of this report.
For average
annual total returns as of the end of this reporting period, please refer to the Performance Overview and Holding Summaries section within this report.
Portfolio Manager Update for (JGH)
Effective March 21, 2023, John Espinosa,
Brenda Langenfeld, and Katherine Renfrew have been added as portfolio managers and Anders Persson no longer serves as a portfolio manager of the Fund. Mr. Persson continues in his role as Chief Investment Officer of Nuveen Global Fixed Income. Kevin
Lorenz and Jacob Fitzpatrick continue to serve as portfolio managers of the Fund.
4
Fund Leverage
IMPACT OF THE FUND’S LEVERAGE STRATEGY ON PERFORMANCE
One important factor impacting the common share returns of the Funds relative to their comparative benchmarks was the use of leverage through bank borrowings, Taxable
Fund Preferred Shares (TFP) for NPCT and reverse repurchase agreements for NPCT and JLS. The Funds use leverage because our research has shown that, over time, leveraging provides opportunities for additional income. The opportunity arises when
short-term rates that the Fund pays on its leveraging instruments are lower than the interest the Fund earns on its portfolio securities that it has bought with the proceeds of that leverage.
However, use of leverage can expose Fund common shares to additional price volatility. When a Fund uses leverage, the Fund’s common shares will experience a greater
increase in their net asset value if the securities acquired through the use of leverage increase in value, but will also experience a correspondingly larger decline in their net asset value if the securities acquired through leverage decline in
value. All this will make the shares’ total return performance more variable over time.
In addition, common share income in levered funds will typically
decrease in comparison to unlevered funds when short-term interest rates increase and increase when short-term interest rates decrease. In recent quarters, fund leverage expenses have generally tracked the overall movement of short-term interest
rates. While fund leverage expenses are higher than prior year lows, leverage nevertheless continues to provide the opportunity for incremental common share income, particularly over longer-term periods.
JGH and JLS’s use of leverage contributed to relative performance during the reporting period. In addition, the Funds’ use of leverage was accretive to common
share income. NPCT’s use of leverage detracted from relative performance during the reporting period.
JGH also continued to use interest rate swap contracts to
partially hedge its future interest cost of leverage. The interest rate swaps contributed to relative performance during the reporting period.
As of June 30, 2023,
the Funds’ percentages of leverage are as shown in the accompanying table.
|
|
|
|
|
|
|
|
|
|
|
|
|
| |
|
JGH |
|
|
NPCT |
|
|
JLS |
|
| Effective Leverage* |
|
|
28.78 |
% |
|
|
39.38 |
% |
|
|
28.39 |
% |
| Regulatory Leverage* |
|
|
28.78 |
% |
|
|
34.00 |
% |
|
|
8.54 |
% |
| * |
Effective leverage is a Fund’s effective economic leverage, and includes both regulatory leverage and the leverage
effects of reverse repurchase agreements, certain derivative and other investments in a Fund’s portfolio that increase the Fund’s investment exposure. Regulatory leverage consists of preferred shares issued or borrowings of the Fund. Both
of these are part of a Fund’s capital structure. A Fund, however, may from time to time borrow on a typically transient basis in connection with its day-to-day operations, primarily in connection with the need to settle portfolio trades. Such
incidental borrowings are excluded from the calculation of a Fund’s effective leverage ratio. Regulatory leverage is subject to asset coverage limits set forth in the Investment Company Act of 1940. |
5
Fund Leverage (continued)
Bank Borrowings
As noted previously, the Funds employ leverage through the use of bank borrowings. The Funds’ bank borrowing activities are as shown in the accompanying table.
|
|
|
|
|
|
|
|
|
|
|
|
|
|
|
|
|
|
|
|
|
|
|
|
|
|
|
|
|
|
|
|
|
|
|
|
|
| |
|
|
|
|
|
|
|
Subsequent to the Close of |
|
| |
|
Current Reporting Period |
|
|
|
|
|
the Reporting Period |
|
| Fund |
|
Outstanding
Balance as of
January 1, 2023 |
|
|
Draws |
|
|
Paydowns |
|
|
Outstanding
Balance as of
June 30, 2023 |
|
|
Average
Balance
Outstanding |
|
|
|
|
|
Draws |
|
|
Paydowns |
|
|
Outstanding
Balance as of
August 22, 2023 |
|
| JGH |
|
$ |
127,000,000 |
|
|
$ |
— |
|
|
$ |
(8,000,000 |
) |
|
$ |
119,000,000 |
|
|
$ |
122,845,304 |
|
|
|
|
|
|
$ |
— |
|
|
$ |
— |
|
|
$ |
119,000,000 |
|
| NPCT |
|
$ |
105,500,000 |
|
|
$ |
— |
|
|
$ |
— |
|
|
$ |
105,500,000 |
|
|
$ |
105,500,000 |
|
|
|
|
|
|
$ |
— |
|
|
$ |
— |
|
|
$ |
105,500,000 |
|
| JLS |
|
$ |
12,495,000 |
|
|
$ |
700,000 |
|
|
$ |
(3,500,000 |
) |
|
$ |
9,695,000 |
|
|
$ |
10,167,928 |
|
|
|
|
|
|
$ |
— |
|
|
$ |
— |
|
|
$ |
9,695,000 |
|
Refer to Notes to Financial Statements, Note 10 – Borrowing Arrangements and Reverse Repurchase Agreements for further details.
Reverse Repurchase Agreements
As noted previously, JLS and NPCT use reverse
repurchase agreements, in which the Fund sells to a counterparty a security that it holds with a contemporaneous agreement to repurchase the same security at an agreed-upon price and date. The Funds’ transactions in reverse repurchase
agreements are as shown in the accompanying table.
|
|
|
|
|
|
|
|
|
|
|
|
|
|
|
|
|
|
|
|
|
|
|
|
|
|
|
|
|
|
|
|
|
|
|
|
|
| |
|
|
|
|
|
|
|
Subsequent to the Close of |
|
| |
|
Current Reporting Period |
|
|
|
|
|
the Reporting Period |
|
| Fund |
|
Outstanding
Balance as of
January 1, 2023 |
|
|
Sales |
|
|
Purchases |
|
|
Outstanding
Balance as of
June 30, 2023 |
|
|
Average
Balance
Outstanding |
|
|
|
|
|
Sales |
|
|
Purchases |
|
|
Outstanding
Balance as of
August 22, 2023 |
|
| NPCT |
|
$ |
45,820,000 |
|
|
$ |
91,640,000 |
|
|
$ |
(91,640,000 |
) |
|
$ |
45,820,000 |
|
|
$ |
45,820,000 |
|
|
|
|
|
|
$ |
— |
|
|
$ |
— |
|
|
$ |
45,820,000 |
|
| JLS |
|
$ |
32,145,000 |
|
|
$ |
62,050,000 |
|
|
$ |
(62,750,000 |
) |
|
$ |
31,445,000 |
|
|
$ |
31,839,475 |
|
|
|
|
|
|
$ |
— |
|
|
$ |
(897,000 |
) |
|
$ |
30,548,000 |
|
Refer to Notes to Financial Statements, Note 10 – Borrowing Arrangements and Reverse Repurchase Agreements for further details.
Taxable Fund Preferred Shares
As noted previously, in addition to bank
borrowings, NPCT also issued TFP. The Fund’s transactions in TFP are as shown in the accompanying table.
|
|
|
|
|
|
|
|
|
|
|
|
|
|
|
|
|
|
|
|
|
|
|
|
|
|
|
|
|
|
|
|
|
|
|
|
|
| |
|
|
|
|
|
|
|
Subsequent to the Close of |
|
| |
|
Current Reporting Period |
|
|
|
|
|
the Reporting Period |
|
| Fund |
|
Outstanding
Balance as of
January 1, 2023 |
|
|
Issuance |
|
|
Redemptions |
|
|
Outstanding
Balance as of
June 30, 2023 |
|
|
Average
Balance
Outstanding |
|
|
|
|
|
Sales |
|
|
Purchases |
|
|
Outstanding
Balance as of
August 22, 2023 |
|
| NPCT |
|
$ |
70,000,000 |
|
|
$ |
— |
|
|
$ |
— |
|
|
$ |
70,000,000 |
|
|
$ |
70,000,000 |
|
|
|
|
|
|
$ |
— |
|
|
$ |
— |
|
|
$ |
70,000,000 |
|
Refer to Notes to Financial Statements, Note 6 – Fund Shares for further details on TFP.
6
Common Share Information
(Unaudited)
COMMON SHARE DISTRIBUTION INFORMATION FOR JGH AND JLS
The following
information regarding the distributions for JGH and JLS are current as of June 30, 2023, the Funds’ fiscal and tax year end, and may differ from previously issued distribution notices.
The Funds have implemented a level distribution program to provide shareholders with stable, but not guaranteed, cash flow, independent of the amount or timing of income
earned or capital gains realized by the Fund. Under this program, the Fund’s regular monthly distribution, in order to maintain its level distribution amount, may include net investment income, return of capital and potentially capital gains
for tax purposes. The practice of maintaining a stable distribution level had no material effect on each Fund’s investment strategy during the most recent fiscal period and is not expected to have such an effect in future periods, however,
distributions in excess of Fund returns will cause its NAV per share to erode. For additional information, refer to the distribution information section below and in the Notes to Financial Statements herein.
Actual amounts and sources for tax reporting purposes will be determined as of each Fund’s fiscal year-end and reported to shareholders on Form 1099-DIV. Because
distribution source estimates are updated throughout the current fiscal year based on a Fund’s performance, these estimates may differ from both the tax information reported to you in your Fund’s 1099 statement, as well as the ultimate
economic sources of distributions over the life of your investment. The figures in the table below provide an estimate of the sources of distributions and may include amounts attributed to realized gains and/or returns of capital. The Funds
attribute these estimates equally to each regular distribution throughout the year. Consequently, the estimated information shown below is for the current distribution, and also represents an updated estimate for all prior months in the fiscal year.
These estimates should not be used for tax reporting purposes. The final determination for all distributions paid in 2023 will be made in early 2024 and reported to you on Form 1099-DIV. More details about each Fund’s distributions and the
basis for these estimates are available on www.nuveen.com/en-us/closed-end-funds.
Data as of June 30, 2023
|
|
|
|
|
|
|
|
|
|
|
|
|
|
|
|
|
|
|
|
|
|
|
|
|
|
|
|
|
|
|
|
|
|
|
|
|
| |
|
|
|
|
Current Month
Estimated Percentage of Distributions |
|
|
|
|
|
Fiscal YTD
Estimated Per Share Amounts |
|
| Fund |
|
Latest
Monthly
Per Share
Distribution |
|
|
Net
Investment
Income |
|
|
Realized
Gains |
|
|
Return of
Capital |
|
|
|
|
|
Total
Distributions |
|
|
Net
Investment
Income |
|
|
Realized
Gains |
|
|
Return of
Capital |
|
| JGH |
|
$ |
0.1035 |
|
|
|
74.15 |
% |
|
|
0.00 |
% |
|
|
25.85 |
% |
|
|
|
|
|
$ |
0.6210 |
|
|
$ |
0.4605 |
|
|
$ |
0.0000 |
|
|
$ |
0.1605 |
|
| JLS |
|
$ |
0.1230 |
|
|
|
93.37 |
% |
|
|
0.00 |
% |
|
|
6.63 |
% |
|
|
|
|
|
$ |
0.7170 |
|
|
$ |
0.6694 |
|
|
$ |
0.0000 |
|
|
$ |
0.0476 |
|
The following table provides information regarding Fund distributions and total return performance over various time periods. This
information is intended to help you better understand whether Fund returns for the specified time periods were sufficient to meet Fund distributions.
Data as of
June 30, 2023
|
|
|
|
|
|
|
|
|
|
|
|
|
|
|
|
|
|
|
|
|
|
|
|
|
|
|
|
|
|
|
|
|
|
|
|
|
| |
|
|
|
|
|
|
|
|
|
|
Annualized |
|
|
|
|
|
Cumulative |
|
| Fund |
|
Inception
Date |
|
|
Latest
Monthly
Per Share
Distribution |
|
|
|
|
|
Current
Distribution
on NAV |
|
|
1-Year
Return on
NAV |
|
|
5-Year
Return on
NAV |
|
|
|
|
|
Fiscal YTD
Distributions
on NAV |
|
|
Fiscal
YTD Return
on NAV |
|
| JGH |
|
|
11/24/2014 |
|
|
|
$0.1035 |
|
|
|
|
|
|
|
9.78% |
|
|
|
11.24% |
|
|
|
1.42% |
|
|
|
|
|
|
|
4.89% |
|
|
|
4.21% |
|
| JLS |
|
|
11/25/2009 |
|
|
|
$0.1230 |
|
|
|
|
|
|
|
7.79% |
|
|
|
5.61% |
|
|
|
1.00% |
|
|
|
|
|
|
|
3.78% |
|
|
|
4.33% |
|
7
Common Share Information (Unaudited) (continued)
COMMON SHARE DISTRIBUTION INFORMATION FOR NPCT
NPCT makes regular cash distributions to shareholders of a stated dollar amount per share. Subject to approval and oversight by the Board of Trustees, the Fund seeks to
maintain a stable distribution level designed to deliver the long-term return potential of the Fund’s investment strategy through regular distributions (a “Managed Distribution Program”). The
practice of maintaining a stable distribution level had no material effect on the Fund’s investment strategy during the most recent fiscal period and is not expected to have such an effect in future periods, however, distributions in excess of
Fund returns will cause its NAV per share to erode. For additional information, refer to the distribution information section below and in the Notes to Financial Statements herein.
The following information regarding the Fund’s distributions is current as of June 30, 2023. This notice provides shareholders with information regarding fund
distributions, as required by current securities laws. You should not draw any conclusions about the Fund’s investment performance from the amount of the distribution or from the terms of the Fund’s Managed Distribution Policy.
The following table provides estimates of the Fund’s distribution sources, reflecting year-to-date cumulative experience through the month-end prior to the latest
distribution. The Fund attributes these estimates equally to each regular distribution throughout the year. Consequently, the estimated information as of the specified month-end shown below is for the current distribution, and also represents an
updated estimate for all prior months in the year. For the Fund, it is estimated that the Fund has distributed more than its income and net realized capital gains; therefore, a portion of the distributions may be (and is shown below as being
estimated to be) a return of capital. A return of capital may occur, for example, when some or all of the money that you invested in the Fund is paid back to you. A return of capital distribution does not necessarily reflect the Fund’s
investment performance and should not be confused with “yield” or “income.”
The amounts and sources of distributions reported in this notice are
only estimates and are not being provided for tax reporting purposes. The actual amounts and sources of the amounts for tax reporting purposes will depend upon the Fund’s investment experience during the remainder of its fiscal year and may be
subject to changes based on tax regulations. The Fund will send a Form 1099-DIV for the calendar year that will tell you how to report these distributions for federal income tax purposes. More details about the Fund’s distributions and the
basis for these estimates are available on www.nuveen.com/cef.
Data as of June 30, 2023
|
|
|
|
|
|
|
|
|
|
|
|
|
|
|
|
|
|
|
|
|
|
|
|
|
|
|
|
|
|
|
|
|
|
|
|
|
|
|
|
|
|
|
|
|
| |
|
|
|
|
|
|
|
Fiscal YTD |
|
| |
|
|
|
|
|
|
|
Per Share Estimated Sources of Distribution |
|
|
|
|
|
Estimated Percentage of the Distribution |
|
| Fund |
|
Per Share
Distribution |
|
|
|
|
|
Net
Investment
Income |
|
|
Long-Term
Gains |
|
|
Short-Term
Gains |
|
|
Return of
Capital |
|
|
|
|
|
Net
Investment
Income |
|
|
Long-Term
Gains |
|
|
Short-Term
Gains |
|
|
Return of
Capital |
|
| NPCT (FYE 12/31) |
|
|
$0.5380 |
|
|
|
|
|
|
|
$0.1997 |
|
|
|
$0.0000 |
|
|
|
$0.0000 |
|
|
|
$0.3383 |
|
|
|
|
|
|
|
37.1% |
|
|
|
0.00% |
|
|
|
0.00% |
|
|
|
62.9% |
|
The following tables provide information regarding the Fund’s common share distributions and total return performance for the six
month ended June 30, 2023. This information is intended to help you better understand whether the Funds’ returns for the specified time period were sufficient to meet its distributions.
|
|
|
|
|
|
|
|
|
|
|
|
|
|
|
|
|
|
|
|
|
|
|
|
|
|
|
|
|
|
|
|
|
|
|
|
|
|
|
|
|
| |
|
|
|
|
|
|
|
|
|
|
|
|
|
|
|
|
Annualized |
|
|
|
|
|
Cumulative |
|
| Fund |
|
Inception
Date |
|
|
Latest
Monthly
Distribution |
|
|
Fiscal YTD
Distribution |
|
|
Net Asset
Value (NAV) |
|
|
|
|
|
Since Inception
Return on
NAV |
|
|
Fiscal YTD
Distribution
Rate on NAV |
|
|
|
|
|
Fiscal YTD
Return on
NAV |
|
|
Fiscal YTD
Distribution
Rate on NAV |
|
| NPCT (FYE 12/31) |
|
|
4/27/2021 |
|
|
|
$0.0830 |
|
|
|
$0.5380 |
|
|
|
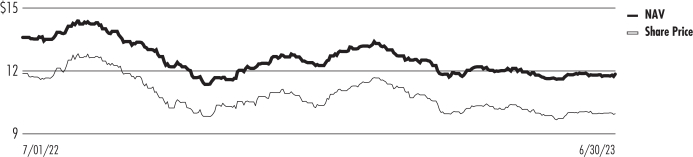
$11.85 |
|
|
|
|
|
|
|
(15.11)% |
|
|
|
9.08% |
|
|
|
|
|
|
|
0.89% |
|
|
|
4.54% |
|
8
NUVEEN CLOSED-END FUND DISTRIBUTION AMOUNTS
The Nuveen Closed-End Funds’ monthly and quarterly periodic distributions to shareholders are posted on www.nuveen.com and can be found on Nuveen’s
enhanced closed-end fund resource page, which is at https://www.nuveen.com/resource-center-closed-end-funds, along with other Nuveen closed-end fund product updates. To ensure timely access to the latest information, shareholders may use a subscribe
function, which can be activated at this web page (https://www.nuveen.com/subscriptions).
COMMON SHARE REPURCHASES
The Funds’ Board of Trustees reauthorized an open-market common share repurchase program, allowing each Fund to repurchase and retire an aggregate of up to
approximately 10% of its outstanding common shares.
During the current reporting period, the Funds did not repurchase any of their outstanding common shares. As of
June 30, 2023, and since the inception of the Funds’ repurchase program, each Fund have cumulatively repurchased and retired its outstanding common shares as shown in the accompanying table.
|
|
|
|
|
|
|
|
|
|
|
|
|
| |
|
JGH |
|
|
NPCT |
|
|
JLS |
|
| Common shares cumulatively repurchased and retired |
|
|
900,000 |
|
|
|
— |
|
|
|
10,814 |
|
| Common shares authorized for repurchase |
|
|
2,315,000 |
|
|
|
2,875,000 |
|
|
|
545,000 |
|
OTHER COMMON SHARE INFORMATION
As of June 30,
2023, the Funds’ common share prices were trading at a premium/(discount) to their common share NAVs and trading at an average premium/(discount) to NAV during the current reporting period, as follows:
|
|
|
|
|
|
|
|
|
|
|
|
|
| |
|
JGH |
|
|
NPCT |
|
|
JLS |
|
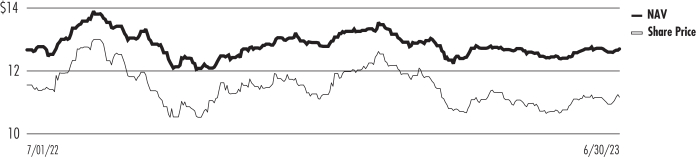
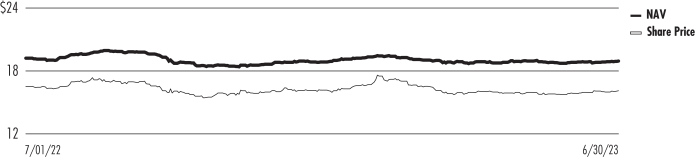
| Common share NAV |
|
$ |
12.70 |
|
|
$ |
11.85 |
|
|
$ |
18.95 |
|
| Common share price |
|
$ |
11.17 |
|
|
$ |
9.97 |
|
|
$ |
16.12 |
|
| Premium/(Discount) to NAV |
|
|
(12.05 |
)% |
|
|
(15.86 |
)% |
|
|
(14.93 |
)% |
| Average premium/(discount) to NAV |
|
|
(11.17 |
)% |
|
|
(14.48 |
)% |
|
|
(14.57 |
)% |
9
About the Funds’ Benchmarks
| ∎ |
|
Bloomberg Global High Yield Index (USD Hedged): An index designed to measure the performance of the fixed-rate high
yield debt of companies in the U.S., developed markets and emerging markets. Index returns assume reinvestment of distributions, but do not reflect any applicable sales charges or management fees. |
| ∎ |
|
Bloomberg MSCI U.S. Green Bond Index: An index designed to measure the performance of USD-denominated, investment
grade fixed income securities issued by U.S. and non-U.S. companies to fund projects with direct environmental benefits. Index returns assume reinvestment of distributions, but do not reflect any applicable sales charges or management fees.
|
| ∎ |
|
Bloomberg U.S. Aggregate Bond Index: An index designed to measure the performance of the USD-denominated, fixed-rate
U.S. investment grade taxable bond market. The index includes Treasuries, government-related and corporate securities, mortgage-backed securities (MBS), asset-backed securities (ABS) and commercial mortgage-backed securities (CMBS). Index returns
assume reinvestment of distributions, but do not reflect any applicable sales charges or management fees. |
| ∎ |
|
Bloomberg U.S. Corporate High Yield Bond Index: An index designed to measure the performance of the USD-denominated,
fixed-rate corporate high yield bond market. Index returns assume reinvestment of distributions, but do not reflect any applicable sales charges or management fees. |
| ∎ |
|
ICE BofA U.S. ABS & CMBS Index: An index that consists of a 50/50 blend of USD-denominated investment grade
fixed- and floating-rate asset backed securities (ABS) and fixed-rate commercial mortgage-backed securities (CMBS) publicly issued in the U.S. domestic market. Index returns assume reinvestment of distributions, but do not reflect any applicable
sales charges or management fees. |
| ∎ |
|
JLS Blended Benchmark (effective October 14, 2019): The ICE BofA U.S. ABS & CMBS Index consists of a 50/50 blend
of USD-denominated, investment grade fixed and floating-rate asset backed securities (ABS) and fixed-rate commercial mortgage backed securities (CMBS) publicly issued in the U.S. The Fund’s performance was measured against the Bloomberg U.S.
Aggregate Bond Index (defined herein) through October 13, 2019. Index returns assume reinvestment of distributions, but do not reflect any applicable sales charges or management fees. |
| ∎ |
|
NPCT Blended Benchmark: Consists of: 1) 60% Bloomberg MSCI U.S. Green Bond Index (defined herein), and 2) 40%
Bloomberg U.S. Corporate High Yield Bond Index (defined herein). Index returns assume reinvestment of distributions, but do not reflect any applicable sales charges or management fees. |
10
|
|
|
| JGH |
|
Nuveen Global High Income Fund
Performance Overview and Holding Summaries as of June 30, 2023 |
Refer to the Glossary of Terms Used in this Report for further definition of the terms used within
this section.
Average Annual Total Returns as of June 30, 2023*
|
|
|
|
|
|
|
|
|
|
|
|
|
|
|
|
|
| |
|
Cumulative |
|
|
Average Annual |
|
| |
|
6-Month |
|
|
1-Year |
|
|
5-Year |
|
|
Since
Inception |
|
| JGH at Common Share NAV |
|
|
4.21% |
|
|
|
11.24% |
|
|
|
1.42% |
|
|
|
2.84% |
|
| JGH at Common Share Price |
|
|
4.81% |
|
|
|
7.90% |
|
|
|
2.50% |
|
|
|
3.38% |
|
| Bloomberg Global High Yield Index (USD Hedged) |
|
|
4.94% |
|
|
|
10.12% |
|
|
|
2.59% |
|
|
|
3.67% |
|
| * |
For purposes of Fund performance, relative results are measured against the Bloomberg Global High Yield Index (USD
Hedged). |
Since inception returns are from 11/24/14. Performance data shown represents past performance and does not predict or guarantee future
results. Current performance may be higher or lower than the data shown. Returns do not reflect the deduction of taxes that shareholders may have to pay on Fund distributions or upon the sale of Fund shares. Returns at NAV are net of Fund expenses,
and assume reinvestment of distributions. Comparative index return information is provided for the Fund’s shares at NAV only. Indexes are not available for direct investment.
Daily Common Share NAV and Share Price
11
This data relates to the securities held in the
Fund’s portfolio of investments as of the end of the reporting period. It should not be construed as a measure of performance for the Fund itself. Holdings are subject to change.
The Fund uses credit quality ratings for its portfolio securities provided by Standard & Poor’s Group, Moody’s Investors Service, Inc. and Fitch, Inc. If
all three provide a rating for a security, the middle is used; if two of the three agencies rate a security, the lower rating is used; and if only one rating agency rates a security, that rating is used. This treatment of split-rated securities may
differ from that used for other purposes, such as for Fund investment policies. Credit ratings are subject to change. AAA, AA, A and BBB are investment grade ratings; BB, B, CCC, CC, C and D are below-investment grade ratings. Holdings designated
N/R are not rated by these national rating agencies.
Fund Allocation
(% of net
assets)
|
|
|
|
|
| Corporate Bonds |
|
|
94.5% |
|
| Sovereign Debt |
|
|
14.7% |
|
| $1000 Par (or similar) Institutional Preferred |
|
|
9.9% |
|
| Variable Rate Senior Loan Interests |
|
|
9.3% |
|
| Contingent Capital Securities |
|
|
5.3% |
|
| $25 Par (or similar) Retail Preferred |
|
|
1.3% |
|
| Common Stocks |
|
|
0.2% |
|
| Asset-Backed Securities |
|
|
0.2% |
|
| Repurchase Agreements |
|
|
4.0% |
|
| Other Assets Less Liabilities, Net |
|
|
1.0% |
|
| Borrowings |
|
|
(40.4)% |
|
| Net Assets |
|
|
100% |
|
Top Five Issuers
(% of total investments)
|
|
|
|
|
| Tenet Healthcare Corp |
|
|
1.3% |
|
| EQM Midstream Partners LP |
|
|
1.3% |
|
| Albion Financing 2SARL |
|
|
1.2% |
|
| Presidio Holdings Inc |
|
|
1.2% |
|
| Colombia Government International Bond |
|
|
1.1% |
|
Portfolio Composition1
(% of total investments)
|
|
|
|
|
| Oil, Gas & Consumable Fuels |
|
|
12.5% |
|
| Sovereign Debt |
|
|
10.5% |
|
| Banks |
|
|
5.4% |
|
| Media |
|
|
4.8% |
|
| Metals & Mining |
|
|
3.6% |
|
| Insurance |
|
|
3.6% |
|
| Specialty Retail |
|
|
3.3% |
|
| Electric Utilities |
|
|
3.1% |
|
| IT Services |
|
|
3.1% |
|
| Chemicals |
|
|
2.8% |
|
| Hotels, Restaurants & Leisure |
|
|
2.8% |
|
| Diversified Telecommunication Services |
|
|
2.7% |
|
| Trading Companies & Distributors |
|
|
2.7% |
|
| Health Care Providers & Services |
|
|
2.6% |
|
| Wireless Telecommunication Services |
|
|
2.4% |
|
| Capital Markets |
|
|
2.2% |
|
| Automobile Components |
|
|
2.2% |
|
| Beverages |
|
|
2.1% |
|
| Gas Utilities |
|
|
1.9% |
|
| Passenger Airlines |
|
|
1.8% |
|
| Pharmaceuticals |
|
|
1.8% |
|
| Asset-Backed Securities |
|
|
0.2% |
|
| Other |
|
|
19.1% |
|
| Repurchase Agreements |
|
|
2.8% |
|
| Total |
|
|
100% |
|
Portfolio Credit Quality
(%
of total long-term investments)
|
|
|
|
|
| BBB |
|
|
11.0% |
|
| BB or Lower |
|
|
88.0% |
|
| N/R (not rated) |
|
|
0.8% |
|
| N/A (not applicable) |
|
|
0.2% |
|
| Total |
|
|
100% |
|
Country Allocation2
(% of total investments)
|
|
|
|
|
| United States |
|
|
56.3% |
|
| Canada |
|
|
5.7% |
|
| Mexico |
|
|
3.3% |
|
| Colombia |
|
|
2.6% |
|
| Australia |
|
|
2.4% |
|
| United Kingdom |
|
|
2.0% |
|
| Luxembourg |
|
|
2.0% |
|
| Netherlands |
|
|
1.9% |
|
| Israel |
|
|
1.8% |
|
| France |
|
|
1.6% |
|
| South Africa |
|
|
1.4% |
|
| Other3 |
|
|
19.0% |
|
| Total |
|
|
100% |
|
| 1 |
See the Portfolio of Investments for the remaining industries/sectors comprising “Other” and not listed in the
table above. |
| 2 |
Includes 25.0% (as a percentage of total investments) in emerging market countries. |
| 3 |
“Other” countries include thirty-nine countries that individually constitute less than 1.3% as a percentage of
total investments. |
12
|
|
|
| NPCT |
|
Nuveen Core Plus Impact Fund
Performance Overview and Holding Summaries as of June 30, 2023 |
Refer to Glossary of Terms Used in this Report for further definition of terms used in this
section.
Cumulative Total Returns as of June 30, 2023*
|
|
|
|
|
|
|
|
|
|
|
|
|
| |
|
Cumulative |
|
|
Average Annual |
|
| |
|
6-Month |
|
|
1-Year |
|
|
Since
Inception |
|
| NPCT at Common Share NAV |
|
|
0.89% |
|
|
|
(3.97)% |
|
|
|
(15.11)% |
|
| NPCT at Common Share Price |
|
|
1.27% |
|
|
|
(5.36)% |
|
|
|
(20.81)% |
|
| Bloomberg U.S. Aggregate Bond Index |
|
|
2.09% |
|
|
|
(0.94)% |
|
|
|
(11.13)% |
|
| NPCT Blended Benchmark |
|
|
3.56% |
|
|
|
3.87% |
|
|
|
(3.23)% |
|
| * |
For purposes of Fund performance, relative results are measured against the NPCT Blended Benchmark. The Fund’s
Blended Benchmark consists of: 1) 60% of Bloomberg MSCI U.S. Green Bond Index and 2) 40% Bloomberg U.S. Corporate High Yield Bond Index. |
Since
inception returns are from 4/27/21. Performance data shown represents past performance and does not predict or guarantee future results. Current performance may be higher or lower than the data shown. Returns do not reflect the deduction of taxes
that shareholders may have to pay on Fund distributions or upon the sale of Fund shares. Returns at NAV are net of Fund expenses, and assume reinvestment of distributions. Comparative index return information is provided for the Fund’s shares
at NAV only. Indexes are not available for direct investment.
Daily Common Share NAV and Share Price
13
This data relates to the securities held in the
Fund’s portfolio of investments as of the end of the reporting period. It should not be construed as a measure of performance for the Fund itself. Holdings are subject to change.
The Fund uses credit quality ratings for its portfolio securities provided by Standard & Poor’s Group, Moody’s Investors Service, Inc. and Fitch, Inc. If
all three provide a rating for a security, the middle is used; if two of the three agencies rate a security, the lower rating is used; and if only one rating agency rates a security, that rating is used. This treatment of split-rated securities may
differ from that used for other purposes, such as for Fund investment policies. Credit ratings are subject to change. AAA, AA, A and BBB are investment grade ratings; BB, B, CCC, CC, C and D are below-investment grade ratings. Holdings designated
N/R are not rated by these national rating agencies.
Fund Allocation
(% of net
assets)
|
|
|
|
|
| Corporate Bonds |
|
|
95.5% |
|
| $1000 Par (or similar) Institutional Preferred |
|
|
22.5% |
|
| Asset-Backed Securities |
|
|
13.5% |
|
| Mortgage-Backed Securities |
|
|
10.2% |
|
| Sovereign Debt |
|
|
6.7% |
|
| $25 Par (or similar) Retail Preferred |
|
|
6.1% |
|
| Municipal Bonds |
|
|
3.4% |
|
| Variable Rate Senior Loan Interests |
|
|
3.0% |
|
| Repurchase Agreements |
|
|
1.8% |
|
| Other Assets Less Liabilities, Net |
|
|
2.3% |
|
| Borrowings |
|
|
(31.0)% |
|
| Reverse Repurchase Agreements, including accrued interest |
|
|
(13.5)% |
|
| TFP Shares, Net |
|
|
(20.5)% |
|
| Net Assets |
|
|
100% |
|
Portfolio Composition1
(% of total investments)
|
|
|
|
|
| Electric Utilities |
|
|
13.7% |
|
| Banks |
|
|
12.8% |
|
| Asset-Backed Securities |
|
|
8.3% |
|
| Mortgage-Backed Securities |
|
|
6.3% |
|
| Independent Power and Renewable Electricity Producers |
|
|
6.2% |
|
| Multi-Utilities |
|
|
4.3% |
|
| Sovereign Debt |
|
|
4.1% |
|
| Trading Companies & Distributors |
|
|
3.4% |
|
| Chemicals |
|
|
2.8% |
|
| Automobiles |
|
|
2.6% |
|
| Insurance |
|
|
2.6% |
|
| Gas Utilities |
|
|
2.6% |
|
| Capital Markets |
|
|
2.4% |
|
| Oil, Gas & Consumable Fuels |
|
|
2.2% |
|
| Municipal Bonds |
|
|
2.1% |
|
| Commercial Services & Supplies |
|
|
2.0% |
|
| Diversified REITs |
|
|
1.9% |
|
| Other |
|
|
18.6% |
|
| Repurchase Agreements |
|
|
1.1% |
|
| Total |
|
|
100% |
|
Portfolio Credit Quality
(%
of total long-term investments)
|
|
|
|
|
| AAA |
|
|
0.6% |
|
| AA |
|
|
3.2% |
|
| A |
|
|
10.2% |
|
| BBB |
|
|
40.6% |
|
| BB or Lower |
|
|
35.4% |
|
| N/R (not rated) |
|
|
10.0% |
|
| Total |
|
|
100% |
|
Country Allocation2
(% of total investments)
|
|
|
|
|
| United States |
|
|
59.9% |
|
| Italy |
|
|
4.3% |
|
| Chile |
|
|
4.0% |
|
| United Kingdom |
|
|
3.7% |
|
| Mexico |
|
|
3.1% |
|
| Australia |
|
|
2.7% |
|
| Canada |
|
|
2.6% |
|
| Switzerland |
|
|
2.6% |
|
| Indonesia |
|
|
2.3% |
|
| India |
|
|
2.2% |
|
| South Korea |
|
|
1.5% |
|
| Other3 |
|
|
11.1% |
|
| Total |
|
|
100% |
|
| 1 |
See the Portfolio of Investments for the remaining industries/sectors comprising “Other” and not listed in the
table above. |
| 2 |
Includes 21.0% (as a percentage of total investments) in emerging market countries. |
| 3 |
“Other” countries include twelve countries that individually constitute less than 1.5% as a percentage of total
investments. |
14
|
|
|
| JLS |
|
Nuveen Mortgage and Income Fund
Performance Overview and Holding Summaries as of June 30, 2023 |
Refer to Glossary of Terms Used in this Report for further definition of terms used in this
section.
Average Annual Total Returns as of June 30, 2023*
|
|
|
|
|
|
|
|
|
|
|
|
|
|
|
|
|
| |
|
Cumulative |
|
|
Average Annual |
|
| |
|
6-Month |
|
|
1-Year |
|
|
5-Year |
|
|
10-Year |
|
| JLS at Common Share NAV |
|
|
4.33% |
|
|
|
5.61% |
|
|
|
1.00% |
|
|
|
3.89% |
|
| JLS at Common Share Price |
|
|
4.11% |
|
|
|
5.57% |
|
|
|
(1.11)% |
|
|
|
3.09% |
|
| Bloomberg U.S. Aggregate Bond Index |
|
|
2.09% |
|
|
|
(0.94)% |
|
|
|
0.77% |
|
|
|
1.52% |
|
| JLS Blended Benchmark |
|
|
1.68% |
|
|
|
0.16% |
|
|
|
1.82% |
|
|
|
2.04% |
|
| * |
For purposes of Fund performance, relative results are measured against the JLS Blended Benchmark. The Fund’s Blended
Benchmark, the ICE BofA U.S. ABS & CMBS Index, consists of a 50/50 blend of USD-denominated, investment grade fixed- and floating-rate asset-backed securities (ABS) and fixed-rate commercial mortgage-backed securities (CMBS) publicly issued in
the U.S. The Fund’s performance was measured against the Bloomberg U.S. Aggregate Bond Index through October 13, 2019. |
Performance prior to
October 14, 2019, reflects the Fund’s performance under the management of a sub-adviser using investment strategies that differed from those currently in place. Performance data shown represents past
performance and does not predict or guarantee future results. Current performance may be higher or lower than the data shown. Returns do not reflect the deduction of taxes that shareholders may have to pay on Fund distributions or upon the sale of
Fund shares. Returns at NAV are net of Fund expenses, and assume reinvestment of distributions. Comparative index return information is provided for the Fund’s shares at NAV only. Indexes are not available for direct investment.
Daily Common Share NAV and Share Price
15
This data relates to the securities held in the
Fund’s portfolio of investments as of the end of the reporting period. It should not be construed as a measure of performance for the Fund itself. Holdings are subject to change.
The ratings disclosed are the highest rating given by one of the following national rating agencies: Standard & Poor’s Group, Moody’s Investors
Service, Inc. or Fitch, Inc. This treatment of split-rated securities may differ from that used for other purposes, such as for Fund investment policies. Credit ratings are subject to change. AAA, AA, A and BBB are investment grade ratings; BB, B,
CCC, CC, C and D are below-investment grade ratings. Holdings designated N/R are not rated by these national rating agencies.
Fund Allocation
(% of net
assets)
|
|
|
|
|
| Mortgage-Backed Securities |
|
|
98.5% |
|
| Asset-Backed Securities |
|
|
39.7% |
|
| U.S. Government and Agency Obligations |
|
|
3.0% |
|
| Other Assets Less Liabilities, Net |
|
|
(1.2)% |
|
| Borrowings |
|
|
(9.3)% |
|
| Reverse Repurchase Agreements, including accrued interest |
|
|
(30.7)% |
|
| Net Assets |
|
|
100% |
|
Portfolio Credit Quality
(%
of total investments)
|
|
|
|
|
| U.S. Treasury/Agency |
|
|
2.2% |
|
| AAA |
|
|
0.1% |
|
| AA |
|
|
2.1% |
|
| A |
|
|
11.0% |
|
| BBB |
|
|
19.8% |
|
| BB or Lower |
|
|
36.7% |
|
| N/R (not rated) |
|
|
28.1% |
|
| Total |
|
|
100% |
|
16
Shareholder Meeting Report
The annual meeting of shareholders was held on May 8, 2023 for JGH, JLS and NPCT; at this meeting
the shareholders were asked to elect Board members.
|
|
|
|
|
|
|
|
|
|
|
|
|
|
|
|
|
| |
|
JGH |
|
|
JLS |
|
|
NPCT |
|
| |
|
Common
Shares |
|
|
Common
Shares |
|
|
Common and
Preferred
shares voting
together
as a class |
|
|
Preferred
Shares |
|
| Approval of the Board Members was reached as follows: |
|
|
|
|
|
|
|
|
|
|
|
|
|
|
|
|
| Amy B.R. Lancellotta |
|
|
|
|
|
|
|
|
|
|
|
|
|
|
|
|
| For |
|
|
17,889,948 |
|
|
|
3,281,093 |
|
|
|
17,751,797 |
|
|
|
— |
|
| Withhold |
|
|
581,641 |
|
|
|
86,903 |
|
|
|
5,683,686 |
|
|
|
— |
|
| Total |
|
|
18,471,589 |
|
|
|
3,367,996 |
|
|
|
23,435,483 |
|
|
|
— |
|
| John K. Nelson |
|
|
|
|
|
|
|
|
|
|
|
|
|
|
|
|
| For |
|
|
17,033,002 |
|
|
|
3,276,021 |
|
|
|
17,583,558 |
|
|
|
— |
|
| Withhold |
|
|
1,438,587 |
|
|
|
91,975 |
|
|
|
5,851,925 |
|
|
|
— |
|
| Total |
|
|
18,471,589 |
|
|
|
3,367,996 |
|
|
|
23,435,483 |
|
|
|
— |
|
| Terence J. Toth |
|
|
|
|
|
|
|
|
|
|
|
|
|
|
|
|
| For |
|
|
17,880,243 |
|
|
|
3,277,031 |
|
|
|
17,764,869 |
|
|
|
— |
|
| Withhold |
|
|
591,346 |
|
|
|
90,965 |
|
|
|
5,670,614 |
|
|
|
— |
|
| Total |
|
|
18,471,589 |
|
|
|
3,367,996 |
|
|
|
23,435,483 |
|
|
|
— |
|
| Robert L. Young |
|
|
|
|
|
|
|
|
|
|
|
|
|
|
|
|
| For |
|
|
17,050,862 |
|
|
|
3,279,392 |
|
|
|
17,609,112 |
|
|
|
— |
|
| Withhold |
|
|
1,420,727 |
|
|
|
88,604 |
|
|
|
5,826,371 |
|
|
|
— |
|
| Total |
|
|
18,471,589 |
|
|
|
3,367,996 |
|
|
|
23,435,483 |
|
|
|
— |
|
| William C. Hunter |
|
|
|
|
|
|
|
|
|
|
|
|
|
|
|
|
| For |
|
|
— |
|
|
|
— |
|
|
|
— |
|
|
|
70,000 |
|
| Withhold |
|
|
— |
|
|
|
— |
|
|
|
— |
|
|
|
— |
|
| Total |
|
|
— |
|
|
|
— |
|
|
|
— |
|
|
|
70,000 |
|
| Albin F. Moschner |
|
|
|
|
|
|
|
|
|
|
|
|
|
|
|
|
| For |
|
|
— |
|
|
|
— |
|
|
|
— |
|
|
|
70,000 |
|
| Withhold |
|
|
— |
|
|
|
— |
|
|
|
— |
|
|
|
— |
|
| Total |
|
|
— |
|
|
|
— |
|
|
|
— |
|
|
|
70,000 |
|
17
|
|
|
| JGH |
|
Nuveen Global High Income Fund
Portfolio of Investments June 30, 2023 |
| |
|
(Unaudited) |
|
|
|
|
|
|
|
|
|
|
|
|
|
|
|
|
|
|
|
|
|
Principal
Amount (000) |
|
|
Description (1) |
|
Coupon |
|
|
Maturity |
|
|
Ratings (2) |
|
|
Value |
|
|
|
|
|
|
|
|
|
|
LONG-TERM INVESTMENTS – 135.4% (97.2% of Total Investments) |
|
|
|
|
|
|
|
|
|
|
|
|
|
|
|
|
|
|
|
|
|
|
CORPORATE BONDS – 94.5% (67.8% of Total Investments) |
|
|
|
|
|
|
|
|
|
|
|
|
|
|
|
|
|
|
|
| |
|
|
Air Freight & Logistics – 0.1% |
|
|
|
|
|
|
|
|
|
|
|
|
|
|
|
|
|
|
| $ |
500 |
|
|
Cargo Aircraft Management Inc, 144A |
|
|
4.750% |
|
|
|
2/01/28 |
|
|
|
BB |
|
|
$ |
438,035 |
|
|
|
|
|
Total Air Freight & Logistics |
|
|
|
|
|
|
|
|
|
|
|
|
|
|
438,035 |
|
|
|
|
|
|
|
| |
|
|
Automobile Components – 2.7% |
|
|
|
|
|
|
|
|
|
|
|
|
|
|
|
|
|
|
| |
3,000 |
|
|
Dana Inc |
|
|
4.250% |
|
|
|
9/01/30 |
|
|
|
BB+ |
|
|
|
2,497,603 |
|
| |
3,000 |
|
|
Goodyear Tire & Rubber Co/The |
|
|
5.250% |
|
|
|
4/30/31 |
|
|
|
BB- |
|
|
|
2,635,010 |
|
| |
3,000 |
|
|
IHO Verwaltungs GmbH, 144A , (cash 6.375%, PIK 7.125%) |
|
|
6.375% |
|
|
|
5/15/29 |
|
|
|
Ba2 |
|
|
|
2,780,320 |
|
|
|
|
|
Total Automobile Components |
|
|
|
|
|
|
|
|
|
|
|
|
|
|
7,912,933 |
|
|
|
|
|
|
|
| |
|
|
Automobiles – 1.0% |
|
|
|
|
|
|
|
|
|
|
|
|
|
|
|
|
|
|
| |
1,200 |
|
|
Ford Motor Credit Co LLC |
|
|
7.350% |
|
|
|
11/04/27 |
|
|
|
BB+ |
|
|
|
1,225,344 |
|
| |
1,810 |
|
|
Ford Motor Credit Co LLC |
|
|
7.350% |
|
|
|
3/06/30 |
|
|
|
BB+ |
|
|
|
1,848,448 |
|
|
|
|
|
Total Automobiles |
|
|
|
|
|
|
|
|
|
|
|
|
|
|
3,073,792 |
|
|
|
|
|
|
|
| |
|
|
Banks – 1.4% |
|
|
|
|
|
|
|
|
|
|
|
|
|
|
|
|
|
|
| |
875 |
|
|
Access Bank PLC, 144A |
|
|
6.125% |
|
|
|
9/21/26 |
|
|
|
B- |
|
|
|
734,213 |
|
| |
1,000 |
|
|
Akbank TAS, 144A |
|
|
6.800% |
|
|
|
2/06/26 |
|
|
|
B3 |
|
|
|
952,800 |
|
| |
1,250 |
|
|
Grupo Aval Ltd, 144A |
|
|
4.375% |
|
|
|
2/04/30 |
|
|
|
BB+ |
|
|
|
980,669 |
|
| |
1,525 |
|
|
Turkiye Vakiflar Bankasi TAO, 144A |
|
|
5.500% |
|
|
|
10/01/26 |
|
|
|
B- |
|
|
|
1,342,396 |
|
|
|
|
|
Total Banks |
|
|
|
|
|
|
|
|
|
|
|
|
|
|
4,010,078 |
|
|
|
|
|
|
|
| |
|
|
Beverages – 2.0% |
|
|
|
|
|
|
|
|
|
|
|
|
|
|
|
|
|
|
| |
3,500 |
|
|
Primo Water Holdings Inc, 144A |
|
|
4.375% |
|
|
|
4/30/29 |
|
|
|
B1 |
|
|
|
2,998,975 |
|
| |
3,425 |
|
|
Triton Water Holdings Inc, 144A |
|
|
6.250% |
|
|
|
4/01/29 |
|
|
|
CCC+ |
|
|
|
2,939,404 |
|
|
|
|
|
Total Beverages |
|
|
|
|
|
|
|
|
|
|
|
|
|
|
5,938,379 |
|
|
|
|
|
|
|
| |
|
|
Biotechnology – 0.3% |
|
|
|
|
|
|
|
|
|
|
|
|
|
|
|
|
|
|
| |
1,500 |
|
|
Emergent BioSolutions Inc, 144A |
|
|
3.875% |
|
|
|
8/15/28 |
|
|
|
B |
|
|
|
872,407 |
|
|
|
|
|
Total Biotechnology |
|
|
|
|
|
|
|
|
|
|
|
|
|
|
872,407 |
|
|
|
|
|
|
|
| |
|
|
Broadline Retail – 0.5% |
|
|
|
|
|
|
|
|
|
|
|
|
|
|
|
|
|
|
| |
650 |
|
|
B2W Digital Lux Sarl, 144A (3) |
|
|
4.375% |
|
|
|
12/20/30 |
|
|
|
C |
|
|
|
111,475 |
|
| |
2,000 |
|
|
Kohl’s Corp |
|
|
4.625% |
|
|
|
5/01/31 |
|
|
|
BBB- |
|
|
|
1,391,560 |
|
|
|
|
|
Total Broadline Retail |
|
|
|
|
|
|
|
|
|
|
|
|
|
|
1,503,035 |
|
|
|
|
|
|
|
| |
|
|
Capital Markets – 2.8% |
|
|
|
|
|
|
|
|
|
|
|
|
|
|
|
|
|
|
| |
135 |
|
|
AG TTMT Escrow Issuer LLC, 144A |
|
|
8.625% |
|
|
|
9/30/27 |
|
|
|
B1 |
|
|
|
138,370 |
|
| |
2,000 |
|
|
Compass Group Diversified Holdings LLC, 144A |
|
|
5.000% |
|
|
|
1/15/32 |
|
|
|
B+ |
|
|
|
1,614,285 |
|
| |
600 |
|
|
Compass Group Diversified Holdings LLC, 144A |
|
|
5.250% |
|
|
|
4/15/29 |
|
|
|
B+ |
|
|
|
525,911 |
|
| |
2,000 |
|
|
Hunt Cos Inc, 144A |
|
|
5.250% |
|
|
|
4/15/29 |
|
|
|
BB- |
|
|
|
1,588,062 |
|
| |
1,550 |
|
|
Icahn Enterprises LP / Icahn Enterprises Finance Corp |
|
|
4.375% |
|
|
|
2/01/29 |
|
|
|
BB |
|
|
|
1,217,835 |
|
| |
1,275 |
|
|
Icahn Enterprises LP / Icahn Enterprises Finance Corp |
|
|
5.250% |
|
|
|
5/15/27 |
|
|
|
BB |
|
|
|
1,099,560 |
|
| |
1,250 |
|
|
NFP Corp, 144A |
|
|
6.875% |
|
|
|
8/15/28 |
|
|
|
CCC+ |
|
|
|
1,085,025 |
|
| |
1,000 |
|
|
NFP Corp, 144A |
|
|
7.500% |
|
|
|
10/01/30 |
|
|
|
B1 |
|
|
|
968,205 |
|
|
|
|
|
Total Capital Markets |
|
|
|
|
|
|
|
|
|
|
|
|
|
|
8,237,253 |
|
|
|
|
|
|
|
| |
|
|
Chemicals – 3.0% |
|
|
|
|
|
|
|
|
|
|
|
|
|
|
|
|
|
|
| |
905 |
|
|
ASP Unifrax Holdings Inc, 144A |
|
|
5.250% |
|
|
|
9/30/28 |
|
|
|
BB |
|
|
|
653,347 |
|
| |
495 |
|
|
Avient Corp, 144A |
|
|
7.125% |
|
|
|
8/01/30 |
|
|
|
BB- |
|
|
|
500,655 |
|
| |
1,905 |
|
|
EverArc Escrow Sarl, 144A |
|
|
5.000% |
|
|
|
10/30/29 |
|
|
|
B+ |
|
|
|
1,513,770 |
|
| |
600 |
|
|
OCP SA, 144A |
|
|
5.125% |
|
|
|
6/23/51 |
|
|
|
BB+ |
|
|
|
435,312 |
|
| |
1,160 |
|
|
Olympus Water US Holding Corp, 144A |
|
|
6.250% |
|
|
|
10/01/29 |
|
|
|
CCC+ |
|
|
|
839,029 |
|
18
|
|
|
|
|
|
|
|
|
|
|
|
|
|
|
|
|
|
|
|
|
Principal
Amount (000) |
|
|
Description (1) |
|
Coupon |
|
|
Maturity |
|
|
Ratings (2) |
|
|
Value |
|
|
|
|
|
|
|
| |
|
|
Chemicals (continued) |
|
|
|
|
|
|
|
|
|
|
|
|
|
|
|
|
|
|
|
$
|
960 |
|
|
Olympus Water US Holding Corp, 144A |
|
|
4.250% |
|
|
|
10/01/28 |
|
|
|
B- |
|
|
$
|
758,925 |
|
| |
1,500 |
|
|
Sasol Financing USA LLC |
|
|
5.500% |
|
|
|
3/18/31 |
|
|
|
BB+ |
|
|
|
1,179,640 |
|
| |
500 |
|
|
Sasol Financing USA LLC, 144A |
|
|
8.750% |
|
|
|
5/03/29 |
|
|
|
BB+ |
|
|
|
487,071 |
|
| |
2,000 |
|
|
Trinseo Materials Operating SCA / Trinseo Materials Finance Inc, 144A |
|
|
5.125% |
|
|
|
4/01/29 |
|
|
|
B3 |
|
|
|
925,000 |
|
| |
1,600 |
|
|
Tronox Inc, 144A |
|
|
4.625% |
|
|
|
3/15/29 |
|
|
|
BB- |
|
|
|
1,329,653 |
|
| |
380 |
|
|
WR Grace Holdings LLC, 144A |
|
|
4.875% |
|
|
|
6/15/27 |
|
|
|
BB+ |
|
|
|
352,424 |
|
|
|
|
|
Total Chemicals |
|
|
|
|
|
|
|
|
|
|
|
|
|
|
8,974,826 |
|
|
|
|
|
|
|
| |
|
|
Commercial Services & Supplies – 2.3% |
|
|
|
|
|
|
|
|
|
|
|
|
|
|
|
|
|
|
| |
1,275 |
|
|
ADT Security Corp/The, 144A |
|
|
4.875% |
|
|
|
7/15/32 |
|
|
|
BB |
|
|
|
1,090,125 |
|
| |
1,750 |
|
|
ADT Security Corp/The, 144A |
|
|
4.125% |
|
|
|
8/01/29 |
|
|
|
BB |
|
|
|
1,511,562 |
|
| |
2,000 |
|
|
Allied Universal Holdco LLC/Allied Universal Finance Corp/Atlas Luxco 4 Sarl, 144A |
|
|
4.625% |
|
|
|
6/01/28 |
|
|
|
B |
|
|
|
1,692,940 |
|
| |
1,500 |
|
|
Garda World Security Corp, 144A |
|
|
4.625% |
|
|
|
2/15/27 |
|
|
|
BB |
|
|
|
1,372,502 |
|
| |
1,100 |
|
|
Prime Security Services Borrower LLC / Prime Finance Inc,
144A |
|
|
6.250% |
|
|
|
1/15/28 |
|
|
|
B |
|
|
|
1,030,482 |
|
|
|
|
|
Total Commercial Services & Supplies |
|
|
|
|
|
|
|
|
|
|
|
|
|
|
6,697,611 |
|
|
|
|
|
|
|
| |
|
|
Communications Equipment – 0.7% |
|
|
|
|
|
|
|
|
|
|
|
|
|
|
|
|
|
|
| |
2,000 |
|
|
Viasat Inc, 144A |
|
|
5.625% |
|
|
|
9/15/25 |
|
|
|
BB- |
|
|
|
1,937,980 |
|
|
|
|
|
Total Communications Equipment |
|
|
|
|
|
|
|
|
|
|
|
|
|
|
1,937,980 |
|
|
|
|
|
|
|
| |
|
|
Construction Materials – 0.9% |
|
|
|
|
|
|
|
|
|
|
|
|
|
|
|
|
|
|
| |
625 |
|
|
Cemex SAB de CV, 144A |
|
|
5.125% |
|
|
|
9/08/71 |
|
|
|
BB- |
|
|
|
556,215 |
|
| |
1,325 |
|
|
Cemex SAB de CV, 144A |
|
|
9.125% |
|
|
|
12/30/49 |
|
|
|
BB- |
|
|
|
1,341,890 |
|
| |
750 |
|
|
Cemex SAB de CV, 144A |
|
|
3.875% |
|
|
|
7/11/31 |
|
|
|
BB+ |
|
|
|
631,428 |
|
| |
214 |
|
|
Volcan Cia Minera SAA, 144A |
|
|
4.375% |
|
|
|
2/11/26 |
|
|
|
B+ |
|
|
|
159,151 |
|
|
|
|
|
Total Construction Materials |
|
|
|
|
|
|
|
|
|
|
|
|
|
|
2,688,684 |
|
|
|
|
|
|
|
| |
|
|
Containers & Packaging – 1.8% |
|
|
|
|
|
|
|
|
|
|
|
|
|
|
|
|
|
|
| |
900 |
|
|
Ardagh Metal Packaging Finance USA LLC / Ardagh Metal Packaging Finance PLC, 144A |
|
|
4.000% |
|
|
|
9/01/29 |
|
|
|
B+ |
|
|
|
712,794 |
|
| |
1,400 |
|
|
LABL Inc, 144A |
|
|
5.875% |
|
|
|
11/01/28 |
|
|
|
B2 |
|
|
|
1,273,273 |
|
| |
1,000 |
|
|
LABL Inc, 144A |
|
|
8.250% |
|
|
|
11/01/29 |
|
|
|
CCC+ |
|
|
|
836,250 |
|
| |
1,070 |
|
|
Mauser Packaging Solutions Holding Co, 144A |
|
|
7.875% |
|
|
|
8/15/26 |
|
|
|
B |
|
|
|
1,063,054 |
|
| |
585 |
|
|
Owens-Brockway Glass Container Inc, 144A |
|
|
7.250% |
|
|
|
5/15/31 |
|
|
|
B+ |
|
|
|
592,312 |
|
| |
945 |
|
|
Pactiv Evergreen Group Issuer Inc/Pactiv Evergreen Group Issuer
LLC, 144A |
|
|
4.375% |
|
|
|
9/30/28 |
|
|
|
B+ |
|
|
|
818,242 |
|
|
|
|
|
Total Containers & Packaging |
|
|
|
|
|
|
|
|
|
|
|
|
|
|
5,295,925 |
|
|
|
|
|
|
|
| |
|
|
Diversified Telecommunication Services – 3.4% |
|
|
|
|
|
|
|
|
|
|
|
|
|
|
|
|
|
|
| |
1,830 |
|
|
Altice France SA/France, 144A |
|
|
5.500% |
|
|
|
10/15/29 |
|
|
|
B2 |
|
|
|
1,308,710 |
|
| |
1,000 |
|
|
Cablevision Lightpath LLC, 144A |
|
|
3.875% |
|
|
|
9/15/27 |
|
|
|
B1 |
|
|
|
837,500 |
|
| |
1,905 |
|
|
Frontier Communications Holdings LLC, 144A |
|
|
6.000% |
|
|
|
1/15/30 |
|
|
|
BB- |
|
|
|
1,401,282 |
|
| |
1,500 |
|
|
Frontier Communications Holdings LLC, 144A |
|
|
8.625% |
|
|
|
3/15/31 |
|
|
|
BB+ |
|
|
|
1,451,712 |
|
| |
1,155 |
|
|
Iliad Holding SASU, 144A |
|
|
6.500% |
|
|
|
10/15/26 |
|
|
|
BB- |
|
|
|
1,090,116 |
|
| |
2,375 |
|
|
Iliad Holding SASU, 144A |
|
|
7.000% |
|
|
|
10/15/28 |
|
|
|
BB- |
|
|
|
2,188,905 |
|
| |
2,500 |
|
|
Level 3 Financing Inc, 144A |
|
|
4.625% |
|
|
|
9/15/27 |
|
|
|
B1 |
|
|
|
1,739,505 |
|
|
|
|
|
Total Diversified Telecommunication Services |
|
|
|
|
|
|
|
|
|
|
|
|
|
|
10,017,730 |
|
|
|
|
|
|
|
| |
|
|
Electric Utilities – 2.3% |
|
|
|
|
|
|
|
|
|
|
|
|
|
|
|
|
|
|
| |
750 |
|
|
AES Espana BV, 144A |
|
|
5.700% |
|
|
|
5/04/28 |
|
|
|
BB- |
|
|
|
671,250 |
|
| |
800 |
|
|
Electricidad Firme de Mexico Holdings SA de CV, 144A |
|
|
4.900% |
|
|
|
11/20/26 |
|
|
|
Ba2 |
|
|
|
703,000 |
|
| |
1,400 |
|
|
Eskom Holdings SOC Ltd, 144A |
|
|
6.350% |
|
|
|
8/10/28 |
|
|
|
Ba2 |
|
|
|
1,302,112 |
|
| |
750 |
|
|
NPC Ukrenergo, 144A |
|
|
6.875% |
|
|
|
11/09/28 |
|
|
|
Ca |
|
|
|
157,500 |
|
| |
3,750 |
|
|
Talen Energy Supply LLC, 144A |
|
|
8.625% |
|
|
|
6/01/30 |
|
|
|
BB+ |
|
|
|
3,881,250 |
|
|
|
|
|
Total Electric Utilities |
|
|
|
|
|
|
|
|
|
|
|
|
|
|
6,715,112 |
|
19
|
|
|
|
|
| JGH |
|
Nuveen Global High Income Fund (continued) |
| |
Portfolio of Investments June 30, 2023 |
|
|
(Unaudited) |
|
|
|
|
|
|
|
|
|
|
|
|
|
|
|
|
|
|
|
|
|
Principal
Amount (000) |
|
|
Description (1) |
|
Coupon |
|
|
Maturity |
|
|
Ratings (2) |
|
|
Value |
|
|
|
|
|
|
|
| |
|
|
Electrical Equipment – 0.3% |
|
|
|
|
|
|
|
|
|
|
|
|
|
|
|
|
|
|
| $ |
950 |
|
|
GrafTech Global Enterprises Inc, 144A |
|
|
9.875% |
|
|
|
12/15/28 |
|
|
|
BB |
|
|
$
|
942,875 |
|
|
|
|
|
Total Electrical Equipment |
|
|
|
|
|
|
|
|
|
|
|
|
|
|
942,875 |
|
|
|
|
|
|
|
| |
|
|
Electronic Equipment, Instruments & Components – 0.9% |
|
|
|
|
|
|
|
|
|
|
|
|
|
|
|
|
|
|
| |
3,125 |
|
|
Imola Merger Corp, 144A |
|
|
4.750% |
|
|
|
5/15/29 |
|
|
|
BB+ |
|
|
|
2,717,830 |
|
|
|
|
|
Total Electronic Equipment, Instruments &
Components |
|
|
|
|
|
|
|
|
|
|
|
|
|
|
2,717,830 |
|
|
|
|
|
|
|
| |
|
|
Energy Equipment & Services – 1.2% |
|
|
|
|
|
|
|
|
|
|
|
|
|
|
|
|
|
|
| |
1,200 |
|
|
Archrock Partners LP / Archrock Partners Finance Corp, 144A |
|
|
6.875% |
|
|
|
4/01/27 |
|
|
|
B+ |
|
|
|
1,152,000 |
|
| |
1,625 |
|
|
Archrock Partners LP / Archrock Partners Finance Corp, 144A |
|
|
6.250% |
|
|
|
4/01/28 |
|
|
|
B+ |
|
|
|
1,525,647 |
|
| |
445 |
|
|
Transocean Inc, 144A |
|
|
8.750% |
|
|
|
2/15/30 |
|
|
|
B2 |
|
|
|
451,675 |
|
| |
500 |
|
|
Transocean Titan Financing Ltd, 144A |
|
|
8.375% |
|
|
|
2/01/28 |
|
|
|
B2 |
|
|
|
510,625 |
|
|
|
|
|
Total Energy Equipment & Services |
|
|
|
|
|
|
|
|
|
|
|
|
|
|
3,639,947 |
|
|
|
|
|
|
|
| |
|
|
Entertainment – 0.4% |
|
|
|
|
|
|
|
|
|
|
|
|
|
|
|
|
|
|
| |
642 |
|
|
Cinemark USA Inc, 144A |
|
|
8.750% |
|
|
|
5/01/25 |
|
|
|
BB+ |
|
|
|
651,873 |
|
| |
530 |
|
|
Univision Communications Inc, 144A |
|
|
7.375% |
|
|
|
6/30/30 |
|
|
|
B+ |
|
|
|
504,622 |
|
|
|
|
|
Total Entertainment |
|
|
|
|
|
|
|
|
|
|
|
|
|
|
1,156,495 |
|
|
|
|
|
|
|
| |
|
|
Financial Services – 0.6% |
|
|
|
|
|
|
|
|
|
|
|
|
|
|
|
|
|
|
| |
1,125 |
|
|
Genesis Energy LP / Genesis Energy Finance Corp |
|
|
7.750% |
|
|
|
2/01/28 |
|
|
|
B |
|
|
|
1,070,020 |
|
| |
774 |
|
|
Mexico Remittances Funding Fiduciary Estate Management Sarl,
144A |
|
|
4.875% |
|
|
|
1/15/28 |
|
|
|
BB+ |
|
|
|
695,857 |
|
|
|
|
|
Total Financial Services |
|
|
|
|
|
|
|
|
|
|
|
|
|
|
1,765,877 |
|
|
|
|
|
|
|
| |
|
|
Gas Utilities – 2.7% |
|
|
|
|
|
|
|
|
|
|
|
|
|
|
|
|
|
|
| |
2,000 |
|
|
AmeriGas Partners LP / AmeriGas Finance Corp, 144A |
|
|
9.375% |
|
|
|
6/01/28 |
|
|
|
BB- |
|
|
|
2,031,240 |
|
| |
4,425 |
|
|
Ferrellgas LP / Ferrellgas Finance Corp, 144A |
|
|
5.875% |
|
|
|
4/01/29 |
|
|
|
B |
|
|
|
3,707,245 |
|
| |
250 |
|
|
Suburban Propane Partners LP/Suburban Energy Finance Corp, 144A |
|
|
5.000% |
|
|
|
6/01/31 |
|
|
|
BB- |
|
|
|
209,287 |
|
| |
2,250 |
|
|
Superior Plus LP / Superior General Partner Inc, 144A |
|
|
4.500% |
|
|
|
3/15/29 |
|
|
|
BB- |
|
|
|
1,972,395 |
|
|
|
|
|
Total Gas Utilities |
|
|
|
|
|
|
|
|
|
|
|
|
|
|
7,920,167 |
|
|
|
|
|
|
|
| |
|
|
Ground Transportation – 1.0% |
|
|
|
|
|
|
|
|
|
|
|
|
|
|
|
|
|
|
| |
1,340 |
|
|
First Student Bidco Inc / First Transit Parent Inc, 144A |
|
|
4.000% |
|
|
|
7/31/29 |
|
|
|
BB+ |
|
|
|
1,135,462 |
|
| |
1,750 |
|
|
Transnet SOC Ltd, 144A |
|
|
8.250% |
|
|
|
2/06/28 |
|
|
|
BB- |
|
|
|
1,699,688 |
|
|
|
|
|
Total Ground Transportation |
|
|
|
|
|
|
|
|
|
|
|
|
|
|
2,835,150 |
|
|
|
|
|
|
|
| |
|
|
Health Care Equipment & Supplies – 0.4% |
|
|
|
|
|
|
|
|
|
|
|
|
|
|
|
|
|
|
| |
1,495 |
|
|
Embecta Corp, 144A |
|
|
5.000% |
|
|
|
2/15/30 |
|
|
|
Ba3 |
|
|
|
1,241,269 |
|
|
|
|
|
Total Health Care Equipment & Supplies |
|
|
|
|
|
|
|
|
|
|
|
|
|
|
1,241,269 |
|
|
|
|
|
|
|
| |
|
|
Health Care Providers & Services – 2.5% |
|
|
|
|
|
|
|
|
|
|
|
|
|
|
|
|
|
|
| |
450 |
|
|
CHS/Community Health Systems Inc, 144A |
|
|
5.625% |
|
|
|
3/15/27 |
|
|
|
BB- |
|
|
|
396,557 |
|
| |
460 |
|
|
DaVita Inc, 144A |
|
|
3.750% |
|
|
|
2/15/31 |
|
|
|
B+ |
|
|
|
367,785 |
|
| |
2,000 |
|
|
Global Medical Response Inc, 144A |
|
|
6.500% |
|
|
|
10/01/25 |
|
|
|
CCC+ |
|
|
|
1,100,000 |
|
| |
2,400 |
|
|
Tenet Healthcare Corp |
|
|
4.375% |
|
|
|
1/15/30 |
|
|
|
BB- |
|
|
|
2,165,749 |
|
| |
3,500 |
|
|
Tenet Healthcare Corp |
|
|
6.125% |
|
|
|
10/01/28 |
|
|
|
B+ |
|
|
|
3,369,450 |
|
|
|
|
|
Total Health Care Providers & Services |
|
|
|
|
|
|
|
|
|
|
|
|
|
|
7,399,541 |
|
|
|
|
|
|
|
| |
|
|
Hotels, Restaurants & Leisure – 3.6% |
|
|
|
|
|
|
|
|
|
|
|
|
|
|
|
|
|
|
| |
1,050 |
|
|
CDI Escrow Issuer Inc, 144A |
|
|
5.750% |
|
|
|
4/01/30 |
|
|
|
B+ |
|
|
|
977,359 |
|
| |
1,980 |
|
|
Cinemark USA Inc, 144A |
|
|
5.250% |
|
|
|
7/15/28 |
|
|
|
B+ |
|
|
|
1,741,639 |
|
| |
835 |
|
|
Fertitta Entertainment LLC / Fertitta Entertainment Finance Co Inc, 144A |
|
|
4.625% |
|
|
|
1/15/29 |
|
|
|
B |
|
|
|
732,712 |
|
| |
400 |
|
|
Fertitta Entertainment LLC / Fertitta Entertainment Finance Co Inc, 144A |
|
|
6.750% |
|
|
|
7/15/30 |
|
|
|
CCC+ |
|
|
|
340,415 |
|
| |
1,400 |
|
|
International Game Technology PLC, 144A |
|
|
5.250% |
|
|
|
1/15/29 |
|
|
|
BBB- |
|
|
|
1,326,150 |
|
| |
1,700 |
|
|
Life Time Inc, 144A |
|
|
5.750% |
|
|
|
1/15/26 |
|
|
|
BB- |
|
|
|
1,656,706 |
|
| |
1,175 |
|
|
MGM China Holdings Ltd, 144A |
|
|
5.875% |
|
|
|
5/15/26 |
|
|
|
B+ |
|
|
|
1,119,188 |
|
| |
925 |
|
|
NCL Corp Ltd, 144A |
|
|
8.375% |
|
|
|
2/01/28 |
|
|
|
BB- |
|
|
|
966,573 |
|
| |
1,000 |
|
|
NCL Corp Ltd, 144A |
|
|
5.875% |
|
|
|
3/15/26 |
|
|
|
B- |
|
|
|
935,564 |
|
20
|
|
|
|
|
|
|
|
|
|
|
|
|
|
|
|
|
|
|
|
|
Principal
Amount (000) |
|
|
Description (1) |
|
Coupon |
|
|
Maturity |
|
|
Ratings (2) |
|
|
Value |
|
|
|
|
|
|
|
| |
|
|
Hotels, Restaurants & Leisure (continued) |
|
|
|
|
|
|
|
|
|
|
|
|
|
|
|
|
|
|
| $ |
1,000 |
|
|
Wynn Macau Ltd, 144A |
|
|
5.500% |
|
|
|
10/01/27 |
|
|
|
B+ |
|
|
$
|
890,000 |
|
|
|
|
|
Total Hotels, Restaurants & Leisure |
|
|
|
|
|
|
|
|
|
|
|
|
|
|
10,686,306 |
|
|
|
|
|
|
|
| |
|
|
Independent Power and Renewable Electricity Producers – 1.5% |
|
|
|
|
|
|
|
|
|
|
|
|
|
|
|
|
|
|
| |
2,815 |
|
|
Atlantica Sustainable Infrastructure PLC, 144A |
|
|
4.125% |
|
|
|
6/15/28 |
|
|
|
BB+ |
|
|
|
2,507,910 |
|
| |
1,000 |
|
|
EnfraGen Energia Sur SA / EnfraGen Spain SA / Prime Energia SpA, 144A |
|
|
5.375% |
|
|
|
12/30/30 |
|
|
|
BBB- |
|
|
|
650,000 |
|
| |
825 |
|
|
Investment Energy Resources Ltd, 144A |
|
|
6.250% |
|
|
|
4/26/29 |
|
|
|
BB |
|
|
|
764,346 |
|
| |
617 |
|
|
UEP Penonome II SA2020 1, 144A |
|
|
6.500% |
|
|
|
10/01/38 |
|
|
|
BB |
|
|
|
462,628 |
|
|
|
|
|
Total Independent Power and Renewable Electricity
Producers |
|
|
|
|
|
|
|
|
|
|
|
|
|
|
4,384,884 |
|
|
|
|
|
|
|
| |
|
|
Insurance – 3.9% |
|
|
|
|
|
|
|
|
|
|
|
|
|
|
|
|
|
|
| |
2,125 |
|
|
Acrisure LLC / Acrisure Finance Inc, 144A |
|
|
10.125% |
|
|
|
8/01/26 |
|
|
|
CCC+ |
|
|
|
2,174,202 |
|
| |
2,475 |
|
|
Acrisure LLC / Acrisure Finance Inc, 144A |
|
|
4.250% |
|
|
|
2/15/29 |
|
|
|
B |
|
|
|
2,136,410 |
|
| |
100 |
|
|
Alliant Holdings Intermediate LLC / Alliant Holdings Co-Issuer,
144A |
|
|
4.250% |
|
|
|
10/15/27 |
|
|
|
B |
|
|
|
89,739 |
|
| |
520 |
|
|
AmWINS Group Inc, 144A |
|
|
4.875% |
|
|
|
6/30/29 |
|
|
|
B- |
|
|
|
469,551 |
|
| |
4,200 |
|
|
BroadStreet Partners Inc, 144A |
|
|
5.875% |
|
|
|
4/15/29 |
|
|
|
CCC+ |
|
|
|
3,643,665 |
|
| |
1,000 |
|
|
Fidelis Insurance Holdings Ltd, 144A |
|
|
6.625% |
|
|
|
4/01/41 |
|
|
|
BB+ |
|
|
|
943,750 |
|
| |
1,500 |
|
|
GTCR AP Finance Inc, 144A |
|
|
8.000% |
|
|
|
5/15/27 |
|
|
|
N/R |
|
|
|
1,470,364 |
|
| |
1,000 |
|
|
SBL Holdings Inc, 144A |
|
|
6.500% |
|
|
|
12/30/49 |
|
|
|
BB |
|
|
|
542,851 |
|
|
|
|
|
Total Insurance |
|
|
|
|
|
|
|
|
|
|
|
|
|
|
11,470,532 |
|
|
|
|
|
|
|
| |
|
|
Interactive Media & Services – 0.5% |
|
|
|
|
|
|
|
|
|
|
|
|
|
|
|
|
|
|
| |
1,000 |
|
|
Getty Images Inc, 144A |
|
|
9.750% |
|
|
|
3/01/27 |
|
|
|
B |
|
|
|
987,561 |
|
| |
1,225 |
|
|
Rackspace Technology Global Inc, 144A |
|
|
3.500% |
|
|
|
2/15/28 |
|
|
|
B3 |
|
|
|
551,284 |
|
|
|
|
|
Total Interactive Media & Services |
|
|
|
|
|
|
|
|
|
|
|
|
|
|
1,538,845 |
|
|
|
|
|
|
|
| |
|
|
IT Services – 4.3% |
|
|
|
|
|
|
|
|
|
|
|
|
|
|
|
|
|
|
| |
4,200 |
|
|
Ahead DB Holdings LLC, 144A |
|
|
6.625% |
|
|
|
5/01/28 |
|
|
|
CCC+ |
|
|
|
3,415,734 |
|
| |
2,225 |
|
|
CA Magnum Holdings, 144A |
|
|
5.375% |
|
|
|
10/31/26 |
|
|
|
BB- |
|
|
|
1,992,182 |
|
| |
5,000 |
|
|
Presidio Holdings Inc, 144A |
|
|
8.250% |
|
|
|
2/01/28 |
|
|
|
CCC+ |
|
|
|
4,760,681 |
|
| |
3,000 |
|
|
Virtusa Corp, 144A |
|
|
7.125% |
|
|
|
12/15/28 |
|
|
|
CCC+ |
|
|
|
2,443,178 |
|
|
|
|
|
Total IT Services |
|
|
|
|
|
|
|
|
|
|
|
|
|
|
12,611,775 |
|
|
|
|
|
|
|
| |
|
|
Machinery – 0.4% |
|
|
|
|
|
|
|
|
|
|
|
|
|
|
|
|
|
|
| |
1,060 |
|
|
Chart Industries Inc, 144A |
|
|
9.500% |
|
|
|
1/01/31 |
|
|
|
B |
|
|
|
1,124,674 |
|
|
|
|
|
Total Machinery |
|
|
|
|
|
|
|
|
|
|
|
|
|
|
1,124,674 |
|
|
|
|
|
|
|
| |
|
|
Media – 6.1% |
|
|
|
|
|
|
|
|
|
|
|
|
|
|
|
|
|
|
| |
100 |
|
|
CCO Holdings LLC / CCO Holdings Capital Corp, 144A |
|
|
4.500% |
|
|
|
8/15/30 |
|
|
|
BB+ |
|
|
|
83,269 |
|
| |
1,500 |
|
|
CSC Holdings LLC, 144A |
|
|
6.500% |
|
|
|
2/01/29 |
|
|
|
B1 |
|
|
|
1,212,053 |
|
| |
1,700 |
|
|
CSC Holdings LLC, 144A |
|
|
11.250% |
|
|
|
5/15/28 |
|
|
|
B1 |
|
|
|
1,648,541 |
|
| |
1,250 |
|
|
CSC Holdings LLC, 144A |
|
|
5.375% |
|
|
|
2/01/28 |
|
|
|
B1 |
|
|
|
1,004,426 |
|
| |
2,285 |
|
|
Directv Financing LLC / Directv Financing Co-Obligor Inc,
144A |
|
|
5.875% |
|
|
|
8/15/27 |
|
|
|
BBB- |
|
|
|
2,069,376 |
|
| |
2,550 |
|
|
DISH DBS Corp |
|
|
5.125% |
|
|
|
6/01/29 |
|
|
|
B- |
|
|
|
1,184,083 |
|
| |
1,750 |
|
|
DISH Network Corp, 144A |
|
|
11.750% |
|
|
|
11/15/27 |
|
|
|
Ba3 |
|
|
|
1,707,845 |
|
| |
1,545 |
|
|
Gray Escrow Inc, 144A |
|
|
5.375% |
|
|
|
11/15/31 |
|
|
|
BB- |
|
|
|
1,024,007 |
|
| |
1,325 |
|
|
Gray Television Inc, 144A |
|
|
4.750% |
|
|
|
10/15/30 |
|
|
|
BB- |
|
|
|
898,522 |
|
| |
1,275 |
|
|
LCPR Senior Secured Financing DAC, 144A |
|
|
5.125% |
|
|
|
7/15/29 |
|
|
|
BB+ |
|
|
|
1,071,365 |
|
| |
2,500 |
|
|
UPC Broadband Finco BV, 144A |
|
|
4.875% |
|
|
|
7/15/31 |
|
|
|
BB+ |
|
|
|
2,057,725 |
|
| |
925 |
|
|
Virgin Media Secured Finance PLC, 144A |
|
|
5.500% |
|
|
|
5/15/29 |
|
|
|
BB+ |
|
|
|
836,712 |
|
| |
4,000 |
|
|
VZ Secured Financing BV, 144A |
|
|
5.000% |
|
|
|
1/15/32 |
|
|
|
BB |
|
|
|
3,221,466 |
|
|
|
|
|
Total Media |
|
|
|
|
|
|
|
|
|
|
|
|
|
|
18,019,390 |
|
|
|
|
|
|
|
| |
|
|
Metals & Mining – 5.0% |
|
|
|
|
|
|
|
|
|
|
|
|
|
|
|
|
|
|
| |
1,700 |
|
|
AngloGold Ashanti Holdings PLC |
|
|
6.500% |
|
|
|
4/15/40 |
|
|
|
Baa3 |
|
|
|
1,709,728 |
|
| |
700 |
|
|
Cia de Minas Buenaventura SAA, 144A |
|
|
5.500% |
|
|
|
7/23/26 |
|
|
|
BB- |
|
|
|
607,711 |
|
| |
875 |
|
|
Constellium SE, 144A |
|
|
3.750% |
|
|
|
4/15/29 |
|
|
|
B+ |
|
|
|
744,412 |
|
| |
875 |
|
|
First Quantum Minerals Ltd, 144A |
|
|
6.875% |
|
|
|
3/01/26 |
|
|
|
B+ |
|
|
|
861,353 |
|
| |
500 |
|
|
First Quantum Minerals Ltd, 144A |
|
|
8.625% |
|
|
|
6/01/31 |
|
|
|
B+ |
|
|
|
512,440 |
|
21
|
|
|
|
|
| JGH |
|
Nuveen Global High Income Fund (continued) |
| |
Portfolio of Investments June 30, 2023 |
|
|
(Unaudited) |
|
|
|
|
|
|
|
|
|
|
|
|
|
|
|
|
|
|
|
|
|
Principal
Amount (000) |
|
|
Description (1) |
|
Coupon |
|
|
Maturity |
|
|
Ratings (2) |
|
|
Value |
|
|
|
|
|
|
|
| |
|
|
Metals & Mining (continued) |
|
|
|
|
|
|
|
|
|
|
|
|
|
|
|
|
|
|
|
$
|
3,000 |
|
|
FMG Resources August 2006 Pty Ltd, 144A |
|
|
5.875% |
|
|
|
4/15/30 |
|
|
|
BB+ |
|
|
$
|
2,856,763 |
|
| |
300 |
|
|
Gold Fields Orogen Holdings BVI Ltd, 144A |
|
|
6.125% |
|
|
|
5/15/29 |
|
|
|
BBB- |
|
|
|
303,400 |
|
| |
1,580 |
|
|
Mineral Resources Ltd, 144A |
|
|
8.000% |
|
|
|
11/01/27 |
|
|
|
BB |
|
|
|
1,577,744 |
|
| |
2,070 |
|
|
Mineral Resources Ltd, 144A |
|
|
8.500% |
|
|
|
5/01/30 |
|
|
|
BB |
|
|
|
2,078,138 |
|
| |
4,270 |
|
|
SunCoke Energy Inc, 144A |
|
|
4.875% |
|
|
|
6/30/29 |
|
|
|
BB |
|
|
|
3,586,189 |
|
|
|
|
|
Total Metals & Mining |
|
|
|
|
|
|
|
|
|
|
|
|
|
|
14,837,878 |
|
|
|
|
|
|
|
| |
|
|
Oil, Gas & Consumable Fuels – 16.3% |
|
|
|
|
|
|
|
|
|
|
|
|
|
|
|
|
|
|
| |
1,335 |
|
|
Antero Midstream Partners LP / Antero Midstream Finance Corp, 144A |
|
|
5.375% |
|
|
|
6/15/29 |
|
|
|
BB |
|
|
|
1,240,456 |
|
| |
1,430 |
|
|
Callon Petroleum Co, 144A |
|
|
7.500% |
|
|
|
6/15/30 |
|
|
|
BB- |
|
|
|
1,349,737 |
|
| |
625 |
|
|
Calumet Specialty Products Partners LP / Calumet Finance Corp, 144A |
|
|
8.125% |
|
|
|
1/15/27 |
|
|
|
B- |
|
|
|
598,432 |
|
| |
1,440 |
|
|
Civitas Resources Inc, 144A |
|
|
8.375% |
|
|
|
7/01/28 |
|
|
|
BB- |
|
|
|
1,456,272 |
|
| |
875 |
|
|
Civitas Resources Inc, 144A |
|
|
8.750% |
|
|
|
7/01/31 |
|
|
|
BB- |
|
|
|
887,075 |
|
| |
1,900 |
|
|
Crestwood Midstream Partners LP / Crestwood Midstream Finance Corp, 144A |
|
|
5.625% |
|
|
|
5/01/27 |
|
|
|
BB |
|
|
|
1,801,200 |
|
| |
1,000 |
|
|
Ecopetrol SA |
|
|
5.875% |
|
|
|
11/02/51 |
|
|
|
Baa3 |
|
|
|
661,792 |
|
| |
625 |
|
|
Ecopetrol SA |
|
|
6.875% |
|
|
|
4/29/30 |
|
|
|
Baa3 |
|
|
|
570,164 |
|
| |
1,500 |
|
|
Ecopetrol SA, (WI/DD) |
|
|
8.875% |
|
|
|
1/13/33 |
|
|
|
Baa3 |
|
|
|
1,485,337 |
|
| |
485 |
|
|
Energean Israel Finance Ltd, (WI/DD), 144A , Reg S |
|
|
8.500% |
|
|
|
9/30/33 |
|
|
|
Ba3 |
|
|
|
484,131 |
|
| |
2,351 |
|
|
Energean Israel Finance Ltd, 144A , Reg S |
|
|
5.875% |
|
|
|
3/30/31 |
|
|
|
BB- |
|
|
|
2,048,896 |
|
| |
275 |
|
|
EQM Midstream Partners LP, 144A |
|
|
7.500% |
|
|
|
6/01/27 |
|
|
|
BB |
|
|
|
277,632 |
|
| |
425 |
|
|
EQM Midstream Partners LP, 144A |
|
|
4.500% |
|
|
|
1/15/29 |
|
|
|
BB |
|
|
|
379,055 |
|
| |
335 |
|
|
EQM Midstream Partners LP, 144A |
|
|
7.500% |
|
|
|
6/01/30 |
|
|
|
BB |
|
|
|
339,002 |
|
| |
525 |
|
|
EQM Midstream Partners LP, 144A |
|
|
4.750% |
|
|
|
1/15/31 |
|
|
|
BB |
|
|
|
459,892 |
|
| |
4,500 |
|
|
EQM Midstream Partners LP |
|
|
6.500% |
|
|
|
7/15/48 |
|
|
|
BB |
|
|
|
4,069,593 |
|
| |
500 |
|
|
Genesis Energy LP / Genesis Energy Finance Corp |
|
|
6.500% |
|
|
|
10/01/25 |
|
|
|
B |
|
|
|
492,397 |
|
| |
1,305 |
|
|
Hilcorp Energy I LP / Hilcorp Finance Co, 144A |
|
|
6.250% |
|
|
|
4/15/32 |
|
|
|
BB+ |
|
|
|
1,163,244 |
|
| |
1,305 |
|
|
Hilcorp Energy I LP / Hilcorp Finance Co, 144A |
|
|
6.000% |
|
|
|
4/15/30 |
|
|
|
BB+ |
|
|
|
1,188,299 |
|
| |
500 |
|
|
Hilcorp Energy I LP / Hilcorp Finance Co, 144A |
|
|
6.000% |
|
|
|
2/01/31 |
|
|
|
BB+ |
|
|
|
445,688 |
|
| |
525 |
|
|
Kosmos Energy Ltd, 144A |
|
|
7.750% |
|
|
|
5/01/27 |
|
|
|
B+ |
|
|
|
448,903 |
|
| |
1,500 |
|
|
Leviathan Bond Ltd, 144A , Reg S |
|
|
6.500% |
|
|
|
6/30/27 |
|
|
|
BB |
|
|
|
1,438,200 |
|
| |
500 |
|
|
Medco Laurel Tree Pte Ltd, 144A |
|
|
6.950% |
|
|
|
11/12/28 |
|
|
|
B+ |
|
|
|
458,995 |
|
| |
1,000 |
|
|
Medco Oak Tree Pte Ltd, 144A |
|
|
7.375% |
|
|
|
5/14/26 |
|
|
|
B+ |
|
|
|
983,043 |
|
| |
4,000 |
|
|
MEG Energy Corp, 144A |
|
|
5.875% |
|
|
|
2/01/29 |
|
|
|
BB- |
|
|
|
3,761,662 |
|
| |
700 |
|
|
NGL Energy Operating LLC / NGL Energy Finance Corp, 144A |
|
|
7.500% |
|
|
|
2/01/26 |
|
|
|
B+ |
|
|
|
689,410 |
|
| |
1,325 |
|
|
Parkland Corp, 144A |
|
|
4.500% |
|
|
|
10/01/29 |
|
|
|
BB |
|
|
|
1,149,438 |
|
| |
1,890 |
|
|
Parkland Corp/Canada, 144A |
|
|
4.625% |
|
|
|
5/01/30 |
|
|
|
BB |
|
|
|
1,638,734 |
|
| |
980 |
|
|
Petrobras Global Finance BV |
|
|
6.900% |
|
|
|
3/19/49 |
|
|
|
Ba1 |
|
|
|
904,285 |
|
| |
4,671 |
|
|
Petroleos Mexicanos |
|
|
6.700% |
|
|
|
2/16/32 |
|
|
|
BBB |
|
|
|
3,551,616 |
|
| |
1,000 |
|
|
Petroleos Mexicanos, 144A |
|
|
10.000% |
|
|
|
2/07/33 |
|
|
|
BBB |
|
|
|
915,992 |
|
| |
619 |
|
|
Saka Energi Indonesia PT, 144A |
|
|
4.450% |
|
|
|
5/05/24 |
|
|
|
B+ |
|
|
|
603,525 |
|
| |
1,000 |
|
|
SierraCol Energy Andina LLC, 144A |
|
|
6.000% |
|
|
|
6/15/28 |
|
|
|
B1 |
|
|
|
735,000 |
|
| |
2,000 |
|
|
SM Energy Co |
|
|
5.625% |
|
|
|
6/01/25 |
|
|
|
BB- |
|
|
|
1,954,380 |
|
| |
1,000 |
|
|
SM Energy Co |
|
|
6.750% |
|
|
|
9/15/26 |
|
|
|
BB- |
|
|
|
974,709 |
|
| |
475 |
|
|
Sunoco LP / Sunoco Finance Corp |
|
|
4.500% |
|
|
|
5/15/29 |
|
|
|
BB+ |
|
|
|
421,416 |
|
| |
1,410 |
|
|
Sunoco LP / Sunoco Finance Corp |
|
|
4.500% |
|
|
|
4/30/30 |
|
|
|
BB+ |
|
|
|
1,232,689 |
|
| |
1,109 |
|
|
Tullow Oil PLC, 144A |
|
|
10.250% |
|
|
|
5/15/26 |
|
|
|
CCC+ |
|
|
|
842,829 |
|
| |
3,000 |
|
|
USA Compression Partners LP / USA Compression Finance Corp |
|
|
6.875% |
|
|
|
9/01/27 |
|
|
|
BB- |
|
|
|
2,864,683 |
|
| |
880 |
|
|
Venture Global LNG Inc, 144A |
|
|
8.125% |
|
|
|
6/01/28 |
|
|
|
BB |
|
|
|
893,759 |
|
|
|
|
|
Total Oil, Gas & Consumable Fuels |
|
|
|
|
|
|
|
|
|
|
|
|
|
|
47,861,562 |
|
|
|
|
|
|
|
| |
|
|
Passenger Airlines – 0.9% |
|
|
|
|
|
|
|
|
|
|
|
|
|
|
|
|
|
|
| |
1,100 |
|
|
Allegiant Travel Co, 144A |
|
|
7.250% |
|
|
|
8/15/27 |
|
|
|
BB+ |
|
|
|
1,095,941 |
|
| |
1,710 |
|
|
Grupo Aeromexico SAB de CV, 144A |
|
|
8.500% |
|
|
|
3/17/27 |
|
|
|
B |
|
|
|
1,530,313 |
|
|
|
|
|
Total Passenger Airlines |
|
|
|
|
|
|
|
|
|
|
|
|
|
|
2,626,254 |
|
|
|
|
|
|
|
| |
|
|
Personal Care Products – 1.4% |
|
|
|
|
|
|
|
|
|
|
|
|
|
|
|
|
|
|
| |
1,175 |
|
|
Kronos Acquisition Holdings Inc / KIK Custom Products Inc, 144A |
|
|
5.000% |
|
|
|
12/31/26 |
|
|
|
B2 |
|
|
|
1,075,125 |
|
| |
3,325 |
|
|
Kronos Acquisition Holdings Inc / KIK Custom Products Inc,
144A |
|
|
7.000% |
|
|
|
12/31/27 |
|
|
|
CCC |
|
|
|
2,943,390 |
|
|
|
|
|
Total Personal Care Products |
|
|
|
|
|
|
|
|
|
|
|
|
|
|
4,018,515 |
|
22
|
|
|
|
|
|
|
|
|
|
|
|
|
|
|
|
|
|
|
|
|
Principal
Amount (000) |
|
|
Description (1) |
|
Coupon |
|
|
Maturity |
|
|
Ratings (2) |
|
|
Value |
|
|
|
|
|
|
|
| |
|
|
Pharmaceuticals – 2.4% |
|
|
|
|
|
|
|
|
|
|
|
|
|
|
|
|
|
|
| $ |
2,740 |
|
|
Bausch Health Cos Inc, 144A |
|
|
4.875% |
|
|
|
6/01/28 |
|
|
|
B |
|
|
$
|
1,630,848 |
|
| |
2,650 |
|
|
Organon & Co / Organon Foreign Debt Co-Issuer BV,
144A |
|
|
5.125% |
|
|
|
4/30/31 |
|
|
|
BB- |
|
|
|
2,186,315 |
|
| |
1,000 |
|
|
Teva Pharmaceutical Finance Netherlands III BV |
|
|
8.125% |
|
|
|
9/15/31 |
|
|
|
Ba2 |
|
|
|
1,048,081 |
|
| |
1,800 |
|
|
Teva Pharmaceutical Finance Netherlands III BV |
|
|
6.750% |
|
|
|
3/01/28 |
|
|
|
Ba2 |
|
|
|
1,773,032 |
|
| |
495 |
|
|
Teva Pharmaceutical Finance Netherlands III BV |
|
|
5.125% |
|
|
|
5/09/29 |
|
|
|
Ba2 |
|
|
|
449,015 |
|
|
|
|
|
Total Pharmaceuticals |
|
|
|
|
|
|
|
|
|
|
|
|
|
|
7,087,291 |
|
|
|
|
|
|
|
| |
|
|
Professional Services – 0.6% |
|
|
|
|
|
|
|
|
|
|
|
|
|
|
|
|
|
|
| |
2,225 |
|
|
MPH Acquisition Holdings LLC, 144A |
|
|
5.500% |
|
|
|
9/01/28 |
|
|
|
B1 |
|
|
|
1,896,654 |
|
|
|
|
|
Total Professional Services |
|
|
|
|
|
|
|
|
|
|
|
|
|
|
1,896,654 |
|
|
|
|
|
|
|
| |
|
|
Real Estate Management & Development – 1.4% |
|
|
|
|
|
|
|
|
|
|
|
|
|
|
|
|
|
|
| |
2,175 |
|
|
Kennedy-Wilson Inc |
|
|
5.000% |
|
|
|
3/01/31 |
|
|
|
BB- |
|
|
|
1,627,781 |
|
| |
1,125 |
|
|
Kennedy-Wilson Inc |
|
|
4.750% |
|
|
|
3/01/29 |
|
|
|
BB- |
|
|
|
889,485 |
|
| |
2,310 |
|
|
Realogy Group LLC / Realogy
Co-Issuer Corp, 144A |
|
|
5.250% |
|
|
|
4/15/30 |
|
|
|
B |
|
|
|
1,641,681 |
|
|
|
|
|
Total Real Estate Management & Development |
|
|
|
|
|
|
|
|
|
|
|
|
|
|
4,158,947 |
|
|
|
|
|
|
|
| |
|
|
Software – 0.6% |
|
|
|
|
|
|
|
|
|
|
|
|
|
|
|
|
|
|
| |
2,000 |
|
|
Condor Merger Sub Inc, 144A |
|
|
7.375% |
|
|
|
2/15/30 |
|
|
|
CCC+ |
|
|
|
1,739,045 |
|
|
|
|
|
Total Software |
|
|
|
|
|
|
|
|
|
|
|
|
|
|
1,739,045 |
|
|
|
|
|
|
|
| |
|
|
Specialized REITs – 0.4% |
|
|
|
|
|
|
|
|
|
|
|
|
|
|
|
|
|
|
| |
1,080 |
|
|
Uniti Group LP / Uniti Group Finance Inc / CSL Capital LLC,
144A |
|
|
10.500% |
|
|
|
2/15/28 |
|
|
|
BB+ |
|
|
|
1,071,429 |
|
|
|
|
|
Total Specialized REITs |
|
|
|
|
|
|
|
|
|
|
|
|
|
|
1,071,429 |
|
|
|
|
|
|
|
| |
|
|
Specialty Retail – 3.4% |
|
|
|
|
|
|
|
|
|
|
|
|
|
|
|
|
|
|
| |
1,035 |
|
|
Asbury Automotive Group Inc, 144A |
|
|
4.625% |
|
|
|
11/15/29 |
|
|
|
BB |
|
|
|
918,690 |
|
| |
2,605 |
|
|
Asbury Automotive Group Inc, 144A |
|
|
5.000% |
|
|
|
2/15/32 |
|
|
|
BB |
|
|
|
2,268,161 |
|
| |
945 |
|
|
LCM Investments Holdings II LLC, 144A |
|
|
4.875% |
|
|
|
5/01/29 |
|
|
|
BB- |
|
|
|
808,675 |
|
| |
750 |
|
|
Michaels Cos Inc/The, 144A |
|
|
5.250% |
|
|
|
5/01/28 |
|
|
|
B2 |
|
|
|
605,955 |
|
| |
3,900 |
|
|
Michaels Cos Inc/The, 144A |
|
|
7.875% |
|
|
|
5/01/29 |
|
|
|
CCC |
|
|
|
2,627,781 |
|
| |
2,500 |
|
|
Staples Inc, 144A |
|
|
7.500% |
|
|
|
4/15/26 |
|
|
|
B |
|
|
|
2,064,783 |
|
| |
1,000 |
|
|
Staples Inc, 144A |
|
|
10.750% |
|
|
|
4/15/27 |
|
|
|
CCC+ |
|
|
|
580,896 |
|
|
|
|
|
Total Specialty Retail |
|
|
|
|
|
|
|
|
|
|
|
|
|
|
9,874,941 |
|
|
|
|
|
|
|
| |
|
|
Textiles, Apparel & Luxury Goods – 0.6% |
|
|
|
|
|
|
|
|
|
|
|
|
|
|
|
|
|
|
| |
1,080 |
|
|
Hanesbrands Inc, 144A |
|
|
9.000% |
|
|
|
2/15/31 |
|
|
|
BB- |
|
|
|
1,088,496 |
|
| |
725 |
|
|
Wolverine World Wide Inc, 144A |
|
|
4.000% |
|
|
|
8/15/29 |
|
|
|
B+ |
|
|
|
577,281 |
|
|
|
|
|
Total Textiles, Apparel & Luxury Goods |
|
|
|
|
|
|
|
|
|
|
|
|
|
|
1,665,777 |
|
|
|
|
|
|
|
| |
|
|
Trading Companies & Distributors – 2.6% |
|
|
|
|
|
|
|
|
|
|
|
|
|
|
|
|
|
|
| |
2,090 |
|
|
Albion Financing 1 SARL / Aggreko Holdings Inc, 144A |
|
|
6.125% |
|
|
|
10/15/26 |
|
|
|
BB+ |
|
|
|
1,964,600 |
|
| |
5,470 |
|
|
Albion Financing 2SARL, 144A |
|
|
8.750% |
|
|
|
4/15/27 |
|
|
|
BB- |
|
|
|
5,055,483 |
|
| |
530 |
|
|
Windsor Holdings III LLC, (WI/DD), 144A |
|
|
8.500% |
|
|
|
6/15/30 |
|
|
|
BB+ |
|
|
|
527,519 |
|
|
|
|
|
Total Trading Companies & Distributors |
|
|
|
|
|
|
|
|
|
|
|
|
|
|
7,547,602 |
|
|
|
|
|
|
|
| |
|
|
Transportation Infrastructure – 0.3% |
|
|
|
|
|
|
|
|
|
|
|
|
|
|
|
|
|
|
| |
1,000 |
|
|
Aeropuertos Dominicanos Siglo XXI SA, 144A |
|
|
6.750% |
|
|
|
3/30/29 |
|
|
|
BB |
|
|
|
963,000 |
|
|
|
|
|
Total Transportation Infrastructure |
|
|
|
|
|
|
|
|
|
|
|
|
|
|
963,000 |
|
|
|
|
|
|
|
| |
|
|
Wireless Telecommunication Services – 3.1% |
|
|
|
|
|
|
|
|
|
|
|
|
|
|
|
|
|
|
| |
1,550 |
|
|
C&W Senior Financing DAC, 144A |
|
|
6.875% |
|
|
|
9/15/27 |
|
|
|
BB- |
|
|
|
1,352,375 |
|
| |
1,100 |
|
|
Connect Finco SARL / Connect US Finco LLC, 144A |
|
|
6.750% |
|
|
|
10/01/26 |
|
|
|
BB+ |
|
|
|
1,068,448 |
|
| |
725 |
|
|
CT Trust, 144A |
|
|
5.125% |
|
|
|
2/03/32 |
|
|
|
Ba1 |
|
|
|
581,881 |
|
| |
1,500 |
|
|
Liberty Costa Rica Senior Secured Finance, 144A |
|
|
10.875% |
|
|
|
1/15/31 |
|
|
|
B+ |
|
|
|
1,484,289 |
|
| |
900 |
|
|
Millicom International Cellular SA2028 2028, 144A |
|
|
5.125% |
|
|
|
1/15/28 |
|
|
|
BB+ |
|
|
|
785,884 |
|
| |
250 |
|
|
Millicom International Cellular SA, 144A |
|
|
4.500% |
|
|
|
4/27/31 |
|
|
|
BB+ |
|
|
|
192,150 |
|
| |
1,375 |
|
|
Sitios Latinoamerica SAB de CV, 144A |
|
|
5.375% |
|
|
|
4/04/32 |
|
|
|
Baa3 |
|
|
|
1,245,312 |
|
23
|
|
|
|
|
| JGH |
|
Nuveen Global High Income Fund (continued) |
| |
Portfolio of Investments June 30, 2023 |
|
|
(Unaudited) |
|
|
|
|
|
|
|
|
|
|
|
|
|
|
|
|
|
|
|
|
|
Principal
Amount (000) |
|
|
Description (1) |
|
Coupon |
|
|
Maturity |
|
|
Ratings (2) |
|
|
Value |
|
|
|
|
|
|
|
| |
|
|
Wireless Telecommunication Services (continued) |
|
|
|
|
|
|
|
|
|
|
|
|
|
|
|
|
|
|
|
$
|
2,880 |
|
|
Vmed O2 UK Financing I PLC, 144A |
|
|
4.750% |
|
|
|
7/15/31 |
|
|
|
BB+ |
|
|
$
|
2,394,716 |
|
|
|
|
|
Total Wireless Telecommunication Services |
|
|
|
|
|
|
|
|
|
|
|
|
|
|
9,105,055 |
|
|
|
|
|
Total Corporate Bonds
(cost $316,797,491) |
|
|
|
|
|
|
|
|
|
|
|
|
|
|
278,223,287 |
|
|
|
|
|
|
|
Principal
Amount (000) |
|
|
Description (1) |
|
Coupon |
|
|
Maturity |
|
|
Ratings (2) |
|
|
Value |
|
|
|
|
|
|
|
| |
|
|
SOVEREIGN DEBT – 14.7% (10.5% of Total Investments) |
|
|
|
|
|
|
|
|
|
|
|
|
|
|
|
|
|
|
| |
|
|
Angola – 1.1% |
|
|
|
|
|
|
|
|
|
|
|
|
|
|
|
|
|
|
| $ |
1,500 |
|
|
Angolan Government International Bond , 144A |
|
|
8.250% |
|
|
|
5/09/28 |
|
|
|
B3 |
|
|
$ |
1,328,250 |
|
| |
1,050 |
|
|
Angolan Government International Bond , 144A |
|
|
8.750% |
|
|
|
4/14/32 |
|
|
|
B- |
|
|
|
881,738 |
|
| |
900 |
|
|
Angolan Government International Bond , 144A |
|
|
8.000% |
|
|
|
11/26/29 |
|
|
|
B- |
|
|
|
761,715 |
|
|
|
|
|
Total Angola |
|
|
|
|
|
|
|
|
|
|
|
|
|
|
2,971,703 |
|
|
|
|
|
|
|
| |
|
|
Colombia – 1.6% |
|
|
|
|
|
|
|
|
|
|
|
|
|
|
|
|
|
|
| |
1,400 |
|
|
Colombia Government International Bond |
|
|
3.125% |
|
|
|
4/15/31 |
|
|
|
Baa2 |
|
|
|
1,054,200 |
|
| |
1,320 |
|
|
Colombia Government International Bond |
|
|
7.500% |
|
|
|
2/02/34 |
|
|
|
Baa2 |
|
|
|
1,290,199 |
|
| |
3,175 |
|
|
Colombia Government International Bond |
|
|
3.250% |
|
|
|
4/22/32 |
|
|
|
Baa2 |
|
|
|
2,346,515 |
|
|
|
|
|
Total Colombia |
|
|
|
|
|
|
|
|
|
|
|
|
|
|
4,690,914 |
|
|
|
|
|
|
|
| |
|
|
Cote d’Ivoire – 0.5% |
|
|
|
|
|
|
|
|
|
|
|
|
|
|
|
|
|
|
| |
1,701 |
|
|
Ivory Coast Government International Bond , 144A |
|
|
5.750% |
|
|
|
12/31/32 |
|
|
|
BB- |
|
|
|
1,582,593 |
|
|
|
|
|
Total Cote d’Ivoire |
|
|
|
|
|
|
|
|
|
|
|
|
|
|
1,582,593 |
|
|
|
|
|
|
|
| |
|
|
Dominican Republic – 1.2% |
|
|
|
|
|
|
|
|
|
|
|
|
|
|
|
|
|
|
| |
1,500 |
|
|
Dominican Republic International Bond , 144A |
|
|
4.875% |
|
|
|
9/23/32 |
|
|
|
BB |
|
|
|
1,274,841 |
|
| |
1,175 |
|
|
Dominican Republic International Bond , 144A |
|
|
5.300% |
|
|
|
1/21/41 |
|
|
|
BB |
|
|
|
919,112 |
|
| |
1,000 |
|
|
Dominican Republic International Bond , 144A |
|
|
4.500% |
|
|
|
1/30/30 |
|
|
|
BB |
|
|
|
875,149 |
|
| |
650 |
|
|
Dominican Republic International Bond , 144A |
|
|
5.500% |
|
|
|
2/22/29 |
|
|
|
BB |
|
|
|
607,375 |
|
|
|
|
|
Total Dominican Republic |
|
|
|
|
|
|
|
|
|
|
|
|
|
|
3,676,477 |
|
|
|
|
|
|
|
| |
|
|
Ecuador – 0.3% |
|
|
|
|
|
|
|
|
|
|
|
|
|
|
|
|
|
|
| |
1,768 |
|
|
Ecuador Government International Bond , 144A |
|
|
5.000% |
|
|
|
7/31/30 |
|
|
|
B- |
|
|
|
849,865 |
|
| |
371 |
|
|
Ecuador Government International Bond , 144A |
|
|
1.000% |
|
|
|
7/31/35 |
|
|
|
B- |
|
|
|
127,984 |
|
| |
80 |
|
|
Ecuador Government International Bond , 144A |
|
|
0.000% |
|
|
|
7/31/30 |
|
|
|
B- |
|
|
|
23,102 |
|
|
|
|
|
Total Ecuador |
|
|
|
|
|
|
|
|
|
|
|
|
|
|
1,000,951 |
|
|
|
|
|
|
|
| |
|
|
Egypt – 1.0% |
|
|
|
|
|
|
|
|
|
|
|
|
|
|
|
|
|
|
| |
1,700 |
|
|
Egypt Government International Bond , 144A |
|
|
7.600% |
|
|
|
3/01/29 |
|
|
|
B |
|
|
|
1,096,670 |
|
| |
2,300 |
|
|
Egypt Government International Bond , 144A |
|
|
7.053% |
|
|
|
1/15/32 |
|
|
|
B |
|
|
|
1,299,040 |
|
| |
700 |
|
|
Egypt Government International Bond , 144A |
|
|
5.875% |
|
|
|
6/11/25 |
|
|
|
B |
|
|
|
559,412 |
|
|
|
|
|
Total Egypt |
|
|
|
|
|
|
|
|
|
|
|
|
|
|
2,955,122 |
|
|
|
|
|
|
|
| |
|
|
El Salvador – 0.2% |
|
|
|
|
|
|
|
|
|
|
|
|
|
|
|
|
|
|
| |
925 |
|
|
El Salvador Government International Bond , 144A |
|
|
8.625% |
|
|
|
2/28/29 |
|
|
|
CCC+ |
|
|
|
613,203 |
|
|
|
|
|
Total El Salvador |
|
|
|
|
|
|
|
|
|
|
|
|
|
|
613,203 |
|
|
|
|
|
|
|
| |
|
|
Guatemala – 0.3% |
|
|
|
|
|
|
|
|
|
|
|
|
| |
1,000 |
|
|
Guatemala Government Bond , 144A |
|
|
6.125% |
|
|
|
6/01/50 |
|
|
|
Ba1 |
|
|
|
916,176 |
|
|
|
|
|
Total Guatemala |
|
|
|
|
|
|
|
|
|
|
|
|
|
|
916,176 |
|
|
|
|
|
|
|
| |
|
|
Honduras – 0.4% |
|
|
|
|
|
|
|
|
|
|
|
|
|
|
|
|
|
|
| |
725 |
|
|
Honduras Government International Bond , 144A |
|
|
6.250% |
|
|
|
1/19/27 |
|
|
|
BB- |
|
|
|
658,188 |
|
| |
750 |
|
|
Honduras Government International Bond , 144A |
|
|
5.625% |
|
|
|
6/24/30 |
|
|
|
BB- |
|
|
|
603,894 |
|
|
|
|
|
Total Honduras |
|
|
|
|
|
|
|
|
|
|
|
|
|
|
1,262,082 |
|
24
|
|
|
|
|
|
|
|
|
|
|
|
|
|
|
|
|
|
|
|
|
Principal
Amount (000) |
|
|
Description (1) |
|
Coupon |
|
|
Maturity |
|
|
Ratings (2) |
|
|
Value |
|
|
|
|
|
|
|
| |
|
|
Hungary – 0.5% |
|
|
|
|
|
|
|
|
|
|
|
|
|
|
|
|
|
|
|
$
|
1,425 |
|
|
Hungary Government International Bond , 144A |
|
|
6.125% |
|
|
|
5/22/28 |
|
|
|
Baa2 |
|
|
$
|
1,445,155 |
|
|
|
|
|
Total Hungary |
|
|
|
|
|
|
|
|
|
|
|
|
|
|
1,445,155 |
|
|
|
|
|
|
|
| |
|
|
Iraq – 0.6% |
|
|
|
|
|
|
|
|
|
|
|
|
|
|
|
|
|
|
| |
1,938 |
|
|
Iraq International Bond , 144A |
|
|
5.800% |
|
|
|
1/15/28 |
|
|
|
N/R |
|
|
|
1,778,276 |
|
|
|
|
|
Total Iraq |
|
|
|
|
|
|
|
|
|
|
|
|
|
|
1,778,276 |
|
|
|
|
|
|
|
| |
|
|
Jordan – 1.0% |
|
|
|
|
|
|
|
|
|
|
|
|
|
|
|
|
|
|
| |
1,000 |
|
|
Jordan Government International Bond , 144A |
|
|
7.500% |
|
|
|
1/13/29 |
|
|
|
BB- |
|
|
|
998,100 |
|
| |
825 |
|
|
Jordan Government International Bond , 144A |
|
|
5.850% |
|
|
|
7/07/30 |
|
|
|
BB- |
|
|
|
754,875 |
|
| |
500 |
|
|
Jordan Government International Bond , 144A |
|
|
7.750% |
|
|
|
1/15/28 |
|
|
|
BB- |
|
|
|
508,540 |
|
| |
500 |
|
|
Jordan Government International Bond , 144A |
|
|
6.125% |
|
|
|
1/29/26 |
|
|
|
BB- |
|
|
|
490,260 |
|
|
|
|
|
Total Jordan |
|
|
|
|
|
|
|
|
|
|
|
|
|
|
2,751,775 |
|
|
|
|
|
|
|
| |
|
|
Kenya – 0.8% |
|
|
|
|
|
|
|
|
|
|
|
|
|
|
|
|
|
|
| |
825 |
|
|
Republic of Kenya Government International Bond , 144A |
|
|
6.300% |
|
|
|
1/23/34 |
|
|
|
B |
|
|
|
621,081 |
|
| |
2,000 |
|
|
Republic of Kenya Government International Bond , 144A |
|
|
7.000% |
|
|
|
5/22/27 |
|
|
|
B |
|
|
|
1,795,000 |
|
|
|
|
|
Total Kenya |
|
|
|
|
|
|
|
|
|
|
|
|
|
|
2,416,081 |
|
|
|
|
|
|
|
| |
|
|
Mongolia – 0.4% |
|
|
|
|
|
|
|
|
|
|
|
|
|
|
|
|
|
|
| |
675 |
|
|
Mongolia Government International Bond , 144A |
|
|
4.450% |
|
|
|
7/07/31 |
|
|
|
B |
|
|
|
520,031 |
|
| |
500 |
|
|
Mongolia Government International Bond , 144A |
|
|
8.650% |
|
|
|
1/19/28 |
|
|
|
B |
|
|
|
501,500 |
|
|
|
|
|
Total Mongolia |
|
|
|
|
|
|
|
|
|
|
|
|
|
|
1,021,531 |
|
|
|
|
|
|
|
| |
|
|
Morocco – 0.3% |
|
|
|
|
|
|
|
|
|
|
|
|
|
|
|
|
|
|
| |
530 |
|
|
Morocco Government International Bond , 144A |
|
|
6.500% |
|
|
|
9/08/33 |
|
|
|
BB+ |
|
|
|
544,575 |
|
| |
425 |
|
|
Morocco Government International Bond , 144A |
|
|
5.950% |
|
|
|
3/08/28 |
|
|
|
BB+ |
|
|
|
428,506 |
|
|
|
|
|
Total Morocco |
|
|
|
|
|
|
|
|
|
|
|
|
|
|
973,081 |
|
|
|
|
|
|
|
| |
|
|
Nigeria – 0.7% |
|
|
|
|
|
|
|
|
|
|
|
|
|
|
|
|
|
|
| |
1,200 |
|
|
Nigeria Government International Bond , 144A |
|
|
6.125% |
|
|
|
9/28/28 |
|
|
|
B- |
|
|
|
997,428 |
|
| |
1,425 |
|
|
Nigeria Government International Bond , 144A |
|
|
7.875% |
|
|
|
2/16/32 |
|
|
|
B- |
|
|
|
1,192,913 |
|
|
|
|
|
Total Nigeria |
|
|
|
|
|
|
|
|
|
|
|
|
|
|
2,190,341 |
|
|
|
|
|
|
|
| |
|
|
Oman – 0.8% |
|
|
|
|
|
|
|
|
|
|
|
|
|
|
|
|
|
|
| |
800 |
|
|
Oman Government International Bond , 144A |
|
|
6.750% |
|
|
|
10/28/27 |
|
|
|
Ba2 |
|
|
|
826,080 |
|
| |
1,000 |
|
|
Oman Government International Bond , 144A |
|
|
4.750% |
|
|
|
6/15/26 |
|
|
|
BB |
|
|
|
971,268 |
|
| |
500 |
|
|
Oman Government International Bond , 144A |
|
|
6.000% |
|
|
|
8/01/29 |
|
|
|
Ba2 |
|
|
|
499,505 |
|
|
|
|
|
Total Oman |
|
|
|
|
|
|
|
|
|
|
|
|
|
|
2,296,853 |
|
|
|
|
|
|
|
| |
|
|
Paraguay – 0.2% |
|
|
|
|
|
|
|
|
|
|
|
|
|
|
|
|
|
|
| |
600 |
|
|
Paraguay Government International Bond , 144A |
|
|
3.849% |
|
|
|
6/28/33 |
|
|
|
Ba1 |
|
|
|
518,501 |
|
|
|
|
|
Total Paraguay |
|
|
|
|
|
|
|
|
|
|
|
|
|
|
518,501 |
|
|
|
|
|
|
|
| |
|
|
Republic of Serbia – 0.5% |
|
|
|
|
|
|
|
|
|
|
|
|
|
|
|
|
|
|
| |
1,375 |
|
|
Serbia International Bond , 144A |
|
|
6.500% |
|
|
|
9/26/33 |
|
|
|
BB+ |
|
|
|
1,347,621 |
|
|
|
|
|
Total Republic of Serbia |
|
|
|
|
|
|
|
|
|
|
|
|
|
|
1,347,621 |
|
|
|
|
|
|
|
| |
|
|
Rwanda – 0.6% |
|
|
|
|
|
|
|
|
|
|
|
|
|
|
|
|
|
|
| |
2,450 |
|
|
Rwanda International Government Bond , 144A |
|
|
5.500% |
|
|
|
8/09/31 |
|
|
|
B+ |
|
|
|
1,843,811 |
|
|
|
|
|
Total Rwanda |
|
|
|
|
|
|
|
|
|
|
|
|
|
|
1,843,811 |
|
|
|
|
|
|
|
| |
|
|
Senegal – 0.4% |
|
|
|
|
|
|
|
|
|
|
|
|
|
|
|
|
|
|
| |
1,500 |
|
|
Senegal Government International Bond , 144A |
|
|
6.250% |
|
|
|
5/23/33 |
|
|
|
Ba3 |
|
|
|
1,252,158 |
|
|
|
|
|
Total Senegal |
|
|
|
|
|
|
|
|
|
|
|
|
|
|
1,252,158 |
|
25
|
|
|
|
|
| JGH |
|
Nuveen Global High Income Fund (continued) |
| |
Portfolio of Investments June 30, 2023 |
|
|
(Unaudited) |
|
|
|
|
|
|
|
|
|
|
|
|
|
|
|
|
|
|
|
|
|
Principal
Amount (000) |
|
|
Description (1) |
|
Coupon |
|
|
Maturity |
|
|
Ratings (2) |
|
|
Value |
|
|
|
|
|
|
|
| |
|
|
South Africa – 0.3% |
|
|
|
|
|
|
|
|
|
|
|
|
|
|
|
|
|
|
|
$
|
1,400 |
|
|
Republic of South Africa Government International Bond |
|
|
5.000% |
|
|
|
10/12/46 |
|
|
|
Ba2 |
|
|
$
|
928,200 |
|
|
|
|
|
Total South Africa |
|
|
|
|
|
|
|
|
|
|
|
|
|
|
928,200 |
|
|
|
|
|
|
|
| |
|
|
Turkey – 0.8% |
|
|
|
|
|
|
|
|
|
|
|
|
|
|
|
|
|
|
| |
1,500 |
|
|
Turkey Government International Bond |
|
|
6.500% |
|
|
|
9/20/33 |
|
|
|
B |
|
|
|
1,273,170 |
|
| |
1,250 |
|
|
Turkey Government International Bond |
|
|
5.875% |
|
|
|
6/26/31 |
|
|
|
B |
|
|
|
1,039,063 |
|
|
|
|
|
Total Turkey |
|
|
|
|
|
|
|
|
|
|
|
|
|
|
2,312,233 |
|
|
|
|
|
|
|
| |
|
|
Ukraine – 0.2% |
|
|
|
|
|
|
|
|
|
|
|
|
|
|
|
|
|
|
| |
750 |
|
|
Ukraine Government International Bond , 144A |
|
|
7.253% |
|
|
|
3/15/35 |
|
|
|
CCC |
|
|
|
172,500 |
|
| |
500 |
|
|
Ukraine Government International Bond , 144A |
|
|
6.876% |
|
|
|
5/21/31 |
|
|
|
CCC |
|
|
|
112,500 |
|
| |
675 |
|
|
Ukraine Government International Bond , 144A |
|
|
7.750% |
|
|
|
9/01/27 |
|
|
|
Caa1 |
|
|
|
160,650 |
|
|
|
|
|
Total Ukraine |
|
|
|
|
|
|
|
|
|
|
|
|
|
|
445,650 |
|
|
|
|
|
Total Sovereign Debt
(cost $51,546,939) |
|
|
|
|
|
|
|
|
|
|
|
|
|
|
43,190,488 |
|
|
|
|
|
|
|
Principal
Amount (000) |
|
|
Description (1) |
|
Coupon |
|
|
Maturity |
|
|
Ratings (2) |
|
|
Value |
|
|
|
|
| |
|
|
$1,000 PAR (OR SIMILAR) INSTITUTIONAL PREFERRED – 9.9% (7.1% of Total Investments) |
|
|
|
|
|
|
|
|
|
|
| |
|
|
Automobiles – 0.4% |
|
|
|
|
|
|
|
|
|
|
|
|
|
|
|
|
|
|
| $ |
1,473 |
|
|
General Motors Financial Co Inc |
|
|
5.750% |
|
|
|
N/A (4) |
|
|
|
BB+ |
|
|
$ |
1,198,654 |
|
|
|
|
|
Total Automobiles |
|
|
|
|
|
|
|
|
|
|
|
|
|
|
1,198,654 |
|
|
|
|
|
|
|
| |
|
|
Banks – 1.0% |
|
|
|
|
|
|
|
|
|
|
|
|
|
|
|
|
|
|
| |
1,000 |
|
|
Citigroup Inc |
|
|
5.000% |
|
|
|
N/A (4) |
|
|
|
BBB- |
|
|
|
933,440 |
|
| |
1,000 |
|
|
NBK Tier 1 Ltd, 144A |
|
|
3.625% |
|
|
|
N/A (4) |
|
|
|
Baa3 |
|
|
|
864,348 |
|
| |
655 |
|
|
PNC Financial Services Group Inc/The |
|
|
5.000% |
|
|
|
N/A (4) |
|
|
|
Baa2 |
|
|
|
563,098 |
|
| |
345 |
|
|
PNC Financial Services Group Inc/The |
|
|
6.200% |
|
|
|
N/A (4) |
|
|
|
Baa2 |
|
|
|
321,592 |
|
| |
475 |
|
|
Turkiye Garanti Bankasi AS, 144A |
|
|
7.177% |
|
|
|
5/24/27 |
|
|
|
Caa2 |
|
|
|
433,437 |
|
|
|
|
|
Total Banks |
|
|
|
|
|
|
|
|
|
|
|
|
|
|
3,115,915 |
|
|
|
|
|
|
|
| |
|
|
Communications Equipment – 0.4% |
|
|
|
|
|
|
|
|
|
|
|
|
|
|
|
|
|
|
| |
1,500 |
|
|
Vodafone Group PLC |
|
|
4.125% |
|
|
|
6/04/81 |
|
|
|
BB+ |
|
|
|
1,190,250 |
|
|
|
|
|
Total Communications Equipment |
|
|
|
|
|
|
|
|
|
|
|
|
|
|
1,190,250 |
|
|
|
|
|
|
|
| |
|
|
Consumer Finance – 0.4% |
|
|
|
|
|
|
|
|
|
|
|
|
| |
1,500 |
|
|
Ally Financial Inc |
|
|
4.700% |
|
|
|
N/A (4) |
|
|
|
Ba2 |
|
|
|
1,057,500 |
|
|
|
|
|
Total Consumer Finance |
|
|
|
|
|
|
|
|
|
|
|
|
|
|
1,057,500 |
|
|
|
|
|
|
|
| |
|
|
Diversified Telecommunication Services – 0.4% |
|
|
|
|
|
|
|
|
|
|
|
|
|
|
|
|
|
|
| |
1,300 |
|
|
Network i2i Ltd, 144A |
|
|
5.650% |
|
|
|
N/A (4) |
|
|
|
BB |
|
|
|
1,259,375 |
|
|
|
|
|
Total Diversified Telecommunication Services |
|
|
|
|
|
|
|
|
|
|
|
|
|
|
1,259,375 |
|
|
|
|
|
|
|
| |
|
|
Electric Utilities – 2.1% |
|
|
|
|
|
|
|
|
|
|
|
|
|
|
|
|
|
|
| |
2,000 |
|
|
Edison International |
|
|
5.375% |
|
|
|
N/A (4) |
|
|
|
BB+ |
|
|
|
1,747,800 |
|
| |
1,000 |
|
|
Emera Inc |
|
|
6.750% |
|
|
|
6/15/76 |
|
|
|
BB+ |
|
|
|
966,980 |
|
| |
2,000 |
|
|
Enel SpA, 144A |
|
|
8.750% |
|
|
|
9/24/73 |
|
|
|
BBB- |
|
|
|
1,988,924 |
|
| |
1,500 |
|
|
NRG Energy Inc, 144A |
|
|
10.250% |
|
|
|
N/A (4) |
|
|
|
Ba3 |
|
|
|
1,414,455 |
|
|
|
|
|
Total Electric Utilities |
|
|
|
|
|
|
|
|
|
|
|
|
|
|
6,118,159 |
|
|
|
|
|
|
|
| |
|
|
Financial Services – 0.7% |
|
|
|
|
|
|
|
|
|
|
|
|
|
|
|
|
|
|
| |
2,000 |
|
|
Citigroup Inc (3-Month
LIBOR reference rate + 4.068% spread) (5) |
|
|
9.341% |
|
|
|
N/A (4) |
|
|
|
BBB- |
|
|
|
2,007,000 |
|
|
|
|
|
Total Financial Services |
|
|
|
|
|
|
|
|
|
|
|
|
|
|
2,007,000 |
|
|
|
|
|
|
|
| |
|
|
Food Products – 0.7% |
|
|
|
|
|
|
|
|
|
|
|
|
|
|
|
|
|
|
| |
1,500 |
|
|
Land O’ Lakes Inc, 144A |
|
|
8.000% |
|
|
|
N/A (4) |
|
|
|
BB |
|
|
|
1,320,000 |
|
| |
1,000 |
|
|
Land O’ Lakes Inc, 144A |
|
|
7.000% |
|
|
|
N/A (4) |
|
|
|
BB |
|
|
|
817,500 |
|
|
|
|
|
Total Food Products |
|
|
|
|
|
|
|
|
|
|
|
|
|
|
2,137,500 |
|
26
|
|
|
|
|
|
|
|
|
|
|
|
|
|
|
|
|
|
|
|
|
Principal
Amount (000) |
|
|
Description (1) |
|
Coupon |
|
|
Maturity |
|
|
Ratings (2) |
|
|
Value |
|
|
|
|
|
|
|
| |
|
|
Independent Power Producers & Energy Traders – 0.6% |
|
|
|
|
|
|
|
|
|
|
|
|
|
|
|
|
|
|
|
$
|
2,000 |
|
|
Vistra Corp, 144A |
|
|
7.000% |
|
|
|
N/A (4) |
|
|
|
Ba3 |
|
|
$
|
1,745,000 |
|
|
|
|
|
Total Independent Power Producers & Energy
Traders |
|
|
|
|
|
|
|
|
|
|
|
|
|
|
1,745,000 |
|
|
|
|
|
|
|
| |
|
|
Insurance – 0.8% |
|
|
|
|
|
|
|
|
|
|
|
|
|
|
|
|
|
|
| |
1,000 |
|
|
Assurant Inc |
|
|
7.000% |
|
|
|
3/27/48 |
|
|
|
Baa3 |
|
|
|
959,764 |
|
| |
1,765 |
|
|
Enstar Finance LLC |
|
|
5.750% |
|
|
|
9/01/40 |
|
|
|
BBB- |
|
|
|
1,521,342 |
|
|
|
|
|
Total Insurance |
|
|
|
|
|
|
|
|
|
|
|
|
|
|
2,481,106 |
|
|
|
|
|
|
|
| |
|
|
Media – 0.5% |
|
|
|
|
|
|
|
|
|
|
|
|
|
|
|
|
|
|
| |
1,750 |
|
|
Paramount Global |
|
|
6.375% |
|
|
|
3/30/62 |
|
|
|
Baa3 |
|
|
|
1,459,868 |
|
|
|
|
|
Total Media |
|
|
|
|
|
|
|
|
|
|
|
|
|
|
1,459,868 |
|
|
|
|
|
|
|
| |
|
|
Multi-Utilities – 0.4% |
|
|
|
|
|
|
|
|
|
|
|
|
|
|
|
|
|
|
| |
1,500 |
|
|
Algonquin Power & Utilities Corp |
|
|
4.750% |
|
|
|
1/18/82 |
|
|
|
BB+ |
|
|
|
1,192,500 |
|
|
|
|
|
Total Multi-Utilities |
|
|
|
|
|
|
|
|
|
|
|
|
|
|
1,192,500 |
|
|
|
|
|
|
|
| |
|
|
Oil, Gas & Consumable Fuels – 0.6% |
|
|
|
|
|
|
|
|
|
|
|
|
|
|
|
|
|
|
| |
1,900 |
|
|
Energy Transfer LP |
|
|
6.500% |
|
|
|
N/A (4) |
|
|
|
BB |
|
|
|
1,725,808 |
|
|
|
|
|
Total Oil, Gas & Consumable Fuels |
|
|
|
|
|
|
|
|
|
|
|
|
|
|
1,725,808 |
|
|
|
|
|
|
|
| |
|
|
Trading Companies & Distributors – 0.9% |
|
|
|
|
|
|
|
|
|
|
|
|
|
|
|
|
|
|
| |
1,000 |
|
|
AerCap Global Aviation Trust, 144A |
|
|
6.500% |
|
|
|
6/15/45 |
|
|
|
Baa3 |
|
|
|
966,578 |
|
| |
1,750 |
|
|
AerCap Holdings NV |
|
|
5.875% |
|
|
|
10/10/79 |
|
|
|
BB+ |
|
|
|
1,650,471 |
|
|
|
|
|
Total Trading Companies & Distributors |
|
|
|
|
|
|
|
|
|
|
|
|
|
|
2,617,049 |
|
|
|
|
|
Total $1,000 Par (or similar) Institutional Preferred
(cost $32,507,134) |
|
|
|
|
|
|
|
|
|
|
|
|
|
|
29,305,684 |
|
|
|
|
|
|
|
|
|
|
|
|
|
|
|
|
|
|
|
|
|
|
|
|
|
|
|
|
|
|
Principal
Amount (000) |
|
|
Description (1) |
|
Coupon (6) |
|
|
Reference Rate (6) |
|
|
Spread (6) |
|
|
Maturity (7) |
|
|
Ratings (2) |
|
|
Value |
|
|
|
|
|
|
|
|
VARIABLE RATE SENIOR LOAN INTERESTS – 9.3% (6.7% of Total Investments)
(6) |
|
|
|
|
|
|
|
|
|
|
|
|
|
| |
|
|
Automobile Components – 0.4% |
|
|
|
|
|
|
|
|
|
|
|
|
|
|
|
|
|
|
|
|
|
|
|
|
|
|
| $ |
1,078 |
|
|
Autokiniton US Holdings, Inc., Term Loan B |
|
|
9.584% |
|
|
|
SOFR30A |
|
|
|
4.500% |
|
|
|
4/06/28 |
|
|
|
B |
|
|
$ |
1,073,553 |
|
|
|
|
|
Total Automobile Components |
|
|
|
|
|
|
|
|
|
|
|
|
|
|
|
|
|
|
|
|
|
|
1,073,553 |
|
|
|
|
|
|
|
|
|
| |
|
|
Beverages – 1.0% |
|
|
|
|
|
|
|
|
|
|
|
|
|
|
|
|
|
|
|
|
|
|
|
|
|
|
| |
871 |
|
|
Sunshine Investments B.V., Term Loan |
|
|
9.336% |
|
|
|
SOFR90A |
|
|
|
4.250% |
|
|
|
5/05/29 |
|
|
|
B+ |
|
|
|
869,537 |
|
| |
1,960 |
|
|
Triton Water Holdings, Inc, Term Loan |
|
|
5.242% |
|
|
|
3-Month LIBOR |
|
|
|
0.000% |
|
|
|
3/31/28 |
|
|
|
B |
|
|
|
1,899,675 |
|
|
|
|
|
Total Beverages |
|
|
|
|
|
|
|
|
|
|
|
|
|
|
|
|
|
|
|
|
|
|
2,769,212 |
|
|
|
|
|
|
|
|
|
| |
|
|
Chemicals – 0.8% |
|
|
|
|
|
|
|
|
|
|
|
|
|
|
|
|
|
|
|
|
|
|
|
|
|
|
| |
2,135 |
|
|
Nouryon Finance B.V., Term Loan B |
|
|
9.318% |
|
|
|
TSFR3M |
|
|
|
4.000% |
|
|
|
4/03/28 |
|
|
|
BB- |
|
|
|
2,118,988 |
|
| |
281 |
|
|
W.R. Grace & Co.-Conn., Term Loan B |
|
|
9.313% |
|
|
|
3-Month LIBOR |
|
|
|
3.750% |
|
|
|
9/22/28 |
|
|
|
BB+ |
|
|
|
279,522 |
|
|
|
|
|
Total Chemicals |
|
|
|
|
|
|
|
|
|
|
|
|
|
|
|
|
|
|
|
|
|
|
2,398,510 |
|
|
|
|
|
|
|
|
|
| |
|
|
Diversified Consumer Services – 0.9% |
|
|
|
|
|
|
|
|
|
|
|
|
|
|
|
|
|
|
|
|
|
|
|
|
|
|
| |
3,006 |
|
|
Spin Holdco Inc., Term Loan |
|
|
9.230% |
|
|
|
3-Month LIBOR |
|
|
|
4.000% |
|
|
|
3/04/28 |
|
|
|
B- |
|
|
|
2,594,663 |
|
|
|
|
|
Total Diversified Consumer Services |
|
|
|
|
|
|
|
|
|
|
|
|
|
|
|
|
|
|
|
|
|
|
2,594,663 |
|
|
|
|
|
|
|
|
|
| |
|
|
Health Care Equipment & Supplies – 1.0% |
|
|
|
|
|
|
|
|
|
|
|
|
|
|
|
|
|
|
|
|
|
|
|
|
|
|
| |
2,992 |
|
|
Medline Borrower, LP, Term Loan B |
|
|
8.352% |
|
|
|
SOFR30A |
|
|
|
3.250% |
|
|
|
10/21/28 |
|
|
|
BB- |
|
|
|
2,961,557 |
|
|
|
|
|
Total Health Care Equipment & Supplies |
|
|
|
|
|
|
|
|
|
|
|
|
|
|
|
|
|
|
|
|
|
|
2,961,557 |
|
|
|
|
|
|
|
|
|
| |
|
|
Health Care Providers & Services – 1.1% |
|
|
|
|
|
|
|
|
|
|
|
|
|
|
|
|
|
|
|
|
|
|
|
|
|
|
| |
661 |
|
|
ICON Luxembourg S.A.R.L., Term Loan |
|
|
7.753% |
|
|
|
SOFR90A |
|
|
|
2.250% |
|
|
|
7/01/28 |
|
|
|
BB+ |
|
|
|
662,182 |
|
| |
2,817 |
|
|
Onex TSG Intermediate Corp., Term Loan B |
|
|
10.057% |
|
|
|
3-Month LIBOR |
|
|
|
4.750% |
|
|
|
2/26/28 |
|
|
|
B |
|
|
|
2,518,141 |
|
| |
4 |
|
|
US Radiology Specialists, Inc., Term Loan |
|
|
10.452% |
|
|
|
SOFR30A |
|
|
|
5.250% |
|
|
|
12/15/27 |
|
|
|
B- |
|
|
|
3,601 |
|
|
|
|
|
Total Health Care Providers & Services |
|
|
|
|
|
|
|
|
|
|
|
|
|
|
|
|
|
|
|
|
|
|
3,183,924 |
|
27
|
|
|
|
|
| JGH |
|
Nuveen Global High Income Fund (continued) |
| |
Portfolio of Investments June 30, 2023 |
|
|
(Unaudited) |
|
|
|
|
|
|
|
|
|
|
|
|
|
|
|
|
|
|
|
|
|
|
|
|
|
|
|
|
|
Principal
Amount (000) |
|
|
Description (1) |
|
Coupon (6) |
|
|
Reference Rate (6) |
|
|
Spread (6) |
|
|
Maturity (7) |
|
|
Ratings (2) |
|
|
Value |
|
|
|
|
|
|
|
|
|
| |
|
|
Hotels, Restaurants & Leisure – 0.2% |
|
|
|
|
|
|
|
|
|
|
|
|
|
|
|
|
|
|
|
|
|
|
|
|
|
|
|
$
|
644 |
|
|
Life Time Fitness Inc , Term Loan B |
|
|
9.800% |
|
|
|
TSFR3M |
|
|
|
4.500% |
|
|
|
1/15/26 |
|
|
|
BB- |
|
|
$
|
644,731 |
|
|
|
|
|
Total Hotels, Restaurants & Leisure |
|
|
|
|
|
|
|
|
|
|
|
|
|
|
|
|
|
|
|
|
|
|
644,731 |
|
|
|
|
|
|
|
|
|
| |
|
|
Life Sciences Tools & Services – 0.1% |
|
|
|
|
|
|
|
|
|
|
|
|
|
|
|
|
|
|
|
|
|
|
|
|
|
|
| |
165 |
|
|
ICON Luxembourg S.A.R.L., Term Loan |
|
|
7.753% |
|
|
|
SOFR90A |
|
|
|
2.250% |
|
|
|
7/01/28 |
|
|
|
BB+ |
|
|
|
164,983 |
|
|
|
|
|
Total Life Sciences Tools & Services |
|
|
|
|
|
|
|
|
|
|
|
|
|
|
|
|
|
|
|
|
|
|
164,983 |
|
|
|
|
|
|
|
|
|
| |
|
|
Machinery – 0.2% |
|
|
|
|
|
|
|
|
|
|
|
|
|
|
|
|
|
|
|
|
|
|
|
|
|
|
| |
501 |
|
|
Emerald Debt Merger Sub LLC, Term Loan , (WI/DD) |
|
|
TBD |
|
|
|
TBD |
|
|
|
TBD |
|
|
|
TBD |
|
|
|
BB+ |
|
|
|
501,544 |
|
|
|
|
|
Total Machinery |
|
|
|
|
|
|
|
|
|
|
|
|
|
|
|
|
|
|
|
|
|
|
501,544 |
|
|
|
|
|
|
|
|
|
| |
|
|
Media – 0.1% |
|
|
|
|
|
|
|
|
|
|
|
|
|
|
|
|
|
|
|
|
|
|
|
|
|
|
| |
405 |
|
|
Formula One Holdings Limited, Term Loan B |
|
|
8.102% |
|
|
|
SOFR30A |
|
|
|
3.000% |
|
|
|
1/15/30 |
|
|
|
BB+ |
|
|
|
405,557 |
|
|
|
|
|
Total Media |
|
|
|
|
|
|
|
|
|
|
|
|
|
|
|
|
|
|
|
|
|
|
405,557 |
|
|
|
|
|
|
|
|
|
| |
|
|
Passenger Airlines – 1.3% |
|
|
|
|
|
|
|
|
|
|
|
|
|
|
|
|
|
|
|
|
|
|
|
|
|
|
| |
750 |
|
|
AAdvantage Loyalty IP Ltd., Term Loan |
|
|
10.000% |
|
|
|
3-Month LIBOR |
|
|
|
4.750% |
|
|
|
4/20/28 |
|
|
|
Ba2 |
|
|
|
767,010 |
|
| |
3,138 |
|
|
Air Canada, Term Loan B |
|
|
8.839% |
|
|
|
3-Month LIBOR |
|
|
|
3.500% |
|
|
|
8/11/28 |
|
|
|
Ba2 |
|
|
|
3,142,505 |
|
| |
11 |
|
|
SkyMiles IP Ltd., Term Loan B |
|
|
8.798% |
|
|
|
SOFR90A |
|
|
|
3.750% |
|
|
|
10/20/27 |
|
|
|
Baa1 |
|
|
|
11,583 |
|
|
|
|
|
Total Passenger Airlines |
|
|
|
|
|
|
|
|
|
|
|
|
|
|
|
|
|
|
|
|
|
|
3,921,098 |
|
|
|
|
|
|
|
|
|
| |
|
|
Personal Care Products – 0.2% |
|
|
|
|
|
|
|
|
|
|
|
|
|
|
|
|
|
|
|
|
|
|
|
|
|
|
| |
784 |
|
|
Journey Personal Care Corp., Term Loan B |
|
|
9.981% |
|
|
|
6-Month LIBOR |
|
|
|
4.250% |
|
|
|
3/01/28 |
|
|
|
CCC+ |
|
|
|
673,585 |
|
|
|
|
|
Total Personal Care Products |
|
|
|
|
|
|
|
|
|
|
|
|
|
|
|
|
|
|
|
|
|
|
673,585 |
|
|
|
|
|
|
|
|
|
| |
|
|
Software – 0.4% |
|
|
|
|
|
|
|
|
|
|
|
|
|
|
|
|
|
|
|
|
|
|
|
|
|
|
| |
1,194 |
|
|
Open Text Corporation, Term Loan B |
|
|
8.584% |
|
|
|
SOFR30A |
|
|
|
3.500% |
|
|
|
8/25/29 |
|
|
|
BBB- |
|
|
|
1,200,716 |
|
|
|
|
|
Total Software |
|
|
|
|
|
|
|
|
|
|
|
|
|
|
|
|
|
|
|
|
|
|
1,200,716 |
|
|
|
|
|
|
|
|
|
| |
|
|
Specialty Retail – 1.2% |
|
|
|
|
|
|
|
|
|
|
|
|
|
|
|
|
|
|
|
|
|
|
|
|
|
|
| |
1,463 |
|
|
Great Outdoors Group, LLC, Term Loan B |
|
|
8.943% |
|
|
|
1-Month LIBOR |
|
|
|
4.250% |
|
|
|
3/05/28 |
|
|
|
BB |
|
|
|
1,453,555 |
|
| |
1,965 |
|
|
PetSmart, Inc., Term Loan B |
|
|
8.834% |
|
|
|
SOFR30A |
|
|
|
3.750% |
|
|
|
2/12/28 |
|
|
|
BB |
|
|
|
1,964,597 |
|
| |
220 |
|
|
WOOF Holdings, Inc, Term Loan, First Lien |
|
|
8.954% |
|
|
|
TSFR1M |
|
|
|
3.750% |
|
|
|
12/21/27 |
|
|
|
B2 |
|
|
|
216,089 |
|
|
|
|
|
Total Specialty Retail |
|
|
|
|
|
|
|
|
|
|
|
|
|
|
|
|
|
|
|
|
|
|
3,634,241 |
|
|
|
|
|
|
|
|
|
| |
|
|
Transportation Infrastructure – 0.2% |
|
|
|
|
|
|
|
|
|
|
|
|
|
|
|
|
|
|
|
|
|
|
|
|
|
|
| |
595 |
|
|
Brown Group Holding, LLC, Term Loan B2 |
|
|
8.887% |
|
|
|
SOFR30A +
SOFR90A + TSFR3M |
|
|
|
3.750% |
|
|
|
6/09/29 |
|
|
|
B+ |
|
|
|
595,074 |
|
|
|
|
|
Total Transportation Infrastructure |
|
|
|
|
|
|
|
|
|
|
|
|
|
|
|
|
|
|
|
|
|
|
595,074 |
|
|
|
|
|
|
|
|
|
| |
|
|
Wireless Telecommunication Services – 0.2% |
|
|
|
|
|
|
|
|
|
|
|
|
|
|
|
|
|
|
|
|
|
|
|
|
|
|
| |
632 |
|
|
GOGO Intermediate Holdings LLC, Term Loan B |
|
|
8.967% |
|
|
|
SOFR30A |
|
|
|
3.750% |
|
|
|
4/30/28 |
|
|
|
B+ |
|
|
|
631,495 |
|
|
|
|
|
Total Wireless Telecommunication Services |
|
|
|
|
|
|
|
|
|
|
|
|
|
|
|
|
|
|
|
|
|
|
631,495 |
|
|
|
|
|
Total Variable Rate Senior Loan Interests
(cost $27,984,975) |
|
|
|
|
|
|
|
|
|
|
|
|
|
|
|
|
|
|
|
27,354,443 |
|
|
|
|
|
|
|
|
|
Principal
Amount (000) |
|
|
Description (1), (8) |
|
|
|
|
|
|
|
Coupon |
|
|
Maturity |
|
|
Ratings (2) |
|
|
Value |
|
|
|
|
|
|
|
|
CONTINGENT CAPITAL SECURITIES – 5.3% (3.8% of Total Investments) |
|
|
|
|
|
|
|
|
|
|
|
|
|
| |
|
|
Banks – 5.0% |
|
|
|
|
|
|
|
|
|
|
|
|
|
|
|
|
|
|
|
|
|
|
|
|
|
|
| $ |
1,100 |
|
|
Banco Bilbao Vizcaya Argentaria SA |
|
|
|
|
|
|
|
|
|
|
6.500% |
|
|
|
N/A (4) |
|
|
|
Ba2 |
|
|
$ |
1,031,470 |
|
| |
1,980 |
|
|
Banco Mercantil del Norte SA/Grand Cayman, 144A |
|
|
|
|
|
|
|
6.750% |
|
|
|
N/A (4) |
|
|
|
Ba2 |
|
|
|
1,897,383 |
|
| |
1,000 |
|
|
Banco Santander SA , Reg S |
|
|
|
|
|
|
|
|
|
|
7.500% |
|
|
|
N/A (4) |
|
|
|
Ba1 |
|
|
|
952,976 |
|
| |
1,100 |
|
|
Banco Santander SA |
|
|
|
|
|
|
|
|
|
|
4.750% |
|
|
|
N/A (4) |
|
|
|
Ba1 |
|
|
|
841,752 |
|
| |
1,000 |
|
|
Bancolombia SA |
|
|
|
|
|
|
|
|
|
|
4.625% |
|
|
|
12/18/29 |
|
|
|
Ba3 |
|
|
|
851,250 |
|
| |
1,475 |
|
|
Barclays PLC |
|
|
|
|
|
|
|
|
|
|
8.000% |
|
|
|
N/A (4) |
|
|
|
BBB- |
|
|
|
1,317,765 |
|
| |
1,000 |
|
|
BBVA Bancomer SA/Texas, 144A |
|
|
|
|
|
|
|
|
|
|
8.450% |
|
|
|
6/29/38 |
|
|
|
Baa3 |
|
|
|
1,001,000 |
|
28
|
|
|
|
|
|
|
|
|
|
|
|
|
|
|
|
|
|
|
|
|
|
|
|
|
|
|
|
|
Principal
Amount (000) |
|
|
Description (1), (8) |
|
|
|
|
|
|
|
Coupon |
|
|
Maturity |
|
|
Ratings (2) |
|
|
Value |
|
|
|
|
|
|
|
|
|
| |
|
|
Banks (continued) |
|
|
|
|
|
|
|
|
|
|
|
|
|
|
|
|
|
|
|
|
|
|
|
|
|
|
|
$
|
1,000 |
|
|
BNP Paribas SA, 144A |
|
|
|
|
|
|
|
|
|
|
7.000% |
|
|
|
N/A (4) |
|
|
|
BBB |
|
|
$
|
895,167 |
|
| |
2,000 |
|
|
ING Groep NV |
|
|
|
|
|
|
|
|
|
|
6.500% |
|
|
|
N/A (4) |
|
|
|
BBB |
|
|
|
1,866,400 |
|
| |
1,500 |
|
|
Lloyds Banking Group PLC |
|
|
|
|
|
|
|
|
|
|
8.000% |
|
|
|
N/A (4) |
|
|
|
Baa3 |
|
|
|
1,370,475 |
|
| |
2,000 |
|
|
Macquarie Bank Ltd/London, 144A |
|
|
|
|
|
|
|
|
|
|
6.125% |
|
|
|
N/A (4) |
|
|
|
Baa3 |
|
|
|
1,801,537 |
|
| |
1,000 |
|
|
Societe Generale SA, 144A |
|
|
|
|
|
|
|
|
|
|
8.000% |
|
|
|
N/A (4) |
|
|
|
BB |
|
|
|
938,734 |
|
|
|
|
|
Total Banks |
|
|
|
|
|
|
|
|
|
|
|
|
|
|
|
|
|
|
|
|
|
|
14,765,909 |
|
|
|
|
|
|
|
|
|
| |
|
|
Capital Markets – 0.3% |
|
|
|
|
|
|
|
|
|
|
|
|
|
|
|
|
|
|
|
|
|
|
|
|
|
|
| |
1,500 |
|
|
Credit Suisse Group AG, 144A |
|
|
|
|
|
|
|
|
|
|
9.750% |
|
|
|
N/A (4) |
|
|
|
N/R |
|
|
|
55,995 |
|
| |
1,050 |
|
|
Deutsche Bank AG |
|
|
|
|
|
|
|
|
|
|
6.000% |
|
|
|
N/A (4) |
|
|
|
Ba2 |
|
|
|
837,795 |
|
|
|
|
|
Total Capital Markets |
|
|
|
|
|
|
|
|
|
|
|
|
|
|
|
|
|
|
|
|
|
|
893,790 |
|
|
|
|
|
Total Contingent Capital Securities
(cost $18,460,869) |
|
|
|
|
|
|
|
|
|
|
|
|
|
|
|
|
|
|
|
|
|
|
15,659,699 |
|
|
|
|
|
|
|
|
|
|
|
|
|
|
|
|
|
|
|
|
|
|
|
|
|
|
|
|
|
|
| Shares |
|
|
Description (1) |
|
|
|
|
|
|
|
Coupon |
|
|
|
|
|
Ratings (2) |
|
|
Value |
|
|
|
|
|
|
|
|
$25 PAR (OR SIMILAR) RETAIL PREFERRED – 1.3% (0.9% of Total
Investments) |
|
|
|
|
|
|
|
|
|
|
|
|
|
| |
|
|
Banks – 0.1% |
|
|
|
|
|
|
|
|
|
|
|
|
|
|
|
|
|
|
|
|
|
|
|
|
|
|
| |
25,200 |
|
|
Western Alliance Bancorp |
|
|
|
|
|
|
|
|
|
|
4.250% |
|
|
|
|
|
|
|
Ba3 |
|
|
$ |
360,360 |
|
|
|
|
|
Total Banks |
|
|
|
|
|
|
|
|
|
|
|
|
|
|
|
|
|
|
|
|
|
|
360,360 |
|
|
|
|
|
|
|
|
|
| |
|
|
Insurance – 0.3% |
|
|
|
|
|
|
|
|
|
|
|
|
|
|
|
|
|
|
|
|
|
|
|
|
|
|
| |
35,000 |
|
|
American Equity Investment Life Holding Co |
|
|
|
|
|
|
|
|
|
|
6.625% |
|
|
|
|
|
|
|
BB |
|
|
|
808,150 |
|
|
|
|
|
Total Insurance |
|
|
|
|
|
|
|
|
|
|
|
|
|
|
|
|
|
|
|
|
|
|
808,150 |
|
|
|
|
|
|
|
|
|
| |
|
|
Oil, Gas & Consumable Fuels – 0.5% |
|
|
|
|
|
|
|
|
|
|
|
|
|
|
|
|
|
|
|
|
|
|
|
|
|
|
| |
60,000 |
|
|
NuStar Energy LP |
|
|
|
|
|
|
|
|
|
|
12.299% |
|
|
|
|
|
|
|
B2 |
|
|
|
1,530,600 |
|
|
|
|
|
Total Oil, Gas & Consumable Fuels |
|
|
|
|
|
|
|
|
|
|
|
|
|
|
|
|
|
|
|
|
|
|
1,530,600 |
|
|
|
|
|
|
|
|
|
| |
|
|
Trading Companies & Distributors – 0.4% |
|
|
|
|
|
|
|
|
|
|
|
|
|
|
|
|
|
|
|
|
|
|
|
|
|
|
| |
40,000 |
|
|
WESCO International Inc |
|
|
|
|
|
|
|
|
|
|
10.625% |
|
|
|
|
|
|
|
B+ |
|
|
|
1,068,800 |
|
|
|
|
|
Total Trading Companies & Distributors |
|
|
|
|
|
|
|
|
|
|
|
|
|
|
|
|
|
|
|
|
|
|
1,068,800 |
|
|
|
|
|
Total $25 Par (or similar) Retail Preferred
(cost $4,069,685) |
|
|
|
|
|
|
|
|
|
|
|
|
|
|
|
|
|
|
|
3,767,910 |
|
|
|
|
|
|
|
|
|
| Shares |
|
|
Description (1) |
|
|
|
|
|
|
|
|
|
|
|
|
|
|
|
|
Value |
|
|
|
|
|
|
|
|
COMMON STOCKS – 0.2% (0.2% of Total Investments) |
|
|
|
|
|
|
|
|
|
|
|
|
|
| |
|
|
Passenger Airlines – 0.2% |
|
|
|
|
|
|
|
|
|
|
|
|
|
|
|
|
|
|
|
|
|
|
|
|
|
|
| |
47,127 |
|
|
Grupo Aeromexico SAB de CV (9) |
|
|
|
|
|
|
|
|
|
|
|
|
|
|
|
|
|
|
|
|
|
$ |
653,892 |
|
|
|
|
|
Total Passenger Airlines |
|
|
|
|
|
|
|
|
|
|
|
|
|
|
|
|
|
|
|
|
|
|
653,892 |
|
|
|
|
|
|
|
| |
|
|
Semiconductors & Semiconductor Equipment – 0.0% |
|
|
|
|
|
|
|
|
|
|
|
|
|
|
|
|
|
|
|
|
|
| |
717 |
|
|
Bright Bidco BV (9),(10) |
|
|
|
|
|
|
|
|
|
|
|
|
|
|
|
|
|
|
|
|
|
|
292 |
|
|
|
|
|
Total Semiconductors & Semiconductor
Equipment |
|
|
|
|
|
|
|
|
|
|
|
|
|
|
|
|
|
|
|
292 |
|
|
|
|
|
Total Common Stocks
(cost $885,858) |
|
|
|
|
|
|
|
|
|
|
|
|
|
|
|
|
|
|
|
|
|
|
654,184 |
|
|
|
|
|
|
|
|
|
Principal
Amount (000) |
|
|
Description (1) |
|
|
|
|
|
|
|
Coupon |
|
|
Maturity |
|
|
Ratings (2) |
|
|
Value |
|
|
|
|
|
|
|
|
|
|
|
|
ASSET-BACKED SECURITIES – 0.2% (0.2% of Total Investments) |
|
|
|
|
|
|
|
|
|
|
|
|
|
|
|
|
|
|
|
|
|
|
|
|
|
|
|
| $ |
750 |
|
|
Industrial DPR Funding Ltd, 2022 1A, 144A |
|
|
|
5.380% |
|
|
|
4/15/34 |
|
|
|
BBB |
|
|
$ |
636,712 |
|
|
|
|
|
Total Asset-Backed Securities
(cost $750,000) |
|
|
|
|
|
|
|
|
|
|
|
|
|
|
|
|
|
|
|
|
|
|
636,712 |
|
|
|
|
|
Total Long-Term Investments
(cost $453,002,951) |
|
|
|
|
|
|
|
|
|
|
|
|
|
|
|
|
|
|
|
398,792,407 |
|
29
|
|
|
|
|
| JGH |
|
Nuveen Global High Income Fund (continued) |
| |
Portfolio of Investments June 30, 2023 |
|
|
(Unaudited) |
|
|
|
|
|
|
|
|
|
|
|
|
|
|
|
|
|
|
|
|
|
|
|
|
|
Principal
Amount (000) |
|
|
Description (1) |
|
|
|
|
Coupon |
|
|
Maturity |
|
|
|
|
|
Value |
|
|
|
|
|
|
|
|
|
|
SHORT-TERM INVESTMENTS – 4.0%(2.8% of Total Investments) |
|
|
|
|
|
|
|
|
|
|
|
|
|
|
|
|
|
|
|
| |
|
|
REPURCHASE AGREEMENTS – 4.0% (2.8% of Total Investments) |
|
|
|
|
|
|
|
|
|
|
|
|
|
| $ |
10,830 |
|
|
Repurchase Agreement with Fixed Income Clearing Corporation, dated 6/30/23,
repurchase
price $10,834,522, collateralized by $10,919,800, U.S. Treasury Note,
4.000%, due 2/28/30, value $11,046,691 |
|
|
|
5.010% |
|
|
|
7/03/23 |
|
|
|
|
|
|
$ |
10,830,000 |
|
|
|
|
|
|
|
| |
829 |
|
|
Repurchase Agreement with Fixed Income Clearing
Corporation, dated 6/30/23,
repurchase price $828,938, collateralized by $966,100, U.S. Treasury Note,
1.500%, due 11/30/28, value $845,469 |
|
|
|
1.520% |
|
|
|
7/03/23 |
|
|
|
|
|
|
|
828,833 |
|
|
|
|
|
Total Repurchase Agreements
(cost $11,658,833) |
|
|
|
|
|
|
|
11,658,833 |
|
|
|
|
|
Total Short-Term Investments
(cost $11,658,833) |
|
|
|
|
|
|
|
|
|
|
|
|
|
|
|
|
|
|
11,658,833 |
|
|
|
|
|
Total Investments
(cost $464,661,784) – 139.4% |
|
|
|
|
|
|
|
410,451,240 |
|
|
|
|
|
Borrowings – (40.4)% (11), (12) |
|
|
|
|
|
|
|
|
|
|
|
|
|
|
|
|
|
|
(119,000,000 |
) |
|
|
|
|
Other Assets & Liabilities, Net –
1.0% (13) |
|
|
|
|
|
|
|
|
|
|
|
|
|
|
|
|
|
|
2,981,660 |
|
|
|
|
|
Net Assets Applicable to Common Shares –
100% |
|
|
|
|
|
|
$ |
294,432,900 |
|
Investments in Derivatives
Interest Rate
Swaps – OTC Uncleared
|
|
|
|
|
|
|
|
|
|
|
|
|
|
|
|
|
|
|
|
|
|
|
|
|
|
|
|
|
|
|
|
|
|
|
|
|
|
|
|
|
| Counterparty |
|
Notional
Amount |
|
|
Fund
Pay/Receive
Floating Rate |
|
|
Floating Rate Index |
|
|
Fixed Rate
(Annualized) |
|
|
Fixed Rate
Payment
Frequency |
|
|
Effective
Date (14) |
|
|
Optional
Termination
Date |
|
|
Maturity
Date |
|
|
Value |
|
|
Unrealized
Appreciation
(Depreciation) |
|
| Morgan Stanley Capital Services LLC |
|
$ |
87,400,000 |
|
|
|
Receive |
|
|
|
1-Month LIBOR |
|
|
|
1.994 |
% |
|
|
Monthly |
|
|
|
6/01/18 |
|
|
|
7/01/25 |
|
|
|
7/01/27 |
|
|
$ |
4,741,752 |
|
|
$ |
4,741,752 |
|
30
For Fund portfolio compliance purposes, the
Fund’s industry classifications refer to any one or more of the industry sub-classifications used by one or more widely recognized market indexes or ratings group indexes, and/or as defined by Fund
management. This definition may not apply for purposes of this report, which may combine industry sub-classifications into sectors for reporting ease.
| (1) |
All percentages shown in the Portfolio of Investments are based on net assets applicable to common shares unless otherwise
noted. |
| (2) |
The Fund uses credit quality ratings for its portfolio securities provided by Standard & Poor’s Group
(“Standard & Poor’s”), Moody’s Investors Service, Inc. (“Moody’s”) and Fitch, Inc. (“Fitch”). If all three provide a rating for a security, the middle is used; if two of the three agencies rate a
security, the lower rating is used; and if only one rating agency rates a security, that rating is used. AAA, AA, A, and BBB are investment grade ratings; BB, B, CCC/CC/C and D are below-investment grade ratings. Credit ratings are subject to
change. Holdings designated N/R are not rated by Moody’s, S&P or Fitch. |
| (3) |
Defaulted security. A security whose issuer has failed to fully pay principal and/or interest when due, or is under the
protection of bankruptcy. |
| (4) |
Perpetual security. Maturity date is not applicable. |
| (5) |
Variable rate security. The rate shown is the coupon as of the end of the reporting period. |
| (6) |
Senior loans generally pay interest at rates which are periodically adjusted by reference to a base short-term, floating
lending rate (Reference Rate) plus an assigned fixed rate (Spread). These floating lending rates are generally (i) the lending rate referenced by the London Inter-Bank Offered Rate (“LIBOR”), or (ii) the prime rate offered by one
or more major United States banks. Senior loans may be considered restricted in that the Fund ordinarily is contractually obligated to receive approval from the agent bank and/or borrower prior to the disposition of a senior loan. The rate shown is
the coupon as of the end of the reporting period. |
| (7) |
Senior loans generally are subject to mandatory and/or optional prepayment. Because of these mandatory prepayment
conditions and because there may be significant economic incentives for a borrower to prepay, prepayments of senior loans may occur. As a result, the actual remaining maturity of senior loans held may be substantially less than the stated maturities
shown. |
| (8) |
Contingent Capital Securities (“CoCos”) are hybrid securities with loss absorption characteristics built into
the terms of the security for the benefit of the issuer. For example, the terms may specify an automatic write-down of principal or a mandatory conversion into the issuer’s common stock under certain adverse circumstances, such as the
issuer’s capital ratio falling below a specified level. |
| (9) |
Non-income producing; issuer has not declared an
ex-dividend date within the past twelve months. |
| (10) |
For fair value measurement disclosure purposes, investment classified as Level 3. |
| (11) |
Borrowings as a percentage of Total Investments is 29.0%. |
| (12) |
The Fund may pledge up to 100% of its eligible investment (excluding any investments pledged as collateral to specific
investments in derivatives, when applicable) in the Portfolio of Investments as collateral for borrowings. |
| (13) |
Other assets less liabilities includes the unrealized appreciation (depreciation) of certain over-the-counter (“OTC”) derivatives as presented on the Statement of Assets and Liabilities, when applicable. The unrealized appreciation (depreciation) of OTC
cleared and exchange-traded derivatives is recognized as part of the cash collateral at brokers and/or the receivable or payable for variation margin as presented on the Statement of Assets and Liabilities, when applicable. |
| (14) |
Effective date represents the date on which both the Fund and counterparty commence interest payment accruals on each
contract. |
| 144A |
Investment is exempt from registration under Rule 144A of the Securities Act of 1933, as amended. These investments may
only be resold in transactions exempt from registration, which are normally those transactions with qualified institutional buyers. |
| LIBOR |
London Inter-Bank Offered Rate |
| PIK |
Payment-in-kind (“PIK”)
security. Depending on the terms of the security, income may be received in the form of cash, securities, or a combination of both. The PIK rate shown, where applicable, represents the annualized rate of the last PIK payment made by the issuer as of
the end of the reporting period. |
| Reg S |
Regulation S allows U.S. companies to sell securities to persons or entities located outside of the United States without
registering those securities with the Securities and Exchange Commission. Specifically, Regulation S provides a safe harbor from the registration requirements of the Securities Act for the offers and sales of securities by both foreign and domestic
issuers that are made outside the United States. |
| REIT |
Real Estate Investment Trust |
| SOFR30A |
30 Day Average Secured Overnight Financing Rate |
| SOFR90A |
90 Day Average Secured Overnight Financing Rate |
| TBD |
Senior loan purchased on a when-issued or delayed-delivery basis. Certain details associated with this purchase are not
known prior to the settlement date of the transaction. In addition, senior loans typically trade without accrued interest and therefore a coupon rate is not available prior to settlement. At settlement, if still unknown, the borrower or counterparty
will provide the Fund with the final coupon rate and maturity date. |
| TSFR1M |
CME Term SOFR 1 Month |
| TSFR3M |
CME Term SOFR 3 Month |
| WI/DD |
Purchased on a when-issued or delayed delivery basis. |
See Notes to Financial Statements
31
|
|
|
| NPCT |
|
Nuveen Core Plus Impact Fund
Portfolio of Investments(16) June 30, 2023 |
| |
|
(Unaudited) |
|
|
|
|
|
|
|
|
|
|
|
|
|
|
|
|
|
|
|
|
|
|
|
Principal
Amount (000) (1) |
|
|
|
|
Description (2) |
|
Coupon |
|
|
Maturity |
|
|
Ratings (3) |
|
|
Value |
|
|
|
|
|
|
|
|
|
|
|
|
LONG-TERM INVESTMENTS – 160.9% (98.9% of Total Investments) |
|
|
|
|
|
|
|
|
|
|
|
|
|
|
|
|
|
|
|
|
CORPORATE BONDS – 95.5% (58.7% of Total Investments) |
|
|
|
|
|
|
|
|
|
|
|
|
|
|
|
|
| |
|
|
|
|
Airlines – 1.4% |
|
|
|
|
|
|
|
|
|
|
|
|
|
|
|
|
|
|
|
| $ |
5,000 |
|
|
|
|
Delta Air Lines 2019-1
Class AA Pass Through Trust, 2020-A |
|
|
3.204% |
|
|
|
4/25/24 |
|
|
|
A1 |
|
|
$ |
4,899,392 |
|
|
|
|
|
|
|
Total Airlines |
|
|
|
|
|
|
|
|
|
|
|
|
|
|
4,899,392 |
|
|
|
|
|
|
|
|
| |
|
|
|
|
Automobile Components – 1.0% |
|
|
|
|
|
|
|
|
|
|
|
|
|
|
|
|
|
|
|
| |
4,000 |
|
|
|
|
Dana Inc |
|
|
4.250% |
|
|
|
9/01/30 |
|
|
|
BB+ |
|
|
|
3,330,137 |
|
|
|
|
|
|
|
Total Automobile Components |
|
|
|
|
|
|
|
|
|
|
|
|
|
|
3,330,137 |
|
|
|
|
|
|
|
|
| |
|
|
|
|
Automobiles – 4.2% |
|
|
|
|
|
|
|
|
|
|
|
|
|
|
|
|
|
|
|
| |
3,510 |
|
|
|
|
Ford Motor Co |
|
|
3.250% |
|
|
|
2/12/32 |
|
|
|
BB+ |
|
|
|
2,761,262 |
|
| |
15,300 |
|
|
|
|
Harley-Davidson Inc (4) |
|
|
4.625% |
|
|
|
7/28/45 |
|
|
|
BBB+ |
|
|
|
11,598,222 |
|
|
|
|
|
|
|
Total Automobiles |
|
|
|
|
|
|
|
|
|
|
|
|
|
|
14,359,484 |
|
|
|
|
|
|
|
|
| |
|
|
|
|
Banks – 14.2% |
|
|
|
|
|
|
|
|
|
|
|
|
|
|
|
|
|
|
|
| |
5,000 |
|
|
|
|
Citigroup Inc |
|
|
2.014% |
|
|
|
1/25/26 |
|
|
|
A |
|
|
|
4,696,970 |
|
| |
17,000 |
|
|
|
|
Intesa Sanpaolo SpA, 144A |
|
|
4.950% |
|
|
|
6/01/42 |
|
|
|
BB+ |
|
|
|
11,195,835 |
|
| |
2,904 |
|
|
|
|
JPMorgan Chase & Co |
|
|
0.653% |
|
|
|
9/16/24 |
|
|
|
AA- |
|
|
|
2,870,104 |
|
| |
3,583 |
|
|
|
|
JPMorgan Chase & Co |
|
|
0.768% |
|
|
|
8/09/25 |
|
|
|
AA- |
|
|
|
3,374,594 |
|
| |
5,000 |
|
|
|
|
Lloyds Banking Group PLC |
|
|
4.976% |
|
|
|
8/11/33 |
|
|
|
A |
|
|
|
4,677,005 |
|
| |
10,000 |
|
|
|
|
Standard Chartered PLC, 144A (4) |
|
|
5.300% |
|
|
|
1/09/43 |
|
|
|
BBB+ |
|
|
|
8,781,810 |
|
| |
15,000 |
|
|
|
|
UniCredit SpA, 144A |
|
|
5.459% |
|
|
|
6/30/35 |
|
|
|
Baa3 |
|
|
|
12,729,743 |
|
|
|
|
|
|
|
Total Banks |
|
|
|
|
|
|
|
|
|
|
|
|
|
|
48,326,061 |
|
|
|
|
|
|
|
|
| |
|
|
|
|
Broadline Retail – 2.0% |
|
|
|
|
|
|
|
|
|
|
|
|
|
|
|
|
|
|
|
| |
10,000 |
|
|
|
|
Nordstrom Inc |
|
|
5.000% |
|
|
|
1/15/44 |
|
|
|
BB+ |
|
|
|
6,944,900 |
|
|
|
|
|
|
|
Total Broadline Retail |
|
|
|
|
|
|
|
|
|
|
|
|
|
|
6,944,900 |
|
|
|
|
|
|
|
|
| |
|
|
|
|
Capital Markets – 2.4% |
|
|
|
|
|
|
|
|
|
|
|
|
|
|
|
|
|
|
|
| |
9,000 |
|
|
|
|
Banco BTG Pactual SA/Cayman Islands, 144A |
|
|
2.750% |
|
|
|
1/11/26 |
|
|
|
Ba2 |
|
|
|
8,190,939 |
|
|
|
|
|
|
|
Total Capital Markets |
|
|
|
|
|
|
|
|
|
|
|
|
|
|
8,190,939 |
|
|
|
|
|
|
|
|
| |
|
|
|
|
Chemicals – 4.5% |
|
|
|
|
|
|
|
|
|
|
|
|
|
|
|
|
|
|
|
| |
5,000 |
|
|
|
|
LG Chem Ltd, 144A |
|
|
2.375% |
|
|
|
7/07/31 |
|
|
|
A3 |
|
|
|
4,112,509 |
|
| |
5,000 |
|
|
|
|
LYB International Finance III LLC |
|
|
3.800% |
|
|
|
10/01/60 |
|
|
|
BBB |
|
|
|
3,364,971 |
|
| |
8,108 |
|
|
|
|
Star Energy Geothermal Wayang Windu Ltd, 144A |
|
|
6.750% |
|
|
|
4/24/33 |
|
|
|
Ba3 |
|
|
|
7,937,973 |
|
|
|
|
|
|
|
Total Chemicals |
|
|
|
|
|
|
|
|
|
|
|
|
|
|
15,415,453 |
|
|
|
|
|
|
|
|
| |
|
|
|
|
Commercial Services & Supplies – 0.5% |
|
|
|
|
|
|
|
|
|
|
|
|
|
|
|
|
|
|
|
| |
2,040 |
|
|
|
|
New York Public Library Astor Lenox & Tilden
Foundations/The |
|
|
4.305% |
|
|
|
7/01/45 |
|
|
|
AA- |
|
|
|
1,745,748 |
|
|
|
|
|
|
|
Total Commercial Services & Supplies |
|
|
|
|
|
|
|
|
|
|
|
|
|
|
1,745,748 |
|
|
|
|
|
|
|
|
| |
|
|
|
|
Communications Equipment – 2.1% |
|
|
|
|
|
|
|
|
|
|
|
|
|
|
|
|
|
|
|
| |
10,000 |
|
|
|
|
Vodafone Group PLC |
|
|
5.125% |
|
|
|
6/04/81 |
|
|
|
BB+ |
|
|
|
7,259,200 |
|
|
|
|
|
|
|
Total Communications Equipment |
|
|
|
|
|
|
|
|
|
|
|
|
|
|
7,259,200 |
|
|
|
|
|
|
|
|
| |
|
|
|
|
Construction Materials – 0.5% |
|
|
|
|
|
|
|
|
|
|
|
|
|
|
|
|
|
|
|
| |
1,550 |
|
|
|
|
Cemex SAB de CV, 144A |
|
|
9.125% |
|
|
|
12/30/49 |
|
|
|
BB- |
|
|
|
1,569,758 |
|
|
|
|
|
|
|
Total Construction Materials |
|
|
|
|
|
|
|
|
|
|
|
|
|
|
1,569,758 |
|
|
|
|
|
|
|
|
| |
|
|
|
|
Diversified Consumer Services – 1.6% |
|
|
|
|
|
|
|
|
|
|
|
|
|
|
|
|
|
|
|
| |
6,160 |
|
|
|
|
YMCA of Greater New York |
|
|
2.303% |
|
|
|
8/01/26 |
|
|
|
BBB |
|
|
|
5,477,680 |
|
|
|
|
|
|
|
Total Diversified Consumer Services |
|
|
|
|
|
|
|
|
|
|
|
|
|
|
5,477,680 |
|
32
|
|
|
|
|
|
|
|
|
|
|
|
|
|
|
|
|
|
|
|
|
|
|
Principal
Amount (000) (1) |
|
|
|
|
Description (2) |
|
Coupon |
|
|
Maturity |
|
|
Ratings (3) |
|
|
Value |
|
|
|
|
|
|
|
|
| |
|
|
|
|
Diversified Financial Services – 1.4% |
|
|
|
|
|
|
|
|
|
|
|
|
|
|
|
|
|
|
|
| |
5,400 |
|
|
EUR |
|
Power Finance Corp Ltd |
|
|
1.841% |
|
|
|
9/21/28 |
|
|
|
Baa3 |
|
|
$ |
4,852,105 |
|
|
|
|
|
|
|
Total Diversified Financial Services |
|
|
|
|
|
|
|
|
|
|
|
|
|
|
4,852,105 |
|
|
|
|
|
|
|
|
| |
|
|
|
|
Diversified REITs – 3.1% |
|
|
|
|
|
|
|
|
|
|
|
|
|
|
|
|
|
|
|
| $ |
9,915 |
|
|
|
|
HAT Holdings I LLC / HAT Holdings II LLC, 144A |
|
|
3.375% |
|
|
|
6/15/26 |
|
|
|
Baa3 |
|
|
|
8,886,253 |
|
| |
2,000 |
|
|
|
|
HAT Holdings I LLC / HAT Holdings II LLC, 144A |
|
|
3.750% |
|
|
|
9/15/30 |
|
|
|
Baa3 |
|
|
|
1,569,079 |
|
|
|
|
|
|
|
Total Diversified REITs |
|
|
|
|
|
|
|
|
|
|
|
|
|
|
10,455,332 |
|
|
|
|
|
|
|
|
| |
|
|
|
|
Diversified Telecommunication Services – 0.9% |
|
|
|
|
|
|
|
|
|
|
|
|
|
|
|
|
|
|
|
| |
5,000 |
|
|
|
|
Verizon Communications Inc |
|
|
2.987% |
|
|
|
10/30/56 |
|
|
|
A- |
|
|
|
3,175,805 |
|
|
|
|
|
|
|
Total Diversified Telecommunication Services |
|
|
|
|
|
|
|
|
|
|
|
|
|
|
3,175,805 |
|
|
|
|
|
|
|
|
| |
|
|
|
|
Electric Utilities – 20.1% |
|
|
|
|
|
|
|
|
|
|
|
|
|
|
|
|
|
|
|
| |
5,000 |
|
|
EUR |
|
EDP – Energias de Portugal SA |
|
|
1.875% |
|
|
|
3/14/82 |
|
|
|
BB+ |
|
|
|
4,198,197 |
|
| |
8,240 |
|
|
|
|
India Cleantech Energy2021 1, 144A |
|
|
4.700% |
|
|
|
8/10/26 |
|
|
|
Ba3 |
|
|
|
7,192,259 |
|
| |
6,650 |
|
|
|
|
Interchile SA, 144A |
|
|
4.500% |
|
|
|
6/30/56 |
|
|
|
Baa1 |
|
|
|
5,522,825 |
|
| |
6,674 |
|
|
|
|
Inversiones Latin America Power Ltda, 144A |
|
|
5.125% |
|
|
|
6/15/33 |
|
|
|
CCC- |
|
|
|
2,715,116 |
|
| |
2,000 |
|
|
|
|
Leeward Renewable Energy Operations LLC, 144A |
|
|
4.250% |
|
|
|
7/01/29 |
|
|
|
Ba3 |
|
|
|
1,777,892 |
|
| |
7,330 |
|
|
|
|
Liberty Utilities Finance GP 1, 144A |
|
|
2.050% |
|
|
|
9/15/30 |
|
|
|
BBB+ |
|
|
|
5,694,765 |
|
| |
7,000 |
|
|
|
|
Pattern Energy Operations LP / Pattern Energy Operations Inc, 144A |
|
|
4.500% |
|
|
|
8/15/28 |
|
|
|
BB- |
|
|
|
6,393,325 |
|
| |
2,667 |
|
|
|
|
Solar Star Funding LLC, 144A |
|
|
5.375% |
|
|
|
6/30/35 |
|
|
|
Baa1 |
|
|
|
2,625,871 |
|
| |
13,000 |
|
|
|
|
Southern California Edison Co (4) |
|
|
3.650% |
|
|
|
6/01/51 |
|
|
|
A2 |
|
|
|
9,641,130 |
|
| |
5,000 |
|
|
|
|
Star Energy Geothermal Darajat II / Star Energy Geothermal Salak, 144A |
|
|
4.850% |
|
|
|
10/14/38 |
|
|
|
Baa3 |
|
|
|
4,522,650 |
|
| |
9,548 |
|
|
|
|
Topaz Solar Farms LLC, 144A |
|
|
4.875% |
|
|
|
9/30/39 |
|
|
|
BB+ |
|
|
|
8,736,569 |
|
| |
4,255 |
|
|
|
|
Topaz Solar Farms LLC, 144A |
|
|
5.750% |
|
|
|
9/30/39 |
|
|
|
BB+ |
|
|
|
4,172,442 |
|
| |
5,800 |
|
|
|
|
Vena Energy Capital Pte Ltd , Reg S |
|
|
3.133% |
|
|
|
2/26/25 |
|
|
|
BBB- |
|
|
|
5,437,899 |
|
|
|
|
|
|
|
Total Electric Utilities |
|
|
|
|
|
|
|
|
|
|
|
|
|
|
68,630,940 |
|
|
|
|
|
|
|
|
| |
|
|
|
|
Electrical Equipment – 1.3% |
|
|
|
|
|
|
|
|
|
|
|
|
|
|
|
|
|
|
|
| |
5,000 |
|
|
|
|
Sociedad de Transmision Austral SA, 144A |
|
|
4.000% |
|
|
|
1/27/32 |
|
|
|
Baa2 |
|
|
|
4,278,600 |
|
|
|
|
|
|
|
Total Electrical Equipment |
|
|
|
|
|
|
|
|
|
|
|
|
|
|
4,278,600 |
|
|
|
|
|
|
|
|
| |
|
|
|
|
Electronic Equipment, Instruments & Components – 1.3% |
|
|
|
|
|
|
|
|
|
|
|
|
|
|
|
|
|
|
|
| |
5,000 |
|
|
|
|
SK Battery America Inc , Reg S |
|
|
2.125% |
|
|
|
1/26/26 |
|
|
|
Baa3 |
|
|
|
4,397,238 |
|
|
|
|
|
|
|
Total Electronic Equipment, Instruments &
Components |
|
|
|
|
|
|
|
|
|
|
|
|
|
|
4,397,238 |
|
|
|
|
|
|
|
|
| |
|
|
|
|
Financial Services – 0.6% |
|
|
|
|
|
|
|
|
|
|
|
|
|
|
|
|
|
|
|
| |
2,400 |
|
|
|
|
Community Preservation Corp/The |
|
|
2.867% |
|
|
|
2/01/30 |
|
|
|
AA- |
|
|
|
2,011,539 |
|
|
|
|
|
|
|
Total Financial Services |
|
|
|
|
|
|
|
|
|
|
|
|
|
|
2,011,539 |
|
|
|
|
|
|
|
|
| |
|
|
|
|
Gas Utilities – 4.2% |
|
|
|
|
|
|
|
|
|
|
|
|
|
|
|
|
|
|
|
| |
15,000 |
|
|
|
|
Brooklyn Union Gas Co/The, 144A (4) |
|
|
4.273% |
|
|
|
3/15/48 |
|
|
|
BBB+ |
|
|
|
11,461,568 |
|
| |
4,000 |
|
|
|
|
Southern Co Gas Capital Corp |
|
|
3.150% |
|
|
|
9/30/51 |
|
|
|
BBB+ |
|
|
|
2,699,117 |
|
|
|
|
|
|
|
Total Gas Utilities |
|
|
|
|
|
|
|
|
|
|
|
|
|
|
14,160,685 |
|
|
|
|
|
|
|
|
| |
|
|
|
|
Ground Transportation – 1.4% |
|
|
|
|
|
|
|
|
|
|
|
|
|
|
|
|
|
|
|
| |
7,000 |
|
|
|
|
Norfolk Southern Corp |
|
|
4.100% |
|
|
|
5/15/21 |
|
|
|
BBB+ |
|
|
|
4,934,788 |
|
|
|
|
|
|
|
Total Ground Transportation |
|
|
|
|
|
|
|
|
|
|
|
|
|
|
4,934,788 |
|
|
|
|
|
|
|
|
| |
|
|
|
|
Hotel & Resort REITs – 0.5% |
|
|
|
|
|
|
|
|
|
|
|
|
|
|
|
|
|
|
|
| |
2,000 |
|
|
|
|
Host Hotels & Resorts LP |
|
|
2.900% |
|
|
|
12/15/31 |
|
|
|
BBB- |
|
|
|
1,572,319 |
|
|
|
|
|
|
|
Total Hotel & Resort REITs |
|
|
|
|
|
|
|
|
|
|
|
|
|
|
1,572,319 |
|
|
|
|
|
|
|
|
| |
|
|
|
|
Household Durables – 1.5% |
|
|
|
|
|
|
|
|
|
|
|
|
|
|
|
|
|
|
|
| |
5,000 |
|
|
EUR |
|
Arcelik AS , Reg S |
|
|
3.000% |
|
|
|
5/27/26 |
|
|
|
BB+ |
|
|
|
4,985,640 |
|
|
|
|
|
|
|
Total Household Durables |
|
|
|
|
|
|
|
|
|
|
|
|
|
|
4,985,640 |
|
33
|
|
|
|
|
| NPCT |
|
Nuveen Core Plus Impact Fund (continued) |
| |
Portfolio of Investments June 30, 2023 |
|
|
(Unaudited) |
|
|
|
|
|
|
|
|
|
|
|
|
|
|
|
|
|
|
|
|
|
|
|
Principal
Amount (000) (1) |
|
|
|
|
Description (2) |
|
Coupon |
|
|
Maturity |
|
|
Ratings (3) |
|
|
Value |
|
|
|
|
|
|
|
| |
|
|
|
|
Independent Power and Renewable Electricity Producers – 10.1% |
|
|
|
|
|
|
|
|
|
|
|
|
|
|
|
|
|
|
$
|
1,750 |
|
|
|
|
AES Corp/The |
|
|
2.450% |
|
|
|
1/15/31 |
|
|
|
BBB- |
|
|
$ |
1,414,500 |
|
| |
6,270 |
|
|
|
|
Atlantica Sustainable Infrastructure PLC, 144A |
|
|
4.125% |
|
|
|
6/15/28 |
|
|
|
BB+ |
|
|
|
5,586,002 |
|
| |
5,100 |
|
|
|
|
Clearway Energy Operating LLC, 144A |
|
|
3.750% |
|
|
|
1/15/32 |
|
|
|
BB |
|
|
|
4,150,928 |
|
| |
7,050 |
|
|
|
|
Colbun SA, 144A |
|
|
3.150% |
|
|
|
1/19/32 |
|
|
|
BBB+ |
|
|
|
5,957,250 |
|
| |
8,075 |
|
|
|
|
Sunnova Energy Corp, 144A |
|
|
5.875% |
|
|
|
9/01/26 |
|
|
|
B1 |
|
|
|
7,380,534 |
|
| |
9,736 |
|
|
|
|
Sweihan PV Power Co PJSC2022 1, 144A |
|
|
3.625% |
|
|
|
1/31/49 |
|
|
|
BBB+ |
|
|
|
7,839,111 |
|
| |
2,722 |
|
|
|
|
UEP Penonome II SA2020 1, 144A |
|
|
6.500% |
|
|
|
10/01/38 |
|
|
|
BB |
|
|
|
2,041,007 |
|
|
|
|
|
|
|
Total Independent Power and Renewable Electricity
Producers |
|
|
|
|
|
|
|
|
|
|
|
|
|
|
34,369,332 |
|
|
|
|
|
|
|
|
| |
|
|
|
|
Machinery – 1.9% |
|
|
|
|
|
|
|
|
|
|
|
|
|
|
|
|
|
|
|
| |
5,000 |
|
|
|
|
Mueller Water Products Inc, 144A |
|
|
4.000% |
|
|
|
6/15/29 |
|
|
|
Ba1 |
|
|
|
4,436,440 |
|
| |
2,305 |
|
|
|
|
YMCA of Greater New York |
|
|
5.021% |
|
|
|
8/01/38 |
|
|
|
BBB |
|
|
|
2,052,619 |
|
|
|
|
|
|
|
Total Machinery |
|
|
|
|
|
|
|
|
|
|
|
|
|
|
6,489,059 |
|
|
|
|
|
|
|
|
| |
|
|
|
|
Media – 2.0% |
|
|
|
|
|
|
|
|
|
|
|
|
|
|
|
|
|
|
|
| |
10,000 |
|
|
|
|
Discovery Communications LLC |
|
|
4.000% |
|
|
|
9/15/55 |
|
|
|
BBB- |
|
|
|
6,646,533 |
|
|
|
|
|
|
|
Total Media |
|
|
|
|
|
|
|
|
|
|
|
|
|
|
6,646,533 |
|
|
|
|
|
|
|
|
| |
|
|
|
|
Metals & Mining – 1.3% |
|
|
|
|
|
|
|
|
|
|
|
|
|
|
|
|
|
|
|
| |
5,000 |
|
|
|
|
Teck Resources Ltd |
|
|
5.200% |
|
|
|
3/01/42 |
|
|
|
BBB- |
|
|
|
4,453,916 |
|
|
|
|
|
|
|
Total Metals & Mining |
|
|
|
|
|
|
|
|
|
|
|
|
|
|
4,453,916 |
|
|
|
|
|
|
|
|
| |
|
|
|
|
Mortgage Real Estate Investment Trusts (REITs) – 2.9% |
|
|
|
|
|
|
|
|
|
|
|
|
|
|
|
|
|
|
|
| |
5,745 |
|
|
|
|
Starwood Property Trust Inc, 144A |
|
|
3.625% |
|
|
|
7/15/26 |
|
|
|
BB+ |
|
|
|
4,942,255 |
|
| |
5,710 |
|
|
|
|
Starwood Property Trust Inc, 144A |
|
|
4.375% |
|
|
|
1/15/27 |
|
|
|
BB+ |
|
|
|
4,917,737 |
|
|
|
|
|
|
|
Total Mortgage Real Estate Investment Trusts (REITs) |
|
|
|
|
|
|
|
|
|
|
|
|
|
|
9,859,992 |
|
|
|
|
|
|
|
|
| |
|
|
|
|
Multi-Utilities – 0.5% |
|
|
|
|
|
|
|
|
|
|
|
|
|
|
|
|
|
|
|
| |
2,244 |
|
|
|
|
Consolidated Edison Co of New York Inc |
|
|
4.300% |
|
|
|
12/01/56 |
|
|
|
A- |
|
|
|
1,821,283 |
|
|
|
|
|
|
|
Total Multi-Utilities |
|
|
|
|
|
|
|
|
|
|
|
|
|
|
1,821,283 |
|
|
|
|
|
|
|
|
| |
|
|
|
|
Oil, Gas & Consumable Fuels – 3.7% |
|
|
|
|
|
|
|
|
|
|
|
|
|
|
|
|
|
|
|
| |
15,000 |
|
|
|
|
Santos Finance Ltd, 144A (4) |
|
|
3.649% |
|
|
|
4/29/31 |
|
|
|
BBB |
|
|
|
12,452,825 |
|
|
|
|
|
|
|
Total Oil, Gas & Consumable Fuels |
|
|
|
|
|
|
|
|
|
|
|
|
|
|
12,452,825 |
|
|
|
|
|
|
|
|
| |
|
|
|
|
Real Estate Management & Development – 0.6% |
|
|
|
|
|
|
|
|
|
|
|
|
|
|
|
|
|
|
|
| |
2,250 |
|
|
EUR |
|
GTC Aurora Luxembourg SA , Reg S |
|
|
2.250% |
|
|
|
6/23/26 |
|
|
|
BBB- |
|
|
|
1,873,275 |
|
|
|
|
|
|
|
Total Real Estate Management & Development |
|
|
|
|
|
|
|
|
|
|
|
|
|
|
1,873,275 |
|
|
|
|
|
|
|
|
| |
|
|
|
|
Retail REITs – 0.7% |
|
|
|
|
|
|
|
|
|
|
|
|
|
|
|
|
|
|
|
| |
3,000 |
|
|
|
|
Scentre Group Trust 2, 144A |
|
|
5.125% |
|
|
|
9/24/80 |
|
|
|
BBB+ |
|
|
|
2,531,917 |
|
|
|
|
|
|
|
Total Retail REITs |
|
|
|
|
|
|
|
|
|
|
|
|
|
|
2,531,917 |
|
|
|
|
|
|
|
|
| |
|
|
|
|
Trading Companies & Distributors – 1.1% |
|
|
|
|
|
|
|
|
|
|
|
|
|
|
|
|
|
|
|
| |
5,800 |
|
|
|
|
GATX Corp (4) |
|
|
3.100% |
|
|
|
6/01/51 |
|
|
|
BBB+ |
|
|
|
3,685,427 |
|
|
|
|
|
|
|
Total Trading Companies & Distributors |
|
|
|
|
|
|
|
|
|
|
|
|
|
|
3,685,427 |
|
|
|
|
|
|
|
Total Corporate Bonds
(cost $410,455,811) |
|
|
|
|
|
|
|
|
|
|
|
|
|
|
325,157,302 |
|
|
|
|
|
|
|
|
Principal
Amount (000) (1) |
|
|
|
|
Description (2) |
|
Coupon |
|
|
Maturity |
|
|
Ratings (3) |
|
|
Value |
|
|
|
|
|
|
|
|
|
|
|
$1,000 PAR (OR SIMILAR) INSTITUTIONAL PREFERRED – 22.5% (13.8% of Total
Investments) |
|
|
|
|
|
|
|
|
|
|
|
|
| |
|
|
|
|
Banks – 6.6% |
|
|
|
|
|
|
|
|
|
|
|
|
|
|
|
|
|
|
|
| $ |
10,375 |
|
|
|
|
Banco Nacional de Comercio Exterior SNC/Cayman Islands, 144A |
|
|
2.720% |
|
|
|
8/11/31 |
|
|
|
Ba1 |
|
|
$ |
8,702,031 |
|
| |
4,250 |
|
|
|
|
Citigroup Inc |
|
|
4.150% |
|
|
|
N/A (5) |
|
|
|
BBB- |
|
|
|
3,419,125 |
|
| |
3,250 |
|
|
|
|
JPMorgan Chase & Co |
|
|
3.650% |
|
|
|
N/A (5) |
|
|
|
BBB+ |
|
|
|
2,860,488 |
|
34
|
|
|
|
|
|
|
|
|
|
|
|
|
|
|
|
|
|
|
|
|
|
|
Principal
Amount (000) (1) |
|
|
|
|
Description (2) |
|
Coupon |
|
|
Maturity |
|
|
Ratings (3) |
|
|
Value |
|
|
|
|
|
|
|
|
| |
|
|
|
|
Banks (continued) |
|
|
|
|
|
|
|
|
|
|
|
|
|
$
|
10,195 |
|
|
|
|
PNC Financial Services Group Inc/The |
|
|
3.400% |
|
|
|
N/A (5) |
|
|
|
Baa2 |
|
|
$
|
7,518,812 |
|
|
|
|
|
|
|
Total Banks |
|
|
|
|
|
|
|
|
|
|
|
|
|
|
22,500,456 |
|
|
|
|
|
|
|
|
| |
|
|
|
|
Consumer Finance – 1.8% |
|
|
|
|
|
|
|
|
|
|
|
|
|
|
|
|
|
|
|
| |
7,200 |
|
|
|
|
American Express Co |
|
|
3.550% |
|
|
|
N/A (5) |
|
|
|
Baa2 |
|
|
$ |
5,976,000 |
|
|
|
|
|
|
|
Total Consumer Finance |
|
|
|
|
|
|
|
|
|
|
|
|
|
|
5,976,000 |
|
|
|
|
|
|
|
|
| |
|
|
|
|
Electric Utilities – 1.8% |
|
|
|
|
|
|
|
|
|
|
|
|
|
|
|
|
|
|
|
| |
2,500 |
|
|
|
|
CMS Energy Corp |
|
|
3.750% |
|
|
|
12/01/50 |
|
|
|
BBB- |
|
|
|
1,929,500 |
|
| |
5,000 |
|
|
|
|
Southern Co/The |
|
|
3.750% |
|
|
|
9/15/51 |
|
|
|
BBB- |
|
|
|
4,255,000 |
|
|
|
|
|
|
|
Total Electric Utilities |
|
|
|
|
|
|
|
|
|
|
|
|
|
|
6,184,500 |
|
|
|
|
|
|
|
|
| |
|
|
|
|
Independent Power Producers & Energy Traders – 0.4% |
|
|
|
|
|
|
|
|
|
|
|
|
|
|
|
|
|
|
|
| |
1,500 |
|
|
|
|
Vistra Corp, 144A |
|
|
7.000% |
|
|
|
N/A (5) |
|
|
|
Ba3 |
|
|
|
1,308,750 |
|
|
|
|
|
|
|
Total Independent Power Producers & Energy
Traders |
|
|
|
|
|
|
|
|
|
|
|
|
|
|
1,308,750 |
|
|
|
|
|
|
|
|
| |
|
|
|
|
Insurance – 4.2% |
|
|
|
|
|
|
|
|
|
|
|
|
|
|
|
|
|
|
|
| |
15,000 |
|
|
|
|
Swiss Re Finance Luxembourg SA, 144A (4) |
|
|
5.000% |
|
|
|
4/02/49 |
|
|
|
A |
|
|
|
14,325,000 |
|
|
|
|
|
|
|
Total Insurance |
|
|
|
|
|
|
|
|
|
|
|
|
|
|
14,325,000 |
|
|
|
|
|
|
|
|
| |
|
|
|
|
Multi-Utilities – 4.8% |
|
|
|
|
|
|
|
|
|
|
|
|
|
|
|
|
|
|
|
| |
5,000 |
|
|
|
|
Algonquin Power & Utilities Corp |
|
|
4.750% |
|
|
|
1/18/82 |
|
|
|
BB+ |
|
|
|
3,975,000 |
|
| |
2,500 |
|
|
|
|
CMS Energy Corp |
|
|
4.750% |
|
|
|
6/01/50 |
|
|
|
BBB- |
|
|
|
2,149,325 |
|
| |
8,000 |
|
|
EUR |
|
Engie SA , Reg S |
|
|
1.875% |
|
|
|
N/A (5) |
|
|
|
BBB |
|
|
|
6,561,410 |
|
| |
4,600 |
|
|
|
|
Sempra Energy |
|
|
4.125% |
|
|
|
4/01/52 |
|
|
|
BBB- |
|
|
|
3,717,758 |
|
|
|
|
|
|
|
Total Multi-Utilities |
|
|
|
|
|
|
|
|
|
|
|
|
|
|
16,403,493 |
|
|
|
|
|
|
|
|
| |
|
|
|
|
Trading Companies & Distributors – 2.9% |
|
|
|
|
|
|
|
|
|
|
|
|
|
|
|
|
|
|
|
| |
12,000 |
|
|
|
|
Air Lease Corp |
|
|
4.650% |
|
|
|
N/A (5) |
|
|
|
BB+ |
|
|
|
10,014,720 |
|
|
|
|
|
|
|
Total Trading Companies & Distributors |
|
|
|
|
|
|
|
|
|
|
|
|
|
|
10,014,720 |
|
|
|
|
|
|
|
Total $1,000 Par (or similar) Institutional
Preferred (cost $95,072,268) |
|
|
|
|
|
|
|
76,712,919 |
|
|
|
|
|
|
|
|
Principal
Amount (000) |
|
|
|
|
Description (2) |
|
Coupon |
|
|
Maturity |
|
|
Ratings (3) |
|
|
Value |
|
|
|
|
|
|
|
|
|
|
|
ASSET-BACKED SECURITIES – 13.5% (8.3% of Total Investments) |
|
|
|
|
|
|
|
|
|
|
|
|
| $ |
6,500 |
|
|
|
|
Alen 2021-ACEN Mortgage Trust, (1-Month LIBOR reference
rate + 4.000% spread), 144A, (6) |
|
|
9.193% |
|
|
|
4/15/34 |
|
|
|
BB- |
|
|
$ |
3,952,917 |
|
| |
5,000 |
|
|
|
|
BAMLL Commercial Mortgage Securities Trust 2021-JACX, (1-Month
LIBOR reference rate + 3.750% spread), 144A, (6) |
|
|
8.943% |
|
|
|
9/15/38 |
|
|
|
Ba2 |
|
|
|
4,038,295 |
|
| |
64,977 |
|
|
|
|
Freddie Mac Multifamily ML Certificates, (I/O), 144A |
|
|
0.770% |
|
|
|
3/25/38 |
|
|
|
N/R |
|
|
|
3,664,070 |
|
| |
46,007 |
|
|
|
|
Freddie Mac Multifamily ML Certificates, (I/O) |
|
|
1.302% |
|
|
|
7/25/41 |
|
|
|
AA+ |
|
|
|
4,594,755 |
|
| |
2,213 |
|
|
|
|
GoodLeap Sustainable Home Solutions Trust 2021-3, 144A |
|
|
3.500% |
|
|
|
5/20/48 |
|
|
|
N/R |
|
|
|
1,456,053 |
|
| |
2,335 |
|
|
|
|
GoodLeap Sustainable Home Solutions Trust 2021-4, 144A |
|
|
3.500% |
|
|
|
7/20/48 |
|
|
|
BB |
|
|
|
1,658,726 |
|
| |
680 |
|
|
|
|
Hudson Yards 2016-10HY Mortgage Trust, 2016 10HY, 144A |
|
|
2.835% |
|
|
|
8/10/38 |
|
|
|
Aaa |
|
|
|
611,560 |
|
| |
10,000 |
|
|
|
|
MFT Trust 2020-ABC, 2020 ABC, 144A |
|
|
3.593% |
|
|
|
2/10/42 |
|
|
|
N/R |
|
|
|
6,112,407 |
|
| |
4,590 |
|
|
|
|
Mosaic Solar Loan Trust 2019-2, 144A |
|
|
0.000% |
|
|
|
9/20/40 |
|
|
|
N/R |
|
|
|
1,841,339 |
|
| |
5,425 |
|
|
|
|
Mosaic Solar Loan Trust 2020-1, 144A |
|
|
0.000% |
|
|
|
4/20/46 |
|
|
|
N/R |
|
|
|
3,823,907 |
|
| |
5,661 |
|
|
|
|
Natixis Commercial Mortgage Securities Trust 2019-MILE, (TSFR1M reference rate + 2.829% spread), 144A,
(6) |
|
|
7.976% |
|
|
|
7/15/36 |
|
|
|
N/R |
|
|
|
4,927,745 |
|
| |
700 |
|
|
|
|
Natixis Commercial Mortgage Securities Trust 2019-MILE, (TSFR1M reference rate + 3.579% spread), 144A,
(6) |
|
|
8.726% |
|
|
|
7/15/36 |
|
|
|
N/R |
|
|
|
578,221 |
|
| |
7,420 |
|
|
|
|
NYC Commercial Mortgage Trust 2021-909, 144A |
|
|
3.312% |
|
|
|
4/10/43 |
|
|
|
N/R |
|
|
|
4,675,326 |
|
| |
1,600 |
|
|
|
|
Tesla Auto Lease Trust, 2021 A, 144A |
|
|
1.020% |
|
|
|
3/20/25 |
|
|
|
Aa2 |
|
|
|
1,567,916 |
|
| |
2,500 |
|
|
|
|
Tesla Auto Lease Trust
2021-B, 144A |
|
|
1.320% |
|
|
|
9/22/25 |
|
|
|
Baa2 |
|
|
|
2,355,096 |
|
|
|
|
|
|
|
Total Asset-Backed Securities
(cost $62,057,947) |
|
|
|
|
|
|
|
|
|
|
|
|
|
|
45,858,333 |
|
35
|
|
|
|
|
| NPCT |
|
Nuveen Core Plus Impact Fund (continued) |
| |
Portfolio of Investments June 30, 2023 |
|
|
(Unaudited) |
|
|
|
|
|
|
|
|
|
|
|
|
|
|
|
|
|
|
|
|
|
|
|
Principal
Amount (000) |
|
|
|
|
Description (2) |
|
Coupon |
|
|
Maturity |
|
|
Ratings (3) |
|
|
Value |
|
|
|
|
|
|
|
|
|
|
|
MORTGAGE-BACKED SECURITIES – 10.2% (6.3% of Total Investments) |
|
|
|
|
|
|
|
|
|
|
|
|
|
$
|
4,000 |
|
|
|
|
BBCMS Mortgage Trust 2020-C6, 2020 C6, 144A |
|
|
3.811% |
|
|
|
2/15/53 |
|
|
|
N/R |
|
|
$ |
2,584,957 |
|
| |
3,840 |
|
|
|
|
Benchmark 2019-B10 Mortgage Trust, 2019 B10, 144A |
|
|
4.029% |
|
|
|
3/15/62 |
|
|
|
N/R |
|
|
|
2,411,559 |
|
| |
7,887 |
|
|
|
|
COMM 2020-CX Mortgage Trust, 2020 CX, 144A |
|
|
2.773% |
|
|
|
11/10/46 |
|
|
|
N/R |
|
|
|
5,161,788 |
|
| |
28,522 |
|
|
|
|
Freddie Mac Multifamily ML Certificates, 2021 ML10, (I/O) |
|
|
2.127% |
|
|
|
1/25/38 |
|
|
|
N/R |
|
|
|
4,522,755 |
|
| |
2,500 |
|
|
|
|
Hudson Yards 2019-55HY Mortgage Trust, 2019 55HY, 144A |
|
|
3.041% |
|
|
|
12/10/41 |
|
|
|
N/R |
|
|
|
1,655,052 |
|
| |
5,000 |
|
|
|
|
J.P. Morgan Chase Commercial Mortgage Securities Trust 2018-AON,
2018 AON, 144A |
|
|
4.767% |
|
|
|
7/05/31 |
|
|
|
B- |
|
|
|
1,351,875 |
|
| |
8,000 |
|
|
|
|
SLG Office Trust 2021-OVA, 144A |
|
|
2.851% |
|
|
|
7/15/41 |
|
|
|
N/R |
|
|
|
5,490,362 |
|
| |
3,860 |
|
|
|
|
SLG Office Trust 2021-OVA, 144A |
|
|
2.851% |
|
|
|
7/15/41 |
|
|
|
N/R |
|
|
|
2,755,487 |
|
| |
80,369 |
|
|
|
|
SLG Office Trust 2021-OVA, (I/O), 144A |
|
|
0.258% |
|
|
|
7/15/41 |
|
|
|
AA- |
|
|
|
1,228,127 |
|
| |
3,500 |
|
|
|
|
SUMIT 2022-BVUE Mortgage Trust, 2022 BVUE, 144A |
|
|
2.989% |
|
|
|
2/12/41 |
|
|
|
N/R |
|
|
|
2,124,562 |
|
| |
7,000 |
|
|
|
|
VNDO Trust 2016-350P, 144A |
|
|
4.033% |
|
|
|
1/10/35 |
|
|
|
B |
|
|
|
5,547,409 |
|
|
|
|
|
|
|
Total Mortgage-Backed Securities
(cost $51,355,189) |
|
|
|
|
|
|
|
|
|
|
|
|
|
|
34,833,933 |
|
|
|
|
|
|
|
|
Principal
Amount (000) (1) |
|
|
|
|
Description (2) |
|
Coupon |
|
|
Maturity |
|
|
Ratings (3) |
|
|
Value |
|
|
|
|
|
|
|
|
|
|
|
SOVEREIGN DEBT – 6.7% (4.1% of Total Investments) |
|
|
|
|
|
|
|
|
|
|
|
|
| |
|
|
|
|
Benin – 2.2% |
|
|
|
|
|
|
|
|
|
|
|
|
|
|
|
|
|
|
|
| |
10,000 |
|
|
EUR |
|
Benin Government International Bond , 144A |
|
|
4.950% |
|
|
|
1/22/35 |
|
|
|
B+ |
|
|
$ |
7,668,083 |
|
|
|
|
|
|
|
Total Benin |
|
|
|
|
|
|
|
|
|
|
|
|
|
|
7,668,083 |
|
|
|
|
|
|
|
|
| |
|
|
|
|
Chile – 1.1% |
|
|
|
|
|
|
|
|
|
|
|
|
|
|
|
|
|
|
|
| $ |
5,000 |
|
|
|
|
Chile Government International Bond |
|
|
3.100% |
|
|
|
5/07/41 |
|
|
|
A |
|
|
|
3,747,410 |
|
|
|
|
|
|
|
Total Chile |
|
|
|
|
|
|
|
|
|
|
|
|
|
|
3,747,410 |
|
|
|
|
|
|
|
|
| |
|
|
|
|
Egypt – 0.6% |
|
|
|
|
|
|
|
|
|
|
|
|
|
|
|
|
|
|
|
| |
2,500 |
|
|
|
|
Egypt Government International Bond , 144A |
|
|
5.250% |
|
|
|
10/06/25 |
|
|
|
B |
|
|
|
1,898,000 |
|
|
|
|
|
|
|
Total Egypt |
|
|
|
|
|
|
|
|
|
|
|
|
|
|
1,898,000 |
|
|
|
|
|
|
|
|
| |
|
|
|
|
Mexico – 2.1% |
|
|
|
|
|
|
|
|
|
|
|
|
|
|
|
|
|
|
|
| |
5,000 |
|
|
EUR |
|
Mexico Government International Bond |
|
|
2.250% |
|
|
|
8/12/36 |
|
|
|
BBB |
|
|
|
4,026,431 |
|
| |
3,150 |
|
|
|
|
Mexico Government International Bond |
|
|
4.875% |
|
|
|
5/19/33 |
|
|
|
BBB |
|
|
|
3,005,289 |
|
|
|
|
|
|
|
Total Mexico |
|
|
|
|
|
|
|
|
|
|
|
|
|
|
7,031,720 |
|
|
|
|
|
|
|
|
| |
|
|
|
|
United States – 0.7% |
|
|
|
|
|
|
|
|
|
|
|
|
|
|
|
|
|
|
|
| |
2,575 |
|
|
|
|
United States Treasury Note/Bond |
|
|
3.375% |
|
|
|
5/15/33 |
|
|
|
Aaa |
|
|
|
2,483,266 |
|
|
|
|
|
|
|
Total United States |
|
|
|
|
|
|
|
|
|
|
|
|
|
|
2,483,266 |
|
|
|
|
|
|
|
Total Sovereign Debt
(cost $30,613,793) |
|
|
|
|
|
|
|
|
|
|
|
|
|
|
22,828,479 |
|
|
|
|
|
|
|
|
| Shares |
|
|
|
|
Description (2) |
|
Coupon |
|
|
|
|
|
Ratings (3) |
|
|
Value |
|
|
|
|
|
|
|
|
|
|
|
$25 PAR (OR SIMILAR) RETAIL PREFERRED – 6.1% (3.7% of Total Investments) |
|
|
|
|
|
|
|
|
|
|
|
|
| |
|
|
|
|
Capital Markets – 1.5% |
|
|
|
|
|
|
|
|
|
|
|
|
|
|
|
|
|
|
|
| |
300,000 |
|
|
|
|
Affiliated Managers Group Inc |
|
|
4.200% |
|
|
|
|
|
|
|
Baa1 |
|
|
$ |
5,025,000 |
|
|
|
|
|
|
|
Total Capital Markets |
|
|
|
|
|
|
|
|
|
|
|
|
|
|
5,025,000 |
|
|
|
|
|
|
|
|
| |
|
|
|
|
Independent Power Producers & Energy Traders – 1.2% |
|
|
|
|
|
|
|
|
|
|
|
|
|
|
|
|
|
|
|
| |
200,000 |
|
|
|
|
Brookfield Renewable Partners LP |
|
|
5.250% |
|
|
|
|
|
|
|
BBB- |
|
|
|
3,994,000 |
|
|
|
|
|
|
|
Total Independent Power Producers & Energy
Traders |
|
|
|
|
|
|
|
|
|
|
|
|
|
|
3,994,000 |
|
|
|
|
|
|
|
|
| |
|
|
|
|
Multi-Utilities – 1.6% |
|
|
|
|
|
|
|
|
|
|
|
|
|
|
|
|
|
|
|
| |
100,426 |
|
|
|
|
Brookfield Infrastructure Partners LP |
|
|
5.125% |
|
|
|
|
|
|
|
BBB- |
|
|
|
1,910,102 |
|
| |
200,000 |
|
|
|
|
CMS Energy Corp |
|
|
4.200% |
|
|
|
|
|
|
|
BBB- |
|
|
|
3,626,000 |
|
|
|
|
|
|
|
Total Multi-Utilities |
|
|
|
|
|
|
|
|
|
|
|
|
|
|
5,536,102 |
|
36
|
|
|
|
|
|
|
|
|
|
|
|
|
|
|
|
|
|
|
|
|
|
|
| Shares |
|
|
|
|
Description (2) |
|
Coupon |
|
|
|
|
|
Ratings (3) |
|
|
Value |
|
|
|
|
|
|
|
|
| |
|
|
|
|
Real Estate Management & Development – 0.3% |
|
|
|
|
|
|
|
|
|
|
|
|
|
|
|
|
|
|
|
| |
77,904 |
|
|
|
|
Brookfield Property Partners LP |
|
|
5.750% |
|
|
|
|
|
|
|
BB |
|
|
$ |
1,071,180 |
|
|
|
|
|
|
|
Total Real Estate Management & Development |
|
|
|
|
|
|
|
|
|
|
|
|
|
|
1,071,180 |
|
|
|
|
|
|
|
|
| |
|
|
|
|
Trading Companies & Distributors – 1.5% |
|
|
|
|
|
|
|
|
|
|
|
|
|
|
|
|
|
|
|
| |
269,000 |
|
|
|
|
Triton International Ltd |
|
|
5.750% |
|
|
|
|
|
|
|
BB |
|
|
|
5,137,900 |
|
|
|
|
|
|
|
Total Trading Companies & Distributors |
|
|
|
|
|
|
|
|
|
|
|
|
|
|
5,137,900 |
|
|
|
|
|
|
|
Total $25 Par (or similar) Retail Preferred
(cost $28,938,056) |
|
|
|
|
|
|
|
|
|
|
|
|
|
|
20,764,182 |
|
|
|
|
|
|
|
|
Principal
Amount (000) |
|
|
|
|
Description (2) |
|
|
|
|
Optional Call
Provisions (7) |
|
|
Ratings (3) |
|
|
Value |
|
|
|
|
|
|
|
|
|
|
|
MUNICIPAL BONDS – 3.4% (2.1% of Total Investments) |
|
|
|
|
|
|
|
|
|
|
|
|
| |
|
|
|
|
Arizona – 0.2% |
|
|
|
|
|
|
|
|
|
|
|
|
|
|
|
|
|
|
|
| $ |
810 |
|
|
|
|
Arizona Industrial Development Authority, Arizona, Education
Revenue Bonds, KIPPC NYC Public Charter Schools – Gerard Facility Project, Series 2021C, 3.250%, 7/01/31 |
|
|
|
|
|
|
No Opt. Call |
|
|
|
BBB- |
|
|
$ |
704,173 |
|
|
|
|
|
|
|
Total Arizona |
|
|
|
|
|
|
|
|
|
|
|
|
|
|
704,173 |
|
|
|
|
|
|
|
|
| |
|
|
|
|
District of Columbia – 0.1% |
|
|
|
|
|
|
|
|
|
|
|
|
|
|
|
|
|
|
|
| |
254 |
|
|
|
|
District of Columbia Water and Sewer Authority, Public Utility
Revenue Bonds, Taxable Senior Lien Green Series 2014A, 4.814%, 10/01/14 |
|
|
|
|
|
|
No Opt. Call |
|
|
|
AAA |
|
|
|
236,509 |
|
|
|
|
|
|
|
Total District of Columbia |
|
|
|
|
|
|
|
|
|
|
|
|
|
|
236,509 |
|
|
|
|
|
|
|
|
| |
|
|
|
|
Indiana – 0.0% |
|
|
|
|
|
|
|
|
|
|
|
|
|
|
|
|
|
|
|
| |
235 |
|
|
|
|
Fort Wayne, Indiana Economic Development, Solid Waste Facility
Revenue Bonds, Do Good Foods LLC Fort Wayne, Taxable Series 2022A-2, 10.750%, 12/01/29, (10) |
|
|
|
|
|
|
No Opt. Call |
|
|
|
N/R |
|
|
|
24 |
|
|
|
|
|
|
|
Total Indiana |
|
|
|
|
|
|
|
|
|
|
|
|
|
|
24 |
|
|
|
|
|
|
|
|
| |
|
|
|
|
Michigan – 1.4% |
|
|
|
|
|
|
|
|
|
|
|
|
| |
1,000 |
|
|
|
|
City of Detroit, Michigan, General Obligation Bonds, Series 2021: 2.960%, 4/01/27 |
|
|
|
|
|
|
No Opt. Call |
|
|
|
BB+ |
|
|
|
863,206 |
|
| |
500 |
|
|
|
|
3.110%, 4/01/28 |
|
|
|
|
|
|
No Opt. Call |
|
|
|
BB+ |
|
|
|
425,446 |
|
| |
2,245 |
|
|
|
|
3.244%, 4/01/29 |
|
|
|
|
|
|
No Opt. Call |
|
|
|
BB+ |
|
|
|
1,873,859 |
|
| |
425 |
|
|
|
|
3.344%, 4/01/30 |
|
|
|
|
|
|
No Opt. Call |
|
|
|
BB+ |
|
|
|
348,632 |
|
| |
1,575 |
|
|
|
|
Detroit, Wayne County, Michigan, General Obligation Bonds, Taxable
Series 2021B, 3.644%, 4/01/34 |
|
|
|
|
|
|
4/31 at 100.00 |
|
|
|
BB+ |
|
|
|
1,247,755 |
|
|
|
|
|
|
|
Total Michigan |
|
|
|
|
|
|
|
|
|
|
|
|
|
|
4,758,898 |
|
|
|
|
|
|
|
|
| |
|
|
|
|
Montana – 0.3% |
|
|
|
|
|
|
|
|
|
|
|
|
|
|
|
|
|
|
|
| |
1,000 |
|
|
|
|
County of Gallatin, Montana, Series 2022, 11.500%, 9/01/27,
144A |
|
|
|
|
|
|
9/25 at 103.00 |
|
|
|
N/R |
|
|
|
1,042,899 |
|
|
|
|
|
|
|
Total Montana |
|
|
|
|
|
|
|
|
|
|
|
|
|
|
1,042,899 |
|
|
|
|
|
|
|
|
| |
|
|
|
|
New York – 1.4% |
|
|
|
|
|
|
|
|
|
|
|
|
| |
5,300 |
|
|
|
|
Metropolitan Transportation Authority, New York, Transportation
Revenue Bonds, Taxable Green Climate Certified Series 2020C-2, 5.175%, 11/15/49 |
|
|
|
|
|
|
No Opt. Call |
|
|
|
A3 |
|
|
|
4,846,903 |
|
|
|
|
|
|
|
Total New York |
|
|
|
|
|
|
|
|
|
|
|
|
|
|
4,846,903 |
|
|
|
|
|
|
|
Total Municipal Bonds
(cost $15,215,681) |
|
|
|
|
|
|
|
|
|
|
|
|
|
|
11,589,406 |
|
37
|
|
|
|
|
| NPCT |
|
Nuveen Core Plus Impact Fund (continued) |
| |
Portfolio of Investments June 30, 2023 |
|
|
(Unaudited) |
|
|
|
|
|
|
|
|
|
|
|
|
|
|
|
|
|
|
|
|
|
|
|
|
|
|
|
|
|
|
|
Principal
Amount (000) |
|
|
|
|
Description (2) |
|
Coupon (8) |
|
|
Reference Rate (8) |
|
|
Spread (8) |
|
|
Maturity (9) |
|
|
Ratings (3) |
|
|
Value |
|
|
|
|
|
|
|
|
|
|
|
VARIABLE RATE SENIOR LOAN INTERESTS – 3.0% (1.9% of Total Investments)
(8) |
|
|
|
|
|
|
|
|
|
|
|
| |
|
|
|
|
Commercial Services & Supplies – 2.7% |
|
|
|
|
|
|
|
|
|
|
|
|
|
|
|
|
|
|
|
| $ |
10,418 |
|
|
|
|
Liberty Tire Recycling Holdco, LLC, Term Loan |
|
|
9.693% |
|
|
|
1 + 3-Month LIBOR |
|
|
|
4.500% |
|
|
|
5/07/28 |
|
|
|
B- |
|
|
$ |
9,306,800 |
|
|
|
|
|
|
|
Total Commercial Services & Supplies |
|
|
|
|
|
|
|
|
|
|
|
|
|
|
|
|
|
|
|
9,306,800 |
|
|
|
|
|
|
|
|
|
|
| |
|
|
|
|
Electric Utilities – 0.3% |
|
|
|
|
|
|
|
|
|
|
|
|
|
|
|
|
|
|
|
|
|
|
|
|
|
|
|
| |
1,072 |
|
|
|
|
ExGen Renewables IV, LLC, Term Loan |
|
|
8.025% |
|
|
|
SOFR90A |
|
|
|
2.500% |
|
|
|
12/15/27 |
|
|
|
BB- |
|
|
|
1,066,658 |
|
|
|
|
|
|
|
Total Electric Utilities |
|
|
|
|
|
|
|
|
|
|
|
|
|
|
|
|
|
|
|
1,066,658 |
|
|
|
|
|
|
|
Total Variable Rate Senior Loan Interests
(cost $11,451,555) |
|
|
|
|
|
|
|
|
|
|
|
|
|
|
|
10,373,458 |
|
|
|
|
|
|
|
Total Long-Term Investments
(cost $705,160,300) |
|
|
|
|
|
|
|
|
|
|
|
|
|
|
|
548,118,012 |
|
|
|
|
|
|
|
|
|
|
Principal
Amount (000) |
|
|
|
|
Description (2) |
|
|
|
|
|
|
|
Coupon |
|
|
Maturity |
|
|
|
|
|
Value |
|
|
|
|
|
|
|
|
|
|
|
SHORT-TERM INVESTMENTS – 1.8%(1.1% of Total Investments) |
|
|
|
|
|
|
|
|
|
|
|
| |
|
|
|
|
REPURCHASE AGREEMENTS – 1.8% (1.1% of Total Investments) |
|
|
|
|
|
|
|
|
|
|
|
|
|
|
|
|
|
| $ |
258 |
|
|
|
|
Repurchase Agreement with Fixed Income Clearing Corporation, dated 6/30/23, repurchase price
$258,283, collateralized by $301,000, U.S. Treasury Note, 1.500%, due 11/30/28, value $263,416 |
|
|
|
1.520% |
|
|
|
7/03/23 |
|
|
|
|
|
|
$ |
258,251 |
|
|
|
|
|
|
|
|
| |
5,940 |
|
|
|
|
Repurchase Agreement with Fixed Income Clearing
Corporation, dated 6/30/23, repurchase price $5,942,480, collateralized by $6,143,400, U.S. Treasury Note, 3.625%, due 3/31/30, value $6,058,864 |
|
|
|
5.010% |
|
|
|
7/03/23 |
|
|
|
|
|
|
|
5,940,000 |
|
|
|
|
|
|
|
Total Repurchase Agreements
(cost $6,198,251) |
|
|
|
|
|
|
|
|
|
|
|
|
|
|
|
6,198,251 |
|
|
|
|
|
|
|
Total Short-Term Investments
(cost $6,198,251) |
|
|
|
|
|
|
|
|
|
|
|
|
|
|
|
|
|
|
|
6,198,251 |
|
|
|
|
|
|
|
Total Investments
(cost $711,358,551) – 162.7% |
|
|
|
|
|
|
|
|
|
|
|
|
|
|
|
|
|
|
|
554,316,263 |
|
|
|
|
|
|
|
Borrowings –
(31.0)% (11), (12) |
|
|
|
|
|
|
|
|
|
|
|
|
|
|
|
|
|
|
|
(105,500,000 |
) |
|
|
|
|
|
|
Reverse Repurchase Agreements, including
accrued interest – (13.5)% (13) |
|
|
|
|
|
|
|
|
|
|
|
(46,125,254 |
) |
|
|
|
|
|
|
TFP Shares, Net –
(20.5)% (14) |
|
|
|
|
|
|
|
|
|
|
|
(69,662,158 |
) |
|
|
|
|
|
|
Other Assets & Liabilities, Net –
2.3% (15) |
|
|
|
|
|
|
|
|
|
|
|
|
|
|
|
|
|
|
|
7,611,796 |
|
|
|
|
|
|
|
Net Assets Applicable to Common Shares –
100% |
|
|
|
|
|
|
|
|
|
|
|
|
|
|
$ |
340,640,647 |
|
Investments in
Derivatives
Forward Foreign Currency Contracts
|
|
|
|
|
|
|
|
|
|
|
|
|
|
|
|
|
|
|
|
|
|
|
|
|
| Currency Purchased |
|
Notional
Amount
(Local Currency) |
|
|
Currency Sold |
|
|
Notional
Amount
(Local Currency) |
|
|
Counterparty |
|
|
Settlement Date |
|
|
Unrealized
Appreciation
(Depreciation) |
|
| U.S. Dollar |
|
|
7,458,330 |
|
|
|
Euro |
|
|
|
6,858,671 |
|
|
|
Bank of America, N.A. |
|
|
|
7/14/23 |
|
|
$ |
(29,071 |
) |
38
Cross Currency Swaps – OTC Uncleared
|
|
|
|
|
|
|
|
|
|
|
|
|
|
|
|
|
|
|
|
|
|
|
|
|
|
|
|
|
|
|
|
|
| Counterparty |
|
Terms of
payments to be
paid |
|
|
Terms of
payments to be
received |
|
|
Currency |
|
|
Maturity
Date |
|
|
Amount
Local Currency |
|
|
Value |
|
|
Premiums
Paid
(Received) |
|
|
Appreciation
(Depreciation) |
|
| Citibank N.A. |
|
|
Fixed annual 2.250 |
% |
|
|
Fixed semi-annual 3.562 |
% |
|
|
USD |
|
|
|
6/23/26 |
|
|
|
2,725,875 |
|
|
$ |
337,475 |
|
|
$ |
25,145 |
|
|
$ |
312,330 |
|
|
|
|
|
|
|
|
|
|
|
|
EUR |
|
|
|
|
|
|
|
2,250,000 |
|
|
|
|
|
|
|
|
|
|
|
|
|
| Morgan Stanley Capital |
|
|
Fixed semi-annual 1.841 |
% |
|
|
Fixed annual 3.337 |
% |
|
|
USD |
|
|
|
9/21/28 |
|
|
|
6,376,320 |
|
|
|
600,904 |
|
|
|
(3 |
) |
|
|
600,907 |
|
| Services LLC |
|
|
|
|
|
|
|
|
|
|
EUR |
|
|
|
|
|
|
|
5,400,000 |
|
|
|
|
|
|
|
|
|
|
|
|
|
| Morgan Stanley Capital |
|
|
Fixed semi-annual 3.000 |
% |
|
|
Fixed annual 4.330 |
% |
|
|
USD |
|
|
|
5/27/26 |
|
|
|
6,088,500 |
|
|
|
696,049 |
|
|
|
4,250 |
|
|
|
691,799 |
|
| Services LLC |
|
|
|
|
|
|
|
|
|
|
EUR |
|
|
|
|
|
|
|
5,000,000 |
|
|
|
|
|
|
|
|
|
|
|
|
|
| J.P. Morgan Securities Inc. |
|
|
Fixed semi-annual 1.875 |
% |
|
|
Fixed annual 3.431 |
% |
|
|
USD |
|
|
|
6/14/29 |
|
|
|
5,905,000 |
|
|
|
610,052 |
|
|
|
(3,379 |
) |
|
|
613,431 |
|
|
|
|
|
|
|
|
|
|
|
|
EUR |
|
|
|
|
|
|
|
5,000,000 |
|
|
|
|
|
|
|
|
|
|
|
|
|
| Citibank N.A. |
|
|
Fixed semi-annual 2.250 |
% |
|
|
Fixed annual 3.775 |
% |
|
|
USD |
|
|
|
8/12/36 |
|
|
|
5,909,000 |
|
|
|
913,118 |
|
|
|
12,308 |
|
|
|
900,810 |
|
|
|
|
|
|
|
|
|
|
|
|
EUR |
|
|
|
|
|
|
|
5,000,000 |
|
|
|
|
|
|
|
|
|
|
|
|
|
| Citibank N.A. |
|
|
Fixed semi-annual 1.875 |
% |
|
|
Fixed annual 3.472 |
% |
|
|
USD |
|
|
|
7/2/31 |
|
|
|
5,904,500 |
|
|
|
759,586 |
|
|
|
16,279 |
|
|
|
743,307 |
|
|
|
|
|
|
|
|
|
|
|
|
EUR |
|
|
|
|
|
|
|
5,000,000 |
|
|
|
|
|
|
|
|
|
|
|
|
|
| Citibank N.A. |
|
|
Fixed semi-annual 1.875 |
% |
|
|
Fixed annual 3.493 |
% |
|
|
USD |
|
|
|
7/2/31 |
|
|
|
3,543,900 |
|
|
|
462,769 |
|
|
|
(6,994 |
) |
|
|
469,763 |
|
| |
|
|
|
|
|
|
|
|
|
|
EUR |
|
|
|
|
|
|
|
3,000,000 |
|
|
|
|
|
|
|
|
|
|
|
|
|
| Total |
|
|
|
|
|
|
|
|
|
|
|
|
|
|
|
|
|
|
|
|
|
$ |
4,379,953 |
|
|
$ |
47,606 |
|
|
$ |
4,332,347 |
|
For Fund portfolio compliance purposes, the Fund’s industry classifications refer to any one or more of the industry sub-classifications used by one or more widely recognized market indexes or ratings group indexes, and/or as defined by Fund management. This definition may not apply for purposes of this report, which may combine
industry sub-classifications into sectors for reporting ease.
| (1) |
Principal Amount (000) denominated in U.S. Dollars, unless otherwise noted. |
| (2) |
All percentages shown in the Portfolio of Investments are based on net assets applicable to common shares unless otherwise
noted. |
| (3) |
The Fund uses credit quality ratings for its portfolio securities provided by Standard & Poor’s Group
(“Standard & Poor’s”), Moody’s Investors Service, Inc. (“Moody’s”) and Fitch, Inc. (“Fitch”). If all three provide a rating for a security, the middle is used; if two of the three agencies rate a
security, the lower rating is used; and if only one rating agency rates a security, that rating is used. AAA, AA, A, and BBB are investment grade ratings; BB, B, CCC/CC/C and D are below-investment grade ratings. Credit ratings are subject to
change. Holdings designated N/R are not rated by Moody’s, S&P or Fitch. |
| (4) |
Investment, or portion of investment, has been pledged to collateralize the net payment obligations for investments in
reverse repurchase agreements. As of the end of the reporting period, investments with a value of $61,166,789 have been pledged as collateral for reverse repurchase agreements. |
| (5) |
Perpetual security. Maturity date is not applicable. |
| (6) |
Variable rate security. The rate shown is the coupon as of the end of the reporting period. |
| (7) |
Optional Call Provisions: Dates (month and year) and prices of the earliest optional call or redemption. There may be
other call provisions at varying prices at later dates. Certain mortgage-backed securities may be subject to periodic principal paydowns. |
| (8) |
Senior loans generally pay interest at rates which are periodically adjusted by reference to a base short-term, floating
lending rate (Reference Rate) plus an assigned fixed rate (Spread). These floating lending rates are generally (i) the lending rate referenced by the London Inter-Bank Offered Rate (“LIBOR”), or (ii) the prime rate offered by one
or more major United States banks. Senior loans may be considered restricted in that the Fund ordinarily is contractually obligated to receive approval from the agent bank and/or borrower prior to the disposition of a senior loan. The rate shown is
the coupon as of the end of the reporting period. |
| (9) |
Senior loans generally are subject to mandatory and/or optional prepayment. Because of these mandatory prepayment
conditions and because there may be significant economic incentives for a borrower to prepay, prepayments of senior loans may occur. As a result, the actual remaining maturity of senior loans held may be substantially less than the stated maturities
shown. |
| (10) |
Defaulted security. A security whose issuer has failed to fully pay principal and/or interest when due, or is under the
protection of bankruptcy. |
| (11) |
Borrowings as a percentage of Total Investments is 19.0%. |
| (12) |
The Fund may pledge up to 100% of its eligible investment (excluding any investments pledged as collateral to specific
investments in derivatives, when applicable) in the Portfolio of Investments as collateral for borrowings. |
| (13) |
Reverse Repurchase Agreements, including accrued interest as a percentage of Total investments is 8.3%.
|
| (14) |
TFP Shares, Net as a percentage of Total Investments is 12.6%. |
| (15) |
Other assets less liabilities includes the unrealized appreciation (depreciation) of certain over-the-counter (“OTC”) derivatives as presented on the Statement of Assets and Liabilities, when applicable. The unrealized appreciation (depreciation) of OTC
cleared and exchange-traded derivatives is recognized as part of the cash collateral at brokers and/or the receivable or payable for variation margin as presented on the Statement of Assets and Liabilities, when applicable. |
| (16) |
Consolidated Portfolio of Investments (as disclosed in Notes to Financial Statements). |
| 144A |
Investment is exempt from registration under Rule 144A of the Securities Act of 1933, as amended. These investments may
only be resold in transactions exempt from registration, which are normally those transactions with qualified institutional buyers. |
| I/O |
Interest only security |
| LIBOR |
London Inter-Bank Offered Rate |
| Reg S |
Regulation S allows U.S. companies to sell securities to persons or entities located outside of the United States without
registering those securities with the Securities and Exchange Commission. Specifically, Regulation S provides a safe harbor from the registration requirements of the Securities Act for the offers and sales of securities by both foreign and domestic
issuers that are made outside the United States. |
| SOFR90A |
90 Day Average Secured Overnight Financing Rate |
| TSFR1M |
CME Term SOFR 1 Month |
See Notes to Financial Statements
39
|
|
|
| JLS |
|
Nuveen Mortgage and Income Fund
Portfolio of Investments June 30, 2023 |
| |
|
(Unaudited) |
|
|
|
|
|
|
|
|
|
|
|
|
|
|
|
|
|
|
|
|
|
Principal
Amount (000) |
|
|
Description (1) |
|
Coupon |
|
|
Maturity |
|
|
Ratings (2) |
|
|
Value |
|
|
|
|
|
|
|
LONG-TERM INVESTMENTS – 138.2% (97.8% of Total Investments) |
|
|
|
|
| |
|
|
MORTGAGE-BACKED SECURITIES – 98.5% (69.7% of Total Investments) |
|
|
|
|
|
|
|
|
|
|
| $ |
500 |
|
|
Alen 2021-ACEN Mortgage Trust, (1-Month LIBOR reference rate +
4.000% spread), 144A (3) |
|
|
9.193% |
|
|
|
4/15/34 |
|
|
|
BB- |
|
|
$ |
304,071 |
|
| |
1,000 |
|
|
BANK 2017-BNK6, (4) |
|
|
3.851% |
|
|
|
7/15/60 |
|
|
|
A |
|
|
|
817,221 |
|
| |
1,000 |
|
|
BANK 2019-BNK21, 144A |
|
|
2.500% |
|
|
|
10/17/52 |
|
|
|
BBB |
|
|
|
565,835 |
|
| |
1,000 |
|
|
BBCMS Mortgage Trust 2020-C6, 144A |
|
|
3.811% |
|
|
|
2/15/53 |
|
|
|
N/R |
|
|
|
740,169 |
|
| |
1,500 |
|
|
Benchmark 2020-B18 Mortgage Trust, 144A (4) |
|
|
4.139% |
|
|
|
7/15/53 |
|
|
|
B- |
|
|
|
1,293,519 |
|
| |
845 |
|
|
CD 2016-CD1 Mortgage Trust, (4) |
|
|
3.631% |
|
|
|
8/10/49 |
|
|
|
A- |
|
|
|
661,928 |
|
| |
1,500 |
|
|
CD 2016-CD2 Mortgage Trust |
|
|
4.112% |
|
|
|
11/10/49 |
|
|
|
A- |
|
|
|
1,164,871 |
|
| |
1,978 |
|
|
CD 2017-CD3 Mortgage Trust, (4) |
|
|
4.697% |
|
|
|
2/10/50 |
|
|
|
BBB |
|
|
|
1,200,922 |
|
| |
25 |
|
|
CF 2020-P1 Mortgage Trust, 144A |
|
|
2.840% |
|
|
|
4/15/25 |
|
|
|
N/R |
|
|
|
23,326 |
|
| |
672 |
|
|
CFK Trust 2019-FAX, 2019 FAX, 144A |
|
|
4.791% |
|
|
|
1/15/39 |
|
|
|
N/R |
|
|
|
579,724 |
|
| |
440 |
|
|
CHL Mortgage Pass-Through Trust 2006-HYB1 |
|
|
3.826% |
|
|
|
3/20/36 |
|
|
|
N/R |
|
|
|
391,992 |
|
| |
1,500 |
|
|
COMM 2013-LC13 Mortgage Trust, 2013 LC13, 144A (4) |
|
|
5.436% |
|
|
|
8/10/46 |
|
|
|
BB- |
|
|
|
1,405,174 |
|
| |
700 |
|
|
COMM 2014-CCRE15 Mortgage Trust, 144A |
|
|
4.813% |
|
|
|
2/10/47 |
|
|
|
Ba2 |
|
|
|
567,420 |
|
| |
925 |
|
|
COMM 2014-CCRE15 Mortgage Trust, (4) |
|
|
4.813% |
|
|
|
2/10/47 |
|
|
|
Baa2 |
|
|
|
811,262 |
|
| |
1,000 |
|
|
COMM 2014-CCRE17 Mortgage Trust |
|
|
4.377% |
|
|
|
5/10/47 |
|
|
|
AA- |
|
|
|
902,513 |
|
| |
1,794 |
|
|
COMM 2014-CCRE19 Mortgage Trust, 144A (4) |
|
|
4.697% |
|
|
|
8/10/47 |
|
|
|
BBB- |
|
|
|
1,536,146 |
|
| |
1,000 |
|
|
Comm 2014-UBS2 Mortgage Trust, (4) |
|
|
4.947% |
|
|
|
3/10/47 |
|
|
|
Baa3 |
|
|
|
932,191 |
|
| |
1,500 |
|
|
COMM 2014-UBS3 Mortgage Trust, 2014 (4) |
|
|
4.767% |
|
|
|
6/10/47 |
|
|
|
N/R |
|
|
|
1,025,933 |
|
| |
1,400 |
|
|
COMM 2015-CCRE22 Mortgage Trust, 144A |
|
|
3.000% |
|
|
|
3/10/48 |
|
|
|
BB- |
|
|
|
1,030,106 |
|
| |
2,000 |
|
|
COMM 2015-CCRE23 Mortgage Trust, (4) |
|
|
4.443% |
|
|
|
5/10/48 |
|
|
|
N/R |
|
|
|
1,551,736 |
|
| |
1,800 |
|
|
COMM 2015-CCRE24 Mortgage Trust, (4) |
|
|
3.463% |
|
|
|
8/10/48 |
|
|
|
BBB- |
|
|
|
1,431,866 |
|
| |
1,245 |
|
|
COMM 2015-CCRE25 Mortgage Trust |
|
|
3.768% |
|
|
|
8/10/48 |
|
|
|
BB |
|
|
|
947,448 |
|
| |
800 |
|
|
COMM 2015-CCRE25 Mortgage Trust, (4) |
|
|
4.667% |
|
|
|
8/10/48 |
|
|
|
A- |
|
|
|
719,411 |
|
| |
3,000 |
|
|
Connecticut Avenue Securities Trust 2021-R01, (SOFR30A reference
rate + 6.000% spread), 144A (3) |
|
|
11.067% |
|
|
|
10/25/41 |
|
|
|
N/R |
|
|
|
2,964,287 |
|
| |
625 |
|
|
Connecticut Avenue Securities Trust 2021-R03, (SOFR30A reference
rate + 5.500% spread), 144A (3) |
|
|
10.567% |
|
|
|
12/25/41 |
|
|
|
N/R |
|
|
|
608,515 |
|
| |
2,100 |
|
|
Connecticut Avenue Securities Trust 2022-R01, (SOFR30A reference
rate + 6.000% spread), 144A (3) |
|
|
11.067% |
|
|
|
12/25/41 |
|
|
|
N/R |
|
|
|
2,066,011 |
|
| |
2,300 |
|
|
Connecticut Avenue Securities Trust 2022-R01, (SOFR30A reference
rate + 3.150% spread), 144A (3), (4) |
|
|
8.217% |
|
|
|
12/25/41 |
|
|
|
BB |
|
|
|
2,263,461 |
|
| |
3,000 |
|
|
Connecticut Avenue Securities Trust 2022-R02, (SOFR30A reference
rate + 4.500% spread), 144A (3), (4) |
|
|
9.567% |
|
|
|
1/25/42 |
|
|
|
B+ |
|
|
|
3,017,800 |
|
| |
3,000 |
|
|
Connecticut Avenue Securities Trust 2022-R03, (SOFR30A reference
rate + 6.250% spread), 144A (3) |
|
|
6.349% |
|
|
|
3/25/42 |
|
|
|
BB- |
|
|
|
3,227,070 |
|
| |
1,000 |
|
|
Connecticut Avenue Securities Trust 2022-R03, (SOFR30A reference
rate + 9.850% spread), 144A (3) |
|
|
14.823% |
|
|
|
3/25/42 |
|
|
|
N/R |
|
|
|
1,092,378 |
|
| |
200 |
|
|
Connecticut Avenue Securities Trust 2022-R04, (SOFR30A reference
rate + 3.100% spread), 144A (3) |
|
|
8.167% |
|
|
|
3/25/42 |
|
|
|
BBB- |
|
|
|
202,205 |
|
| |
2,900 |
|
|
Connecticut Avenue Securities Trust 2022-R05, (SOFR30A reference
rate + 7.000% spread), 144A (3) |
|
|
12.067% |
|
|
|
4/25/42 |
|
|
|
B3 |
|
|
|
2,977,664 |
|
| |
460 |
|
|
Connecticut Avenue Securities Trust 2022-R06, (SOFR30A reference
rate + 3.850% spread), 144A (3), (4) |
|
|
8.917% |
|
|
|
5/25/42 |
|
|
|
BBB- |
|
|
|
474,359 |
|
| |
960 |
|
|
Connecticut Avenue Securities Trust 2022-R07, (SOFR30A reference
rate + 6.800% spread), 144A (3) |
|
|
11.867% |
|
|
|
6/25/42 |
|
|
|
BB- |
|
|
|
1,049,642 |
|
| |
100 |
|
|
Connecticut Avenue Securities Trust 2022-R07, (SOFR30A reference
rate + 4.650% spread), 144A (3) |
|
|
9.717% |
|
|
|
6/25/42 |
|
|
|
Aaa |
|
|
|
105,863 |
|
| |
1,500 |
|
|
Connecticut Avenue Securities Trust 2022-R08, (SOFR30A reference
rate + 5.600% spread), 144A (3), (4) |
|
|
9.528% |
|
|
|
7/25/42 |
|
|
|
BB- |
|
|
|
1,581,750 |
|
| |
33,000 |
|
|
DOLP Trust 2021-NYC, (I/O), 144A |
|
|
0.665% |
|
|
|
5/10/41 |
|
|
|
A- |
|
|
|
1,254,267 |
|
| |
2,800 |
|
|
Fannie Mae – CAS, (SOFR30A reference rate + 5.550% spread), 2023 R02, 144A (3) |
|
|
10.617% |
|
|
|
1/25/43 |
|
|
|
BB- |
|
|
|
2,892,301 |
|
| |
651 |
|
|
FARM 21-1 Mortgage Trust, 2021 1, 144A |
|
|
3.238% |
|
|
|
7/25/51 |
|
|
|
N/R |
|
|
|
452,508 |
|
| |
87 |
|
|
Flagstar Mortgage Trust 2017-2, 144A |
|
|
4.013% |
|
|
|
10/25/47 |
|
|
|
Aa2 |
|
|
|
76,241 |
|
| |
7,668 |
|
|
Freddie Mac Multifamily ML Certificates, 2021 ML12, (I/O) |
|
|
1.302% |
|
|
|
7/25/41 |
|
|
|
AA+ |
|
|
|
765,793 |
|
| |
2,000 |
|
|
Freddie Mac STACR REMIC Trust 2021-DNA6, (SOFR30A reference rate + 7.500% spread), 144A (3) |
|
|
12.567% |
|
|
|
10/25/41 |
|
|
|
N/R |
|
|
|
1,997,999 |
|
40
|
|
|
|
|
|
|
|
|
|
|
|
|
|
|
|
|
|
|
|
|
Principal
Amount (000) |
|
|
Description (1) |
|
Coupon |
|
|
Maturity |
|
|
Ratings (2) |
|
|
Value |
|
|
|
|
| |
|
|
MORTGAGE-BACKED SECURITIES (continued) |
|
|
|
|
|
|
|
|
|
|
| $ |
2,275 |
|
|
Freddie Mac STACR REMIC Trust 2021-DNA6, (SOFR30A reference rate + 3.400% spread), 144A (3) |
|
|
8.467% |
|
|
|
10/25/41 |
|
|
|
BB- |
|
|
$ |
2,269,780 |
|
| |
3,000 |
|
|
Freddie Mac STACR REMIC Trust 2022-DNA1, (SOFR30A reference rate + 3.400% spread),
144A (3), (4) |
|
|
8.467% |
|
|
|
1/25/42 |
|
|
|
B+ |
|
|
|
2,887,343 |
|
| |
1,000 |
|
|
Freddie Mac STACR REMIC Trust 2022-DNA1, (SOFR30A reference rate + 7.100% spread), 144A (3) |
|
|
12.167% |
|
|
|
1/25/42 |
|
|
|
N/R |
|
|
|
952,189 |
|
| |
4,900 |
|
|
Freddie Mac STACR REMIC Trust 2022-DNA2, (SOFR30A reference rate + 4.750% spread), 144A (3) |
|
|
9.817% |
|
|
|
2/25/42 |
|
|
|
B+ |
|
|
|
4,888,735 |
|
| |
1,270 |
|
|
Freddie Mac STACR REMIC Trust 2022-DNA2, (SOFR30A reference rate + 3.750% spread),
144A (3), (4) |
|
|
8.817% |
|
|
|
2/25/42 |
|
|
|
BB |
|
|
|
1,279,929 |
|
| |
790 |
|
|
Freddie Mac STACR REMIC Trust 2022-DNA3, (SOFR30A reference rate + 4.350% spread), 144A (3) |
|
|
9.417% |
|
|
|
4/25/42 |
|
|
|
BB |
|
|
|
814,935 |
|
| |
3,750 |
|
|
Freddie Mac STACR REMIC Trust 2022-DNA3, (SOFR30A reference rate + 5.650% spread),
144A (3), (4) |
|
|
8.647% |
|
|
|
4/25/42 |
|
|
|
B+ |
|
|
|
3,854,221 |
|
| |
119 |
|
|
Freddie Mac Strips, (1-Month LIBOR reference rate + 5.920%
spread), (I/O) (3) |
|
|
0.727% |
|
|
|
3/15/44 |
|
|
|
N/R |
|
|
|
9,952 |
|
| |
900 |
|
|
Freddie Mac Structured Agency Credit Risk Debt Notes, (SOFR30A reference rate + 4.000% spread), (I/O),
144A (3), (4) |
|
|
9.067% |
|
|
|
7/25/42 |
|
|
|
Baa3 |
|
|
|
928,194 |
|
| |
7,403 |
|
|
Government National Mortgage Association, (SOFR30A reference rate + 6.250% spread), (3), (4) |
|
|
1.184% |
|
|
|
9/20/50 |
|
|
|
N/R |
|
|
|
862,387 |
|
| |
1,500 |
|
|
GS Mortgage Securities Corp Trust 2017-SLP, 144A |
|
|
4.744% |
|
|
|
10/10/32 |
|
|
|
B |
|
|
|
1,406,826 |
|
| |
1,000 |
|
|
GS Mortgage Securities Corp Trust 2018-TWR, (1-Month LIBOR reference rate + 1.700% spread), 144A (3) |
|
|
6.893% |
|
|
|
7/15/31 |
|
|
|
BBB- |
|
|
|
790,811 |
|
| |
700 |
|
|
GS Mortgage Securities Corp Trust 2018-TWR, (1-Month LIBOR reference rate + 3.050% spread), 144A (3) |
|
|
8.243% |
|
|
|
7/15/31 |
|
|
|
CCC- |
|
|
|
430,376 |
|
| |
1,100 |
|
|
GS Mortgage Securities Corp Trust 2018-TWR, (1-Month LIBOR reference rate + 1.850% spread), 144A (3) |
|
|
7.043% |
|
|
|
7/15/31 |
|
|
|
B+ |
|
|
|
764,272 |
|
| |
700 |
|
|
GS Mortgage Securities Corp Trust 2018-TWR, (1-Month LIBOR reference rate + 2.350% spread), 144A (3) |
|
|
7.543% |
|
|
|
7/15/31 |
|
|
|
B- |
|
|
|
458,366 |
|
| |
892 |
|
|
GS Mortgage Securities Corp Trust 2018-TWR, (1-Month LIBOR reference rate + 4.175% spread), 144A (3) |
|
|
9.368% |
|
|
|
7/15/31 |
|
|
|
N/R |
|
|
|
499,378 |
|
| |
1,400 |
|
|
GS Mortgage Securities Corp Trust 2021-ARDN, (1-Month LIBOR
reference rate + 3.350% spread), 144A (3) |
|
|
8.543% |
|
|
|
11/15/36 |
|
|
|
N/R |
|
|
|
1,326,471 |
|
| |
1,000 |
|
|
GS Mortgage Securities Corp Trust 2021-ARDN, (1-Month LIBOR
reference rate + 2.750% spread), 144A (3) |
|
|
7.943% |
|
|
|
11/15/36 |
|
|
|
BBB- |
|
|
|
952,229 |
|
| |
2,000 |
|
|
GS Mortgage Securities Trust 2016-GS4, 2016 GS4 (4) |
|
|
4.078% |
|
|
|
11/10/49 |
|
|
|
A- |
|
|
|
1,619,703 |
|
| |
1,000 |
|
|
Hudson Yards 2019-55HY Mortgage Trust, 2019 55HY, 144A |
|
|
3.041% |
|
|
|
12/10/41 |
|
|
|
N/R |
|
|
|
662,021 |
|
| |
377 |
|
|
JP Morgan Chase Commercial Mortgage Securities Trust 2019-ICON UES, 144A |
|
|
4.601% |
|
|
|
5/05/32 |
|
|
|
BBB- |
|
|
|
352,267 |
|
| |
441 |
|
|
JP Morgan Chase Commercial Mortgage Securities Trust 2019-ICON UES, 144A |
|
|
4.601% |
|
|
|
5/05/32 |
|
|
|
BB- |
|
|
|
409,209 |
|
| |
366 |
|
|
JP Morgan Chase Commercial Mortgage Securities Trust 2020-NNN,
144A |
|
|
3.972% |
|
|
|
1/16/37 |
|
|
|
N/R |
|
|
|
301,521 |
|
| |
868 |
|
|
JP Morgan Mortgage Trust 2018-6, 2018 6, 144A |
|
|
3.892% |
|
|
|
12/25/48 |
|
|
|
Baa3 |
|
|
|
722,081 |
|
| |
2,000 |
|
|
JPMBB Commercial Mortgage Securities Trust 2014-C22, (4) |
|
|
4.698% |
|
|
|
9/15/47 |
|
|
|
BBB |
|
|
|
1,641,431 |
|
| |
1,000 |
|
|
JPMBB Commercial Mortgage Securities Trust 2015-C27, (4) |
|
|
3.898% |
|
|
|
2/15/48 |
|
|
|
N/R |
|
|
|
917,929 |
|
| |
760 |
|
|
JPMBB Commercial Mortgage Securities Trust 2015-C29, (4) |
|
|
4.118% |
|
|
|
5/15/48 |
|
|
|
AA- |
|
|
|
693,698 |
|
| |
1,189 |
|
|
JPMBB Commercial Mortgage Securities Trust 2016-C1, (4) |
|
|
4.859% |
|
|
|
3/17/49 |
|
|
|
A- |
|
|
|
1,058,794 |
|
| |
2,000 |
|
|
JPMCC Commercial Mortgage Securities Trust 2017-JP5, (4) |
|
|
3.905% |
|
|
|
3/15/50 |
|
|
|
A- |
|
|
|
1,504,320 |
|
| |
1,500 |
|
|
JPMCC Commercial Mortgage Securities Trust 2017-JP6, 144A |
|
|
4.605% |
|
|
|
7/15/50 |
|
|
|
BBB+ |
|
|
|
1,111,236 |
|
| |
1,930 |
|
|
JPMCC Commercial Mortgage Securities Trust
2017-JP6, (4) |
|
|
3.855% |
|
|
|
7/15/50 |
|
|
|
A- |
|
|
|
1,523,255 |
|
| |
1,849 |
|
|
JPMCC Commercial Mortgage Securities Trust 2017-JP7,
144A (4) |
|
|
4.527% |
|
|
|
9/15/50 |
|
|
|
BBB |
|
|
|
1,250,077 |
|
| |
1,098 |
|
|
Morgan Stanley Bank of America Merrill Lynch Trust 2014 C19, (4) |
|
|
4.000% |
|
|
|
12/15/47 |
|
|
|
N/R |
|
|
|
992,520 |
|
| |
226 |
|
|
Morgan Stanley Capital I Trust 2015-MS1 |
|
|
4.158% |
|
|
|
5/15/48 |
|
|
|
N/R |
|
|
|
207,750 |
|
| |
184 |
|
|
Morgan Stanley Mortgage Loan Trust 2007-15AR |
|
|
3.103% |
|
|
|
11/25/37 |
|
|
|
N/R |
|
|
|
122,133 |
|
| |
1,000 |
|
|
MRCD 2019-MARK Mortgage Trust, 2019 PARK, 144A |
|
|
2.718% |
|
|
|
12/15/36 |
|
|
|
N/R |
|
|
|
860,445 |
|
| |
250 |
|
|
MSCG Trust 2015-ALDR, 144A |
|
|
3.577% |
|
|
|
6/07/35 |
|
|
|
BBB- |
|
|
|
208,118 |
|
| |
750 |
|
|
MSCG Trust 2015-ALDR, 144A |
|
|
3.577% |
|
|
|
6/07/35 |
|
|
|
A- |
|
|
|
646,867 |
|
| |
1,050 |
|
|
Natixis Commercial Mortgage Securities Trust 2019-MILE, (TSFR1M reference rate + 4.329% spread),
144A (3) |
|
|
9.476% |
|
|
|
7/15/36 |
|
|
|
N/R |
|
|
|
772,008 |
|
| |
1,000 |
|
|
Natixis Commercial Mortgage Securities Trust 2019-MILE, (TSFR1M reference rate + 2.829% spread),
144A (3) |
|
|
7.976% |
|
|
|
7/15/36 |
|
|
|
N/R |
|
|
|
870,473 |
|
41
|
|
|
|
|
| JLS |
|
Nuveen Mortgage and Income Fund (continued) |
| |
Portfolio of Investments June 30, 2023 |
|
|
(Unaudited) |
|
|
|
|
|
|
|
|
|
|
|
|
|
|
|
|
|
|
|
|
|
Principal
Amount (000) |
|
|
Description (1) |
|
Coupon |
|
|
Maturity |
|
|
Ratings (2) |
|
|
Value |
|
|
|
|
| |
|
|
MORTGAGE-BACKED SECURITIES (continued) |
|
|
|
|
|
|
|
|
|
|
| $ |
1,000 |
|
|
PKHL Commercial Mortgage Trust 2021-MF, (1-Month LIBOR reference rate + 2.000% spread), 144A (3), (4) |
|
|
7.194% |
|
|
|
7/15/38 |
|
|
|
BBB |
|
|
$ |
904,604 |
|
| |
1,000 |
|
|
PNMAC GMSR ISSUER TRUST 2018-GT1,
(1-Month LIBOR reference rate + 3.850% spread), 144A (3) |
|
|
9.000% |
|
|
|
2/25/25 |
|
|
|
N/R |
|
|
|
999,830 |
|
| |
40,180 |
|
|
SLG Office Trust 2021-OVA, 144A, (I/O) |
|
|
0.258% |
|
|
|
7/15/41 |
|
|
|
AA- |
|
|
|
613,995 |
|
| |
1,579 |
|
|
SMR 2022-IND Mortgage Trust, (TSFR1M reference rate + 3.950%
spread), 144A (3), (4) |
|
|
9.097% |
|
|
|
2/15/39 |
|
|
|
Baa3 |
|
|
|
1,484,057 |
|
| |
1,500 |
|
|
Spruce Hill Mortgage Loan Trust 2020-SH1, 144A, (I/O) |
|
|
3.827% |
|
|
|
1/28/50 |
|
|
|
BBB |
|
|
|
1,295,018 |
|
| |
127,100 |
|
|
SUMIT 2022-BVUE Mortgage Trust, 144A |
|
|
0.179% |
|
|
|
2/12/41 |
|
|
|
A1 |
|
|
|
704,566 |
|
| |
428 |
|
|
UBS-Barclays Commercial Mortgage Trust 2013-C5, 144A (4) |
|
|
3.649% |
|
|
|
3/10/46 |
|
|
|
A |
|
|
|
392,561 |
|
| |
1,500 |
|
|
VNDO Trust 2016-350P, 144A |
|
|
4.033% |
|
|
|
1/10/35 |
|
|
|
B |
|
|
|
1,188,731 |
|
| |
1,300 |
|
|
Wells Fargo Commercial Mortgage Trust 2015-NXS1, (4) |
|
|
4.286% |
|
|
|
5/15/48 |
|
|
|
BBB- |
|
|
|
1,073,092 |
|
|
|
|
|
Total Mortgage-Backed Securities
(cost $112,920,179) |
|
|
|
|
|
|
|
|
|
|
|
|
|
|
102,155,602 |
|
|
|
|
|
|
|
Principal
Amount (000) |
|
|
Description (1) |
|
Coupon |
|
|
Maturity |
|
|
Ratings (2) |
|
|
Value |
|
|
|
|
| |
|
|
ASSET-BACKED SECURITIES – 39.7% (28.1% of Total Investments) |
|
|
|
|
|
|
|
|
|
|
| $ |
1,133 |
|
|
AASET 2020-1 Trust, 2020 1A, 144A (5) |
|
|
6.413% |
|
|
|
1/16/40 |
|
|
|
B |
|
|
$ |
147,601 |
|
| |
1,500 |
|
|
ACRE Commercial Mortgage 2021-FL4 Ltd, (TSFR1M reference rate +
2.714% spread), 144A (3), (4) |
|
|
7.805% |
|
|
|
12/18/37 |
|
|
|
N/R |
|
|
|
1,431,112 |
|
| |
843 |
|
|
Adams Outdoor Advertising LP, 2018 1, 144A |
|
|
4.810% |
|
|
|
11/15/48 |
|
|
|
A |
|
|
|
794,026 |
|
| |
1,500 |
|
|
Adams Outdoor Advertising LP, 2018 1, 144A |
|
|
7.356% |
|
|
|
11/15/48 |
|
|
|
BB |
|
|
|
1,344,294 |
|
| |
750 |
|
|
Affirm Asset Securitization Trust 2021-B, 144A |
|
|
2.540% |
|
|
|
8/17/26 |
|
|
|
N/R |
|
|
|
683,372 |
|
| |
857 |
|
|
Air Canada 2020-2 Class A Pass Through Trust,
144A (4) |
|
|
5.250% |
|
|
|
4/01/29 |
|
|
|
A |
|
|
|
830,559 |
|
| |
696 |
|
|
Air Canada 2020-2 Class B Pass Through Trust,
144A (4) |
|
|
9.000% |
|
|
|
10/01/25 |
|
|
|
BBB+ |
|
|
|
703,999 |
|
| |
550 |
|
|
Avis Budget Rental Car Funding AESOP LLC, 144A |
|
|
4.080% |
|
|
|
2/20/28 |
|
|
|
Ba1 |
|
|
|
461,395 |
|
| |
296 |
|
|
Bojangles Issuer LLC, 2020 1A, 144A |
|
|
3.832% |
|
|
|
10/20/50 |
|
|
|
N/R |
|
|
|
267,254 |
|
| |
250 |
|
|
Bonanza RE Ltd, 144A (3) |
|
|
4.555% |
|
|
|
1/08/24 |
|
|
|
N/R |
|
|
|
221,550 |
|
| |
750 |
|
|
Bonanza RE Ltd, (3-Month U.S. Treasury Bill reference rate +
8.250% spread), 144A (3) |
|
|
12.787% |
|
|
|
1/08/26 |
|
|
|
N/R |
|
|
|
742,575 |
|
| |
250 |
|
|
Bonanza RE Ltd, (3-Month U.S. Treasury Bill reference rate +
5.750% spread), 144A (3) |
|
|
11.031% |
|
|
|
3/16/25 |
|
|
|
N/R |
|
|
|
210,300 |
|
| |
500 |
|
|
Bonanza RE Ltd, (3-Month U.S. Treasury Bill reference rate +
4.870% spread), 2020 A, 144A (3) |
|
|
10.148% |
|
|
|
12/23/24 |
|
|
|
N/R |
|
|
|
429,650 |
|
| |
486 |
|
|
British Airways 2020-1 Class A Pass Through Trust,
144A (4) |
|
|
4.250% |
|
|
|
11/15/32 |
|
|
|
A |
|
|
|
443,496 |
|
| |
433 |
|
|
British Airways 2020-1 Class B Pass Through Trust,
144A (4) |
|
|
8.375% |
|
|
|
11/15/28 |
|
|
|
A- |
|
|
|
435,826 |
|
| |
2,000 |
|
|
Cars Net Lease Mortgage Notes Series 2020-1, 144A |
|
|
4.690% |
|
|
|
12/15/50 |
|
|
|
BBB |
|
|
|
1,706,659 |
|
| |
775 |
|
|
CARS-DB4 LP, 2020 1A, 144A |
|
|
4.520% |
|
|
|
2/15/50 |
|
|
|
BBB |
|
|
|
682,848 |
|
| |
2 |
|
|
Carvana Auto Receivables Trust 2021-P2, 144A |
|
|
0.000% |
|
|
|
5/10/28 |
|
|
|
N/R |
|
|
|
631,250 |
|
| |
250 |
|
|
Cayuga Park CLO Ltd, (3-Month LIBOR reference rate + 6.000%
spread), 2020 1A, 144A (3) |
|
|
1.000% |
|
|
|
7/17/34 |
|
|
|
BB- |
|
|
|
220,490 |
|
| |
385 |
|
|
CIFC Funding 2020-II Ltd,
(3-Month LIBOR reference rate + 6.500% spread), 2020 2A, 144A (3) |
|
|
11.750% |
|
|
|
10/20/34 |
|
|
|
BB- |
|
|
|
359,343 |
|
| |
375 |
|
|
CIFC Funding 2022-II Ltd, (TSFR3M reference rate + 7.000% spread),
2022 2A, 144A (3) |
|
|
12.028% |
|
|
|
4/19/35 |
|
|
|
Ba3 |
|
|
|
348,594 |
|
| |
750 |
|
|
CIFC Funding 2022-IV Ltd, (SOFR reference rate + 3.550% spread),
2022 4A, 144A (3) |
|
|
8.536% |
|
|
|
7/16/35 |
|
|
|
BBB- |
|
|
|
716,317 |
|
| |
250 |
|
|
Citrus Re Ltd, (3-Month U.S. Treasury Bill reference rate + 5.100%
spread), 144A (3) |
|
|
5.100% |
|
|
|
6/07/25 |
|
|
|
N/R |
|
|
|
240,850 |
|
| |
250 |
|
|
Cologix Data Centers US Issuer LLC, 2021 1A, 144A |
|
|
5.990% |
|
|
|
12/26/51 |
|
|
|
N/R |
|
|
|
202,624 |
|
| |
1,132 |
|
|
CyrusOne Data Centers Issuer I, 2023 1A, 144A |
|
|
5.450% |
|
|
|
4/20/48 |
|
|
|
BBB- |
|
|
|
967,177 |
|
| |
921 |
|
|
EWC Master Issuer LLC, 2022 1A, 144A |
|
|
5.500% |
|
|
|
3/15/52 |
|
|
|
N/R |
|
|
|
848,231 |
|
| |
477 |
|
|
FOCUS Brands Funding LLC, 2018 1, 144A |
|
|
5.184% |
|
|
|
10/30/48 |
|
|
|
BBB |
|
|
|
451,172 |
|
| |
500 |
|
|
Goldentree Loan Opportunities IX Ltd, (3-Month LIBOR reference
rate + 5.660% spread), 2014 9A, 144A (3) |
|
|
10.959% |
|
|
|
10/29/29 |
|
|
|
BB- |
|
|
|
473,081 |
|
| |
500 |
|
|
GoldentTree Loan Management US CLO 1 Ltd, (3-Month LIBOR reference
rate + 7.500% spread), 2021 11A, 144A (3) |
|
|
8.563% |
|
|
|
10/20/34 |
|
|
|
B- |
|
|
|
389,749 |
|
| |
375 |
|
|
Gracie Point International Funding 2021-1, (1-Month LIBOR reference rate + 2.400% spread), 144A (3) |
|
|
7.570% |
|
|
|
11/01/23 |
|
|
|
N/R |
|
|
|
375,001 |
|
| |
488 |
|
|
Hardee’s Funding LLC, 2020 1A, 144A |
|
|
3.981% |
|
|
|
12/20/50 |
|
|
|
BBB |
|
|
|
414,905 |
|
| |
500 |
|
|
Hertz Vehicle Financing III LLC, 2022 1A, 144A |
|
|
4.850% |
|
|
|
6/25/26 |
|
|
|
Ba2 |
|
|
|
462,185 |
|
42
|
|
|
|
|
|
|
|
|
|
|
|
|
|
|
|
|
|
|
|
|
Principal
Amount (000) |
|
|
Description (1) |
|
Coupon |
|
|
Maturity |
|
|
Ratings (2) |
|
|
Value |
|
|
|
|
| |
|
|
ASSET-BACKED SECURITIES (continued) |
|
|
|
|
|
|
|
|
|
|
| $ |
250 |
|
|
Hestia Re Ltd, (1-Month U.S. Treasury Bill reference rate + 9.500%
spread), 144A (3) |
|
|
14.768% |
|
|
|
4/22/25 |
|
|
|
N/R |
|
|
$ |
213,675 |
|
| |
281 |
|
|
HIN Timeshare Trust 2020-A, 144A |
|
|
5.500% |
|
|
|
10/09/39 |
|
|
|
BB |
|
|
|
258,056 |
|
| |
201 |
|
|
HIN Timeshare Trust 2020-A, 144A |
|
|
6.500% |
|
|
|
10/09/39 |
|
|
|
B |
|
|
|
184,680 |
|
| |
641 |
|
|
Jack in the Box Funding LLC, 144A |
|
|
4.476% |
|
|
|
8/25/49 |
|
|
|
BBB |
|
|
|
591,757 |
|
| |
623 |
|
|
Jonah Energy Abs I LLC, 2022 1, 144A |
|
|
7.200% |
|
|
|
11/20/37 |
|
|
|
A- |
|
|
|
610,912 |
|
| |
339 |
|
|
Lunar Aircraft 2020-1 LTD, 144A |
|
|
3.376% |
|
|
|
2/15/45 |
|
|
|
BBB |
|
|
|
295,075 |
|
| |
500 |
|
|
Madison Park Funding XXXVI Ltd, (TSFR3M reference rate + 5.460% spread), 2019 36A, 144A (3) |
|
|
5.764% |
|
|
|
4/15/35 |
|
|
|
BBB- |
|
|
|
472,571 |
|
| |
1,125 |
|
|
Magnetite XXIII Ltd, (3-Month LIBOR reference rate + 6.300%
spread), 2019 23A, 144A (3) |
|
|
7.484% |
|
|
|
1/25/35 |
|
|
|
BB- |
|
|
|
1,097,029 |
|
| |
250 |
|
|
Matterhorn Re Ltd, (SOFR reference rate + 5.250% spread), 144A (3) |
|
|
5.889% |
|
|
|
3/24/25 |
|
|
|
N/R |
|
|
|
237,100 |
|
| |
500 |
|
|
Mercury Financial Credit Card Master Trust, 2023 1A, 144A |
|
|
8.040% |
|
|
|
9/20/27 |
|
|
|
N/R |
|
|
|
499,390 |
|
| |
500 |
|
|
Mercury Financial Credit Card Master Trust, 2023 1A, 144A |
|
|
9.590% |
|
|
|
9/20/27 |
|
|
|
N/R |
|
|
|
492,228 |
|
| |
500 |
|
|
Mercury Financial Credit Card Master Trust, 2022 3A, 144A |
|
|
10.680% |
|
|
|
6/21/27 |
|
|
|
N/R |
|
|
|
492,181 |
|
| |
125 |
|
|
MetroNet Infrastructure Issuer LLC, 2023 1A, 144A |
|
|
10.850% |
|
|
|
4/20/53 |
|
|
|
BB- |
|
|
|
120,797 |
|
| |
125 |
|
|
MetroNet Infrastructure Issuer LLC, 2023 1A, 144A |
|
|
8.010% |
|
|
|
4/20/53 |
|
|
|
BBB |
|
|
|
121,361 |
|
| |
1,548 |
|
|
Mexico Remittances Funding Fiduciary Estate Management Sarl, 144A |
|
|
4.875% |
|
|
|
1/15/28 |
|
|
|
BB+ |
|
|
|
1,391,715 |
|
| |
1,277 |
|
|
Mosaic Solar Loan Trust 2019-2, 144A |
|
|
0.000% |
|
|
|
9/20/40 |
|
|
|
N/R |
|
|
|
512,299 |
|
| |
841 |
|
|
Mosaic Solar Loan Trust 2020-1, 144A |
|
|
0.000% |
|
|
|
4/20/46 |
|
|
|
N/R |
|
|
|
592,854 |
|
| |
870 |
|
|
Mosaic Solar Loan Trust 2020-2, 144A |
|
|
5.420% |
|
|
|
8/20/46 |
|
|
|
N/R |
|
|
|
753,165 |
|
| |
521 |
|
|
MVW 2020-1 LLC,144A |
|
|
4.210% |
|
|
|
10/20/37 |
|
|
|
BBB |
|
|
|
489,375 |
|
| |
241 |
|
|
MVW 2020-1 LLC, 144A |
|
|
7.140% |
|
|
|
10/20/37 |
|
|
|
BB |
|
|
|
231,024 |
|
| |
500 |
|
|
Oportun Funding 2022-1 LLC, 2022 1, 144A |
|
|
6.000% |
|
|
|
6/15/29 |
|
|
|
N/R |
|
|
|
474,660 |
|
| |
408 |
|
|
Oportun Funding XIV LLC, 2021 A, 144A |
|
|
5.400% |
|
|
|
3/08/28 |
|
|
|
N/R |
|
|
|
388,186 |
|
| |
1,000 |
|
|
Oportun Issuance Trust 2021-B, 144A |
|
|
5.410% |
|
|
|
5/08/31 |
|
|
|
N/R |
|
|
|
888,139 |
|
| |
350 |
|
|
Oportun Issuance Trust 2021-C, 144A |
|
|
5.570% |
|
|
|
10/08/31 |
|
|
|
N/R |
|
|
|
301,710 |
|
| |
925 |
|
|
Palmer Square CLO 2023-1 Ltd, (TSFR3M reference rate + 5.300%
spread), 144A (3) |
|
|
10.027% |
|
|
|
1/20/36 |
|
|
|
BBB- |
|
|
|
933,707 |
|
| |
625 |
|
|
Palmer Square CLO Ltd, (TSFR3M reference rate + 6.350% spread), 2022 1A, 144A (3) |
|
|
11.398% |
|
|
|
4/20/35 |
|
|
|
Ba3 |
|
|
|
578,534 |
|
| |
250 |
|
|
Purchasing Power Funding 2021-A LLC, 144A |
|
|
4.370% |
|
|
|
10/15/25 |
|
|
|
N/R |
|
|
|
235,069 |
|
| |
1,032 |
|
|
Purewest Funding LLC, 2021 1, 144A |
|
|
4.091% |
|
|
|
12/22/36 |
|
|
|
A- |
|
|
|
974,230 |
|
| |
2 |
|
|
Putnam RE PTE Ltd, 2020 A, 144A (5), (6) |
|
|
10.825% |
|
|
|
6/07/24 |
|
|
|
N/R |
|
|
|
0 |
|
| |
400 |
|
|
Residential Reinsurance 2020 Ltd, (3-Month U.S. Treasury Bill
reference rate + 6.510% spread), 144A (3) |
|
|
6.510% |
|
|
|
12/06/24 |
|
|
|
N/R |
|
|
|
381,360 |
|
| |
500 |
|
|
Residential Reinsurance 2022 Ltd, (3-Month U.S. Treasury Bill
reference rate + 7.000% spread), 144A (3) |
|
|
12.273% |
|
|
|
12/06/26 |
|
|
|
N/R |
|
|
|
497,400 |
|
| |
500 |
|
|
SD Re Ltd, (3-Month U.S. Treasury Bill reference rate + 9.250%
spread), 144A (3) |
|
|
14.528% |
|
|
|
11/19/24 |
|
|
|
N/R |
|
|
|
483,950 |
|
| |
651 |
|
|
SERVPRO Master Issuer LLC, 2019 1A, 144A |
|
|
3.882% |
|
|
|
10/25/49 |
|
|
|
BBB- |
|
|
|
594,000 |
|
| |
573 |
|
|
Sesac Finance LLC, 2019 1, 144A |
|
|
5.216% |
|
|
|
7/25/49 |
|
|
|
N/R |
|
|
|
537,523 |
|
| |
50 |
|
|
Sierra Timeshare 2019-3 Receivables Funding LLC, 144A |
|
|
4.180% |
|
|
|
8/20/36 |
|
|
|
BB |
|
|
|
47,343 |
|
| |
307 |
|
|
Sierra Timeshare 2020-2 Receivables Funding LLC, 144A |
|
|
6.590% |
|
|
|
7/20/37 |
|
|
|
BB |
|
|
|
292,646 |
|
| |
1,000 |
|
|
Sixth Street CLO XIX Ltd, (3-Month LIBOR reference rate + 5.900%
spread), 2021 19A, 144A (3) |
|
|
6.035% |
|
|
|
7/20/34 |
|
|
|
BB- |
|
|
|
954,057 |
|
| |
463 |
|
|
Start II LTD, 2019 1, 144A |
|
|
5.095% |
|
|
|
3/15/44 |
|
|
|
BB |
|
|
|
359,147 |
|
| |
1,000 |
|
|
TCW CLO 2021-2 Ltd,
(3-Month LIBOR reference rate + 6.860% spread), 144A (3) |
|
|
6.985% |
|
|
|
7/25/34 |
|
|
|
BB- |
|
|
|
901,826 |
|
| |
500 |
|
|
Ursa Re II Ltd, (3-Month U.S. Treasury Bill reference rate +
7.000% spread), 144A (3) |
|
|
12.268% |
|
|
|
12/06/25 |
|
|
|
N/R |
|
|
|
520,400 |
|
| |
1,156 |
|
|
Vivint Solar Financing V LLC, 2018 1A, 144A |
|
|
7.370% |
|
|
|
4/30/48 |
|
|
|
N/R |
|
|
|
1,057,545 |
|
| |
556 |
|
|
VR Funding LLC, 2020 1A, 144A |
|
|
6.420% |
|
|
|
11/15/50 |
|
|
|
N/R |
|
|
|
507,572 |
|
| |
1,050 |
|
|
VREG Films Inc, 2023 23-1,
(WI/DD) |
|
|
10.550% |
|
|
|
11/15/50 |
|
|
|
N/R |
|
|
|
1,019,161 |
|
|
|
|
|
Total Asset-Backed Securities
(cost $45,892,196) |
|
|
|
41,222,894 |
|
|
|
|
|
Total Long-Term Investments
(cost $158,812,375) |
|
|
|
143,378,496 |
|
43
|
|
|
|
|
| JLS |
|
Nuveen Mortgage and Income Fund (continued) |
| |
Portfolio of Investments June 30, 2023 |
|
|
(Unaudited) |
|
|
|
|
|
|
|
|
|
|
|
|
|
|
|
|
|
|
|
|
|
Principal
Amount (000) |
|
|
Description (1) |
|
Coupon |
|
|
Maturity |
|
|
Ratings (2) |
|
|
Value |
|
|
|
|
|
|
|
SHORT-TERM INVESTMENTS – 3.0%(2.2% of Total Investments) |
|
|
|
| |
|
|
U.S. GOVERNMENT AND AGENCY OBLIGATIONS – 3.0% (2.2% of Total Investments) |
|
|
|
|
|
|
|
| $ |
3,189 |
|
|
Federal Farm Credit Discount Notes |
|
|
0.000% |
|
|
|
7/03/23 |
|
|
|
N/R |
|
|
$ |
3,188,150 |
|
|
|
|
|
Total U.S. Government and Agency Obligations
(cost $3,188,150) |
|
|
|
|
|
|
|
|
|
|
|
|
|
|
3,188,150 |
|
|
|
|
|
Total Short-Term Investments
(cost $3,188,150) |
|
|
|
|
|
|
|
|
|
|
|
3,188,150 |
|
|
|
|
|
Total Investments
(cost $162,000,525) – 141.2% |
|
|
|
|
|
|
|
|
|
|
|
146,566,646 |
|
|
|
|
|
Borrowings –
(9.3)% (7), (8) |
|
|
|
|
|
|
|
|
|
|
|
(9,695,000 |
) |
|
|
|
|
Reverse Repurchase Agreements, including accrued
interest – (30.7)% (9) |
|
|
|
|
|
|
|
|
|
|
|
(31,879,208 |
) |
|
|
|
|
Other Assets & Liabilities, Net –
(1.2)% |
|
|
|
|
|
|
|
|
|
|
|
(1,228,208 |
) |
|
|
|
|
Net Assets Applicable to Common Shares –
100% |
|
|
|
|
|
|
|
|
|
|
$ |
103,764,230 |
|
For Fund portfolio compliance purposes, the
Fund’s industry classifications refer to any one or more of the industry sub-classifications used by one or more widely recognized market indexes or ratings group indexes, and/or as defined by Fund
management. This definition may not apply for purposes of this report, which may combine industry sub-classifications into sectors for reporting ease.
| (1) |
All percentages shown in the Portfolio of Investments are based on net assets applicable to common shares unless otherwise
noted. |
| (2) |
For financial reporting purposes, the ratings disclosed are the highest of Standard & Poor’s Group
(“Standard & Poor’s”), Moody’s Investors Service, Inc. (“Moody’s”) or Fitch, Inc. (“Fitch”) rating. This treatment of split-rated securities may differ from that used for other purposes, such as
for Fund investment policies. Ratings below BBB by Standard & Poor’s, Baa by Moody’s or BBB by Fitch are considered to be below investment grade. Holdings designated N/R are not rated by any of these national rating agencies.
|
| (3) |
Variable rate security. The rate shown is the coupon as of the end of the reporting period. |
| (4) |
Investment, or portion of investment, has been pledged to collateralize the net payment obligations for investments in
reverse repurchase agreements. As of the end of the reporting period, investments with a value of $48,917,898 have been pledged as collateral for reverse repurchase agreements. |
| (5) |
For fair value measurement disclosure purposes, investment classified as Level 3. |
| (6) |
Defaulted security. A security whose issuer has failed to fully pay principal and/or interest when due, or is under the
protection of bankruptcy. |
| (7) |
Borrowings as a percentage of Total Investments is 6.6%. |
| (8) |
The Fund may pledge up to 100% of its eligible investments (excluding any investments separately pledged as collateral for
specific investments in derivatives, when applicable) in the Portfolio of Investments as collateral for borrowings. As of the end of the reporting period, investments with a value of $25,192,959 have been pledged as collateral for borrowings.
|
| (9) |
Reverse Repurchase Agreements, including accrued interest as a percentage of Total investments is 21.8%.
|
| 144A |
Investment is exempt from registration under Rule 144A of the Securities Act of 1933, as amended. These investments may
only be resold in transactions exempt from registration, which are normally those transactions with qualified institutional buyers. |
| I/O |
Interest only security |
| LIBOR |
London Inter-Bank Offered Rate |
| SOFR |
Secured Overnight Financing Rate |
| SOFR30A |
30 Day Average Secured Overnight Financing Rate |
| TSFR1M |
CME Term SOFR 1 Month |
| TSFR3M |
CME Term SOFR 3 Month |
| WI/DD |
Purchased on a when-issued or delayed delivery basis. |
See Notes to Financial Statements
44
Statement of Assets and Liabilities
|
|
|
|
|
|
|
|
|
|
|
|
|
| June 30, 2023 (Unaudited) |
|
JGH |
|
|
NPCT(1) |
|
|
JLS |
|
| ASSETS |
|
|
|
|
|
|
|
|
|
|
|
|
| Long-term investments, at
value† |
|
$ |
398,792,407 |
|
|
$ |
548,118,012 |
|
|
$ |
143,378,496 |
|
| Short-term investments, at value◇ |
|
|
11,658,833 |
|
|
|
6,198,251 |
|
|
|
3,188,150 |
|
| Cash |
|
|
107,700 |
|
|
|
51,324 |
|
|
|
19,902 |
|
| Cash denominated in foreign currencies^ |
|
|
420 |
|
|
|
471,149 |
|
|
|
— |
|
| Swaps premiums paid |
|
|
— |
|
|
|
47,606 |
|
|
|
— |
|
| Unrealized appreciation on: |
|
|
|
|
|
|
|
|
|
|
|
|
| Cross currency swaps |
|
|
— |
|
|
|
4,332,347 |
|
|
|
— |
|
| Interest rate swaps |
|
|
4,741,752 |
|
|
|
— |
|
|
|
— |
|
| Receivables: |
|
|
|
|
|
|
|
|
|
|
|
|
| Dividends |
|
|
— |
|
|
|
80,497 |
|
|
|
— |
|
| Interest |
|
|
6,922,059 |
|
|
|
6,107,617 |
|
|
|
838,129 |
|
| Investments sold |
|
|
1,136,217 |
|
|
|
26,577 |
|
|
|
860,440 |
|
| Reclaims |
|
|
— |
|
|
|
152,806 |
|
|
|
926 |
|
| Other assets |
|
|
136,642 |
|
|
|
34,447 |
|
|
|
60,719 |
|
| Total assets |
|
|
423,496,030 |
|
|
|
565,620,633 |
|
|
|
148,346,762 |
|
| LIABILITIES |
|
|
|
|
|
|
|
|
|
|
|
|
| Cash collateral due to broker(2) |
|
|
4,526,943 |
|
|
|
380,000 |
|
|
|
— |
|
| Borrowings |
|
|
119,000,000 |
|
|
|
105,500,000 |
|
|
|
9,695,000 |
|
| Reverse repurchase agreements, including accrued interest |
|
|
— |
|
|
|
46,125,254 |
|
|
|
31,879,208 |
|
| Unrealized depreciation on forward foreign currency exchange contracts |
|
|
— |
|
|
|
29,071 |
|
|
|
— |
|
| TFP Shares, Net* |
|
|
— |
|
|
|
69,662,158 |
|
|
|
— |
|
| Payables: |
|
|
|
|
|
|
|
|
|
|
|
|
| Dividends |
|
|
2,359,727 |
|
|
|
2,250,760 |
|
|
|
671,009 |
|
| Interest |
|
|
607,233 |
|
|
|
469,325 |
|
|
|
50,845 |
|
| Investments purchased – regular settlement |
|
|
— |
|
|
|
— |
|
|
|
1,001,000 |
|
| Investments purchased – when-issued/delayed-delivery settlement |
|
|
2,028,273 |
|
|
|
— |
|
|
|
1,019,156 |
|
| Accrued expenses: |
|
|
|
|
|
|
|
|
|
|
|
|
| Custodian fees |
|
|
72,225 |
|
|
|
56,255 |
|
|
|
31,036 |
|
| Investor relations |
|
|
193 |
|
|
|
369 |
|
|
|
595 |
|
| Management fees |
|
|
290,814 |
|
|
|
448,767 |
|
|
|
113,640 |
|
| Trustees fees |
|
|
106,735 |
|
|
|
9,213 |
|
|
|
55,241 |
|
| Professional fees |
|
|
29,158 |
|
|
|
23,316 |
|
|
|
53,362 |
|
| Shareholder reporting expenses |
|
|
36,273 |
|
|
|
20,835 |
|
|
|
5,977 |
|
| Shareholder servicing agent fees |
|
|
28 |
|
|
|
3,297 |
|
|
|
11 |
|
| Other |
|
|
5,528 |
|
|
|
1,366 |
|
|
|
6,452 |
|
| Total liabilities |
|
|
129,063,130 |
|
|
|
224,979,986 |
|
|
|
44,582,532 |
|
| Commitments and contingencies(2) |
|
|
|
|
|
|
|
|
|
|
|
|
| Net assets applicable to common shares |
|
$ |
294,432,900 |
|
|
$ |
340,640,647 |
|
|
$ |
103,764,230 |
|
| Common shares outstanding |
|
|
23,177,393 |
|
|
|
28,755,000 |
|
|
|
5,476,626 |
|
| Net asset value (“NAV”) per common share
outstanding |
|
$ |
12.70 |
|
|
$ |
11.85 |
|
|
$ |
18.95 |
|
| NET ASSETS APPLICABLE TO COMMON SHARES CONSIST OF: |
|
|
|
|
|
|
|
|
|
|
|
|
| Common shares, $0.01 par value per share |
|
$ |
231,774 |
|
|
$ |
287,550 |
|
|
$ |
54,766 |
|
| Paid-in surplus |
|
|
467,771,074 |
|
|
|
552,220,503 |
|
|
|
121,692,869 |
|
| Total distributable earnings (loss) |
|
|
(173,569,948 |
) |
|
|
(211,867,406 |
) |
|
|
(17,983,405 |
) |
| Net assets applicable to common shares |
|
$ |
294,432,900 |
|
|
$ |
340,640,647 |
|
|
$ |
103,764,230 |
|
| Authorized shares: |
|
|
|
|
|
|
|
|
|
|
|
|
| Common |
|
|
Unlimited |
|
|
|
Unlimited |
|
|
|
Unlimited |
|
| Preferred |
|
|
— |
|
|
|
Unlimited |
|
|
|
— |
|
|
|
|
|
|
† Long-term
investments, cost |
|
$ |
453,002,951 |
|
|
$ |
705,160,300 |
|
|
$ |
158,812,375 |
|
|
◇ Short-term
investments, cost |
|
$ |
11,658,833 |
|
|
$ |
6,198,251 |
|
|
$ |
3,188,150 |
|
| ^ Cash denominated in foreign currencies,
cost |
|
$ |
379 |
|
|
$ |
443,842 |
|
|
$ |
— |
|
| * TFP Shares, liquidation
preference |
|
|
— |
|
|
|
70,000,000 |
|
|
|
— |
|
| (1) |
Consolidated Statement of Assets and Liabilities (as disclosed in Notes to Financial Statements). |
| (2) |
As disclosed in Notes to Financial Statements. |
See Notes to Financial Statements
45
Statement of Operations
|
|
|
|
|
|
|
|
|
|
|
|
|
| Six Months Ended June 30, 2023 (Unaudited) |
|
JGH |
|
|
NPCT(1) |
|
|
JLS |
|
| INVESTMENT INCOME |
|
|
|
|
|
|
|
|
|
|
|
|
| Dividends |
|
$ |
193,940 |
|
|
$ |
921,095 |
|
|
$ |
— |
|
| Interest |
|
|
14,677,933 |
|
|
|
14,236,650 |
|
|
|
6,025,190 |
|
| Foreign tax withheld on dividend income |
|
|
— |
|
|
|
(4,220 |
) |
|
|
— |
|
| Total investment income |
|
|
14,871,873 |
|
|
|
15,153,525 |
|
|
|
6,025,190 |
|
| EXPENSES |
|
|
|
|
|
|
|
|
|
|
|
|
| Management fees |
|
|
1,778,249 |
|
|
|
2,709,818 |
|
|
|
692,260 |
|
| Interest expense and amortization of offering costs |
|
|
3,570,579 |
|
|
|
6,173,289 |
|
|
|
1,270,487 |
|
| Custodian expenses |
|
|
25,631 |
|
|
|
35,582 |
|
|
|
18,991 |
|
| Trustees fees |
|
|
6,506 |
|
|
|
14,872 |
|
|
|
2,231 |
|
| Professional fees |
|
|
58,245 |
|
|
|
38,141 |
|
|
|
62,846 |
|
| Shareholder reporting expenses |
|
|
58,406 |
|
|
|
40,530 |
|
|
|
13,760 |
|
| Shareholder servicing agent fees |
|
|
57 |
|
|
|
17,809 |
|
|
|
64 |
|
| Stock exchange listing fees |
|
|
3,647 |
|
|
|
4,301 |
|
|
|
3,647 |
|
| Investor relations expense |
|
|
62,987 |
|
|
|
51,594 |
|
|
|
15,540 |
|
| Other |
|
|
8,434 |
|
|
|
11,858 |
|
|
|
6,122 |
|
| Total expenses |
|
|
5,572,741 |
|
|
|
9,097,794 |
|
|
|
2,085,948 |
|
| Net investment income (loss) |
|
|
9,299,132 |
|
|
|
6,055,731 |
|
|
|
3,939,242 |
|
| REALIZED AND UNREALIZED GAIN (LOSS) |
|
|
|
|
|
|
|
|
|
|
|
|
| Realized gain (loss) from: |
|
|
|
|
|
|
|
|
|
|
|
|
| Investments and foreign currency |
|
|
(10,189,012 |
) |
|
|
(25,713,620 |
) |
|
|
(593,883 |
) |
| Forward foreign currency exchange contracts |
|
|
— |
|
|
|
(137,112 |
) |
|
|
— |
|
| Swaps |
|
|
1,160,775 |
|
|
|
600,795 |
|
|
|
— |
|
| Net realized gain (loss) |
|
|
(9,028,237 |
) |
|
|
(25,249,937 |
) |
|
|
(593,883 |
) |
| Change in net unrealized appreciation (depreciation) on: |
|
|
|
|
|
|
|
|
|
|
|
|
| Investments and foreign currency |
|
|
11,760,705 |
|
|
|
23,233,472 |
|
|
|
1,078,227 |
|
| Forward foreign currency exchange contracts |
|
|
— |
|
|
|
194,515 |
|
|
|
— |
|
| Swaps |
|
|
299,976 |
|
|
|
(840,035 |
) |
|
|
— |
|
| Change in net unrealized appreciation (depreciation) |
|
|
12,060,681 |
|
|
|
22,587,952 |
|
|
|
1,078,227 |
|
| Net realized and unrealized gain (loss) |
|
|
3,032,444 |
|
|
|
(2,661,985 |
) |
|
|
484,344 |
|
| Net increase (decrease) in net assets applicable to common
shares from operations |
|
$ |
12,331,576 |
|
|
$ |
3,393,746 |
|
|
$ |
4,423,586 |
|
| (1) |
Consolidated Statement of Operations (as disclosed in Notes to Financial Statements). |
See Notes to Financial Statements
46
Statement of Changes in Net Assets
|
|
|
|
|
|
|
|
|
|
|
|
|
|
|
|
|
| |
|
JGH |
|
|
NPCT(1) |
|
| |
|
Unaudited
Six Months Ended
6/30/23 |
|
|
Year
Ended 12/31/22 |
|
|
Unaudited
Six Months Ended
6/30/23 |
|
|
Year
Ended 12/31/22 |
|
| OPERATIONS |
|
|
|
|
|
|
|
|
|
|
|
|
|
|
|
|
| Net investment income (loss) |
|
$ |
9,299,132 |
|
|
$ |
21,989,990 |
|
|
$ |
6,055,731 |
|
|
$ |
19,365,225 |
|
| Net realized gain (loss) |
|
|
(9,028,237 |
) |
|
|
(20,189,080 |
) |
|
|
(25,249,937 |
) |
|
|
(20,400,796 |
) |
| Change in net unrealized appreciation (depreciation) |
|
|
12,060,681 |
|
|
|
(59,351,712 |
) |
|
|
22,587,952 |
|
|
|
(175,982,209 |
) |
| Net increase (decrease) in net assets applicable to common shares
from operations |
|
|
12,331,576 |
|
|
|
(57,550,802 |
) |
|
|
3,393,746 |
|
|
|
(177,017,780 |
) |
| DISTRIBUTIONS TO COMMON SHAREHOLDERS |
|
|
|
|
|
|
|
|
|
|
|
|
|
|
|
|
| Dividends |
|
|
(14,393,161 |
) |
|
|
(22,939,413 |
) |
|
|
(15,470,190 |
) |
|
|
(22,475,554 |
) |
| Return of Capital |
|
|
— |
|
|
|
(8,489,132 |
) |
|
|
— |
|
|
|
(13,065,626 |
) |
| Decrease in net assets applicable to common shares from distributions
to common shareholders |
|
|
(14,393,161 |
) |
|
|
(31,428,545 |
) |
|
|
(15,470,190 |
) |
|
|
(35,541,180 |
) |
| CAPITAL SHARE TRANSACTIONS |
|
|
|
|
|
|
|
|
|
|
|
|
|
|
|
|
| Common shares: |
|
|
|
|
|
|
|
|
|
|
|
|
|
|
|
|
| Cost of shares repurchased and retired |
|
|
— |
|
|
|
— |
|
|
|
— |
|
|
|
— |
|
| Net increase (decrease) in net assets applicable to common shares
from capital share transactions |
|
|
— |
|
|
|
— |
|
|
|
— |
|
|
|
— |
|
| Net increase (decrease) in net assets applicable to common
shares |
|
|
(2,061,585 |
) |
|
|
(88,979,347 |
) |
|
|
(12,076,444 |
) |
|
|
(212,558,960 |
) |
| Net assets applicable to common shares at the beginning of the
period |
|
|
296,494,485 |
|
|
|
385,473,832 |
|
|
|
352,717,091 |
|
|
|
565,276,051 |
|
| Net assets applicable to common shares at the end of the
period |
|
$ |
294,432,900 |
|
|
$ |
296,494,485 |
|
|
$ |
340,640,647 |
|
|
$ |
352,717,091 |
|
| (1) |
Consolidated Statement of Changes in Net Assets (as disclosed in Notes to Financial Statements). |
See Notes to Financial Statements
47
Statement of Changes in Net Assets (continued)
|
|
|
|
|
|
|
|
|
| |
|
JLS |
|
| |
|
Unaudited
Six Months Ended
6/30/23 |
|
|
Year
Ended
12/31/22 |
|
| OPERATIONS |
|
|
|
|
|
|
|
|
| Net investment income (loss) |
|
$ |
3,939,242 |
|
|
$ |
6,134,798 |
|
| Net realized gain (loss) |
|
|
(593,883 |
) |
|
|
(1,934,077 |
) |
| Change in net unrealized appreciation (depreciation) |
|
|
1,078,227 |
|
|
|
(16,720,905 |
) |
| Net increase (decrease) in net assets applicable to common shares
from operations |
|
|
4,423,586 |
|
|
|
(12,520,184 |
) |
| DISTRIBUTIONS TO COMMON SHAREHOLDERS |
|
|
|
|
|
|
|
|
| Dividends |
|
|
(3,926,741 |
) |
|
|
(4,701,855 |
) |
| Return of capital |
|
|
— |
|
|
|
(1,122,866 |
) |
| Decrease in net assets applicable to common shares from distributions
to common shareholders |
|
|
(3,926,741 |
) |
|
|
(5,824,721 |
) |
| CAPITAL SHARE TRANSACTIONS |
|
|
|
|
|
|
|
|
| Common shares: |
|
|
|
|
|
|
|
|
| Cost of shares repurchased and retired |
|
|
— |
|
|
|
(172,212 |
) |
| Net increase (decrease) in net assets applicable to common shares
from capital share transactions |
|
|
— |
|
|
|
(172,212 |
) |
| Net increase (decrease) in net assets applicable to common
shares |
|
|
496,845 |
|
|
|
(18,517,117 |
) |
| Net assets applicable to common shares at the beginning of the
period |
|
|
103,267,385 |
|
|
|
121,784,502 |
|
| Net assets applicable to common shares at the end of the
period |
|
$ |
103,764,230 |
|
|
$ |
103,267,385 |
|
See Notes to Financial Statements
48
Statement of Cash Flows
|
|
|
|
|
|
|
|
|
|
|
|
|
| June 30, 2023 (Unaudited) |
|
JGH |
|
|
NPCT(1) |
|
|
JLS |
|
| CASH FLOWS FROM OPERATING ACTIVITIES |
|
|
|
|
|
|
|
|
|
|
|
|
| Net Increase (Decrease) in Net Assets Applicable to Common Shares from Operations |
|
$ |
12,331,576 |
|
|
$ |
3,393,746 |
|
|
$ |
4,423,586 |
|
| Adjustments to reconcile the net increase (decrease) in net assets applicable to common shares from
operations to net cash provided by (used in) operating activities: |
|
|
|
|
|
|
|
|
|
|
|
|
| Purchases of investments |
|
|
(65,386,108 |
) |
|
|
(22,190,511 |
) |
|
|
(16,298,703 |
) |
| Proceeds from sales and maturities of investments |
|
|
71,071,044 |
|
|
|
33,188,690 |
|
|
|
19,880,506 |
|
| Proceeds from (Purchase of) short-term investments, net |
|
|
4,636,321 |
|
|
|
(5,354,980 |
) |
|
|
(1,229,712 |
) |
| Proceeds from (Purchases of) closed foreign currency spot contracts |
|
|
(88,113 |
) |
|
|
260,019 |
|
|
|
— |
|
| Premiums received (paid) for interest rate swaps |
|
|
— |
|
|
|
(165 |
) |
|
|
— |
|
| Amortization (Accretion) of premiums and discounts, net |
|
|
(304,472 |
) |
|
|
291,031 |
|
|
|
(149,530 |
) |
| Amortization of deferred offering costs |
|
|
— |
|
|
|
3,236 |
|
|
|
— |
|
| (Increase) Decrease in: |
|
|
|
|
|
|
|
|
|
|
|
|
| Receivable for dividends |
|
|
26,563 |
|
|
|
(27,255 |
) |
|
|
— |
|
| Receivable for interest |
|
|
(215,283 |
) |
|
|
522,424 |
|
|
|
(138,722 |
) |
| Receivable for investments sold |
|
|
625,580 |
|
|
|
— |
|
|
|
(860,440 |
) |
| Receivable for reclaims |
|
|
15,707 |
|
|
|
18,310 |
|
|
|
77 |
|
| Other assets |
|
|
34,324 |
|
|
|
15,592 |
|
|
|
(6,949 |
) |
| Increase (Decrease) in: |
|
|
|
|
|
|
|
|
|
|
|
|
| Payable for investments purchased – regular settlement |
|
|
— |
|
|
|
— |
|
|
|
1,001,000 |
|
| Payable for investments purchased – when-issued/delayed-delivery settlement |
|
|
(1,307,355 |
) |
|
|
— |
|
|
|
1,019,156 |
|
| Payable for unfunded senior loans |
|
|
(239,130 |
) |
|
|
— |
|
|
|
— |
|
| Payable for interest |
|
|
117,595 |
|
|
|
130,319 |
|
|
|
137,205 |
|
| Accrued custodian fees |
|
|
(33,082 |
) |
|
|
(10,790 |
) |
|
|
(4,946 |
) |
| Accrued investor relations |
|
|
193 |
|
|
|
369 |
|
|
|
595 |
|
| Accrued management fees |
|
|
(21,673 |
) |
|
|
(32,959 |
) |
|
|
(9,547 |
) |
| Accrued Trustees fees |
|
|
3,004 |
|
|
|
(14,884 |
) |
|
|
739 |
|
| Accrued professional fees |
|
|
26,391 |
|
|
|
8,875 |
|
|
|
3,832 |
|
| Accrued shareholder reporting expenses |
|
|
(4,112 |
) |
|
|
(3,612 |
) |
|
|
(2,879 |
) |
| Accrued shareholder servicing agent fees |
|
|
(153 |
) |
|
|
2,206 |
|
|
|
(10 |
) |
| Accrued other expenses |
|
|
(187 |
) |
|
|
10,892 |
|
|
|
2,971 |
|
| Net realized (gain) loss from investments |
|
|
10,189,012 |
|
|
|
25,713,620 |
|
|
|
593,883 |
|
| Net realized (gain) loss from Paydowns |
|
|
— |
|
|
|
(76,733 |
) |
|
|
67,564 |
|
| Change in net unrealized (appreciation) depreciation of investments |
|
|
(11,760,705 |
) |
|
|
(23,233,472 |
) |
|
|
(1,078,227 |
) |
| Change in net unrealized (appreciation) depreciation of Forward foreign currency |
|
|
— |
|
|
|
(194,515 |
) |
|
|
— |
|
| Change in net unrealized (appreciation) depreciation of
swaps |
|
|
(299,976 |
) |
|
|
840,035 |
|
|
|
— |
|
| Net cash provided by (used in) operating activities |
|
|
19,416,961 |
|
|
|
13,259,488 |
|
|
|
7,351,449 |
|
| CASH FLOWS FROM FINANCING ACTIVITIES |
|
|
|
|
|
|
|
|
|
|
|
|
| Proceeds from borrowings |
|
|
— |
|
|
|
— |
|
|
|
700,000 |
|
| (Repayments) of borrowings |
|
|
(8,000,000 |
) |
|
|
— |
|
|
|
(3,500,000 |
) |
| Proceeds from reverse repurchase agreements |
|
|
— |
|
|
|
91,640,000 |
|
|
|
62,050,000 |
|
| (Repayments of) reverse repurchase agreements |
|
|
— |
|
|
|
(91,640,000 |
) |
|
|
(62,750,000 |
) |
| (Payments for) deferred offering costs |
|
|
— |
|
|
|
(350,576 |
) |
|
|
— |
|
| Increase (Decrease) in: |
|
|
|
|
|
|
|
|
|
|
|
|
| Cash collateral due to broker |
|
|
364,614 |
|
|
|
380,000 |
|
|
|
— |
|
| Cash overdraft |
|
|
— |
|
|
|
— |
|
|
|
(575,583 |
) |
| Cash distributions paid to common shareholders |
|
|
(12,033,434 |
) |
|
|
(13,219,430 |
) |
|
|
(3,255,964 |
) |
| Net cash provided by (used in) financing activities |
|
|
(19,668,820 |
) |
|
|
(13,190,006 |
) |
|
|
(7,331,547 |
) |
| Net Increase (Decrease) in Cash and Cash Denominated in Foreign Currencies |
|
|
(251,859 |
) |
|
|
69,482 |
|
|
|
19,902 |
|
| Cash and cash denominated in foreign currencies at the beginning of
period |
|
|
359,979 |
|
|
|
452,991 |
|
|
|
— |
|
| Cash and cash denominated in foreign currencies at the end of
period |
|
$ |
108,120 |
|
|
$ |
522,473 |
|
|
$ |
19,902 |
|
| (1) Consolidated Statement of Cash Flows (as disclosed in Notes to Financial Statements). |
|
|
|
|
|
|
|
|
|
|
| The following table provides a reconciliation of cash and cash denominated in foreign currencies to the statement of assets and
liabilities: |
|
| Cash |
|
$ |
107,700 |
|
|
$ |
51,324 |
|
|
$ |
19,902 |
|
| Cash denominated in foreign currencies |
|
|
420 |
|
|
|
471,149 |
|
|
|
— |
|
| Total cash and cash denominated in foreign currencies |
|
$ |
108,120 |
|
|
$ |
522,473 |
|
|
$ |
19,902 |
|
|
|
|
|
| SUPPLEMENTAL DISCLOSURE OF CASH FLOW INFORMATION |
|
JGH |
|
|
NPCT |
|
|
JLS |
|
| Cash paid for interest (excluding borrowing and amortization of
offering costs) |
|
$ |
3,379,751 |
|
|
$ |
6,009,120 |
|
|
$ |
1,132,623 |
|
See Notes to Financial Statements
49
Financial Highlights
The following data is for a common share outstanding for each fiscal year end unless otherwise
noted:
|
|
|
|
|
|
|
|
|
|
|
|
|
|
|
|
|
|
|
|
|
|
|
|
|
|
|
|
|
|
|
|
|
|
|
|
|
|
|
|
|
|
|
|
|
|
|
|
|
|
| |
|
|
|
|
Investment Operations |
|
|
Less Distributions to
Common Shareholders |
|
|
Common Share |
|
| |
|
Beginning
Common
Share
Net Asset
Value |
|
|
Net
Investment
Income (NII)
(Loss)(a) |
|
|
Net
Realized/
Unrealized
Gain (Loss) |
|
|
Total |
|
|
From
NII |
|
|
From
Net Realized
Gains |
|
|
Return
of
Capital |
|
|
Total |
|
|
Discount Per
Share
Repurchased
and
Retired |
|
|
Ending
Net Asset
Value |
|
|
Ending
Share
Price |
|
|
| JGH |
|
| 6/30/23(f) |
|
$ |
12.79 |
|
|
$ |
0.40 |
|
|
$ |
0.13 |
|
|
$ |
0.53 |
|
|
$ |
(0.62 |
) |
|
$ |
— |
|
|
$ |
— |
|
|
$ |
(0.62 |
) |
|
$ |
— |
|
|
$ |
12.70 |
|
|
$ |
11.17 |
|
| 12/31/22 |
|
|
16.63 |
|
|
|
0.95 |
|
|
|
(3.43 |
) |
|
|
(2.48 |
) |
|
|
(0.99 |
) |
|
|
— |
|
|
|
(0.37 |
) |
|
|
(1.36 |
) |
|
|
— |
|
|
|
12.79 |
|
|
|
11.25 |
|
| 12/31/21 |
|
|
16.97 |
|
|
|
1.04 |
|
|
|
(0.08 |
) |
|
|
0.96 |
|
|
|
(0.98 |
) |
|
|
— |
|
|
|
(0.32 |
) |
|
|
(1.30 |
) |
|
|
— |
|
|
|
16.63 |
|
|
|
15.88 |
|
| 12/31/20 |
|
|
18.14 |
|
|
|
1.10 |
|
|
|
(1.16 |
) |
|
|
(0.06 |
) |
|
|
(1.07 |
) |
|
|
— |
|
|
|
(0.04 |
) |
|
|
(1.11 |
) |
|
|
— |
|
|
|
16.97 |
|
|
|
15.55 |
|
| 12/31/19 |
|
|
16.01 |
|
|
|
1.19 |
|
|
|
2.17 |
|
|
|
3.36 |
|
|
|
(1.20 |
) |
|
|
— |
|
|
|
(0.03 |
) |
|
|
(1.23 |
) |
|
|
— |
|
|
|
18.14 |
|
|
|
16.38 |
|
| 12/31/18 |
|
|
18.51 |
|
|
|
1.26 |
|
|
|
(2.42 |
) |
|
|
(1.16 |
) |
|
|
(1.27 |
) |
|
|
— |
|
|
|
(0.08 |
) |
|
|
(1.35 |
) |
|
|
0.01 |
|
|
|
16.01 |
|
|
|
13.65 |
|
|
| NPCT(d) |
|
| 6/30/23(f) |
|
|
12.27 |
|
|
|
0.21 |
|
|
|
(0.09 |
) |
|
|
0.12 |
|
|
|
(0.54 |
) |
|
|
— |
|
|
|
— |
|
|
|
(0.54 |
) |
|
|
— |
|
|
|
11.85 |
|
|
|
9.97 |
|
| 12/31/22 |
|
|
19.66 |
|
|
|
0.67 |
|
|
|
(6.83 |
) |
|
|
(6.16 |
) |
|
|
(0.78 |
) |
|
|
— |
|
|
|
(0.45 |
) |
|
|
(1.23 |
) |
|
|
— |
|
|
|
12.27 |
|
|
|
10.36 |
|
| 12/31/21(e) |
|
|
20.00 |
|
|
|
0.31 |
|
|
|
0.07 |
|
|
|
0.38 |
|
|
|
(0.36 |
) |
|
|
(0.03 |
) |
|
|
(0.33 |
) |
|
|
(0.72 |
) |
|
|
— |
|
|
|
19.66 |
|
|
|
18.30 |
|
|
|
|
|
|
| (a) |
|
|
|
Based on average shares outstanding. |
| (b) |
|
|
|
Percentage is not annualized. |
| (c) |
|
• |
|
Net Investment Income (Loss) ratios reflect income earned and expenses incurred on assets attributable to preferred shares and/or borrowings and/or reverse repurchase agreements (as described in Notes to Financial Statements), where
applicable. |
|
|
• |
|
Each ratio includes the effect of all interest expenses paid and other costs related to preferred shares and/or borrowings and/or reverse repurchase agreements, where applicable, as follows: |
|
|
|
|
|
|
Ratios of Interest Expense
to Average Net Assets Applicable
to Common Shares |
|
| JGH |
|
|
|
|
| 6/30/23(f) |
|
|
2.43 |
%(g) |
| 12/31/22 |
|
|
1.04 |
|
| 12/31/21 |
|
|
0.35 |
|
| 12/31/20 |
|
|
0.59 |
|
| 12/31/19 |
|
|
1.33 |
|
| 12/31/18 |
|
|
1.19 |
|
|
|
|
|
|
|
Ratios of Interest Expense
to Average Net Assets Applicable
to Common Shares |
|
| NPCT |
|
|
|
|
| 6/30/23(f) |
|
|
3.53 |
%(g) |
| 12/31/22 |
|
|
1.33 |
|
| 12/31/21(e) |
|
|
0.18 |
(g) |
50
|
|
|
|
|
|
|
|
|
|
|
|
|
|
|
|
|
|
|
|
|
|
|
| |
|
|
|
|
|
Common Share Supplemental Data/
Ratios Applicable to Common Shares |
|
Common Share
Total Returns |
|
|
|
|
|
Ratios to Average Net Assets |
|
|
|
|
| Based
on
Net Asset
Value(b) |
|
|
Based
on
Share
Price(b) |
|
|
Ending
Net Assets
(000) |
|
|
Expenses(c) |
|
|
Net
Investment
Income (Loss) |
|
|
Portfolio
Turnover
Rate |
|
|
|
|
|
|
|
| |
|
|
|
|
|
|
|
|
|
|
|
|
|
|
|
|
|
|
|
|
|
|
| |
4.21 |
% |
|
|
4.81 |
% |
|
$ |
294,433 |
|
|
|
3.79 |
%(g) |
|
|
6.32 |
%(g) |
|
|
16 |
% |
| |
(15.10 |
) |
|
|
(21.07 |
) |
|
|
296,494 |
|
|
|
2.43 |
|
|
|
6.82 |
|
|
|
26 |
|
| |
5.82 |
|
|
|
10.84 |
|
|
|
385,474 |
|
|
|
1.68 |
|
|
|
6.16 |
|
|
|
87 |
|
| |
0.39 |
|
|
|
2.88 |
|
|
|
393,299 |
|
|
|
1.87 |
|
|
|
6.94 |
|
|
|
35 |
|
| |
21.54 |
|
|
|
29.93 |
|
|
|
420,480 |
|
|
|
2.64 |
|
|
|
6.84 |
|
|
|
43 |
|
| |
(6.67 |
) |
|
|
(11.97 |
) |
|
|
371,082 |
|
|
|
2.51 |
|
|
|
7.10 |
|
|
|
61 |
|
|
|
|
|
|
|
| |
|
|
|
|
|
|
|
|
|
|
|
|
|
|
|
|
|
|
|
|
|
|
| |
0.89 |
|
|
|
1.27 |
|
|
|
340,641 |
|
|
|
5.20 |
(g) |
|
|
3.46 |
(g) |
|
|
4 |
|
| |
(31.89 |
) |
|
|
(37.45 |
) |
|
|
352,717 |
|
|
|
2.95 |
|
|
|
4.61 |
|
|
|
10 |
|
| |
1.90 |
|
|
|
(4.96 |
) |
|
|
565,276 |
|
|
|
1.47 |
(g) |
|
|
2.28 |
(g) |
|
|
17 |
|
| (d) |
Consolidated Financial Highlights (as disclosed in Notes to Financial Statements). |
| (e) |
For the period April 27, 2021 (commencement of operations) through December 31, 2021. |
See Notes to Financial Statements
51
Financial Highlights (continued)
The following data is for a common share outstanding for each fiscal year end unless otherwise
noted:
|
|
|
|
|
|
|
|
|
|
|
|
|
|
|
|
|
|
|
|
|
|
|
|
|
|
|
|
|
|
|
|
|
|
|
|
|
|
|
|
|
|
|
|
|
|
|
|
|
|
| |
|
|
|
|
Investment Operations |
|
|
Less Distributions to
Common Shareholders |
|
|
Common Share |
|
| |
|
Beginning
Common
Share
Net Asset
Value |
|
|
Net
Investment
Income (NII)
(Loss)(a) |
|
|
Net
Realized/
Unrealized
Gain (Loss) |
|
|
Total |
|
|
From
NII |
|
|
From
Net Realized
Gains |
|
|
Return
of
Capital |
|
|
Total |
|
|
Discount Per
Share
Repurchased
and
Retired |
|
|
Ending
Net Asset
Value |
|
|
Ending
Share
Price |
|
|
|
|
|
|
|
|
|
|
|
|
| JLS |
|
|
|
|
|
|
|
|
|
|
|
|
|
|
|
|
|
|
|
|
|
|
|
|
|
|
|
|
|
|
|
|
|
|
|
|
|
|
|
|
|
| 6/30/23(e) |
|
$ |
18.86 |
|
|
$ |
0.72 |
|
|
$ |
0.09 |
|
|
$ |
0.81 |
|
|
$ |
(0.72 |
) |
|
$ |
— |
|
|
$ |
— |
|
|
$ |
(0.72 |
) |
|
$ |
— |
|
|
$ |
18.95 |
|
|
$ |
16.12 |
|
| 12/31/22 |
|
|
22.19 |
|
|
|
1.12 |
|
|
|
(3.38 |
) |
|
|
(2.26 |
) |
|
|
(0.86 |
) |
|
|
— |
|
|
|
(0.20 |
) |
|
|
(1.06 |
) |
|
|
(0.01 |
) |
|
|
18.86 |
|
|
|
16.18 |
|
| 12/31/21 |
|
|
22.17 |
|
|
|
0.83 |
|
|
|
0.16 |
|
|
|
0.99 |
|
|
|
(0.85 |
) |
|
|
— |
|
|
|
(0.12 |
) |
|
|
(0.97 |
) |
|
|
— |
|
|
|
22.19 |
|
|
|
20.96 |
|
| 12/31/20 |
|
|
22.83 |
|
|
|
0.86 |
|
|
|
(0.55 |
) |
|
|
0.31 |
|
|
|
(0.73 |
) |
|
|
— |
|
|
|
(0.24 |
) |
|
|
(0.97 |
) |
|
|
— |
|
|
|
22.17 |
|
|
|
19.77 |
|
| 12/31/19 |
|
|
23.02 |
|
|
|
0.76 |
|
|
|
0.41 |
|
|
|
1.17 |
|
|
|
(0.92 |
) |
|
|
— |
|
|
|
(0.44 |
) |
|
|
(1.36 |
) |
|
|
— |
|
|
|
22.83 |
|
|
|
21.96 |
|
| 12/31/18 |
|
|
24.70 |
|
|
|
1.16 |
|
|
|
(0.76 |
) |
|
|
0.40 |
|
|
|
(1.52 |
) |
|
|
(0.49 |
) |
|
|
(0.07 |
) |
|
|
(2.08 |
) |
|
|
— |
|
|
|
23.02 |
|
|
|
22.35 |
|
|
|
|
|
|
| (a) |
|
|
|
Based on average shares outstanding. |
| (b) |
|
|
|
Percentageis not annualized. |
| (c) |
|
• |
|
Net Investment Income (Loss) ratios reflect income earned and expenses incurred on assets attributable to borrowings and/or reverse repurchase agreements (as described in Notes to Financial Statements), where applicable. |
|
|
• |
|
Each ratio includes the effect of all interest expenses paid and other costs related to borrowings and/or reverse repurchase agreements, where applicable, as follows: |
|
|
|
|
|
| Ratios of Interest Expense
to Average Net Assets Applicable
to Common Shares |
|
| JLS |
|
|
|
|
| 6/30/23(e) |
|
|
2.46 |
%(f) |
| 12/31/22 |
|
|
1.17 |
|
| 12/31/21 |
|
|
0.45 |
|
| 12/31/20 |
|
|
0.91 |
|
| 12/31/19 |
|
|
1.15 |
|
| 12/31/18 |
|
|
1.26 |
|
52
|
|
|
|
|
|
|
|
|
|
|
|
|
|
|
|
|
|
|
|
|
|
|
|
|
|
|
|
|
|
|
| |
|
|
|
|
|
Common Share Supplemental Data/ Ratios
Applicable to Common Shares |
|
Common Share
Total Returns |
|
|
|
|
|
Ratios to Average Net Assets
Before Reimbursement |
|
|
Ratios to Average Net Assets After
Reimbursement(d) |
|
|
|
|
| Based
on
Net Asset
Value(b) |
|
|
Based
on
Share
Price(b) |
|
|
Ending
Net Assets
(000) |
|
|
Expenses(c) |
|
|
Net
Investment
Income (Loss) |
|
|
Expenses(c) |
|
|
Net
Investment
Income (Loss) |
|
|
Portfolio
Turnover
Rate |
|
|
|
|
|
|
|
|
|
| |
|
|
|
|
|
|
|
|
|
|
|
|
|
|
|
|
|
|
|
|
|
|
|
|
|
|
|
|
|
|
| |
4.33 |
% |
|
|
4.11 |
% |
|
$ |
103,764 |
|
|
|
4.05 |
%(f) |
|
|
7.64 |
%(f) |
|
|
N/A |
|
|
|
N/A |
|
|
|
11 |
% |
| |
(10.30 |
) |
|
|
(17.88 |
) |
|
|
103,267 |
|
|
|
2.72 |
|
|
|
5.61 |
|
|
|
N/A |
|
|
|
N/A |
|
|
|
47 |
|
| |
4.47 |
|
|
|
11.02 |
|
|
|
121,785 |
|
|
|
1.87 |
|
|
|
3.69 |
|
|
|
N/A |
|
|
|
N/A |
|
|
|
73 |
|
| |
1.69 |
|
|
|
(5.36 |
) |
|
|
121,642 |
|
|
|
2.46 |
|
|
|
3.11 |
|
|
|
1.54 |
% |
|
|
4.04 |
% |
|
|
117 |
|
| |
5.16 |
|
|
|
4.27 |
|
|
|
125,253 |
|
|
|
2.72 |
|
|
|
3.08 |
|
|
|
2.53 |
|
|
|
3.26 |
|
|
|
100 |
|
| |
1.63 |
|
|
|
(1.06 |
) |
|
|
365,810 |
|
|
|
2.89 |
|
|
|
4.77 |
|
|
|
N/A |
|
|
|
N/A |
|
|
|
44 |
|
| (d) |
During the fiscal year ended December 31, 2019, the Adviser voluntarily reimbursed the Fund for certain expenses incurred
in connection with its restructuring. |
| N/A |
Fund did not have a contractual reimbursement with the Adviser. |
53
See Notes to Financial Statements
Financial Highlights (continued)
The following table sets forth information regarding each Fund’s outstanding senior
securities as of the end of each of the Fund’s last five fiscal periods, as applicable.
|
|
|
|
|
|
|
|
|
|
|
|
|
|
|
|
|
|
|
|
|
| |
|
Borrowings |
|
|
TFP Shares |
|
|
Borrowings,
and/or TFP
Shares |
|
| |
|
Aggregate
Amount
Outstanding
(000)(a) |
|
|
Asset
Coverage
Per $1,000
Share(b) |
|
|
Aggregate
Amount
Outstanding
(000)(a) |
|
|
Asset
Coverage
Per $1,000
Share(b) |
|
|
Asset
Coverage
Per $1
Liquidation
Preference |
|
|
|
|
|
|
|
| JGH |
|
|
|
|
|
|
|
|
|
|
|
|
|
|
|
|
|
|
|
|
| 6/30/23(c) |
|
$ |
119,000 |
|
|
$ |
3,474 |
|
|
$ |
— |
|
|
$ |
— |
|
|
$ |
— |
|
| 12/31/22 |
|
|
127,000 |
|
|
|
3,335 |
|
|
|
— |
|
|
|
— |
|
|
|
— |
|
| 12/31/21 |
|
|
159,000 |
|
|
|
3,424 |
|
|
|
— |
|
|
|
— |
|
|
|
— |
|
| 12/31/20 |
|
|
149,200 |
|
|
|
3,636 |
|
|
|
— |
|
|
|
— |
|
|
|
— |
|
| 12/31/19 |
|
|
175,200 |
|
|
|
3,400 |
|
|
|
— |
|
|
|
— |
|
|
|
— |
|
| 12/31/18 |
|
|
175,200 |
|
|
|
3,118 |
|
|
|
— |
|
|
|
— |
|
|
|
— |
|
|
|
|
|
|
|
| NPCT |
|
|
|
|
|
|
|
|
|
|
|
|
|
|
|
|
|
|
|
|
| 6/30/23(c) |
|
|
105,500 |
|
|
|
4,892 |
|
|
|
70,000 |
|
|
|
2,941 |
|
|
|
2.94 |
|
| 12/31/22 |
|
|
105,500 |
|
|
|
5,007 |
|
|
|
70,000 |
|
|
|
3,010 |
|
|
|
3.01 |
|
| 12/31/21(d) |
|
|
167,000 |
|
|
|
4,385 |
|
|
|
— |
|
|
|
— |
|
|
|
— |
|
|
|
|
|
|
|
| JLS |
|
|
|
|
|
|
|
|
|
|
|
|
|
|
|
|
|
|
|
|
| 6/30/23(c) |
|
|
9,695 |
|
|
|
11,703 |
|
|
|
— |
|
|
|
— |
|
|
|
— |
|
| 12/31/22 |
|
|
12,495 |
|
|
|
9,265 |
|
|
|
— |
|
|
|
— |
|
|
|
— |
|
| 12/31/21 |
|
|
8,455 |
|
|
|
15,404 |
|
|
|
— |
|
|
|
— |
|
|
|
— |
|
| 12/31/20 |
|
|
15,505 |
|
|
|
8,845 |
|
|
|
— |
|
|
|
— |
|
|
|
— |
|
| 12/31/19 |
|
|
— |
|
|
|
— |
|
|
|
— |
|
|
|
— |
|
|
|
— |
|
| 12/31/18 |
|
|
147,200 |
|
|
|
3,485 |
|
|
|
— |
|
|
|
— |
|
|
|
— |
|
| (a) |
Aggregate Amount Outstanding: Aggregate amount outstanding represents the principal amount or liquidation preference, if
applicable, as of the end of the relevant fiscal year. |
| (b) |
Asset Coverage Per $1,000: Asset coverage per $1,000 is calculated by subtracting the Fund’s liabilities and
indebtedness not represented by senior securities from the Fund’s total assets, dividing the result by the aggregate amount of the Fund’s senior securities representing indebtedness then outstanding (if applicable), plus the aggregate of
the involuntary liquidation preference of the outstanding preferred shares, if applicable, and multiplying the result by 1,000. |
| (d) |
For the period April 27, 2021 (commencement of operations) through December 31, 2021. |
54
Notes to Financial Statements
(Unaudited)
1. General Information
Fund Information: The funds covered in this
report and their corresponding New York Stock Exchange (“NYSE”) symbols are as follows (each a “Fund” and collectively, the “Funds”):
| |
• |
|
Nuveen Global High Income Fund (JGH) |
| |
• |
|
Nuveen Core Plus Impact Fund (NPCT) |
| |
• |
|
Nuveen Mortgage and Income Fund (JLS) |
The Funds are registered under the Investment Company Act of 1940 (the “1940 Act”), as amended, as diversified
closed-end management investment companies. JGH, NPCT and JLS were organized as Massachusetts business trusts on August 5, 2014, December 4, 2020 and September 10, 2009, respectively.
Current Fiscal Period: The end of the reporting period for the Funds is June 30, 2023, and the period covered by these Notes to Financial Statements is for the six
months ended June 30, 2023 (the “current fiscal period”).
Investment Adviser and Sub-Adviser: The Funds’ investment adviser is Nuveen Fund
Advisors, LLC (the “Adviser”), a subsidiary of Nuveen, LLC (“Nuveen”). Nuveen is the investment management arm of Teachers Insurance and Annuity Association of America (TIAA). The Adviser has overall responsibility for management
of the Funds, oversees the management of the Funds’ portfolio, manages the Funds’ business affairs and provides certain clerical, bookkeeping and other administrative services, and, if necessary, asset allocation decisions. The Adviser has
entered into a sub-advisory agreement with Nuveen Asset Management, LLC (“NAM”), a subsidiary of the Adviser and Teachers Advisors, LLC (“TAL”), an affiliate of the Adviser, (each a “Sub-Adviser” and collectively, the
“Sub-Advisers”). NAM manages the investment portfolios of JGH and NPCT, while TAL manages the investment portfolio of JLS.
Developments Regarding
JGH’s Control Share By-Law: On January 14, 2021, the Fund’s Board of Trustees (the “Board”) received a shareholder demand letter (the “Demand Letter”) from Saba Capital CEF Opportunities 1, Ltd. and Saba Capital
Management, L.P. (collectively, “Saba”) demanding that the Fund (i) rescind the Fund’s by-law provisions pursuant to which, in summary, a shareholder who obtains beneficial ownership of common shares in a Control Share Acquisition (as
defined in the by-laws) shall have the same voting rights as other common shareholders only to the extent authorized by the other disinterested shareholders (the “Control Share By-Law”) and (ii) commence judicial action against the
Board to ensure that the Control Share By-Law is withdrawn. Following review of the Demand Letter, the Board determined that it would not be in the best interests of the Fund or the Fund’s shareholders to take the actions requested in the
Demand Letter. Also on January 14, 2021, Saba filed a civil complaint in the U.S. District Court for the Southern District of New York (the “District Court”) against the Fund, certain other Nuveen funds and the Board, seeking a
declaration that the Control Share By-Law violates the 1940 Act, rescission of the Control Share By-Law and a permanent injunction against applying the Control Share By-Law. On February 18, 2022, the District Court granted judgment in favor of
Saba’s claim for rescission of the Control Share By-Law and Saba’s declaratory judgment claim, and declared that the Control Share By-Law violates Section 18(i) of the 1940 Act. Following review of the judgment of the District Court, on
February 22, 2022, the Trustees amended the Fund’s by-laws to provide that the Control Share By-Law shall be of no force and effect for so long as the judgment of the District Court is effective and that if the judgment of the District Court is
reversed, overturned, vacated, stayed, or otherwise nullified, the Control Share By-Law will be automatically reinstated and apply to any beneficial owner of common shares acquired in a Control Share Acquisition, regardless of whether such Control
Share Acquisition occurs before or after such reinstatement, for the duration of the stay or upon issuance of the mandate reversing, overturning, vacating or otherwise nullifying the judgment of the District Court. On February 25, 2022, the Board
and the Funds appealed the District Court’s decision to the U.S. Court of Appeals for the Second Circuit.
Developments Regarding NPCT’s and JLS’s
Control Share By-Law: On October 5, 2020, the Funds and certain other closed-end funds in the Nuveen fund complex amended their by-laws. Among other things, the amended bylaws included provisions pursuant to which, in summary, a shareholder who
obtains beneficial ownership of common shares in a Control Share Acquisition (as defined in the by-laws) shall have the same Control Share By-Law. On January 14, 2021, a shareholder of certain Nuveen closed-end funds filed a civil complaint in the
District Court against certain Nuveen funds and their trustees, seeking a declaration that such funds’ Control Share By-Laws violate the 1940 Act, rescission of such fund’s Control Share By-Laws and a permanent injunction against such
funds applying the Control Share By-Laws. On February 18, 2022, the District Court granted judgment in favor of the plaintiff’s claim for rescission of such funds’ Control Share By-Laws and the plaintiff’s declaratory judgment claim,
and declared that such funds’ Control Share By-Laws violate Section 18(i) of the 1940 Act. Following review of the judgment of the District Court, on February 22, 2022, the Board amended the Funds’ by-laws to provide that the Funds’
Control Share By-Law shall be of no force and effect for so long as the judgment of the District Court is effective and that if the judgment of the District Court is reversed, overturned, vacated, stayed, or otherwise nullified, the Funds’
Control Share By-Law will be
55
Notes to Financial Statements (continued)
(Unaudited)
automatically reinstated and apply to any beneficial owner of common shares acquired in a Control Share Acquisition, regardless of whether such Control Share Acquisition
occurs before or after such reinstatement, for the duration of the stay or upon issuance of the mandate reversing, overturning, vacating or otherwise nullifying the judgment of the District Court. On February 25, 2022, the Board and the Funds
appealed the District Court’s decision to the U.S. Court of Appeals for the Second Circuit.
Basis for Consolidation: NPCT is presented on a consolidated
basis with the Nuveen Core Plus Impact Fund Ltd. (the “Subsidiary”), a wholly-owned subsidiary of NPCT organized under the laws of the Cayman Islands. The Subsidiary commenced operations on April 27, 2021 and is intended to provide the
Fund with exposure to Regulation S fixed-income securities. Regulation S securities are securities of U.S. and non-U.S. issuers that are issued through private placement transactions with the SEC pursuant to Regulation S under the Securities Act of
1933, as amended. The Subsidiary is advised by the Adviser and has the same investment objective as NPCT, but unlike NPCT, it may invest in Regulation S securities without limitation. As of the end of the reporting period, the net assets of the
Subsidiary were $23,507,190 representing 7% of the Fund’s consolidated net assets. All inter-company transactions and balances have been eliminated.
Select
financial information related to the Subsidiary is as follows:
|
|
|
|
|
| |
|
NPCT |
|
| Total long-term investments at value |
|
$ |
23,160,710 |
|
| Net assets applicable to Common Shares |
|
|
23,507,190 |
|
| Net investment income (loss) |
|
|
305,080 |
|
| Net realized gain (loss) from investments and foreign currency |
|
|
— |
|
| Change in net unrealized appreciation (depreciation) from
investments and foreign currency |
|
|
1,320,093 |
|
2. Significant Accounting Policies
The
accompanying financial statements were prepared in accordance with accounting principles generally accepted in the United States of America (“U.S. GAAP”), which may require the use of estimates made by management and the evaluation of
subsequent events. Actual results may differ from those estimates. Each Fund is an investment company and follows the accounting guidance in the Financial Accounting Standards Board (“FASB”) Accounting Standards Codification 946, Financial
Services – Investment Companies. The net asset value (“NAV”) for financial reporting purposes may differ from the NAV for processing security and common share transactions. The NAV for financial reporting purposes includes security
and common share transactions through the date of the report. Total return is computed based on the NAV used for processing security and common share transactions. The following is a summary of the significant accounting policies consistently
followed by the Funds.
Compensation: The Funds pay no compensation directly to those of it’s officers, all of whom receive remuneration for their
services to the Funds from the Adviser or its affiliates. The Board has adopted a deferred compensation plan for independent trustees that enables trustees to elect to defer receipt of all or a portion of the annual compensation they are entitled to
receive from certain Nuveen-advised funds. Under the plan, deferred amounts are treated as though equal dollar amounts had been invested in shares of select Nuveen-advised funds.
Distributions to Common Shareholders: Distributions to common shareholders are recorded on the ex-dividend date. The amount, character and timing of distributions
are determined in accordance with federal income tax regulations, which may differ from U.S. GAAP.
Each Fund has implemented a level distribution program to provide
shareholders with stable, but not guaranteed, cash flow, independent of the amount or timing of income earned or capital gains realized by the Fund. Under this program, the Fund’s regular monthly distribution, in order to maintain its level
distribution amount, may include net investment income, return of capital and potentially capital gains for tax purposes. The amounts and sources of distributions are reported for financial reporting purposes and are not being provided for tax
reporting purposes. The actual amounts and character of the distributions for tax reporting purposes will be reported to shareholders on Form 1099-DIV which will be sent to shareholders shortly after calendar
year-end.
NPCT makes monthly cash distributions to common shareholders of a stated dollar amount per share. Subject to
approval and oversight by the Board, the Fund seeks to maintain a stable distribution level designed to deliver the long-term return potential of the Fund’s investment strategy through regular monthly distributions (a “Managed Distribution
Program”). Total distributions during a calendar year generally will be made from the Fund’s net investment income, net realized capital gains and net unrealized capital gains in the Fund’s portfolio, if any. The portion of
distributions paid attributed to net unrealized gains, if any, is distributed from the Fund’s assets and is treated by common shareholders as a nontaxable distribution (“return of capital”) for tax purposes. In the event that total
distributions during a calendar year exceed the Fund’s total return on NAV, the difference will reduce NAV per share. If the Fund’s total return on NAV exceeds total distributions during a calendar year, the excess will be reflected as an
increase in NAV per share. The amounts and sources of distributions reported for financial reporting purposes and are not being provided for tax reporting purposes. The actual amounts and character of the distributions for tax reporting purposes
will be reported to shareholders on Form 1099-DIV which will be sent to shareholders shortly after calendar year-end.
56
Foreign Currency Transactions and Translation:
To the extent that JGH and NPCT invests in securities and/or contracts that are denominated in a currency other than U.S. dollars, the Funds will be subject to currency risk, which is the risk that an increase in the U.S. dollar relative to the
foreign currency will reduce returns or portfolio value. Generally, when the U.S. dollar rises in value against a foreign currency, the Funds’ investments denominated in that currency will lose value because their currency is worth fewer
U.S. dollars; the opposite effect occurs if the U.S. dollar falls in relative value. Investments and other assets and liabilities denominated in foreign currencies are converted into U.S. dollars on a spot (i.e. cash) basis at the spot rate
prevailing in the foreign currency exchange market at the time of valuation. Purchases and sales of investments and income denominated in foreign currencies are translated into U.S. dollars on the respective dates of such transactions.
The books and records of the Funds are maintained in U.S. dollars. Assets, including investments, and liabilities denominated in foreign currencies are translated into
U.S. dollars at the end of each day. Purchases and sales of securities, income and expenses are translated into U.S. dollars at the prevailing exchange rate on the respective dates of the transactions.
Net realized foreign currency gains and losses resulting from changes in exchange rates associated with (i) foreign currency, (ii) investments and
(iii) derivatives include foreign currency gains and losses between trade date and settlement date of the transactions, foreign currency transactions, and the difference between the amounts of interest and dividends recorded on the books of the
Funds and the amounts actually received are recognized as a component of “Net realized gain (loss) from investments and foreign currency” on the Statement of Operations, when applicable.
The unrealized gains and losses resulting from changes in foreign currency exchange rates and changes in foreign exchange rates associated with (i) investments and
(ii) other assets and liabilities are recognized as a component of “Change in net unrealized appreciation (depreciation) of investments and foreign currency” on the Statement of Operations, when applicable. The unrealized gains and
losses resulting from changes in foreign exchange rates associated with investments in derivatives are recognized as a component of the respective derivative’s related “Change in net unrealized appreciation (depreciation)” on the
Statement of Operations, when applicable.
As of the end of the reporting period, the following Funds’ investments in non-U.S. securities were as follows:
|
|
|
|
|
|
|
|
|
| JGH |
|
Value |
|
|
% of Total
Investments |
|
| Country: |
|
|
|
|
|
|
|
|
| Canada |
|
$ |
23,414,922 |
|
|
|
5.7 |
% |
| Mexico |
|
|
13,478,585 |
|
|
|
3.3 |
|
| Colombia |
|
|
10,625,125 |
|
|
|
2.6 |
|
| Australia |
|
|
10,023,910 |
|
|
|
2.4 |
|
| United Kingdom |
|
|
8,178,366 |
|
|
|
2.0 |
|
| Luxembourg |
|
|
8,087,822 |
|
|
|
2.0 |
|
| Netherlands |
|
|
8,015,420 |
|
|
|
1.9 |
|
| Israel |
|
|
7,241,356 |
|
|
|
1.8 |
|
| France |
|
|
6,421,632 |
|
|
|
1.6 |
|
| South Africa |
|
|
5,900,111 |
|
|
|
1.4 |
|
| Other |
|
|
77,943,605 |
|
|
|
19.0 |
|
| Total non-U.S. securities |
|
$ |
179,330,854 |
|
|
|
43.7 |
% |
|
|
|
| NPCT |
|
|
|
|
|
|
| Country: |
|
|
|
|
|
|
|
|
| Italy |
|
$ |
23,925,577 |
|
|
|
4.3 |
% |
| Chile |
|
|
22,221,201 |
|
|
|
4.0 |
|
| United Kingdom |
|
|
20,718,016 |
|
|
|
3.7 |
|
| Mexico |
|
|
17,303,510 |
|
|
|
3.1 |
|
| Australia |
|
|
14,984,741 |
|
|
|
2.7 |
|
| Canada |
|
|
14,333,019 |
|
|
|
2.6 |
|
| Switzerland |
|
|
14,325,000 |
|
|
|
2.6 |
|
| Indonesia |
|
|
12,460,623 |
|
|
|
2.3 |
|
| India |
|
|
12,044,365 |
|
|
|
2.2 |
|
| South Korea |
|
|
8,509,746 |
|
|
|
1.5 |
|
| Other |
|
|
61,417,463 |
|
|
|
11.1 |
|
| Total non-U.S. securities |
|
$ |
222,243,261 |
|
|
|
40.1 |
% |
57
Notes to Financial Statements (continued)
(Unaudited)
Foreign taxes: The Funds may be subject to foreign taxes on income, gains on investments or currency repatriation, a portion of which may be recoverable. The Funds
will accrue such taxes and recoveries as applicable, based upon the current interpretation of tax rules and regulations that exist in the markets in which the Funds invest.
Indemnifications: Under the Funds’ organizational documents, their officers and trustees are indemnified against certain liabilities arising out of the
performance of their duties to the Funds. In addition, in the normal course of business, the Funds enter into contracts that provide general indemnifications to other parties. The Funds’ maximum exposure under these arrangements is unknown as
this would involve future claims that may be made against the Funds that have not yet occurred. However, the Funds have not had prior claims or losses pursuant to these contracts and expects the risk of loss to be remote.
Investments and Investment Income: Securities transactions are accounted for as of the trade date for financial reporting purposes. Trade date for senior and
subordinated loans purchased in the “primary market” is considered the date on which the loan allocations are determined. Trade date for senior and subordinated loans purchased in the “secondary market” is the date on which the
transaction is entered into. Realized gains and losses on securities transactions are based upon the specific identification method. Dividend income is recorded on the ex-dividend date, or for foreign securities, when information is available.
Non-cash dividends received in the form of stock, if any, are recognized on the ex-dividend date and recorded at fair value. Interest income, which is recorded on an accrual basis and includes accretion of discounts and amortization of premiums for
financial reporting purposes. Interest income also reflects payment-in-kind (“PIK”) interest, fee income, if any and paydown gains and losses, if any. PIK interest represents income received in the form of securities in lieu of cash. Fee
income consists primarily of amendment fees. Amendment fees are earned as compensation for evaluating and accepting changes to an original senior loan agreement and are recognized when received. Rehypothecation income is comprised of fees earned in
connection with the rehypothecation of pledged collateral as further described in Note 10 – Borrowing Arrangements and Reverse Repurchase Agreements.
Netting
Agreements: In the ordinary course of business, the Funds may enter into transactions subject to enforceable master repurchase agreements, International Swaps and Derivatives Association, Inc. (ISDA) master agreements or other similar
arrangements (“netting agreements”). Generally, the right to offset in netting agreements allows each Fund to offset certain securities and derivatives with a specific counterparty, when applicable, as well as any collateral received or
delivered to that counterparty based on the terms of the agreements. Generally, each Fund manages its cash collateral and securities collateral on a counterparty basis. With respect to certain counterparties, in accordance with the terms of the
netting agreements, collateral posted to the Funds is held in a segregated account by the Funds’ custodian and/or with respect to those amounts which can be sold or repledged, are presented in the Funds’ Portfolio of Investments or
Statements of Assets and Liabilities.
The Funds’ investments subject to netting agreements as of the end of the reporting period, if any, are further described
in later in these Notes to Financial.
New Accounting Pronouncement: In March 2020, FASB issued Accounting Standards Update (“ASU”) 2020-04,
Reference Rate Reform: Facilitation of the Effects of Reference Rate Reform on Financial Reporting. The main objective of the new guidance is to provide relief to companies that will be impacted by the expected change in benchmark interest rates,
when participating banks will no longer be required to submit London Interbank Offered Rate (LIBOR) quotes by the UK Financial Conduct Authority (FCA). The new guidance allows companies to, provided the only changes to existing contracts are a
change to an approved benchmark interest rate, account for modifications as a continuance of the existing contract without additional analysis. For new and existing contracts, the Funds may elect to apply the amendments as of March 12, 2020 through
December 31, 2022. In December 2022, FASB deferred ASU 2022-04 and issued ASU 2022-06, Reference Rate Reform: Deferral of the Sunset Date of Topic 848, which extends the application of the amendments through December 31, 2024. Management has not yet
elected to apply the amendments, is continuously evaluating the potential effect a discontinuation of LIBOR could have on the Funds’ investments and has currently determined that it is unlikely the ASU’s adoption will have a significant
impact on the Funds’ financial statements and various filings.
New Accounting Pronouncement: In June 2022, the FASB issued ASU 2022-03 to clarify the
guidance in Topic 820, Fair Value Measurement (“Topic 820”). The amendments in ASU 2022-03 affect all entities that have investments in equity securities measured at fair value that are subject to a contractual sale restriction. ASU
2022-03 (1) clarifies the guidance in Topic 820, when measuring the fair value of an equity security subject to contractual restrictions that prohibit the sale of an equity security, (2) amends a related illustrative example, and (3) introduces new
disclosure requirements for equity securities subject to contractual sale restrictions that are measured at fair value in accordance with Topic 820. For public business entities, the amendments in ASU 2022-03 are effective for fiscal years beginning
after December 15, 2023, and interim periods within those fiscal years. For all other entities, the amendments are effective for fiscal years beginning after December 15, 2024, and interim periods within those fiscal years. Early adoption is
permitted for both interim and annual financial statements that have not yet been issued or made available for issuance. Management is currently assessing the impact of these provisions on the Funds’ financial statements.
3. Investment Valuation and Fair Value Measurements
The Funds’
investments in securities are recorded at their estimated fair value utilizing valuation methods approved by the Adviser, subject to oversight of the Board. Fair value is defined as the price that would be received upon selling an investment or
transferring a liability in an orderly transaction to an
58
independent buyer in the principal or most
advantageous market for the investment. U.S. GAAP establishes the three-tier hierarchy which is used to maximize the use of observable market data and minimize the use of unobservable inputs and to establish classification of fair value measurements
for disclosure purposes. Observable inputs reflect the assumptions market participants would use in pricing the asset or liability. Observable inputs are based on market data obtained from sources independent of the reporting entity. Unobservable
inputs reflect management’s assumptions about the assumptions market participants would use in pricing the asset or liability. Unobservable inputs are based on the best information available in the circumstances. The following is a summary of
the three-tiered hierarchy of valuation input levels.
|
|
|
| Level 1 – |
|
Inputs are unadjusted and prices are determined using quoted prices in active markets for identical securities. |
| Level 2 – |
|
Prices are determined using other significant observable inputs (including quoted prices for similar securities, interest rates, credit spreads, etc.). |
| Level 3 – |
|
Prices are determined using significant unobservable inputs (including management’s assumptions in determining the fair value of investments). |
A description of the valuation techniques applied to the Funds’ major classifications of assets and liabilities measured at fair
value follows:
Equity securities and exchange-traded funds listed or traded on a national market or exchange are valued based on their last reported sales price or
official closing price of such market or exchange on the valuation date. Foreign equity securities and registered investment companies that trade on a foreign exchange are valued at the last reported sales price or official closing price on the
principal exchange where traded, and converted to U.S. dollars at the prevailing rates of exchange on the valuation date. For events affecting the value of foreign securities between the time when the exchange on which they are traded closes and the
time when the Funds’ net assets are calculated, such securities will be valued at fair value in accordance with procedures adopted by the Adviser, subject to the oversight of the Board. To the extent these securities are actively traded and no
valuation adjustments are applied, they are generally classified as Level 1. When valuation adjustments are applied to the most recent last sales price or official closing price, these securities are generally classified as Level 2.
Prices of fixed-income securities are generally provided by pricing services approved by the Adviser, which is subject to review by the Adviser and oversight of the
Board. Pricing services establish a security’s fair value using methods that may include consideration of the following: yields or prices of investments of comparable quality, type of issue, coupon, maturity and rating, market quotes or
indications of value from security dealers, evaluations of anticipated cash flows or collateral, general market conditions and other information and analysis, including the obligor’s credit characteristics considered relevant. In pricing
certain securities, particularly less liquid and lower quality securities, the pricing services may consider information about a security, its issuer or market activity provided by the Adviser. These securities are generally classified as
Level 2.
Repurchase agreements are valued at contract amount plus accrued interest, which approximates market value. These securities are generally classified
as Level 2.
Forward foreign currency contracts are valued using the prevailing forward exchange rate which is derived from quotes provided by the pricing
service using the procedures approved by the Adviser, subject to the oversight of the Board and are generally classified as Level 2.
Swap contracts are marked-to-market daily based upon a price supplied by a pricing service. Swaps are generally classified as Level 2.
For any portfolio security or derivative for which market quotations are not readily available or for which the Adviser deems the valuations derived using the valuation
procedures described above not to reflect fair value, the Adviser will determine a fair value in good faith using alternative procedures approved by the Adviser, subject to the oversight of the Board. As a general principle, the fair value of a
security is the amount that the owner might reasonably expect to receive for it in a current sale. A variety of factors may be considered in determining the fair value of such securities, which may include consideration of the following: yields or
prices of investments of comparable quality, type of issue, coupon, maturity and rating, market quotes or indications of value from security dealers, evaluations of anticipated cash flows or collateral, general market conditions and other
information and analysis, including the obligor’s credit characteristics considered relevant. To the extent the inputs are observable and timely, the values would be classified as Level 2; otherwise they would be classified as Level 3.
59
Notes to Financial Statements (continued)
(Unaudited)
The following table summarizes the market value of the Funds’ investments as of the end of the reporting period, based on the inputs used to value them:
|
|
|
|
|
|
|
|
|
|
|
|
|
|
|
|
|
| JGH |
|
Level 1 |
|
|
Level 2 |
|
|
Level 3 |
|
|
Total |
|
| Long-Term Investments: |
|
|
|
|
|
|
|
|
|
|
|
|
|
|
|
|
| Corporate Bonds |
|
$ |
— |
|
|
$ |
278,223,287 |
|
|
$ |
— |
|
|
$ |
278,223,287 |
|
| Sovereign Debt |
|
|
— |
|
|
|
43,190,488 |
|
|
|
— |
|
|
|
43,190,488 |
|
| $1,000 Par (or similar) Institutional Preferred |
|
|
— |
|
|
|
29,305,684 |
|
|
|
— |
|
|
|
29,305,684 |
|
| Variable Rate Senior Loan Interests |
|
|
— |
|
|
|
27,354,443 |
|
|
|
— |
|
|
|
27,354,443 |
|
| Contingent Capital Securities |
|
|
— |
|
|
|
15,659,699 |
|
|
|
— |
|
|
|
15,659,699 |
|
| $25 Par (or similar) Retail Preferred |
|
|
3,767,910 |
|
|
|
— |
|
|
|
— |
|
|
|
3,767,910 |
|
| Common Stocks |
|
|
— |
|
|
|
653,892 |
|
|
|
292 |
** |
|
|
654,184 |
|
| Asset-Backed Securities |
|
|
— |
|
|
|
636,712 |
|
|
|
— |
|
|
|
636,712 |
|
| Short-Term Investments: |
|
|
|
|
|
|
|
|
|
|
|
|
|
|
|
|
| Repurchase Agreements |
|
|
— |
|
|
|
11,658,833 |
|
|
|
— |
|
|
|
11,658,833 |
|
| Investments in Derivatives: |
|
|
|
|
|
|
|
|
|
|
|
|
|
|
|
|
| Interest Rate Swaps* |
|
|
— |
|
|
|
4,741,752 |
|
|
|
— |
|
|
|
4,741,752 |
|
| Total |
|
$ |
3,767,910 |
|
|
$ |
411,424,790 |
|
|
$ |
292 |
|
|
$ |
415,192,992 |
|
|
|
|
|
|
| NPCT |
|
Level 1 |
|
|
Level 2 |
|
|
Level 3 |
|
|
Total |
|
| Long-Term Investments: |
|
|
|
|
|
|
|
|
|
|
|
|
|
|
|
|
| Corporate Bonds |
|
$ |
— |
|
|
$ |
325,157,302 |
|
|
$ |
— |
|
|
$ |
325,157,302 |
|
| $1,000 Par (or similar) Institutional Preferred |
|
|
— |
|
|
|
76,712,919 |
|
|
|
— |
|
|
|
76,712,919 |
|
| Asset-Backed Securities |
|
|
— |
|
|
|
45,858,333 |
|
|
|
— |
|
|
|
45,858,333 |
|
| Mortgage-Backed Securities |
|
|
— |
|
|
|
34,833,933 |
|
|
|
— |
|
|
|
34,833,933 |
|
| Sovereign Debt |
|
|
— |
|
|
|
22,828,479 |
|
|
|
— |
|
|
|
22,828,479 |
|
| $25 Par (or similar) Retail Preferred |
|
|
20,764,182 |
|
|
|
— |
|
|
|
— |
|
|
|
20,764,182 |
|
| Municipal Bonds |
|
|
— |
|
|
|
11,589,406 |
|
|
|
— |
|
|
|
11,589,406 |
|
| Variable Rate Senior Loan Interests |
|
|
— |
|
|
|
10,373,458 |
|
|
|
— |
|
|
|
10,373,458 |
|
| Short-Term Investments: |
|
|
|
|
|
|
|
|
|
|
|
|
|
|
|
|
| Repurchase Agreements |
|
|
— |
|
|
|
6,198,251 |
|
|
|
— |
|
|
|
6,198,251 |
|
| Investments in Derivatives: |
|
|
|
|
|
|
|
|
|
|
|
|
|
|
|
|
| Forward Foreign Currency Contracts* |
|
|
— |
|
|
|
(29,071 |
) |
|
|
— |
|
|
|
(29,071 |
) |
| Cross Currency Swaps* |
|
|
— |
|
|
|
4,332,347 |
|
|
|
— |
|
|
|
4,332,347 |
|
| Total |
|
$ |
20,764,182 |
|
|
$ |
537,855,357 |
|
|
$ |
— |
|
|
$ |
558,619,539 |
|
|
|
|
|
|
| JLS |
|
Level 1 |
|
|
Level 2 |
|
|
Level 3 |
|
|
Total |
|
| Long-Term Investments: |
|
|
|
|
|
|
|
|
|
|
|
|
|
|
|
|
| Mortgage-Backed Securities |
|
$ |
— |
|
|
$ |
102,155,602 |
|
|
$ |
— |
|
|
$ |
102,155,602 |
|
| Asset-Backed Securities |
|
|
— |
|
|
|
41,075,293 |
|
|
|
147,601 |
** |
|
|
41,222,894 |
|
| Short-Term Investments: |
|
|
|
|
|
|
|
|
|
|
|
|
|
|
|
|
| U.S. Government And Agency Obligations |
|
|
— |
|
|
|
3,188,150 |
|
|
|
— |
|
|
|
3,188,150 |
|
| Total |
|
$ |
— |
|
|
$ |
146,419,045 |
|
|
$ |
147,601 |
|
|
$ |
146,566,646 |
|
| * |
Represents net unrealized appreciation (depreciation) as reported in the Fund’s Portfolio of Investments.
|
| ** |
Refer to the Fund’s Portfolio of Investments for securities classified as Level 3. |
The Funds hold liabilities in preferred shares, where applicable, which are not reflected in the tables above. The fair values of the Funds’ liabilities for
preferred shares approximate their liquidation preference. Preferred shares are generally classified as Level 2 and further described in Note 6 – Fund Shares.
4. Portfolio Securities
Unfunded Commitments for JGH and NPCT:
Pursuant to the terms of certain of the variable rate senior loan agreements, JGH and NPCT may have unfunded senior loan commitments. Each Fund will maintain with its custodian, cash, liquid securities and/or liquid senior loans having an aggregate
value at least equal to the amount of unfunded senior loan commitments. As of the end of the reporting period, JGH and NPCT had no such outstanding unfunded senior loan commitments.
Participation Commitments for JGH and NPCT: With respect to the senior loans held in JGH’s and NPCT’s portfolio, the Funds may: 1) invest in
assignments; 2) act as a participant in primary lending syndicates; or 3) invest in participations. If a Fund purchases a participation of a senior loan interest, the Fund would typically enter into a contractual agreement with the lender or
other third party selling the participation, rather than directly with the
60
borrower. As such, the Fund not only assumes the
credit risk of the borrower, but also that of the selling participant or other persons interpositioned between the Fund and the borrower. As of the end of the reporting period, JGH and NPCT had no such outstanding participation commitments.
Repurchase Agreements: In connection with transactions in repurchase agreements, it is the Funds’ policy that its custodian take possession of the underlying
collateral securities, the fair value of which exceeds the principal amount of the repurchase transaction, including accrued interest, at all times. If the counterparty defaults, and the fair value of the collateral declines, realization of the
collateral may be delayed or limited.
The following table presents the repurchase agreements for the Funds that are subject to netting agreements as of the end of
the reporting period, and the collateral delivered related to those repurchase agreements.
|
|
|
|
|
|
|
|
|
|
|
| Fund |
|
Counterparty |
|
Short-Term
Investments, at Value |
|
|
Collateral
Pledged (From)
Counterparty |
|
| JGH |
|
Fixed Income Clearing Corporation |
|
$ |
11,658,833 |
|
|
$ |
(11,892,160 |
) |
| NPCT |
|
Fixed Income Clearing Corporation |
|
|
6,198,251 |
|
|
|
(6,322,280 |
) |
Zero Coupon Securities: A zero coupon security does not pay a regular interest coupon to its holders during the life of the
security. Income to the holder of the security comes from accretion of the difference between the original purchase price of the security at issuance and the par value of the security at maturity and is effectively paid at maturity. The market
prices of zero coupon securities generally are more volatile than the market prices of securities that pay interest periodically.
Purchases and sales:
Long-term purchases and sales during the current fiscal period were as follows:
|
|
|
|
|
|
|
|
|
| Fund |
|
Purchases |
|
|
Sales and Maturities |
|
| JGH |
|
$ |
65,386,108 |
|
|
$ |
71,071,044 |
|
| NPCT |
|
|
22,190,511 |
|
|
|
33,188,690 |
|
| JLS |
|
|
16,298,703 |
|
|
|
19,880,506 |
|
The Funds may purchase securities on a when-issued or delayed-delivery basis. Securities purchased on a when-issued or delayed-delivery
basis may have extended settlement periods; interest income is not accrued until settlement date. Any securities so purchased are subject to market fluctuation during this period. The Funds have earmarked securities in their portfolio with a current
value at least equal to the amount of the when-issued/delayed-delivery purchase commitments. If a Fund has outstanding when-issued/delayed-delivery purchases commitments as of the end of the reporting period, such amounts are recognized on the
Statement of Assets and Liabilities.
5. Investments in Derivatives
Each
Fund is authorized to invest in certain derivative instruments. As defined by U.S. GAAP, a derivative is a financial instrument whose value is derived from an underlying security price, foreign exchange rate, interest rate, index of prices or rates,
or other variables.
Forward foreign currency contracts: During the current fiscal period, NPCT used forward contracts to hedge its exposure to Euro
denominated positions.
A forward contract is an agreement between two parties to purchase or sell a specified quantity of a currency at or before a specified date in
the future at a specified price. Non-deliverable forward foreign currency exchange contracts are settled with the counterparty in cash without the delivery of foreign currency. Forward contracts are typically traded in the OTC markets and all
details of the contract are negotiated between the counterparties to the agreement. Forward contracts are marked-to-market daily and any resulting unrealized gains or losses are reflected as appreciation or depreciation on the Statements of assets
and liabilities. The Funds realize gains and losses at the time the forward contracts are closed and are included on the Statement of operations. Risks may arise upon entering into forward contracts from unanticipated movements in the value of a
foreign currency relative to the U.S. dollar; and that losses may exceed amounts recognized on the Statements of assets and liabilities.
The average notional amount
of forward contracts outstanding during the current fiscal period was as follows:
|
|
|
|
|
| Fund |
|
Average notional amount of forward
contracts outstanding* |
|
| NPCT |
|
$ |
7,688,654 |
|
| * |
The average notional amount is calculated based on the outstanding notional amount of contracts at the beginning of the
current fiscal period and at the end of each fiscal quarter within the current fiscal period. |
61
Notes to Financial Statements (continued)
(Unaudited)
The following table presents the forward foreign currency contracts subject to netting agreements and the collateral delivered related to those forward foreign currency
contracts as of the end of the reporting period.
|
|
|
|
|
|
|
|
|
|
|
|
|
|
|
|
|
|
|
|
|
|
|
| Fund |
|
Counterparty |
|
Gross Unrealized
Appreciation on
Forward Foreign
Currency Contracts* |
|
|
Gross Unrealized
(Depreciation) on
Forward Foreign
Currency Contracts* |
|
|
Net Unrealized
Appreciation
(Depreciation) on
Forward Foreign
Currency Contracts |
|
|
Collateral
Pledged
to (from)
Counterparty |
|
|
Net
Exposure |
|
| NPCT |
|
Bank of America, N.A. |
|
$ |
— |
|
|
$ |
(29,071 |
) |
|
$ |
(29,071 |
) |
|
$ |
— |
|
|
$ |
(29,071 |
) |
| * |
Represents gross unrealized appreciation (depreciation) for the counterparty as reported in the Funds’ Portfolio of
Investments. |
Interest Rate Swap Contracts: A Fund may enter into a interest rate swap contract to gain or reduce exposure to interest rates,
to manage duration, the yield curve or interest rate risk. During the current fiscal period, JGH continued to utilize forward starting interest rate swap contracts to partially hedge its future interest cost of leverage, which is through the use of
bank borrowings.
Interest rate swap contracts involve the Fund’s agreement with the counterparty to pay or receive a fixed rate payment in exchange for the
counterparty receiving or paying a variable rate payment. Forward interest rate swap contracts involve the Fund’s agreement with a counterparty to pay, in the future, a fixed or variable rate payment in exchange for the counterparty paying the
Fund a variable or fixed rate payment, the accruals for which would begin at a specified date in the future (the “effective date”).
Upon entering into an
interest rate swap contract (and beginning on the effective date for a forward interest rate swap contract), the Fund accrues the fixed rate payment expected to be paid or received and the variable rate payment expected to be received or paid on the
interest rate swap contracts on a daily basis, and recognizes the daily change in the fair value of the Fund’s contractual rights and obligations under the contracts. The amount of the payment obligation for an interest rate swap is based on
the notional amount and the termination date of the contract. Interest rate swap contracts do not involve the delivery of securities or other underlying assets or principal. Accordingly, the risk of loss on such transactions is limited to the net
amount of interest payments that the Fund is to receive from the counterparty. Payments paid (received) at the beginning of the measurement period are reflected as swap premiums paid (received) on the Statement of Assets and Liabilities, when
applicable. Interest rate swaps can be settled either directly with the counterparty (“OTC”) or through a central clearinghouse (“centrally cleared”). For OTC swaps, the daily change in the market value of the swap contract,
along with any daily interest fees accrued, are recognized as unrealized appreciation (depreciation) on interest rate swaps on the Statement of Assets and Liabilities.
Upon the execution of a centrally cleared swap, a Fund is obligated to deposit cash or eligible securities, also known as “initial margin,” into an account at
its clearing broker equal to a specified percentage of the contract amount. Securities deposited for initial margin, if any, are identified in the Portfolio of Investments and cash deposited for initial margin, if any, is reflected on the Statement
of Assets and Liabilities. The Fund and the clearing broker are obligated to settle monies on a daily basis representing the changes in the value of the swap contracts. These daily cash settlements are known as “variation margin” and is
recognized on the Statement of Assets and Liabilities as a receivable or payable for variation margin on interest rate swaps.
Changes in the value of the swap
contracts during the fiscal period are recognized as net unrealized appreciation (depreciation) of swaps on the Statement of Operations. The net amount of periodic payments settled in cash are recognized as net realized gain (loss) from swaps on the
Statement of Operations, in addition to the net realized gain or loss recorded upon the termination of the swap contract.
The average notional amount of interest
rate swap contracts outstanding during the current fiscal period was as follows:
|
|
|
|
|
| Fund |
|
Average notional amount of Interest Rate Swap
contracts outstanding* |
|
| JGH |
|
$ |
87,400,000 |
|
| * |
The average notional amount is calculated based on the outstanding notional amount of contracts at the beginning of the
current fiscal period and at the end of each fiscal quarter within the current fiscal period. |
Cross Currency Swap Contracts: NPCT uses cross
currency swap contracts to gain or mitigate exposure to foreign exchange markets. A cross currency swap is an agreement between two parties to exchange two different currencies with the understanding that the exchange will be reversed at a later
date at specified exchange rates. During the current fiscal period, NPCT used cross currency swaps to hedge its Euro exposure to U.S. Dollars.
Risks may arise upon
entering into these contracts from the potential of default by counterparty and, depending on their terms, may be subject to foreign exchange risk.
62
Cross currency swap contracts are valued daily. Upon
entering into a cross currency swap contract the exchange of currencies takes place at the current spot rate. For an OTC Uncleared swap not cleared through a clearing house, the amount recorded on these transactions is recognized on the Statement of
Assets and Liabilities as a component of “Unrealized appreciation or deprecation on cross currency swaps.”
Upon the execution of an OTC Cleared swap, the
Fund is obligated to deposit cash or eligible securities, also known as “initial margin,” into an account at its clearing broker equal to a specified percentage of the contract amount. Cash held by the broker to cover initial margin
requirements on open swap contracts, if any, is recognized as “Cash collateral at brokers for investments in swaps” on the Statement of Assets and Liabilities. Investments in OTC Cleared swaps obligate a Fund and the clearing broker to
settle monies on a daily basis representing changes in the prior day’s “mark-to-market” of the swap. If a Fund has unrealized appreciation, the clearing broker would credit the Fund’s account with an amount equal to the
appreciation and conversely if a Fund has unrealized depreciation, the clearing broker will debit a Fund’s account with an amount equal to the depreciation. These daily cash settlements are also known as “variation margin.” Variation
margin for OTC Cleared swaps is recognized as a receivable and/or payable for “Variation margin on swap contracts” on the Statement of Assets and Liabilities. Upon the execution of an OTC Uncleared swap, neither the Fund nor the
counterparty is required to deposit initial margin as the trades are recorded bilaterally between both parties to the swap contract, and the terms of the variation margin are subject to a predetermined threshold negotiated by the Fund and the
counterparty. Variation margin for OTC Uncleared swaps is recognized as a component of “Unrealized appreciation or depreciation on cross currency swaps” as described in the preceding paragraph.
The average notional amount of cross currency swap contracts outstanding during the current fiscal period was as follows:
|
|
|
|
|
| Fund |
|
Average notional amount of Cross currency Swap
contracts outstanding* |
|
| NPCT |
|
$ |
36,453,095 |
|
| * |
The average notional amount is calculated based on the outstanding notional amount of contracts at the beginning of the
current fiscal period and at the end of each fiscal quarter within the current fiscal period. |
The following table presents the swap contracts
subject to netting agreements and the collateral delivered related to those swap contracts as of the end of the reporting period.
|
|
|
|
|
|
|
|
|
|
|
|
|
|
|
|
|
|
|
|
|
|
|
|
|
|
|
| Fund |
|
Counterparty |
|
Gross
Unrealized
Appreciation
on Swaps** |
|
|
Gross
Unrealized
(Depreciation)
on Swaps** |
|
|
Net
Unrealized
Appreciation
(Depreciation)
on Swaps** |
|
|
Swaps
Premiums
Paid
(Received) |
|
|
Collateral
Pledged
to (from)
Counterparty |
|
|
Net
Exposure |
|
| JGH |
|
Morgan Stanley Capital Services LLC |
|
$ |
4,741,752 |
|
|
$ |
— |
|
|
$ |
4,741,752 |
|
|
$ |
— |
|
|
$ |
(4,526,943 |
) |
|
$ |
214,809 |
|
| NPCT |
|
Citibank N.A. |
|
$ |
2,426,210 |
|
|
$ |
— |
|
|
$ |
2,426,210 |
|
|
$ |
46,738 |
|
|
$ |
(2,020,000 |
) |
|
$ |
452,948 |
|
|
|
J.P. Morgan Securities Inc. |
|
|
613,431 |
|
|
|
— |
|
|
|
613,431 |
|
|
|
(3,379 |
) |
|
|
— |
|
|
|
610,052 |
|
| |
|
Morgan Stanley Capital Services LLC |
|
|
1,292,706 |
|
|
|
— |
|
|
|
1,292,706 |
|
|
|
4,247 |
|
|
|
(1,277,122 |
) |
|
|
19,831 |
|
| |
|
|
|
$ |
4,332,347 |
|
|
$ |
— |
|
|
$ |
4,332,347 |
|
|
$ |
47,606 |
|
|
$ |
(3,297,122 |
) |
|
$ |
1,082,831 |
|
| ** |
Represents gross unrealized appreciation (depreciation) for the counterparty as reported in the Fund’s Portfolio of
Investments. |
Market and Counterparty Credit Risk: In the normal course of business each Fund may invest in financial instruments and enter
into financial transactions where risk of potential loss exists due to changes in the market (market risk) or failure of the other party to the transaction to perform (counterparty credit risk). The potential loss could exceed the value of the
financial assets recorded on the financial statements. Financial assets, which potentially expose each Fund to counterparty credit risk, consist principally of cash due from counterparties on forward, option and swap transactions, when applicable.
The extent of each Fund’s exposure to counterparty credit risk in respect to these financial assets approximates their carrying value as recorded on the Statement of Assets and Liabilities.
Each Fund helps manage counterparty credit risk by entering into agreements only with counterparties the Adviser believes have the financial resources to honor their
obligations and by having the Adviser monitor the financial stability of the counterparties. Additionally, counterparties may be required to pledge collateral daily (based on the daily valuation of the financial asset) on behalf of each Fund with a
value approximately equal to the Amount of any unrealized gain above a pre-determined threshold. Reciprocally, when each Fund has an unrealized loss, the Funds have instructed the custodian to pledge assets of the Funds as collateral with a value
approximately equal to the amount of the unrealized loss above a pre-determined threshold. Collateral pledges are monitored and subsequently adjusted if and when the valuations fluctuate, either up or down, by at least the predetermined threshold
amount.
63
Notes to Financial Statements (continued)
(Unaudited)
As of the end of the reporting period, the following Funds have invested in derivative contracts which are reflected in the Statements of assets and liabilities as
follows:
|
|
|
|
|
|
|
|
|
|
|
|
|
|
|
|
|
|
|
Derivative
Instrument |
|
Risk
Exposure |
|
Asset Derivatives |
|
|
|
|
|
Liability Derivatives |
|
| |
Location |
|
Value |
|
|
|
|
|
Location |
|
Value |
|
| JGH |
|
|
|
|
|
|
|
|
|
|
|
|
|
|
|
|
|
|
| Swap contracts |
|
Interest Rate |
|
— |
|
$ |
4,741,752 |
|
|
|
|
|
|
Unrealized depreciation on swap contracts* |
|
$ |
— |
|
| NPCT |
|
|
|
|
|
|
|
|
|
|
|
|
|
|
|
|
|
|
| Forward contracts |
|
Foreign currency exchange rate |
|
— |
|
|
— |
|
|
|
|
|
|
Unrealized depreciation on forward foreign currency contracts* |
|
$ |
(29,071 |
) |
| Swap contracts |
|
Foreign currency exchange rate |
|
Unrealized appreciation on swap contracts* |
|
$ |
4,332,347 |
|
|
|
|
|
|
— |
|
|
— |
|
| * |
Value represents the cumulative unrealized appreciation (depreciation) of cleared derivative contracts as reported in the
Fund’s Portfolio of Investments. The Statement of Assets and Liabilities only reflects the current day variation margin receivable/payable from/to brokers on open cleared derivative contracts. |
For the current fiscal period, the effect of derivative contracts on the Funds’ Statements of operations was as follows:
|
|
|
|
|
|
|
|
|
|
|
Derivative
Instrument |
|
Risk
Exposure |
|
Net Realized
Gain (Loss) |
|
|
Change in Net
Unrealized Appreciation
(Depreciation) |
|
| JGH |
|
|
|
|
|
|
|
|
|
|
| Swap Contracts |
|
Interest rate |
|
$ |
1,160,775 |
|
|
$ |
299,976 |
|
| NPCT |
|
|
|
|
|
|
|
|
|
|
| Forward contracts |
|
Foreign currency exchange rate |
|
|
(137,112 |
) |
|
|
194,515 |
|
| Swap Contracts |
|
Foreign currency exchange rate |
|
|
600,795 |
|
|
|
(840,035 |
) |
6. Fund Shares
Common Share
Transactions: Transactions in common shares during the Funds’ current and prior fiscal period, where applicable, were as follows:
|
|
|
|
|
|
|
|
|
| |
|
JLS |
|
| |
|
Six Months Ended
6/30/23 |
|
|
Year Ended
12/31/22 |
|
| Common shares: |
|
|
|
|
|
|
|
|
| Repurchased and retired |
|
|
— |
|
|
|
(10,814 |
) |
|
|
|
| Weighted average common share: |
|
|
|
|
|
|
|
|
| Price per share repurchased and retired |
|
$ |
— |
|
|
$ |
15.90 |
|
| Discount per share repurchased and retired |
|
|
— |
% |
|
|
(15.69 |
)% |
Preferred Shares
Taxable Fund Preferred
Shares: NPCT has issued and has outstanding Taxable Fund Preferred (“TFP”) Shares, with a $1,000 liquidation preference per share. These TFP Shares were issued via private placement and are not publicly available.
The Fund is obligated to redeem its TFP Shares by the date as specified in its offering documents (“Term Redemption Date”), unless earlier redeemed by the Fund.
TFP Shares are initially issued in a pre-specified mode, however, TFP Shares can be subsequently designated as an alternative mode at a later date at the discretion of the Funds. The modes within TFP Shares detail the dividend mechanics and are
described as follows. At a subsequent date, the Fund may establish additional mode structures with the TFP Share.
| |
• |
|
Variable Rate Mode (“VRM”) – Dividends for TFP Shares designated in this mode are based upon a short-term
index plus an additional fixed “spread” amount established at the time of issuance or renewal / conversion of its mode. At the end of the period of the mode, the Fund will be required to either extend the term of the mode, designate an
alternative mode or redeem the TFP Shares. The fair value of TFP Shares while in VRM are expected to approximate their liquidation preference so long as the fixed “spread” on the shares remains roughly in line with the “spread’
being demanded by investors on instruments having similar terms in the current market. In current market conditions, the Adviser has determined that the fair value of the shares are approximately their liquidation preference, but their fair value
could vary if market conditions change materially. |
64
| |
• |
|
Variable Rate Demand Mode (“VRDM”) – Dividends for TFP Shares designated in this mode will be established by
a remarketing agent; therefore, the market value of the TFP Shares is expected to approximate its liquidation preference. While in this mode, shares will have an unconditional liquidity feature that enable its shareholders to require a liquidity
provider, which each Fund has entered into a contractual agreement, to purchase shares in the event that the shares are not able to be successfully remarketed. In the event that shares within this mode are unable to be successfully remarketed and
are purchased by the liquidity provider, the dividend rate will be the maximum rate which is designed to escalate according to a specified schedule in order to enhance the remarketing agent’s ability to successfully remarket the shares. Each
Fund is required to redeem any shares that are still owned by a liquidity provider after six months of continuous, unsuccessful remarketing. The Fund will pay a liquidity and remarketing fee on the aggregate principal amount of all TFP Shares while
within VRDM. Payments made by the Funds to the liquidity provider and remarketing agent are recognized as “Liquidity fees” and “Remarketing fees”, respectively, on the Statement of Operations. |
For financial reporting purposes, the liquidation preference of TFP Shares is recorded as a liability and is recognized as a component of “Taxable Fund Preferred
(“TFP”) Shares, net of deferred offering costs” on the Statement of Assets and Liabilities. Dividends on the TFP shares are treated as interest payments for financial reporting purposes. Unpaid dividends on TFP shares are recognized
as a component on “Interest payable” on the Statement of Assets and Liabilities. Dividends accrued on TFP Shares are recognized as a component of “Interest expense and amortization of offering costs” on the Statement of
Operations.
Subject to certain conditions, TFP Shares may be redeemed, in whole or in part, at any time at the option of the Funds. Each Fund may also be required to
redeem certain TFP shares if the Fund fails to maintain certain asset coverage requirements and such failures are not cured by the applicable cure date. The redemption price per share in all circumstances is equal to the liquidation preference per
share plus any accumulated but unpaid dividends.
Cost incurred in connection with its offering of TFP Shares, were recorded as a deferred charge and are being
amortized over the life of the shares. These offering costs are recognized as a component of “Taxable Fund Preferred (“TFP”) Shares, net of deferred offering costs” on the Statement of Assets and Liabilities and “Interest
expense and amortization of offering costs” on the Statement of Operations.
As of the end of the reporting period, NPCT had $69,662,158 TFP Shares at
liquidation preference, net of deferred offering costs. Further details of the Fund’s TFP Shares outstanding as of the end of the reporting period, were as follows:
|
|
|
|
|
|
|
|
|
|
|
|
|
|
|
|
|
|
|
|
|
| Fund |
|
Series |
|
|
Shares
Outstanding |
|
|
Liquidation
Preference |
|
|
Term
Redemption Date |
|
|
Mode |
|
| NPCT |
|
|
A |
|
|
|
70,000 |
|
|
$ |
70,000,000 |
|
|
|
May 2, 2033 |
|
|
|
VRM |
|
The average liquidation preference of TFP Shares outstanding and the annualized dividend rate for the Fund during the current fiscal
period were as follows:
|
|
|
|
|
| |
|
NPCT |
|
| Average liquidation preference of TFP Shares outstanding |
|
$ |
70,000,000 |
|
| Annualized dividend rate |
|
|
5.83% |
|
Preferred Share Transactions: Transactions in preferred shares during the Fund’s current and prior fiscal period, where
applicable, are noted in the following table.
Transactions in TFP Shares for NPCT, where applicable, were as follows:
|
|
|
|
|
|
|
|
|
|
|
|
|
| |
|
Year Ended December 31, 2022 |
|
| NPCT |
|
Series |
|
|
Shares |
|
|
Amount |
|
| TFP Shares issued |
|
|
A |
|
|
|
70,000 |
|
|
$ |
70,000,000 |
|
7. Income Tax Information
Each Fund is a
separate taxpayer for federal income tax purposes. Each Fund intends to distribute substantially all of its net investment income and net capital gains to shareholders and otherwise comply with the requirements of Subchapter M of the Internal
Revenue Code applicable to regulated investment companies. Therefore, no federal income tax provision is required.
Each Fund files income tax returns in U.S. federal
and applicable state and local jurisdictions. A Fund’s federal income tax returns are generally subject to examination for a period of three fiscal years after being filed. State and local tax returns may be subject to examination for an
additional period of time depending on the jurisdiction. Management has analyzed each Fund’s tax positions taken for all open tax years and has concluded that no provision for income tax is required in the Fund’s financial statements.
65
Notes to Financial Statements (continued)
(Unaudited)
As of the end of the reporting period, the aggregate cost and the net unrealized appreciation/(depreciation) of all investments for federal income tax purposes were as
follows:
|
|
|
|
|
|
|
|
|
|
|
|
|
|
|
|
|
| Fund |
|
Tax Cost |
|
|
Gross Unrealized
Appreciation |
|
|
Gross Unrealized
(Depreciation) |
|
|
Net
Unrealized Appreciation
(Depreciation) |
|
| JGH |
|
$ |
464,842,665 |
|
|
$ |
6,964,995 |
|
|
$ |
(56,614,668 |
) |
|
$ |
(49,649,673 |
) |
| NPCT |
|
|
713,845,561 |
|
|
|
4,756,372 |
|
|
|
(159,934,788 |
) |
|
|
(155,178,416 |
) |
| JLS |
|
|
161,081,309 |
|
|
|
1,149,313 |
|
|
|
(15,663,976 |
) |
|
|
(14,514,663 |
) |
For purposes of this disclosure, tax cost generally includes the cost of portfolio investments as well as
up-front fees or premiums exchanged on derivatives and any amounts unrealized for income statement reporting but realized income and/or capital gains for tax reporting, if applicable.
As of prior fiscal period end, the components of accumulated earnings on a tax basis were as follows:
|
|
|
|
|
|
|
|
|
|
|
|
|
|
|
|
|
|
|
|
|
|
|
|
|
|
|
|
|
| Fund |
|
Undistributed
Ordinary
Income |
|
|
Undistributed
Long-Term
Capital Gains |
|
|
Unrealized
Appreciation
(Depreciation) |
|
|
Capital Loss
Carryforwards |
|
|
Late-Year Loss
Deferrals |
|
|
Other
Book-to-Tax
Differences |
|
|
Total |
|
| JGH |
|
$ |
— |
|
|
$ |
— |
|
|
$ |
(61,645,732 |
) |
|
$ |
(109,568,976 |
) |
|
$ |
(27,976 |
) |
|
$ |
(265,679 |
) |
|
$ |
(171,508,363 |
) |
| NPCT |
|
|
— |
|
|
|
— |
|
|
|
(176,905,851 |
) |
|
|
(22,607,013 |
) |
|
|
— |
|
|
|
(278,098 |
) |
|
|
(199,790,962 |
) |
| JLS |
|
|
— |
|
|
|
— |
|
|
|
(15,154,466 |
) |
|
|
(3,325,784 |
) |
|
|
— |
|
|
|
— |
|
|
|
(18,480,250 |
) |
As of prior fiscal period end, the Funds had capital loss carryforwards, which will not expire:
|
|
|
|
|
|
|
|
|
|
|
|
|
| Fund |
|
Short-Term |
|
|
Long-Term |
|
|
Total |
|
| JGH |
|
$ |
31,425,673 |
|
|
$ |
78,143,303 |
|
|
$ |
109,568,976 |
|
| NPCT |
|
|
12,925,288 |
|
|
|
9,681,725 |
|
|
|
22,607,013 |
|
| JLS |
|
|
1,738,923 |
|
|
|
1,586,861 |
|
|
|
3,325,784 |
|
8. Management Fees and Other Transactions with Affiliates
Management Fees: Each Fund’s management fee compensates the Adviser for overall investment advisory and administrative services and general office facilities.
The Sub-Advisers are compensated for its services to the Funds from the management fees paid to the Adviser.
Each Fund’s management fee consists of two
components – a fund-level fee, based only on the amount of assets within each individual Fund, and a complex-level fee, based on the aggregate amount of all eligible fund assets managed by the Adviser. This pricing structure enables Fund
shareholders to benefit from growth in the assets within their respective Fund as well as from growth in the amount of complex-wide assets managed by the Adviser.
The annual fund-level fee, payable monthly, for each Fund is calculated according to the following schedule:
|
|
|
|
|
|
|
|
|
| |
|
JGH |
|
|
NPCT |
|
| Average Daily Managed Assets |
|
Fund-Level Fee Rate |
|
|
Fund-Level Fee Rate |
|
| For the first $500 million |
|
|
0.7000 |
% |
|
|
0.8000 |
% |
| For the next $500 million |
|
|
0.6750 |
|
|
|
0.7750 |
|
| For the next $500 million |
|
|
0.6500 |
|
|
|
0.7500 |
|
| For the next $500 million |
|
|
0.6250 |
|
|
|
0.7250 |
|
| For managed assets over $2 billion |
|
|
0.6000 |
|
|
|
0.7000 |
|
|
|
|
|
|
| |
|
JLS |
|
| Average Daily Managed Assets1 |
|
Fund-Level Fee Rate |
|
| For the first $125 million |
|
|
0.8000 |
% |
| For the next $125 million |
|
|
0.7875 |
|
| For the next $150 million |
|
|
0.7750 |
|
| For the next $600 million |
|
|
0.7625 |
|
| For managed assets over $1 billion |
|
|
0.7500 |
|
66
The annual complex-level fee, payable monthly, for
each Fund is calculated by multiplying the current complex-wide fee rate, determined according to the following schedule by the Fund’s daily managed assets:
|
|
|
|
|
| Complex-Level Eligible Asset Breakpoint Level2 |
|
Effective Complex-Level Fee Rate at Breakpoint Level |
|
| $55 billion |
|
|
0.2000 |
% |
| $56 billion |
|
|
0.1996 |
|
| $57 billion |
|
|
0.1989 |
|
| $60 billion |
|
|
0.1961 |
|
| $63 billion |
|
|
0.1931 |
|
| $66 billion |
|
|
0.1900 |
|
| $71 billion |
|
|
0.1851 |
|
| $76 billion |
|
|
0.1806 |
|
| $80 billion |
|
|
0.1773 |
|
| $91 billion |
|
|
0.1691 |
|
| $125 billion |
|
|
0.1599 |
|
| $200 billion |
|
|
0.1505 |
|
| $250 billion |
|
|
0.1469 |
|
| $300 billion |
|
|
0.1445 |
|
| 1 |
“Managed assets” means the total assets of the Fund, minus the sum of its accrued liabilities (other than the
Fund liabilities incurred for the express purpose of creating effective leverage). Total assets for this purpose shall include assets attributable to the Fund’s use of effective leverage (whether or not those assets are reflected in the
Fund’s financial statements for the purposes of U.S. GAAP). |
| 2 |
For the complex-level fees, managed assets include closed-end fund assets managed by the Adviser that are attributable to
certain types of leverage. For these purposes, leverage includes the fund’s use of preferred stock and borrowings and certain investments in the residual interest certificates (also called inverse floating rate securities) in tender option bond
(TOB) trusts, including the portion of assets held by a TOB trust that has been effectively financed by the trust’s issuance of floating rate securities, subject to an agreement by the Adviser as to certain funds to limit the amount of such
assets for determining managed assets in certain circumstances. The complex-level fee is calculated based upon the aggregate daily managed assets of all Nuveen open-end and closed-end funds that constitute “eligible assets.” Eligible
assets do not include assets attributable to investments in other Nuveen funds or assets in excess of a determined amount (originally $2 billion) added to the Nuveen fund complex in connection with the Adviser’s assumption of the management of
the former First American Funds effective January 1, 2011, but do not include certain assets of certain Nuveen funds that were reorganized into funds advised by an affiliate of the Adviser during the 2019 calendar year. As of June 30, 2023, the
complex-level fee for each Fund was 0.1595%. |
9. Commitments and Contingencies
In the normal course of business, each Fund enters into a variety of agreements that may expose the Fund to some risk of loss. These could include certain agreements
related to preferred shares, which are each described elsewhere in these Notes to Financial Statements. The risk of future loss arising from such agreements, while not quantifiable, is expected to be remote. As of the end of the reporting period,
the Funds did not have any unfunded commitments.
From time to time, the Funds may be a party to certain legal proceedings in the ordinary course of business,
including proceedings relating to the enforcement of the Funds’ rights under contracts. As of the end of the reporting period, management has determined that any legal proceeding(s) the Funds are subject to, including those described within
this report, are unlikely to have a material impact to any of the Funds’ financial statements.
10. Borrowing Arrangements and Reverse Repurchase Agreements
Borrowings: JGH, NPCT and JLS have each entered into borrowing arrangement (“Borrowings”) as a means of leverage.
Borrowings Information for JGH: The Fund has entered into a 364-day revolving line of credit. As of the end of the
reporting period, the Fund’s maximum commitment amount under its Borrowings is as follows:
|
|
|
|
|
| |
|
JGH |
|
| Maximum commitment amount |
|
$ |
165,000,000 |
|
As of the end of the reporting period, the Fund’s outstanding balance on its Borrowings was as follows:
|
|
|
|
|
| |
|
JGH |
|
| Outstanding balance on Borrowings |
|
$ |
119,000,000 |
|
Interest is charged on the Borrowings drawn amount at a rate per annum equal to one-month Term SOFR (“Secured Overnight Financing
Rate”) plus 0.80%. The Fund also accrued a 0.15% per annum commitment fee based on the undrawn balance based on the maximum commitment amount of the Borrowings to the extent the unused portion of the Borrowings is less than 50% of the maximum
commitment amount otherwise the per annum commitment fee is 0.25%.
67
Notes to Financial Statements (continued)
(Unaudited)
During the Fund’s utilization period(s) during the current fiscal period, the average daily balance outstanding (which was for the entire current reporting period)
and average annual interest rate on the Fund’s Borrowings were as follows:
|
|
|
|
|
| |
|
JGH |
|
| Average daily balance outstanding |
|
$ |
122,845,304 |
|
| Average annual interest rate |
|
|
5.79 |
% |
Borrowings Information for NPCT: The Fund has entered into a committed financing agreement. As of the end of the reporting period,
the Fund’s maximum commitment amount under its Borrowings is as follows:
|
|
|
|
|
| |
|
NPCT |
|
| Maximum commitment amount |
|
$ |
110,000,000 |
|
As of the end of the reporting period, the Fund’s outstanding balance on its Borrowings was as follows:
|
|
|
|
|
| |
|
NPCT |
|
| Outstanding balance on Borrowings |
|
$ |
105,500,000 |
|
Interest is charged on these Borrowings at Fed Funds plus 0.70% per annum on the amount borrowed and accrues 0.25% per annum on the
undrawn balance if the undrawn portion of the Borrowings on a particular day is more than 10% of the maximum commitment amount and a one-time upfront fee of 0.05% (0.025% paid at closing of the Borrowings and
0.025% due at the one year anniversary) per annum of the maximum commitment amount.
During the Fund’s utilization period(s) during the current fiscal period,
the average daily balance outstanding (which was for the entire current reporting period) and average annual interest rate on the Fund’s Borrowings were as follows:
|
|
|
|
|
| |
|
NPCT |
|
| Average daily balance outstanding |
|
$ |
105,500,000 |
|
| Average annual interest rate |
|
|
5.49 |
% |
Borrowings Information for JLS
The Fund has
entered into a committed financing agreement. As of the end of the reporting period, the Fund’s maximum commitment amount under its Borrowings is as follows:
|
|
|
|
|
| |
|
JLS |
|
| Maximum commitment amount |
|
$ |
22,500,000 |
|
As of the end of the reporting period, the Fund’s outstanding balance on its Borrowings was as follows:
|
|
|
|
|
| |
|
JLS |
|
| Outstanding balance on Borrowings |
|
$ |
9,695,000 |
|
Interest is charged on these Borrowings at OBFR (“Overnight Bank Funding Rate”) plus 1.70% per annum on the amount borrowed and
0.50% per annum on the undrawn balance which was waived for the reporting period.
During the current fiscal period, the average daily balance outstanding (which was
for the entire current reporting period) and average annual interest rate on the Fund’s Borrowings were as follows:
|
|
|
|
|
| |
|
JLS |
|
| Average daily balance outstanding |
|
$ |
10,167,928 |
|
| Average annual interest rate |
|
|
6.44 |
% |
Other Borrowings Information for the Funds: In order to maintain their Borrowings, the Funds must meet certain collateral, asset
coverage and other requirements. Each Fund’s Borrowings outstanding is fully secured by eligible securities held in its portfolio of investments.
Each
Fund’s Borrowings outstanding is recognized as “Borrowings” on the Statement of Assets and Liabilities. Interest expense incurred on the borrowed amount, undrawn balance and initial fees are recognized as a component of “Interest
expense and amortization of offering costs” on the Statement of Operations.
68
Rehypothecation: JLS has entered into a
Rehypothecation Side Letter (“Side Letter”) with its prime brokerage lender, allowing it to re-register the Pledged Collateral in its own name or in a name other than the Fund’s to pledge,
repledge, hypothecate, rehyphothecate, sell, lend or otherwise transfer or use the Pledged Collateral (the “Hypothecated Securities”) with all rights of ownership as described in the Side Letter. Subject to certain conditions, the total
value of the outstanding Hypothecated Securities shall not exceed the lesser of (i) 98% of the outstanding balance on the Borrowings to which the Pledged Collateral relates and (ii) 331⁄3% of the Fund’s total assets. The Fund may designate any Pledged Collateral as ineligible for rehypothecation. The Fund may also recall Hypothecated Securities on demand.
The Fund also has the right to apply and set-off an amount equal to one-hundred percent
(100%) of the then-current fair market value of such Pledged Collateral against the current Borrowings under the Side Letter in the event that prime brokerage lender fails to timely return the Pledged Collateral and in certain other circumstances.
In such circumstances, however, the Fund may not be able to obtain replacement financing required to purchase replacement securities and, consequently, the Fund’s income generating potential may decrease. Even if the Fund is able to obtain
replacement financing, it might not be able to purchase replacement securities at favorable prices.
The Fund will receive a fee in connection with the Hypothecated
Securities (“Rehypothecation Fees”) in addition to any principal, interest, dividends and other distributions paid on the Hypothecated Securities.
As of
the end of the reporting period, the Fund did not hold any Hypothecated Securities.
Reverse Repurchase Agreements: During the current fiscal period, NPCT and
JLS used reverse repurchase agreements as a means of leverage.
The Fund may enter into a reverse repurchase agreement with brokers, dealers, banks or other financial
institutions that have been determined by the Adviser to be creditworthy. In a reverse repurchase agreement, a Fund sells to the counterparty a security that it holds with a contemporaneous agreement to repurchase the same security at an agreed-upon
price and date, reflecting the interest rate effective for the term of the agreement. It may also be viewed as the borrowing of money by the Fund. Cash received in exchange for securities delivered, plus accrued interest payments to be made by the
Fund to a counterparty, are reflected as a liability on the Statement of Assets and Liabilities. Interest payments made by the Fund to counterparties are recognized as a component of “Interest expense and amortization of offering costs” on
the Statement of Operations.
In a reverse repurchase agreement, the Fund retains the risk of loss associated with the sold security. Reverse repurchase agreements
also involve the risk that the purchaser fails to return the securities as agreed upon, files for bankruptcy or becomes insolvent. Upon a bankruptcy or insolvency of a counterparty, the Fund is considered to be an unsecured creditor with respect to
excess collateral and as such the return of excess collateral may be delayed.
As of the end of the reporting period, the Funds’ outstanding balances on its
reverse repurchase agreement were as follows:
NPCT
|
|
|
|
|
|
|
|
|
|
|
|
|
|
|
|
|
|
|
|
|
| Counterparty |
|
Coupon |
|
|
Principal
Amount |
|
|
Maturity |
|
|
Value |
|
|
Value and
Accrued Interest |
|
| TD Securities (USA), LLC |
|
|
5.74% |
|
|
$ |
(12,000,000 |
) |
|
|
7/24/23 |
|
|
$ |
(12,000,000 |
) |
|
$ |
(12,143,200) |
|
| Societe Generale |
|
|
5.75% |
|
|
|
(33,820,000 |
) |
|
|
9/5/23 |
|
|
|
(33,820,000 |
) |
|
|
(33,982,054) |
|
| |
|
|
|
|
|
$ |
(45,820,000 |
) |
|
|
|
|
|
$ |
(45,820,000 |
) |
|
$ |
(46,125,254) |
|
JLS
|
|
|
|
|
|
|
|
|
|
|
|
|
|
|
|
|
|
|
|
|
| Counterparty |
|
Coupon |
|
|
Principal
Amount |
|
|
Maturity |
|
|
Value |
|
|
Value and
Accrued Interest |
|
| Royal Bank of Canada |
|
|
6.44% |
|
|
$ |
(13,123,000 |
) |
|
|
7/14/23 |
|
|
$ |
(13,123,000 |
) |
|
$ |
(13,306,110 |
) |
| Societe Generale |
|
|
6.16% |
|
|
|
(17,552,000 |
) |
|
|
7/13/23 |
|
|
|
(17,552,000 |
) |
|
|
(17,789,175 |
) |
| TD Securities (USA), LLC |
|
|
5.60% |
|
|
|
(770,000 |
) |
|
|
On-Demand |
|
|
|
(770,000 |
) |
|
|
(783,923 |
) |
| |
|
|
|
|
|
$ |
(31,445,000 |
) |
|
|
|
|
|
$ |
(31,445,000 |
) |
|
$ |
(31,879,208 |
) |
During the Fund’s utilization period(s) during the current fiscal period, the average daily balance outstanding (which was for the
entire current reporting period) and average annual interest rate on the Funds’ reverse repurchase agreement were as follows:
|
|
|
|
|
|
|
|
|
| |
|
NPCT |
|
|
JLS |
|
| Average daily balance outstanding |
|
|
(45,820,000 |
) |
|
$ |
(31,839,475 |
) |
| Weighted average interest rate |
|
|
5.35% |
|
|
|
5.98% |
|
69
Notes to Financial Statements (continued)
(Unaudited)
The following table presents the reverse repurchase agreements subject to netting agreements and the collateral delivered related to those reverse repurchase agreements.
NPCT
|
|
|
|
|
|
|
|
|
| Counterparty |
|
Reverse
Repurchase Agreements* |
|
|
Collateral
Pledged to Counterparty |
|
| TD Securities (USA), LLC |
|
$ |
(12,143,200 |
) |
|
$ |
(15,959,088 |
) |
| Societe Generale |
|
|
(33,982,054 |
) |
|
|
(45,207,701 |
) |
JLS
|
|
|
|
|
|
|
|
|
| Counterparty |
|
Reverse
Repurchase Agreements* |
|
|
Collateral
Pledged to Counterparty |
|
| Royal Bank of Canada |
|
$ |
(13,306,110 |
) |
|
$ |
(20,558,268 |
) |
| Societe Generale |
|
|
(17,789,175 |
) |
|
|
(24,515,983 |
) |
| TD Securities (USA), LLC |
|
|
(783,923 |
) |
|
|
(843,935 |
) |
| * |
Represents gross value and accrued interest for the counterparty as reported in the preceding table.
|
11. Inter-Fund Lending
Inter-Fund Borrowing and
Lending: The SEC has granted an exemptive order permitting registered open-end and closed-end Nuveen funds to participate in an inter-fund lending facility whereby
the Nuveen funds may directly lend to and borrow money from each other for temporary purposes (e.g., to satisfy redemption requests or when a sale of securities “fails,” resulting in an unanticipated cash shortfall) (the “Inter-Fund
Program”). The closed-end Nuveen funds, including the Fund covered by this shareholder report, will participate only as lenders, and not as borrowers, in the Inter-Fund Program because such closed-end funds rarely, if ever, need to borrow cash to meet redemptions. The Inter-Fund Program is subject to a number of conditions, including, among other things, the requirements that (1) no fund may
borrow or lend money through the Inter-Fund Program unless it receives a more favorable interest rate than is typically available from a bank or other financial institution for a comparable transaction; (2) no fund may borrow on an unsecured
basis through the Inter-Fund Program unless the fund’s outstanding borrowings from all sources immediately after the inter-fund borrowing total 10% or less of its total assets; provided that if the borrowing fund has a secured borrowing
outstanding from any other lender, including but not limited to another fund, the inter-fund loan must be secured on at least an equal priority basis with at least an equivalent percentage of collateral to loan value; (3) if a fund’s total
outstanding borrowings immediately after an inter-fund borrowing would be greater than 10% of its total assets, the fund may borrow through the inter-fund loan on a secured basis only; (4) no fund may lend money if the loan would cause its
aggregate outstanding loans through the Inter-Fund Program to exceed 15% of its net assets at the time of the loan; (5) a fund’s inter-fund loans to any one fund shall not exceed 5% of the lending fund’s net assets; (6) the
duration of inter-fund loans will be limited to the time required to receive payment for securities sold, but in no event more than seven days; and (7) each inter-fund loan may be called on one business
day’s notice by a lending fund and may be repaid on any day by a borrowing fund. In addition, a Nuveen fund may participate in the Inter-Fund Program only if and to the extent that such participation is consistent with the fund’s
investment objective and investment policies. The Board is responsible for overseeing the Inter-Fund Program.
The limitations detailed above and the other conditions
of the SEC exemptive order permitting the Inter-Fund Program are designed to minimize the risks associated with Inter-Fund Program for both the lending fund and the borrowing fund. However, no borrowing or lending activity is without risk. When a
fund borrows money from another fund, there is a risk that the loan could be called on one day’s notice or not renewed, in which case the fund may have to borrow from a bank at a higher rate or take other actions to payoff such loan if an
inter-fund loan is not available from another fund. Any delay in repayment to a lending fund could result in a lost investment opportunity or additional borrowing costs.
During the current reporting period, none of the Funds covered by this shareholder report have entered into any inter-fund loan activity.
70
Risk Considerations (Unaudited)
Fund shares are not guaranteed or endorsed by any bank or other insured depository institution and
are not federally insured by the Federal Deposit Insurance Corporation.
Nuveen Global High Income Fund (JGH)
Investing in closed-end funds involves risk; principal loss is possible. There is no guarantee the Fund’s investment
objectives will be achieved. Closed-end fund shares may frequently trade at a discount or premium to their net asset value. Debt or fixed income securities such as those held by the Fund, are subject to
market risk, credit risk, interest rate risk, derivatives risk, liquidity risk, and income risk. As interest rates rise, bond prices fall. Lower credit debt securities may be more likely to fail to make timely interest or principal payments.
Foreign investments involve additional risks, including currency fluctuation, political and economic instability, lack of liquidity and differing legal and accounting standards. The risks of foreign investments are magnified in emerging
markets. Leverage increases return volatility and magnifies the Fund’s potential return and its risks; there is no guarantee a fund’s leverage strategy will be successful. These and other risk considerations such as call risk
are described in more detail on the Fund’s web page at www.nuveen.com/JGH.
Nuveen Core Plus Impact Fund (NPCT)
Investing in closed-end funds involves risk; principal loss is possible. There is no guarantee the Fund’s investment
objectives will be achieved. Closed-end fund shares may frequently trade at a discount or premium to their net asset value. Because the Impact Criteria and/or Nuveen’s Environmental Social
Governance (ESG) investment criteria may exclude investments of certain issuers for non-financial reasons, the Fund may forgo some market opportunities available to funds that do not use these criteria.
This may cause the Fund to underperform the market as a whole or other funds that do not use an Impact Criteria or ESG investment strategy or that use a different methodology or different factors to determine an investment’s impact and/or ESG
investment criteria. Issuers of debt instruments in which the Fund may invest may default on their obligations to pay principal or interest when due. Investments of below investment grade quality are regarded as having speculative
characteristics with respect to the issuer’s capacity to pay interest and repay principal, and may be subject to higher price volatility and default risk than investment grade investments of comparable terms and duration. Non-U.S. investments involve risks such as currency fluctuation, political and economic instability, lack of liquidity and differing legal and accounting standards. These risks are magnified in emerging
markets. The values of municipal securities held by the Fund may be adversely affected by local political and economic conditions and developments. Leverage increases return volatility and magnifies the Fund’s potential return
and its risks; there is no guarantee a fund’s leverage strategy will be successful. These and other risk considerations are described in more detail on the Fund’s web page at www.nuveen.com/NPCT.
Nuveen Mortgage and Income Fund (JLS)
Investing in closed-end funds involves risk; principal loss is possible. There is no guarantee the Fund’s investment objectives will be achieved. Closed-end fund shares may frequently
trade at a discount or premium to their net asset value. Investing in mortgage-backed securities entails credit risk, the risk that the servicer fails to perform its duties, liquidity risks, interest rate risks, structure risks, prepayment
risk, and geographical concentration risks. Investing in asset-backed securities entails credit risks inherent in the underlying collateral, the risk that the servicer fails to perform its duties, interest rate risk, liquidity risks and
prepayment risk. Leverage increases return volatility and magnifies the Fund’s potential return and its risks; there is no guarantee a fund’s leverage strategy will be successful. These and other risk considerations are described in
more detail on the Fund’s web page at www.nuveen.com/JLS.
71
Additional Fund Information (Unaudited)
|
|
|
|
|
|
|
|
|
|
|
| Board of Trustees |
|
|
|
|
|
|
|
|
|
|
| Jack B. Evans |
|
William C. Hunter |
|
Amy B. R. Lancellotta |
|
Joanne T. Medero |
|
Albin F. Moschner |
|
John K. Nelson |
| Matthew Thornton III |
|
Terence J. Toth |
|
Margaret L. Wolff |
|
Robert L. Young |
|
|
|
|
|
|
|
|
|
|
|
|
|
| |
|
|
|
|
| Investment Adviser
Nuveen Fund Advisors, LLC 333 West Wacker Drive
Chicago, IL 60606 |
|
Custodian State Street Bank
& Trust Company One Congress Street
Suite 1
Boston, MA 02114-2016 |
|
Legal Counsel
Chapman and Cutler LLP Chicago, IL 60603 |
|
Independent Registered
Public Accounting Firm
PricewaterhouseCoopers LLP
One North Wacker Drive Chicago, IL 60606 |
|
Transfer Agent and
Shareholder Services
Computershare Trust Company, N.A.
150 Royall Street Canton, MA 02021
(800) 257-8787 |
Portfolio of Investments Information
The Fund is required to
file its complete schedule of portfolio holdings with the Securities and Exchange Commission (SEC) for the first and third quarters of each fiscal year as an exhibit to its report on Form N-PORT. You may obtain this information on the SEC’s
website at http://www.sec.gov.
Nuveen Funds’ Proxy Voting Information
You may obtain
(i) information regarding how each fund voted proxies relating to portfolio securities held during the most recent twelve-month period ended June 30, without charge, upon request, by calling Nuveen toll-free at (800) 257-8787 or on
Nuveen’s website at www.nuveen.com and (ii) a description of the policies and procedures that each fund used to determine how to vote proxies relating to portfolio securities without charge, upon request, by calling Nuveen toll free at
(800) 257-8787. You may also obtain this information directly from the SEC. Visit the SEC on-line at http://www.sec.gov.
CEO Certification Disclosure
The Fund’s Chief Executive Officer (CEO) has submitted to the New York Stock Exchange (NYSE) the annual CEO certification as required by
Section 303A.12(a) of the NYSE Listed Company Manual. The Fund has filed with the SEC the certification of its CEO and Chief Financial Officer required by Section 302 of the Sarbanes-Oxley Act.
Common Share Repurchases
The Funds intends to repurchase,
through its open-market share repurchase program, shares of its own common stock at such times and in such amounts as is deemed advisable. During the period covered by this report, each Fund repurchased shares of its common stock, as shown in the
accompanying table. Any future repurchases will be reported to shareholders in the next annual or semi-annual report.
|
|
|
|
|
|
|
|
|
|
|
|
|
| |
|
JGH |
|
|
NPCT |
|
|
JLS |
|
| Common shares repurchased |
|
|
0 |
|
|
|
0 |
|
|
|
0 |
|
FINRA BrokerCheck
The
Financial Industry Regulatory Authority (FINRA) provides information regarding the disciplinary history of FINRA member firms and associated investment professionals. This information as well as an investor brochure describing FINRA BrokerCheck is
available to the public by calling the FINRA BrokerCheck Hotline number at (800) 289-9999 or by visiting www.FINRA.org.
72
Glossary of Terms Used in this Report
(Unaudited)
| ∎ |
|
19(a) Notice: Section 19(a) of the Investment Company Act of 1940 requires that the payment of any distribution
which is made from a source other than the fund’s net income be accompanied by a written notice that discloses the estimated sources of such payment. |
| ∎ |
|
Asset-Backed Securities (ABS): Securities whose value and income payments are derived from and collateralized by a
specific pool of underlying assets. The pool of assets typically is a group of small and/or illiquid assets that may be difficult to sell individually. The underlying pools of asset-backed securities often include payments from credit cards, auto
loans or mortgage loans. |
| ∎ |
|
Average Annual Total Return: This is a commonly used method to express an investment’s performance over a
particular, usually multi-year time period. It expresses the return that would have been necessary each year to equal the investment’s actual cumulative performance (including change in NAV or market price and reinvested dividends and capital
gains distributions, if any) over the time period being considered. |
| ∎ |
|
Commercial Mortgage-Backed Securities (CMBS): Commercial mortgage-backed securities are backed by cash flows of a
mortgage or pool of mortgages on commercial real estate. CMBS generally are structured to provide protection to the senior class investors against potential losses on the underlying mortgage loans. CMBS are typically characterized by the following:
i) loans on multifamily housing, non-residential property, ii) payments based on the amortization schedule of 25-30 years with a balloon payment due usually after 10 years, and iii) restrictions on prepayments. |
| ∎ |
|
Contingent Capital Securities (CoCos): CoCos are debt or capital securities of primarily non-U.S. issuers with loss
absorption contingency mechanisms built into the terms of the security, for example a mandatory conversion into common stock of the issuer, or a principal write-down, which if triggered would likely cause the CoCos investment to lose value. Loss
absorption mechanisms would become effective upon the occurrence of a specified contingency event, or at the discretion of a regulatory body. Specified contingency events, as identified in the CoCo’s governing documents, usually reference a
decline in the issuer’s capital below a specified threshold level, and/or certain regulatory events. A loss absorption contingency event for CoCos would likely be the result of, or related to, the deterioration of the issuer’s financial
condition and/or its status as a going concern. In such a case, with respect to CoCos that provide for conversion into common stock upon the occurrence of the contingency event, the market price of the issuer’s common stock received by the
Acquiring Fund will have likely declined, perhaps substantially, and may continue to decline after conversion. CoCos rated below investment grade should be considered high yield securities, or “junk,” but often are issued by entities whose
more senior securities are rated investment grade. CoCos are a relatively new type of security; and there is a risk that CoCo security issuers may suffer the sort of future financial distress that could materially increase the likelihood (or the
market’s perception of the likelihood) that an automatic write-down or conversion event on those issuers’ CoCos will occur. Additionally, the trading behavior of a given issuer’s CoCos may be strongly impacted by the trading behavior
of other issuers’ CoCos, such that negative information from an unrelated CoCo security may cause a decline in value of one or more CoCos held by the Fund. Accordingly, the trading behavior of CoCos may not follow the trading behavior of other
types of debt and preferred securities. Despite these concerns, the prospective reward vs. risk characteristics of at least certain CoCos may be very attractive relative to other fixed-income alternatives. |
| ∎ |
|
Duration: Duration is a measure of the expected period over which a bond’s principal and interest will be paid,
and consequently is a measure of the sensitivity of a bond’s or bond fund’s value to changes when market interest rates change. Generally, the longer a bond’s or fund’s duration, the more the price of the bond or fund will change
as interest rates change. |
| ∎ |
|
Effective Leverage: Effective leverage is a fund’s effective economic leverage, and includes both regulatory
leverage (see below) and the leverage effects of certain derivative investments in the fund’s portfolio. |
| ∎ |
|
Leverage: Leverage is created whenever a fund has investment exposure (both reward and/or risk) equivalent to more
than 100% of the investment capital. |
73
Glossary of Terms Used in this Report (continued)
(Unaudited)
| ∎ |
|
Mortgage-Backed Securities (MBS): Mortgage-backed securities (MBS) are bonds backed by pools of mortgages, usually
with similar characteristics, and which return principal and interest in each payment. MBS are composed of residential mortgages (RMBS) or commercial mortgages (CMBS). RMBS are further divided into agency RMBS and non-agency RMBS, depending on the
issuer. |
| ∎ |
|
Net Asset Value (NAV) Per Share: A fund’s Net Assets is equal to its total assets (securities, cash, accrued
earnings and receivables) less its total liabilities. NAV per share is equal to the fund’s Net Assets divided by its number of shares outstanding. |
| ∎ |
|
Regulatory Leverage: Regulatory leverage consists of preferred shares issued by or borrowings of a fund. Both of
these are part of a fund’s capital structure. Regulatory leverage is subject to asset coverage limits set in the Investment Company Act of 1940. |
| ∎ |
|
Residential Mortgage-Backed Securities (RMBS): Residential mortgage-backed securities are securities the payments on
which depend primarily on the cash flow from residential mortgage loans made to borrowers that are secured by residential real estate. RMBS consist of agency and non-agency RMBS. Agency RMBS have agency guarantees that assure investors that they
will receive timely payment of interest and principal, regardless of delinquency or default rates on the underlying loans. Agency RMBS include securities issued by the Government National Mortgage Association, the Federal National Mortgage
Association and the Federal Home Loan Mortgage Corporation, and other federal agencies, or issues guaranteed by them. Non-agency RMBS do not have agency guarantees. Non-agency RMBS have credit enhancement built into the structure to shield investors
from borrower delinquencies. The spectrum of non-agency residential mortgage loans includes traditional jumbo loans (prime), alternative-A loans (Alt-A), and home equity loans (subprime). |
74
Annual Investment Management Agreement Approval Process
(Unaudited)
At a meeting held on May 23-25, 2023 (the “May Meeting”), the Boards of Trustees (collectively, the
“Board” and each Trustee, a “Board Member”) of the Funds, which are comprised entirely of Board Members who are not “interested persons” (as defined under the Investment Company Act of 1940 (the
“1940 Act”)) (the “Independent Board Members”), approved, for their respective Fund, the renewal of the management agreement (each, an “Investment Management Agreement”) with Nuveen Fund Advisors,
LLC (the “Adviser”), pursuant to which the Adviser serves as the investment adviser to such Fund, and the sub-advisory agreement (each, a
“Sub-Advisory Agreement”) with (a) in the case of Nuveen Global High Income Fund (the “Global High Income Fund”) and Nuveen Core Plus Impact Fund (the
“Core Plus Impact Fund”), Nuveen Asset Management, LLC (“NAM”), pursuant to which NAM serves as the investment sub-adviser to each such Fund; and (b) in the case of
Nuveen Mortgage and Income Fund (the “Mortgage and Income Fund”), Teachers Advisors, LLC (“TAL,” and NAM and TAL are each, a “Sub-Adviser”), pursuant to which
TAL serves as the investment sub-adviser to such Fund, for an additional one-year term. Further, the Independent Board Members were aware that the Core Plus Impact Fund
may gain exposure to certain investments by investing in such Fund’s wholly-owned subsidiary organized under the laws of the Cayman Islands, which is advised by NAM for no separate fee. The review of services provided to the Core Plus Impact
Fund and such Fund’s management fees encompassed this arrangement. As the Board is comprised of all Independent Board Members, the references to the Board and the Independent Board Members are interchangeable.
Following up to an initial two-year period, the Board considers the renewal of each Investment Management Agreement and Sub-Advisory Agreement on behalf of the applicable Fund on an annual basis. The Investment Management Agreements and Sub-Advisory Agreements are collectively referred to as
the “Advisory Agreements,” and the Adviser and the Sub-Advisers are collectively, the “Fund Advisers” and each, a “Fund Adviser.”
The Independent Board Members considered the review of the advisory agreements for the Nuveen funds to be an ongoing process and employed the accumulated information,
knowledge and experience the Board Members had gained during their tenure on the boards governing the Nuveen funds and working with the Adviser and the applicable sub-advisers in their annual review of the
advisory agreements. Throughout the year, the Board and its committees meet regularly and, at these meetings, receive regular and/or special reports that cover an extensive array of topics and information that are relevant to the Board’s annual
consideration of the renewal of the advisory agreements for the Nuveen funds. Such information may address, among other things, fund performance and risk information; the Adviser’s strategic plans; product initiatives for various funds; the
review of the funds and investment teams; compliance, regulatory and risk management matters; the trading practices of the various sub-advisers to the Nuveen funds; management of distributions; valuation of
securities; fund expenses; securities lending; liquidity management; overall market and regulatory developments; and with respect to closed-end funds, capital management initiatives, institutional ownership,
management of leverage financing and the secondary market trading of the closed-end funds and any actions to address discounts. The Board also seeks to meet periodically with the Nuveen funds’ sub-advisers and/or portfolio teams, when feasible. The presentations, discussions, and meetings throughout the year also provide a means for the Board to evaluate the level, breadth and quality of services provided
by the Adviser and how such services have changed over time in light of new or modified regulatory requirements, changes to market conditions or other factors.
In
connection with its annual consideration of the advisory agreements for the Nuveen funds, the Board, through its independent legal counsel, requested and received extensive materials and information prepared specifically for its review of such
advisory agreements by the Adviser and by Broadridge Financial Solutions, Inc. (“Broadridge”), an independent provider of investment company data. The materials cover a wide range of topics including, but not limited to, a
description of the nature, extent and quality of services provided by the Fund Advisers; a review of product actions advanced in 2022 for the benefit of particular Nuveen funds and/or the Nuveen fund complex; a review of each sub-adviser to the Nuveen funds and/or the applicable investment team; an analysis of fund performance with a focus on any Nuveen funds considered performance outliers; an analysis of the fees and expense ratios of
the Nuveen funds with a focus on any Nuveen funds considered expense outliers; a review of management fee schedules; a description of portfolio manager compensation; an overview of the secondary market trading of shares of the Nuveen closed-end funds (including, among other things, an analysis of secondary market performance and
75
Annual Investment Management Agreement Approval Process (continued)
(Unaudited)
commentary regarding the leverage management, share repurchase and shelf offering programs of Nuveen closed-end funds); a
description of the profitability or financial data of Nuveen and the sub-advisers to the Nuveen funds; and a description of indirect benefits received by the Adviser and the
sub-advisers as a result of their relationships with the Nuveen funds. The information prepared specifically for the annual review supplemented the information provided to the Board and its committees and the
evaluations of the Nuveen funds by the Board and its committees during the year. The Board’s review of the advisory agreements for the Nuveen funds is based on all the information provided to the Board and its committees throughout the year as
well as the information prepared specifically with respect to the annual review of such advisory agreements. The performance, fee and expense data and other information provided by a Fund Adviser, Broadridge or other service providers were not
independently verified by the Independent Board Members.
As part of its review, the Board met on April 11-12, 2023 (the
“April Meeting”) to review and discuss, in part, the performance of the Nuveen funds and the Adviser’s evaluation of each sub-adviser to the Nuveen funds and/or its investment teams. At
the April Meeting, the Board Members asked questions and requested additional information that was provided for the May Meeting.
The Independent Board Members were
advised by independent legal counsel during the annual review process as well as throughout the year, including meeting in executive sessions with such counsel at which no representatives from the Adviser or the
Sub-Advisers were present. In connection with their annual review, the Independent Board Members also received a memorandum from independent legal counsel outlining their fiduciary duties and legal standards
in reviewing the Advisory Agreements, including guidance from court cases evaluating advisory fees.
The Board’s decision to renew the Advisory Agreements was
not based on a single identified factor, but rather the decision reflected the comprehensive consideration of all the information provided to the Board and its committees throughout the year as well as the materials prepared specifically in
connection with the renewal process. The contractual arrangements are a result of multiple years of review, negotiation and information provided in connection with the Board’s annual review of the Nuveen funds’ advisory arrangements and
oversight of the Nuveen funds. Each Board Member may have attributed different levels of importance to the various factors and information considered in connection with the approval process and may place different emphasis on the relevant
information year to year in light of, among other things, changing market and economic conditions. A summary of the principal factors and information, but not all the factors, the Board considered in deciding to renew the Advisory Agreements is set
forth below.
| A. |
|
Nature, Extent and Quality of Services |
In evaluating the renewal of the Advisory Agreements, the
Independent Board Members received and considered information regarding the nature, extent and quality of the applicable Fund Adviser’s services provided to the respective Fund with particular focus on the services and enhancements or changes
to such services provided during the last year. The Independent Board Members considered the Investment Management Agreements and the Sub-Advisory Agreements separately in the course of their review. With this
approach, they considered the respective roles of the Adviser and the Sub-Advisers in providing services to the applicable Fund(s).
The Board recognized that the Adviser provides a wide array of management, oversight and administrative services to manage and operate the Nuveen funds
and that the scope and complexity of these services, along with the undertakings required of the Adviser in connection with providing these services, have expanded over time as a result of, among other things, regulatory, market and other
developments. The Board noted the Adviser’s dedication of resources, time, personnel and capital and commitment to continuing to develop improvements and innovations that seek to enhance the Nuveen fund complex and meet the needs of the Nuveen
funds in an increasingly complex regulatory environment. The Board received and reviewed information regarding, among other things, the Adviser’s investment oversight responsibilities, regulatory and compliance services, administrative duties
and other services.
The Board considered the breadth and the quality of the services the Adviser and its various teams provide in overseeing the
investment management of the Nuveen funds, including, among other things, overseeing and reviewing the services provided by the various sub-advisers to the Nuveen funds and their investment teams; evaluating
fund performance and market conditions; overseeing operational and investment risks; evaluating investment strategies and recommending any
76
changes thereto; managing liquidity;
managing the daily valuation of portfolio securities; overseeing trade execution and securities lending; and setting and managing distributions consistent with the respective fund’s product design. With respect to
closed-end funds, such services also include managing leverage; monitoring asset coverage levels for leveraged funds and compliance with rating agency criteria; providing capital management and secondary
market services (such as implementing common share shelf offerings, capital return programs and common share repurchases); and maintaining a closed-end fund investor relations program. The Board also reviewed
the structure of investment personnel compensation of each Fund Adviser and considered whether the structure provides appropriate incentives to attract and maintain qualified personnel and to act in the best interests of the respective Nuveen fund.
Given the Nuveen funds operate in a highly regulated industry, the Board further considered the extensive compliance, regulatory and administrative
services the Adviser and its various teams provide to manage and operate the Nuveen funds. The Board recognized such services included, but were not limited to, managing compliance policies; monitoring compliance with applicable policies, laws and
regulations; devising internal compliance programs in seeking to enhance compliance with regulatory requirements and creating a framework to review and assess compliance programs; overseeing sub-adviser
compliance testing; preparing compliance training materials; and responding to regulatory requests. The Board reviewed highlights of the various initiatives Nuveen compliance had taken in 2022 including, among other things, additional due diligence
of service providers as their operating environments evolve post-Covid to more hybrid in-person working arrangements; investments in supporting and expanding international trading capabilities; continuing
efforts to enhance policies and controls to address compliance risks including those related to environmental, social and governance (“ESG”) matters and new regulatory developments or guidance; and establishing and maintaining
compliance policies and comprehensive compliance training programs. The Board also considered information regarding the Adviser’s business continuity, disaster recovery and information security programs and the periodic testing and review of
such programs.
In addition to the above functions, the Board considered the quality and extent of other
non-advisory services the Adviser provides including, among other things, various fund administration services (such as preparing, overseeing or assisting with the preparation of tax and regulatory filings);
product management services (such as evaluating and enhancing products and strategies); legal support services; shareholder services and transfer agency function oversight services; and board
support and reporting services. With respect to board support services, the Board reviewed a summary of the annual, quarterly, and special reports the Adviser and/or its affiliates provided to the Board throughout 2022.
The Board further acknowledged various initiatives the Adviser had undertaken or continued in 2022 in seeking to improve the effectiveness of its
organization, the Nuveen funds product line-up as well as particular Nuveen fund(s) through, among other things, rationalizing the product line and gaining efficiencies through mergers, repositionings and
liquidations; launching new funds; reviewing and updating investment policies and benchmarks; reopening certain funds previously closed to new investors; adding or modifying the share classes offered by certain funds; implementing fee waivers and
expense cap changes for certain funds and evaluating and adjusting portfolio management teams as appropriate for various funds; and developing policy positions on a broad range of regulatory proposals that may impact the funds and communicating with
lawmakers and other regulatory authorities to help ensure these positions are represented.
Aside from the services provided, the Board recognized
the financial resources of the Adviser and its affiliates and their willingness to make investments in the technology, personnel and infrastructure to support the Nuveen funds, including maintaining a seed capital budget to support new or existing
funds and/or facilitate changes for a respective fund. The Board noted the benefits to shareholders of investing in a fund that is a part of a large fund complex with a variety of investment disciplines, capabilities, expertise and resources
available to navigate and support the Nuveen funds including during stressed times. The Board recognized the overall reputation and capabilities of the Adviser and its affiliates, the Adviser’s continuing commitment to provide high quality
services, its willingness to implement operational or organizational changes in seeking, among other things, to enhance efficiencies and services to the Nuveen funds and its responsiveness to the Board’s questions and/or concerns raised
throughout the year and during the annual review of advisory agreements. The Board also considered the significant risks borne by the Adviser and its affiliates in connection with their services to the Nuveen funds, including entrepreneurial risks
in sponsoring new funds and ongoing risks with managing the funds such as investment, operational, reputational, regulatory, compliance and litigation risks.
77
Annual Investment Management Agreement Approval Process (continued)
(Unaudited)
The Board further considered the division of responsibilities between the Adviser and the Sub-Advisers and
recognized that each Sub-Adviser and its investment personnel generally are responsible for the management of each applicable Fund’s portfolio under the oversight of the Adviser and the Board. The Board
considered an analysis of each Sub-Adviser provided by the Adviser which included, among other things, the assets under management of the applicable investment team and changes thereto, a summary of the
applicable investment team and changes to such team, the investment process and philosophy of the applicable investment team, the performance of the Nuveen funds sub-advised by the Sub-Adviser over various periods of time and a summary of any significant policy and/or other changes to the Nuveen funds sub-advised by the
Sub-Adviser. The Board further considered at the May Meeting or prior meetings evaluations of each Sub-Adviser’s compliance programs and trade execution. The Board
noted that the Adviser recommended the renewal of the Sub-Advisory Agreements.
Based on its review, the
Board determined, in the exercise of its reasonable business judgment, that it was satisfied with the nature, extent and quality of services provided to the respective Funds under each applicable Advisory Agreement.
| B. |
|
The Investment Performance of the Funds and Fund Advisers |
In evaluating the quality of the
services provided by the Fund Advisers, the Board also considered a variety of investment performance data of the Nuveen funds prepared specifically for the annual review of the advisory agreements as well as the performance data the Board received
throughout the year representing different time periods. In this regard, leading into the May Meeting, the Board reviewed, among other things, Fund performance over the quarter, one-, three- and five-year periods ending December 31, 2022 and March 31, 2023 (or for shorter periods available to the extent a Fund was not in existence during such
periods). In addition, the Board reviewed and discussed performance data at its regularly scheduled quarterly meetings during the year. The Board therefore took into account the performance data, presentations and discussions (written and oral) that
have been provided for the annual review as well as in prior meetings over time in evaluating fund performance, including the Adviser’s analysis of a fund’s performance with particular focus on performance outliers (both overperformance
and underperformance), the factors contributing to performance (including relative to a fund’s benchmark and peers and the impact of market conditions) and any recommendations or steps that had been taken or were proposed to be taken to address
significant performance concerns. In this regard, the Board noted, among other things, that certain Nuveen funds had changes in portfolio managers or other significant changes to their investment strategies or policies since March 2020, and, as a
result, the Board reviewed certain tracking performance data comparing the performance of such funds before and after such changes.
The Board
recognized that performance data reflects performance over a specified period which may differ significantly depending on the ending dates selected, particularly during periods of market volatility. Further, the Board noted that shareholders may
evaluate performance based on their own respective holding periods which may differ from the performance periods reviewed by the Board and lead to differing results.
In its evaluation, the Board reviewed Nuveen fund performance results from different perspectives. In general, subject to certain exceptions, the Board
reviewed both absolute and relative fund performance during the annual review over the various time periods and evaluated performance results in light of a fund’s investment objective(s), strategies and risks. With respect to the relative
performance, the Board considered fund performance in comparison to the performance of peer funds (the “Performance Peer Group”) and recognized and/or customized benchmarks (i.e., generally benchmarks derived from multiple
recognized benchmarks). In reviewing such comparative performance, the Board was cognizant of the inherent limitations of such data which can make meaningful performance comparisons generally difficult. As an illustration, differences in the
composition of the Performance Peer Group, the investment objective(s), strategies and other characteristics of the peers in the Performance Peer Group, the level, type and cost of leverage (if any) of the peers, and the varying sizes of peers all
may contribute to differences in the performance results of a Performance Peer Group compared to the applicable Nuveen fund. With respect to relative performance of a Nuveen fund compared to a benchmark index, differences, among other things, in the
investment objective(s) and strategies of a fund and the benchmark (particularly an actively managed fund that does not directly follow an index) as well as the costs of operating a fund would necessarily contribute to differences in performance
results and limit the value of the comparative performance information. To assist the Board in its review of the comparability of the relative performance, the Adviser has ranked the relevancy of the peer group to the Funds as low, medium or high.
78
The secondary market trading of
shares of the Nuveen closed-end funds also continues to be a priority for the Board given its importance to shareholders, and therefore the Board and/or its Closed-end
Fund committee reviews certain performance data reflecting, among other things, the premiums and discounts at which the shares of the Nuveen closed-end funds have traded over specified periods throughout the
year. In its review, the Board considers, among other things, changes to investment mandates and guidelines, distribution policies, leverage levels and types; share repurchases and similar capital market actions; and effective communications
programs to build greater awareness and deepen understanding of closed-end funds. As applicable, the Board considered the impact of leverage on a Nuveen fund’s performance. The Board further acknowledged
that performance results should include the distribution yields of funds that seek to provide income as part of their investment objective(s) to shareholders. In this regard, the Board considered that the use of leverage by various funds may have
detracted from total return performance of such funds over various periods in current market conditions, but the leverage also was accretive in helping to provide income.
The Board also evaluated Nuveen fund performance in light of various relevant factors which may include, among other things, general market conditions, issuer-specific information, asset class information, leverage and fund cash flows. The Board acknowledged that long-term performance could be impacted by even one period of significant outperformance or
underperformance and that a single investment theme could disproportionately affect performance. Further, the Board recognized that the market and economic conditions may significantly impact a fund’s performance, particularly over shorter
periods, and such performance may be more reflective of such economic or market events and not necessarily reflective of management skill. Although the Board reviews short-, intermediate- and longer-term performance data, the Board recognized that
longer periods of performance may reflect full market cycles.
In relation to recent general market conditions, the Board had recognized the general
market volatility and underperformance of the market in 2022 in considering Nuveen fund performance. The Board took into account the Adviser’s assessment of a fund’s performance during the recent period of significant market volatility. In
their review from year to year, the Board Members consider and may place different emphasis on the relevant information in light of changing circumstances in market and economic conditions. In evaluating performance, the Board focused particular
attention on funds with less favorable performance records. However, depending on the facts and circumstances including any differences between the respective fund and its benchmark and/or Performance Peer Group, the Board may be satisfied with a
fund’s performance notwithstanding that its performance may be below that of its benchmark and/or peer group for certain periods. With respect to any funds for which the Board has identified performance issues, the Board seeks to monitor such
funds closely until performance improves, discusses with the Adviser the reasons for such results, considers whether any steps are necessary or appropriate to address such issues, and reviews the results of any steps undertaken.
The Board’s determinations with respect to each Fund are summarized below.
For the Global High Income Fund, the Board noted that although the Fund’s performance was below the performance of its benchmark for the one-, three- and five-year periods ended December 31, 2022 and the Fund ranked in the fourth quartile of its Performance Peer Group for the three- and five-year periods ended December 31, 2022, the Fund
ranked in the third quartile of its Performance Peer Group for the one-year period ended December 31, 2022. In addition, although the Fund’s performance was below the performance of its benchmark for
the one- and five-year periods ended March 31, 2023 and the Fund ranked in the fourth quartile of its Performance Peer Group for the five-year period ended March 31, 2023, the Fund outperformed its
benchmark for the three-year period ended March 31, 2023 and ranked in the third quartile of its Performance Peer Group for the one- and three-year periods ended March 31, 2023. On the basis of the
Board’s ongoing review of investment performance and all relevant factors, including the relative market conditions during certain reporting periods, the Fund’s investment objective(s) and management’s discussion of performance, the
Board concluded that in light of these factors, the Fund’s performance supported renewal of the Advisory Agreements.
For the Core Plus Impact
Fund, the Board noted that the Fund’s performance was below the performance of its blended benchmark and the Fund ranked in the fourth quartile of its Performance Peer Group for the one-year periods ended
December 31, 2022 and March 31, 2023. In considering performance, the Board recognized that the Performance Peer Group
79
Annual Investment Management Agreement Approval Process (continued)
(Unaudited)
was classified as low for relevancy. In its review, the Board also recognized that the Fund was relatively new with a performance history too limited to
make a meaningful assessment of performance, and management deserved additional time to develop a performance record. The Board will continue to monitor the development of the Fund.
For the Mortgage and Income Fund, the Board noted that although the Fund’s performance was below the performance of its benchmark for the one-, three- and five-year periods ended December 31, 2022, the Fund ranked in the third quartile of its Performance Peer Group for the
one-year period ended December 31, 2022 and second quartile for the three- and five-year periods ended December 31, 2022. In addition, although the Fund’s performance was below the performance
of its benchmark for the one- and five-year periods ended March 31, 2023, the Fund outperformed its benchmark for the three-year period ended March 31, 2023. The Fund further ranked in the second
quartile of its Performance Peer Group for the one- and three-year periods ended March 31, 2023 and third quartile for the five-year period ended March 31, 2023. In its review, the Board noted the
Fund’s Performance Peer Group was classified as low for relevancy. The Board also recognized that the Fund was restructured to become a perpetual closed-end fund with a new investment objective, new sub-adviser and revised investment mandate effective in October 2019. The Board recognized that the Fund’s performance prior to such restructuring would not reflect these changes. On the basis of the
Board’s ongoing review of investment performance and all relevant factors, including the relative market conditions during certain reporting periods, the Fund’s investment objective(s) and management’s discussion of performance, the
Board concluded that in light of these factors, the Fund’s performance supported renewal of the Advisory Agreements.
| C. |
|
Fees, Expenses and Profitability |
As part of its annual review, the Board generally reviewed, among other things,
with respect to the Nuveen closed-end funds, the contractual management fee and actual management fee (i.e., the management fee after taking into consideration fee waivers and/or expense reimbursements,
if any) paid by a fund to the Adviser in light of the nature, extent and quality of the services provided. The Board also considered the total operating expense ratio of a fund (after any fee waivers and/or expense reimbursements). More
specifically, the Independent Board Members reviewed, among other things, each Nuveen closed-end fund’s actual management fee rate (after fee waivers and/or expense reimbursements, if any) and net total
expense ratio in relation to those of a comparable universe of funds (the “Peer Universe”) established by Broadridge. The Independent Board Members reviewed the methodology Broadridge employed to establish its Peer Universe and
recognized that differences between the applicable fund and its respective Peer Universe as well as changes to the composition of the Peer Universe from year to year may limit some of the value of the comparative data. The Independent Board Members
take these limitations and differences into account when reviewing comparative peer data. The Independent Board Members also considered a fund’s operating expense ratio as it more directly reflected the shareholder’s costs in investing in
the respective fund.
In their review, the Independent Board Members considered, in particular, each Nuveen fund with a net total expense ratio
(excluding investment-related costs of leverage for closed-end funds) of six basis points or higher compared to that of its peer average (each, an “Expense Outlier Fund”), including the Core
Plus Impact Fund, and an analysis as to the factors contributing to each such fund’s higher relative net total expense ratio. In addition, although the Board reviewed a fund’s total net expenses both including and excluding investment-related expenses (i.e., leverage costs) for certain of the closed-end funds, the Board recognized that leverage expenses will vary across funds and in
comparison to peers because of differences in the forms and terms of leverage employed by the respective fund. Accordingly, in reviewing the comparative data between a fund and its peers, the Board generally considered the fund’s net total
expense ratio and fees (excluding leverage costs and leveraged assets for the closed-end funds) to be higher if they were over 10 basis points higher, slightly higher if they were 6 to 10 basis points higher,
in line if they were within approximately 5 basis points higher than the peer average and below if they were below the peer average of the Peer Universe.
The Independent Board Members also considered, in relevant part, a Nuveen fund’s management fee and net total expense ratio in light of its
performance history, including reviewing certain funds identified by the Adviser and/or the Board as having a higher net total expense ratio or management fee compared to their respective peers coupled with experiencing periods of
80
challenged performance and
considering the reasons for such comparative positions. In addition, with respect to closed-end funds that utilize leverage, the Independent Board Members recognized that certain assets attributable to a
fund’s use of leverage may be included in the amount of assets upon which the advisory fee or sub-advisory fee is calculated. The Independent Board Members acknowledged the fact that a decision to employ
leverage or increase a fund’s leverage which has the effect, all other things being equal, of increasing the assets upon which an advisory or sub-advisory fee is based (and, in turn, increasing the
Adviser’s and applicable sub-adviser’s management fees), means that the Adviser and applicable sub-adviser may have a conflict of interest in determining
whether to use or increase leverage. The Independent Board Members recognized, however, that the Adviser and sub-advisers would seek to manage the potential conflict by recommending to the Board to leverage
the applicable fund or increase such leverage when the Adviser and/or sub-adviser, as applicable, has determined that such action would be in the best interests of the respective fund and its common
shareholders and by periodically reviewing with the Board the fund’s performance and the impact of the use of leverage on that performance.
In
their review of the fee arrangements for the Nuveen funds, the Independent Board Members also considered the management fee schedules, including the complex-wide and
fund-level breakpoint schedules, as applicable. The Board noted that across the Nuveen fund complex, the complex-wide fee breakpoints reduced fees by approximately $62.4 million and fund-level breakpoints
reduced fees by approximately $76.1 million in 2022.
With respect to each Sub-Adviser, the Board also
considered, among other things, the sub-advisory fee schedule paid to the Sub-Adviser in light of the sub-advisory services
provided to the respective Fund and comparative data of the fees the Sub-Adviser charges to other clients, if any. In its review, the Board recognized that the compensation paid to each Sub-Adviser is the responsibility of the Adviser, not the applicable Fund(s).
The Independent Board Members noted
that (a) the Global High Income Fund had an actual management fee that was in line with the peer average and a net total expense ratio that was below the peer average; (b) the Mortgage and Income Fund had an actual management fee that was
higher than the peer average, but a net total expense ratio that was in line with the peer average; and (c) the Core Plus Impact Fund had an actual management fee and a net total expense ratio that were higher than the respective peer averages.
The Independent Board Members noted that differences in the Core Plus Impact Fund’s investment strategy relative to the peer set contributed to the differential.
Based on its review of the information provided, the Board determined that each Fund’s management fees (as applicable) to a Fund Adviser were
reasonable in light of the nature, extent and quality of services provided to the Fund.
| |
2. |
|
Comparisons with the Fees of Other Clients |
In evaluating the appropriateness of fees, the Board
also considered information regarding the fee rates the respective Fund Advisers charged to certain other types of clients and the type of services provided to these other clients. With respect to the Adviser and/or the Sub-Advisers, such other clients may include: retail and institutional managed accounts sub-advised by a Sub-Adviser (with respect to
NAM); hedge funds or other structured products managed by a Sub-Adviser (with respect to NAM); investment companies offered outside the Nuveen family and sub-advised by
a Sub-Adviser (with respect to NAM); foreign investment companies offered by Nuveen and sub-advised by a Sub-Adviser (with
respect to NAM and TAL); collective investment trusts sub-advised by a Sub-Adviser (with respect to NAM); and certain funds advised by a
Sub-Adviser (with respect to TAL). The Board further noted that the Adviser also advised, and each Sub-Adviser sub-advised,
certain exchange-traded funds (“ETFs”) sponsored by Nuveen. The Board reviewed, among other things, the range of fees assessed for managed accounts, hedge funds (along with their performance fee), foreign investment companies and
ETFs offered by Nuveen, as applicable. The Board also reviewed the fee range and average fee rate of certain selected investment strategies offered in retail and institutional managed accounts sub-advised by
NAM, the hedge funds advised by NAM (along with their performance fee) and non-Nuveen investment companies sub-advised by certain affiliated sub-advisers. With respect to TAL, the Board reviewed the management fees and expense ratios of certain funds advised by TAL in the TIAA-CREF family of funds.
81
Annual Investment Management Agreement Approval Process (continued)
(Unaudited)
In considering the comparative fee data, the Board recognized that differences, including but not limited to, the amount, type and level of services
provided by the Adviser to the Nuveen funds compared to that provided to other clients as well as differences in investment policies; eligible portfolio assets and the manner of managing such assets; product structure; investor profiles; account
sizes; and regulatory requirements contribute to the variations in the fee schedules. Similarly, differences in the client base, governing bodies, distribution jurisdiction and operational complexities would also contribute to variations in
management fees assessed the Nuveen funds compared to foreign fund clients. Further, with respect to ETFs, the Board considered that the Nuveen ETFs that are designed to track the performance of a specified index (“Index ETFs”) were
passively managed compared to the active management of other Nuveen funds, which also contributed to the differences in fee levels between such Index ETFs and the actively managed funds. The Board acknowledged the wide range of services in addition
to investment management that the Adviser had provided to the Nuveen funds compared to other types of clients as well as the increased entrepreneurial, legal and regulatory risks that the Adviser incurs in sponsoring and managing the Nuveen funds.
In general, higher fee levels reflect higher levels of service provided by the Adviser, increased investment management complexity, greater product management requirements, and higher levels of business risk or some combination of these factors. The
Board further considered that a Sub-Adviser’s fee is essentially for portfolio management services and therefore more comparable to the fees it receives for retail wrap accounts and other external sub-advisory mandates, as applicable. The Board concluded the varying levels of fees were justified given, among other things, the more extensive services, regulatory requirements and legal liabilities, and the
entrepreneurial, legal and regulatory risks incurred in sponsoring and advising a registered investment company compared to that required in advising other types of clients.
| |
3. |
|
Profitability of Fund Advisers |
In their review, the Independent Board Members considered
estimated profitability information of Nuveen as a result of its advisory services to the Nuveen funds as well as profitability data of other publicly traded asset management firms. Such profitability information included, among other things, gross
and net revenue margins (excluding distribution) of Nuveen Investments, Inc. (“Nuveen Investments”) for services to the Nuveen funds on a pre-tax and
after-tax basis for the 2022 and 2021 calendar years as well as the revenues earned (less any expense reimbursements/fee waivers) and expenses incurred by Nuveen Investments for its advisory activities to the
Nuveen funds (excluding distribution and certain other expenses) for the 2022 and 2021 calendar years. The Independent Board Members also considered a summary of some of the key factors that impacted Nuveen’s profitability in 2022. In addition,
the Board reviewed the revenues, expenses and operating margin (pre- and after-tax) the Adviser derived from its ETF product line for the 2022 and 2021 calendar years.
In developing the profitability data of the Adviser for its advisory services to the Nuveen funds, the Independent Board Members recognized the
subjective nature of calculating profitability as the information is not audited and is necessarily dependent on cost allocation methodologies to allocate expenses throughout the complex and among the various advisory products. Given there is no
perfect expense allocation methodology and that other reasonable and valid allocation methodologies could be employed and could lead to significantly different results, the Board reviewed, among other things, a description of the cost allocation
methodologies employed to develop the financial information, a summary of the history of changes to the methodology over the years from 2010 through 2022, and a historical expense analysis of Nuveen Investments’ revenues, expenses and pre-tax net revenue margins derived from its advisory services to the Nuveen funds (excluding distribution) for the calendar years from 2017 through 2022. The Board had also appointed four Independent Board Members
to serve as the Board’s liaisons, with the assistance of independent counsel, to meet with representatives of the Adviser and review the development of the profitability data and to report to the full Board.
In addition, the Board considered certain comparative operating margin data. In this regard, the Board reviewed the operating margins of Nuveen
Investments compared to the adjusted operating margins of a peer group of asset management firms with publicly available data and the most comparable assets under management (based on asset size and asset composition) to Nuveen. The Board recognized
that the operating margins of the peers were adjusted generally to address that certain services provided by the peers were not provided by Nuveen. The Board also reviewed, among other things, the net revenue margins
(pre-tax) of Nuveen Investments on a company-wide basis and the net revenue margins (pre-tax) of Nuveen Investments derived from its services to the Nuveen funds only
(including and excluding distribution) compared to the adjusted operating margins of the peer group for each calendar year from 2012 to 2022. Although the total
82
company operating margins of Nuveen
Investments were in the bottom half of the peer group range for 2022 and 2021, the Independent Board Members recognized the limitations of the comparative data given that peer data is not generally public and the calculation of profitability is
subjective and affected by numerous factors (such as types of funds a peer manages, its business mix, its cost of capital, the numerous assumptions underlying the methodology used to allocate expenses and other factors) that can have a significant
impact on the results.
Aside from Nuveen’s profitability, the Board recognized that the Adviser is a subsidiary of Nuveen, LLC, the investment
management arm of Teachers Insurance and Annuity Association of America (“TIAA”). Accordingly, the Board also reviewed a balance sheet for TIAA reflecting its assets, liabilities and capital and contingency reserves for the 2022 and
2021 calendar years to consider the financial strength of TIAA. The Board recognized the benefit of an investment adviser and its parent with significant resources, particularly during periods of market volatility. The Board also noted the
reinvestments Nuveen, its parent and/or other affiliates made into its business through, among other things, the investment of seed capital in certain Nuveen funds and continued investments in enhancements to technological capabilities.
In addition to Nuveen, the Independent Board Members considered the profitability of each Sub-Adviser from its
relationships with the respective Nuveen funds. In this regard, with respect to NAM, the Independent Board Members reviewed, among other things, NAM’s revenues, expenses and net revenue margins (pre- and after-tax) for its advisory activities to the respective Nuveen funds for the calendar years ended December 31, 2022 and December 31, 2021. The Independent Board Members also reviewed a profitability
analysis reflecting the revenues, expenses and revenue margin (pre- and after-tax) by asset type for NAM for the calendar years ending December 31, 2022 and
December 31, 2021. With respect to TAL, the Independent Board Members reviewed, among other things, the revenues, expenses and net operating income for its advisory services to the Nuveen ETFs and Nuveen
closed-end funds it sub-advises for the 2022 and 2021 calendar years.
In evaluating the reasonableness of the compensation, the Independent Board Members also considered any other ancillary benefits derived by the
respective Fund Adviser from its relationship with the Nuveen funds as discussed in further detail below.
Based on a consideration of all the
information provided, the Board noted that Nuveen’s and each Sub-Adviser’s level of profitability was acceptable and not unreasonable in light of the services provided.
| D. |
|
Economies of Scale and Whether Fee Levels Reflect These Economies of Scale |
The Board considered
whether there have been economies of scale with respect to the management of the Nuveen funds, whether these economies of scale have been appropriately shared with the funds and whether there is potential for realization of further economies of
scale. Although the Board recognized that economies of scale are difficult to measure with any precision and certain expenses may not decline with a rise in assets, the Board considered that Nuveen shares the benefits of economies of scale, if any,
in a number of ways including through the use of breakpoints in the management fee schedule, fee waivers and/or expense limitations, the pricing of funds at scale at inception and investments in Nuveen’s business which can enhance the services
provided to the funds for the fees paid. In this regard, the Board recognized that the management fee of the Adviser is generally comprised of a fund-level component and a complex-level component each with its own breakpoint schedule, subject to
certain exceptions. The Board reviewed the fund-level and complex-level fee schedules. With this structure, the Board noted that the complex-level breakpoint schedule is designed to deliver the benefits of economies of scale to shareholders when the
eligible assets in the complex pass certain thresholds even if the assets of a particular fund are unchanged or have declined, and the fund-level breakpoint schedules are designed to share economies of scale with shareholders if the particular fund
grows. The Board noted, however, that although closed-end funds may make additional share offerings from time to time, the closed-end funds have a more limited ability
to increase their assets because the growth of their assets will occur primarily from the appreciation of their investment portfolios.
As noted
above, the Independent Board Members also recognized the continued reinvestment in Nuveen’s business to enhance its capabilities and services to the benefit of its various clients. The Board understood that many of these investments in the
Nuveen business were not specific to individual Nuveen funds but rather incurred across of a variety of products and services pursuant to which the family of Nuveen funds as a whole may benefit. In addition, the Board also
83
Annual Investment Management Agreement Approval Process (continued)
(Unaudited)
considered that Nuveen has provided, without raising advisory fees to the Nuveen funds, certain additional services, including, but not limited to,
services required by new regulations and regulatory interpretations, and this was also a means of sharing economies of scale with the funds and their shareholders.
Based on its review, the Board was satisfied that the current fee arrangements together with the reinvestment in Nuveen’s business appropriately
shared any economies of scale with shareholders.
The Independent Board Members received and considered information regarding
other benefits the respective Fund Adviser or its affiliates may receive as a result of their relationship with the Nuveen funds. The Board acknowledged that an affiliate of the Adviser may receive compensation for serving as a co-manager in the initial public offerings of new Nuveen closed-end funds (if any) and for serving as an underwriter on shelf offerings of existing Nuveen closed-end funds and reviewed the amounts paid for such services, if any, in 2021 and 2022.
In addition, the
Independent Board Members noted that the various sub-advisers to the Nuveen funds do not generally benefit from soft dollar arrangements with respect to Nuveen fund portfolio transactions.
Based on its review, the Board concluded that any indirect benefits received by a Fund Adviser as a result of its relationship with the applicable
Fund(s) were reasonable in light of the services provided.
The Independent Board Members did not identify any single factor discussed
previously as all-important or controlling. The Independent Board Members concluded that the terms of each Advisory Agreement were reasonable, that the respective Fund Adviser’s fees were reasonable in
light of the services provided to each applicable Fund and that the Advisory Agreements be renewed for an additional one-year period.
84
Notes
85
Notes
86
Notes
87
Nuveen:
Serving Investors for Generations
Since 1898, financial professional and their clients have relied on Nuveen to provide
dependable investment solutions through continued adherence to
proven, long-term investing
principles. Today, we offer a range of high quality solutions designed to
be integral components of a well-diversified core portfolio.
Focused on meeting investor needs.
Nuveen is the investment
manager of TIAA. We have grown into one of the world’s premier global asset managers, with specialist knowledge across all major asset classes and particular strength in solutions that provide income for investors and that draw on our expertise
in alternatives and responsible investing. Nuveen is driven not only by the independent investment processes across the firm, but also the insights, risk management, analytics and other tools and resources that a truly world-class platform provides.
As a global asset manager, our mission is to work in partnership with our clients to create solutions which help them secure their financial future.
Find
out how we can help you.
To learn more about how the products and services of Nuveen may be able to help you meet your financial goals, talk to your
financial professional, or call us at (800) 257-8787. Please read the information provided carefully before you invest. Investors should consider the investment objective and policies, risk
considerations, charges and expenses of any investment carefully. Where applicable, be sure to obtain a prospectus, which contains this and other relevant information. To obtain a prospectus, please contact your securities representative or Nuveen,
333 W. Wacker Dr., Chicago, IL 60606. Please read the prospectus carefully before you invest or send money.
Learn more about Nuveen Funds at:
www.nuveen.com/closed-end-funds
NOT FDIC INSURED MAY LOSE VALUE NO BANK GUARANTEE
|
|
|
|
|
| Nuveen Securities, LLC, member FINRA and SIPC | 333 West Wacker Drive Chicago, IL 60606 | www.nuveen.com |
|
|
|
ESA-B-0623P 3020129-INV-B-8/24 |
Not applicable to this filing.
| ITEM 3. |
AUDIT COMMITTEE FINANCIAL EXPERT. |
Not applicable to this filing.
| ITEM 4. |
PRINCIPAL ACCOUNTANT FEES AND SERVICES. |
Not applicable to this filing.
| ITEM 5. |
AUDIT COMMITTEE OF LISTED REGISTRANTS. |
Not applicable to this filing.
| ITEM 6. |
SCHEDULE OF INVESTMENTS. |
| (a) |
|
See Portfolio of Investments in Item 1. |
| ITEM 7. |
DISCLOSURE OF PROXY VOTING POLICIES AND PROCEDURES FOR CLOSED-END MANAGEMENT INVESTMENT COMPANIES.
|
Not applicable to this filing.
| ITEM 8. |
PORTFOLIO MANAGERS OF CLOSED-END MANAGEMENT INVESTMENT COMPANIES. |
Not applicable to this filing.
| ITEM 9. |
PURCHASES OF EQUITY SECURITIES BY CLOSED-END MANAGEMENT INVESTMENT COMPANY AND AFFILIATED PURCHASERS.
|
Not applicable.
| ITEM 10. |
SUBMISSION OF MATTERS TO A VOTE OF SECURITY HOLDERS. |
There have been no material changes to the procedures by which shareholders may recommend nominees to the registrant’s Board implemented after the
registrant last provided disclosure in response to this item.
| ITEM 11. |
CONTROLS AND PROCEDURES. |
| (a) |
|
The registrant’s principal executive and principal financial officers, or persons performing similar functions, have concluded that the registrant’s disclosure controls and procedures (as defined in Rule
30a-3(c) under the Investment Company Act of 1940, as amended (the “1940 Act”) (17 CFR 270.30a-3(c))) are effective, as of a date within 90 days of the filing date of this report that includes the disclosure required by this paragraph,
based on their evaluation of the controls and procedures required by Rule 30a-3(b) under the 1940 Act (17 CFR 270.30a-3(b)) and Rules 13a-15(b) or 15d-15(b) under the Securities Exchange Act of 1934, as amended (the “Exchange Act”)
(17 CFR 240.13a-15(b) or 240.15d-15(b)). |
| (b) |
|
There were no changes in the registrant’s internal control over financial reporting (as defined in Rule 30a-3(d) under the 1940 Act (17 CFR 270.30a-3(d)) that occurred during the period covered by this report that
has materially affected, or is reasonably likely to materially affect, the registrant’s internal control over financial reporting. |
| ITEM 12. |
DISCLOSURE OF SECURITIES LENDING ACTIVITIES FOR CLOSED-END MANAGEMENT INVESTMENT COMPANIES.
|
Not applicable.
File the exhibits listed below as part of this Form.
(a)(1)
Any code of ethics, or amendment thereto, that is the subject of the disclosure required by Item 2, to the extent that the registrant intends to satisfy the Item 2 requirements through filing of an exhibit: Not applicable to this filing.
(a)(2) A separate certification for each principal executive officer and principal financial officer of the registrant as required
by Rule 30a-2(a) under the 1940 Act (17 CFR 270.30a-2(a)) in the exact form set forth below: See EX-99.CERT attached hereto.
(a)(3) Any
written solicitation to purchase securities under Rule 23c-1 under the 1940 Act (17 CFR 270.23c-1) sent or given during the period covered by the report by or on behalf of the registrant to 10 or more persons: Not applicable.
(a)(4) Change in the registrant’s independent public accountant. Not applicable.
(b) If the report is filed under Section
13(a) or 15(d) of the Exchange Act, provide the certifications required by Rule 30a-2 (b) under the 1940 Act (17 CFR 270.30a-2(b)), Rule 13a-14(b) or Rule 15d-14(b) under the Exchange Act (17 CFR 240.13a-14(b) or 240.15d-14(b)),
and Section 1350 of Chapter 63 of Title 18 of the United States Code (18 U.S.C. 1350) as an Exhibit. A certification furnished pursuant to this paragraph will not be deemed “filed” for purposes of Section 18 of the
Exchange Act (15 U.S.C. 78r), or otherwise subject to the liability of that section. Such certification will not be deemed to be incorporated by reference into any filing under the Securities Act of 1933 or the Exchange Act, except to the extent
that the registration specifically incorporates it by reference: See EX-99.906 CERT attached hereto.
SIGNATURES
Pursuant to the requirements of the Securities Exchange Act of 1934 and the Investment Company Act of 1940, the registrant has duly caused this report to be
signed on its behalf by the undersigned, thereunto duly authorized.
(Registrant) Nuveen Global High Income Fund
|
|
|
|
|
| By (Signature and Title) |
|
/s/ Mark L. Winget |
|
|
|
|
Mark L. Winget |
|
|
|
|
Vice President and Secretary |
|
|
Date: September 6, 2023
Pursuant to the requirements of the Securities Exchange Act of 1934 and the Investment Company Act of 1940, this report has been signed below by the following
persons on behalf of the registrant and in the capacities and on the dates indicated.
|
|
|
| By (Signature and Title) |
|
/s/ David J. Lamb |
|
|
David J. Lamb |
|
|
Chief Administrative Officer |
|
|
(principal executive officer) |
Date: September 6, 2023
|
|
|
| By (Signature and Title) |
|
/s/ E. Scott Wickerham |
|
|
E. Scott Wickerham |
|
|
Vice President and Funds Controller |
|
|
(principal financial officer) |
Date: September 6, 2023
EX-99.CERT
CERTIFICATIONS PURSUANT TO SECTION 302 OF THE SARBANES-OXLEY ACT
CERTIFICATIONS
I, David J. Lamb, certify that:
1. I have reviewed this report on Form N-CSR of Nuveen Global High Income Fund;
2. Based on my knowledge, this report does not contain any untrue statement of a material fact or omit to state a material fact necessary to
make the statements made, in light of the circumstances under which such statements were made, not misleading with respect to the period covered by this report;
3. Based on my knowledge, the financial statements, and other financial information included in this report, fairly present in all material
respects the financial condition, results of operations, changes in net assets, and cash flows (if the financial statements are required to include a statement of cash flows) of the registrant as of, and for, the periods presented in this report;
4. The registrant’s other certifying officer and I are responsible for establishing and maintaining disclosure controls and
procedures (as defined in Rule 30a-3(c) under the Investment Company Act of 1940) and internal control over financial reporting (as defined in Rule 30a-3(d) under the Investment Company Act of 1940) for the registrant and have:
| |
a) |
|
designed such disclosure controls and procedures, or caused such disclosure controls and procedures to be designed under our supervision, to ensure that material information relating to the registrant, including its
consolidated subsidiaries, is made known to us by others within those entities, particularly during the period in which this report is being prepared; |
| |
b) |
|
designed such internal control over financial reporting, or caused such internal control over financial reporting to be designed under our supervision, to provide reasonable assurance regarding the reliability of
financial reporting and the preparation of financial statements for external purposes in accordance with generally accepted accounting principles; |
| |
c) |
|
evaluated the effectiveness of the registrant’s disclosure controls and procedures and presented in this report our conclusions about the effectiveness of the disclosure controls and procedures, as of a date within
90 days prior to the filing date of this report based on such evaluation; and |
| |
d) |
|
disclosed in this report any change in the registrant’s internal control over financial reporting that occurred during the period covered by this report that has materially affected, or is reasonably likely to
materially affect, the registrant’s internal control over financial reporting; and |
5. The registrant’s other
certifying officer and I have disclosed to the registrant’s auditors and the audit committee of the registrant’s board of directors (or persons performing the equivalent functions):
| |
a) |
|
all significant deficiencies and material weaknesses in the design or operation of internal control over financial reporting which are reasonably likely to adversely affect the registrant’s ability to record,
process, summarize, and report financial information; and |
| |
b) |
|
any fraud, whether or not material, that involves management or other employees who have a significant role in the registrant’s internal control over financial reporting. |
|
|
|
| Date: September 6, 2023 |
|
/s/ David J. Lamb |
|
|
David J. Lamb |
|
|
Chief Administrative Officer |
|
|
(principal executive officer) |
I, E. Scott Wickerham, certify that:
1. I have reviewed this report on Form N-CSR of Nuveen Global High Income Fund;
2. Based on my knowledge, this report does not contain any untrue statement of a material fact or omit to state a material fact necessary to
make the statements made, in light of the circumstances under which such statements were made, not misleading with respect to the period covered by this report;
3. Based on my knowledge, the financial statements, and other financial information included in this report, fairly present in all material
respects the financial condition, results of operations, changes in net assets, and cash flows (if the financial statements are required to include a statement of cash flows) of the registrant as of, and for, the periods presented in this report;
4. The registrant’s other certifying officer and I are responsible for establishing and maintaining disclosure controls and
procedures (as defined in Rule 30a-3(c) under the Investment Company Act of 1940) and internal control over financial reporting (as defined in Rule 30a-3(d) under the Investment Company Act of 1940) for the registrant and have:
| |
a) |
|
designed such disclosure controls and procedures, or caused such disclosure controls and procedures to be designed under our supervision, to ensure that material information relating to the registrant, including its
consolidated subsidiaries, is made known to us by others within those entities, particularly during the period in which this report is being prepared; |
| |
b) |
|
designed such internal control over financial reporting, or caused such internal control over financial reporting to be designed under our supervision, to provide reasonable assurance regarding the reliability of
financial reporting and the preparation of financial statements for external purposes in accordance with generally accepted accounting principles; |
| |
c) |
|
evaluated the effectiveness of the registrant’s disclosure controls and procedures and presented in this report our conclusions about the effectiveness of the disclosure controls and procedures, as of a date within
90 days prior to the filing date of this report based on such evaluation; and |
| |
d) |
|
disclosed in this report any change in the registrant’s internal control over financial reporting that occurred during the period covered by this report that has materially affected, or is reasonably likely to
materially affect, the registrant’s internal control over financial reporting; and |
5. The registrant’s other
certifying officer and I have disclosed to the registrant’s auditors and the audit committee of the registrant’s board of directors (or persons performing the equivalent functions):
| |
a) |
|
all significant deficiencies and material weaknesses in the design or operation of internal control over financial reporting which are reasonably likely to adversely affect the registrant’s ability to record,
process, summarize, and report financial information; and |
| |
b) |
|
any fraud, whether or not material, that involves management or other employees who have a significant role in the registrant’s internal control over financial reporting. |
|
|
|
| Date: September 6, 2023 |
|
/s/ E. Scott Wickerham |
|
|
E. Scott Wickerham |
|
|
Vice President and Funds Controller |
|
|
(principal financial officer) |
EX-99.906CERT
CERTIFICATIONS PURSUANT TO SECTION 906 OF THE SARBANES-OXLEY ACT
Certification Pursuant to 18 U.S.C. 1350, as adopted pursuant to Section 906 of the Sarbanes-Oxley Act of 2002; provided by the Chief Executive Officer
and Chief Financial Officer, based on each such officer’s knowledge and belief.
The undersigned officers of Nuveen Global High Income Fund (the
“Registrant”), certify that, to the best of each such officer’s knowledge and belief:
| |
1. |
|
The Form N-CSR of the Registrant for the period ended June 30, 2023 (the “Report”) fully complies with the requirements of Section 13(a) or 15(d) of the Securities Exchange Act of 1934; and
|
| |
2. |
|
The information contained in the Report fairly presents, in all material respects, the financial condition and results of operations of the Registrant. |
Date: September 6, 2023
|
| /s/ David J. Lamb |
| David J. Lamb |
| Chief Administrative Officer |
| (principal executive officer) |
|
| /s/ E. Scott Wickerham |
| E. Scott Wickerham |
| Vice President and Funds Controller |
| (principal financial officer) |
Nuveen Global High Income (NYSE:JGH)
Graphique Historique de l'Action
De Mar 2024 à Avr 2024

Nuveen Global High Income (NYSE:JGH)
Graphique Historique de l'Action
De Avr 2023 à Avr 2024
