SECURITIES AND EXCHANGE COMMISSION
Washington, D.C. 20549
Form 6-K
REPORT OF
FOREIGN PRIVATE ISSUER
PURSUANT TO RULE 13a-16 OR
15d-16
OF THE SECURITIES EXCHANGE ACT OF 1934
For the month of February 2024
Commission File Number 1-14926
KT Corporation
(Translation of registrant’s name into English)
90, Buljeong-ro,
Bundang-gu,
Seongnam-si,
Gyeonggi-do,
Korea
(Address of
principal executive offices)
Indicate by check mark whether the registrant files or will file annual reports under cover of Form
20-F or Form 40-F:
Form
20-F ☒ Form 40-F ☐
SIGNATURES
Pursuant to the requirements of the Securities Exchange Act of 1934, the registrant has duly caused this report to be signed on its behalf by
the undersigned, thereunto duly authorized.
|
|
|
| Dated: February 8, 2024 |
| KT Corporation |
|
|
| By: |
|
/s/ Youngkyoon Yun |
| Name: Youngkyoon Yun |
| Title: Vice President |
|
|
| By: |
|
/s/ Sanghyun Cho |
| Name: Sanghyun Cho |
| Title: Director |

KT 2023 Earnings Release

Disclaimer This presentation has been prepared by KT Corp.(the
“Company”) in accordance with K-IFRS. This presentation contains forward-looking statements, which are subject to risks, uncertainties, and assumptions. This presentation is being presented solely for your information and is subject to
change without notice. No presentation or warranty, expressed or implied, is made and no reliance should be placed on the accuracy, actuality, fairness, or completeness of the information presented. st The Company has applied new accounting standard
of K-IFRS 1115 as of Jan 1 , 2018 and K-IFRS st 1116 ‘Leases’ as of Jan 1 , 2019. There are no obligation to apply the new standard to previous financial statements. If you have any questions related to this material, please contact the
IR department. Tel: +82-2-3495-3564, 3595, 5344 2
2 Financial Highlights 3 Business Overview 4 Appendix 3

1 2023 Highlights Financials Both consolidated/separate revenues continue to
achieve YoY growth (Unit: KRW) Revenue Consolidated KT Separate 26,387.0bn (YoY +2.9%) 18,371.4bn (YoY +0.4%) Operating 1,185.4bn (YoY +1.5%) 1,649.8bn (YoY -2.4%) Profit • [B2C] Telco continues uptrend through premium subscribers (Wireless
YoY +2.3%, Broadband YoY +2.8%, Media +2.3%) • [B2B] Broadband/data and strategic growth biz. lead growth (Corp. BB/data +4.7%, key strategic growth biz. +2.4%) • [Subsidiaries] Steady growth led by Finance/DX/Real Estate - BC Card, rev.
increase driven by loan business and Paybooc - kt cloud, growth through Public/AI Cloud and IDC demand - kt StudioGenie, introduced diversified Originals lineup - Real estate, sturdy growth through hotels and apt. pre-sales AI Shareholder return
Increased return based on improved earnings Enhanced expertise in AI Transformation • Launched HyperscaleAI Mi:Dmaiming private LLM market• DPS 1,960 KRW •Improved AI capabilities through multi LLM andglobalpartnerships + Share
buyback & cancellation KRW 27.1bn • Increase customer base with subscription-based AICC service (FY23 Shareholder return per share is 2,070 KRW, +5.6% YoY) 4

1 2023 Highlights 2 Financial Highlights 3 Business Overview 4 Appendix
5
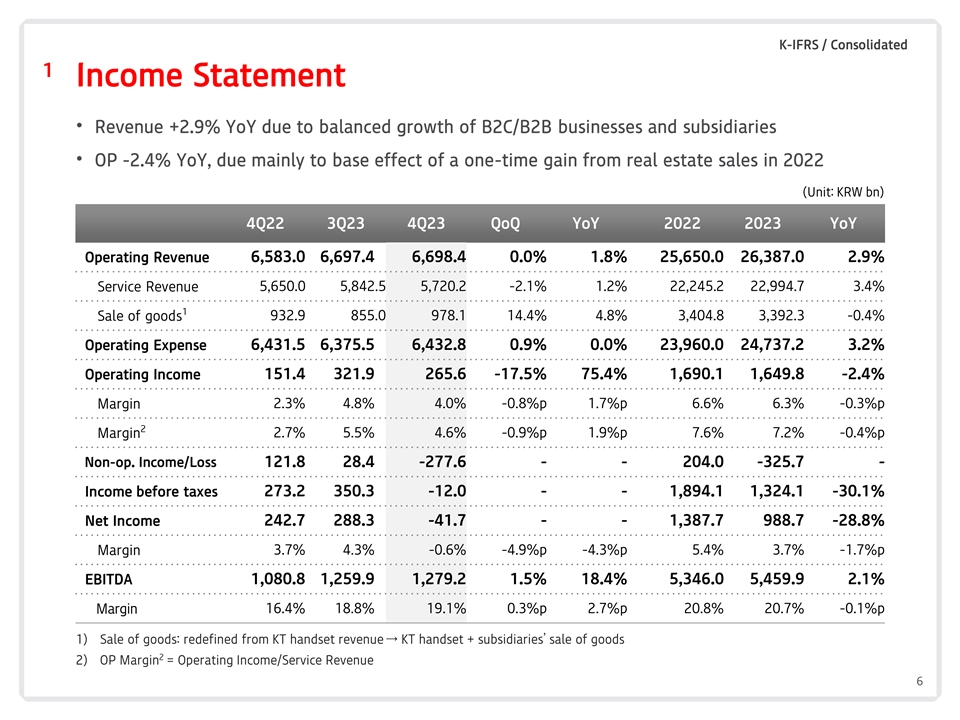
K-IFRS / Consolidated 1 Income Statement • Revenue +2.9% YoY due to
balanced growth of B2C/B2B businesses and subsidiaries • OP -2.4% YoY, due mainly to base effect of a one-time gain from real estate sales in 2022 (Unit: KRW bn) 4Q22 3Q23 4Q23 QoQ YoY 2022 2023 YoY Operating Revenue 6,583.0 6,697.4 6,698.4
0.0% 1.8% 25,650.0 26,387.0 2.9% Service Revenue 5,650.0 5,842.5 5,720.2 -2.1% 1.2% 22,245.2 22,994.7 3.4% 1 Sale of goods 932.9 855.0 978.1 14.4% 4.8% 3,404.8 3,392.3 -0.4% Operating Expense 6,431.5 6,375.5 6,432.8 0.9% 0.0% 23,960.0 24,737.2 3.2%
Operating Income 151.4 321.9 265.6 -17.5% 75.4% 1,690.1 1,649.8 -2.4% 2.3% 4.8% 4.0% -0.8%p 1.7%p 6.6% 6.3% -0.3%p Margin 2 2.7% 5.5% 4.6% -0.9%p 1.9%p 7.6% 7.2% -0.4%p Margin Non-op. Income/Loss 121.8 28.4 -277.6 - - 204.0 -325.7 - 273.2 350.3
-12.0 - - 1,894.1 1,324.1 -30.1% Income before taxes 242.7 288.3 -41.7 - - 1,387.7 988.7 -28.8% Net Income 3.7% 4.3% -0.6% -4.9%p -4.3%p 5.4% 3.7% -1.7%p Margin 1,080.8 1,259.9 1,279.2 1.5% 18.4% 5,346.0 5,459.9 2.1% EBITDA 16.4% 18.8% 19.1% 0.3%p
2.7%p 20.8% 20.7% -0.1%p Margin 1) Sale of goods: redefined from KT handset revenue → KT handset + subsidiaries’ sale of goods 2 2) OP Margin = Operating Income/Service Revenue 6
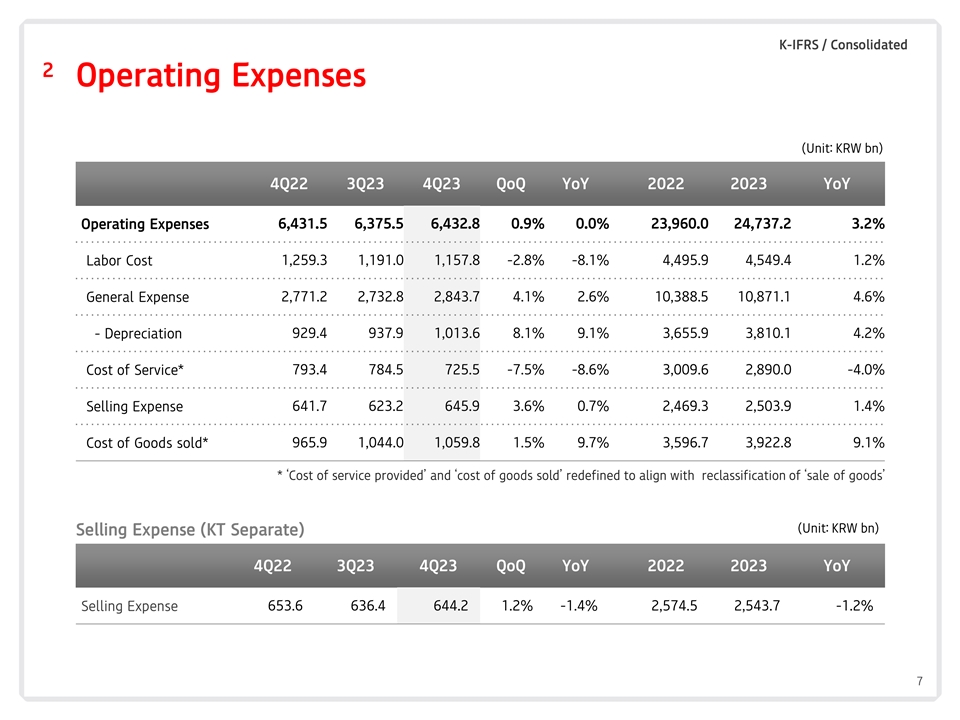
K-IFRS / Consolidated 2 Operating Expenses (Unit: KRW bn) 4Q22 3Q23 4Q23 QoQ
YoY 2022 2023 YoY Operating Expenses 6,431.5 6,375.5 6,432.8 0.9% 0.0% 23,960.0 24,737.2 3.2% Labor Cost 1,259.3 1,191.0 1,157.8 -2.8% -8.1% 4,495.9 4,549.4 1.2% 2,771.2 2,732.8 2,843.7 4.1% 2.6% 10,388.5 10,871.1 4.6% General Expense - Depreciation
929.4 937.9 1,013.6 8.1% 9.1% 3,655.9 3,810.1 4.2% 793.4 784.5 725.5 -7.5% -8.6% 3,009.6 2,890.0 -4.0% Cost of Service* Selling Expense 641.7 623.2 645.9 3.6% 0.7% 2,469.3 2,503.9 1.4% Cost of Goods sold* 965.9 1,044.0 1,059.8 1.5% 9.7% 3,596.7
3,922.8 9.1% * ‘Cost of service provided’ and ‘cost of goods sold’ redefined to align with reclassification of ‘sale of goods’ (Unit: KRW bn) Selling Expense (KT Separate) 4Q22 3Q23 4Q23 QoQ YoY 2022 2023 YoY
653.6 636.4 644.2 1.2% -1.4% 2,574.5 2,543.7 -1.2% Selling Expense 7

K-IFRS / Consolidated 3 Financial Position (Unit: KRW bn) Dec 31, ‘22
Sept 30, ‘23 Dec 31, ’23 QoQ YoY 40,980.7 43,974.8 42,681.3 6.1% 4.1% Assets 2,449.1 3,110.4 2,879.6 36.5% 17.6% Cash & Cash equivalents 22,566.0 24,120.2 9.3% 6.9% Liabilities 25,253.1 Borrowings 10,006.7 10,309.5 10,218.2 -0.9%
2.1% Equity 18,414.7 18,721.7 18,561.1 2.3% 0.8% Capital Stock 1,564.5 1,564.5 1,564.5 0.0% 0.0% Net Debt 7,557.6 7,199.1 7,338.6 1.9% -2.9% Debt / Equity 122.5% 134.9% 130.0% -4.9%p 7.5%p Net Debt / Equity 41.0% 38.5% 39.5% 1.0%p -1.5%p 134.9%
131.1% 130.0% 127.0% 124.3% 124.8% 122.6% 122.5% 121.5% 118.7% 117.9% 115.4% D 부채비율 ebt/Equity 46.6% 44.6% 42.9% 40.6% 41.0% 39.5% 37.4% 38.5% N 순부채비율 et Debt/Equity 33.0% 32.4% 32.7%
29.7% 1Q 21 2Q 21 3Q 21 4Q 21 1Q 22 2Q 22 3Q 22 4Q 22 1Q 23 2Q 23 3Q 23 4Q 23 8

K-IFRS / Separate and major subsidiaries 4 CAPEX • 2023 CAPEX
Execution: KRW 2,411.6bn(KT Separate), KRW 907.4bn(major subsidiaries) (Unit: KRW bn) * KT(sep.) + kt cloud 3,533 3,452 3,319 3,127 813 692 *2,874 *2,872 *2,855 462 907 *2,609 ■ Major subsidiaries CAPEX Finance, Media·Content, Cloud/IDC,
Real Estate and etc. 2,760 2,721 2,666 2,412 ■ KT separate CAPEX Access network, Backbone Network, B2B and etc. 2020 2021 2022 2023 KT별도 주요 그룹사 KT(Sep.) Major Subsidiaries ※ Cloud/IDC
related investment in 2020 and 2021 are retroactively reflected in subsidiaries’ CAPEX 9
1 2023 Highlights 2 Financial Highlights 3 Business Overview 4 Appendix
10
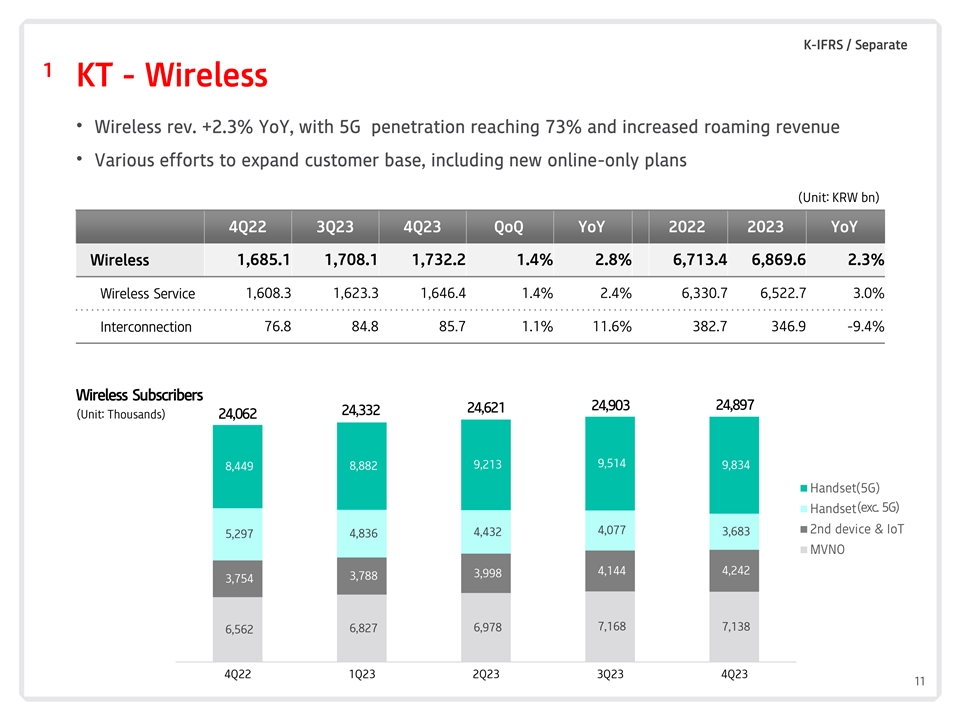
K-IFRS / Separate 1 KT - Wireless • Wireless rev. +2.3% YoY, with 5G
penetration reaching 73% and increased roaming revenue • Various efforts to expand customer base, including new online-only plans (Unit: KRW bn) 4Q22 3Q23 4Q23 QoQ YoY 2022 2023 YoY Wireless 1,685.1 1,708.1 1,732.2 1.4% 2.8% 6,713.4 6,869.6
2.3% Wireless Service 1,608.3 1,623.3 1,646.4 1.4% 2.4% 6,330.7 6,522.7 3.0% Interconnection 76.8 84.8 85.7 1.1% 11.6% 382.7 346.9 -9.4% Wireless Subscribers 24,903 24,897 24,621 24,332 (Unit: Thousands) 24,062 9,514 9,213 9,834 8,449 8,882
Handset(5G) (exc. 5G) Handset(5G외) 2nd device & IoT 4,077 4,432 3,683 5,297 4,836 MVNO 4,242 4,144 3,998 3,788 3,754 7,168 7,138 6,978 6,827 6,562 4Q22 1Q23 2Q23 3Q23 4Q23 11
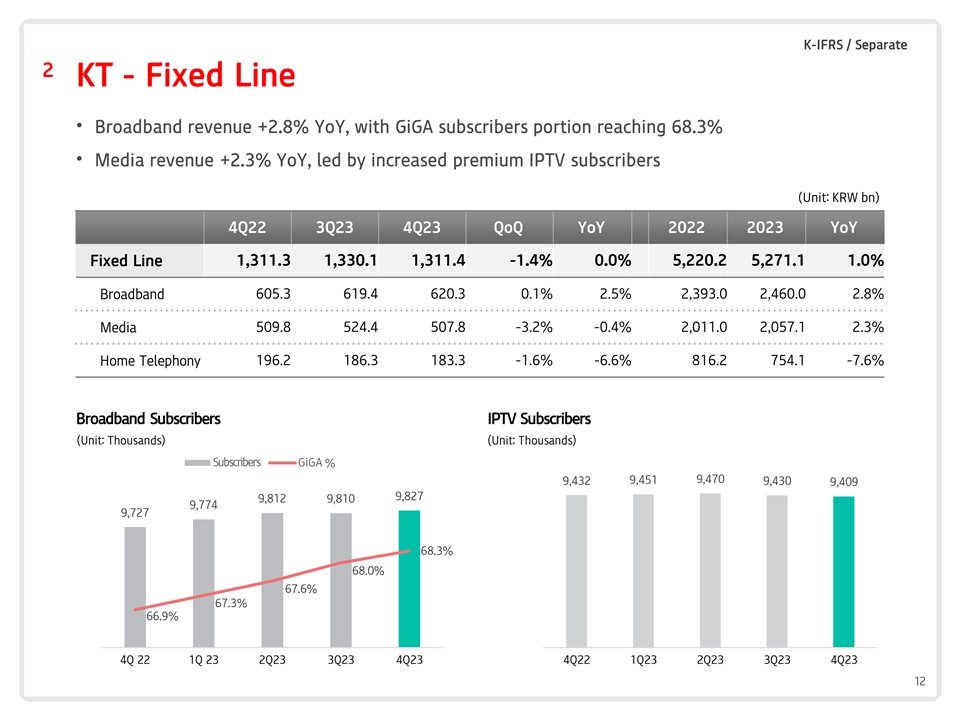
K-IFRS / Separate 2 KT - Fixed Line • Broadband revenue +2.8% YoY,
with GiGA subscribers portion reaching 68.3% • Media revenue +2.3% YoY, led by increased premium IPTV subscribers (Unit: KRW bn) 4Q22 3Q23 4Q23 QoQ YoY 2022 2023 YoY 1,311.3 1,330.1 1,311.4 -1.4% 0.0% 5,220.2 5,271.1 1.0% Fixed Line 605.3
619.4 620.3 0.1% 2.5% 2,393.0 2,460.0 2.8% Broadband 509.8 524.4 507.8 -3.2% -0.4% 2,011.0 2,057.1 2.3% Media 196.2 186.3 183.3 -1.6% -6.6% 816.2 754.1 -7.6% Home Telephony Broadband Subscribers IPTV Subscribers (Unit: Thousands) (Unit: Thousands) S
가입자수 ubscribers GiGA 비중(%) % 9,451 9,470 9,432 9,430 10,000 70.0% 9,409 9,827 9,812 9,810 69.5% 9,774 9,727 69.0% 68.5% 68.3% 9,500 68.0% 68.0% 67.5% 67.6% 67.3% 67.0% 66.9% 66.5% 9,000 66.0% 4Q 22 1Q 23
2Q23 3Q23 4Q23 4Q22 1Q23 2Q23 3Q23 4Q23 12

K-IFRS / Separate 3 KT - B2B Services • B2B Service rev. +2.0% YoY,
through high demand for telco. services and emerging businesses (AI, IoT, etc.) • Corp. Broadband/data revenue +4.7% YoY, driven by increase in data traffic (Unit: KRW bn) 4Q22 3Q23 4Q23 QoQ YoY 2022 2023 YoY B2B Service 835.3 903.8 813.1
-10.0% -2.7% 3,393.8 3,460.4 2.0% Real Estate, etc. 91.6 77.9 84.6 8.6% -7.6% 439.7 331.3 -24.7% Corp. Broadband/Data Revenue Revenue of Strategic Growth Business CAGR 6.0% (5 focal growth businesses) (Unit: KRW bn) CAGR 16.3% (‘20~’23)
(Unit: KRW bn) (‘20~’23) 343 1,276 1,219 335 1,101 1,073 263 218 2020 2021 2022 2023 2020년 2021년 2022년 2023년 2020 2020 년 2021 2021 년 2022 2022 년 2023 2023 년 ※ Corp.
Broadband/data rev includes: ※ 5 focal growth businesses include: Leased line/Kornet/VPN/Global data AICC, IoT, Smart Mobility, Smart Space, Energy Biz. 13

K-IFRS / Consolidated(each subsidiary) 4 Major Subsidiaries • BC Card
rev. +3.3% YoY, through expansion of loan business and increased revenue from Paybooc • kt cloud rev. achieved double-digit growth to reach KRW 678.3bnwith leadership in public cloud and IDC market • kt estate rev. +21.8% YoY led by
uptrend in hotel/office/rental housing and increase in development rev. Revenues for Major Subsidiaries (consolidated) (Unit: KRW bn) 4Q22 3Q23 4Q23 QoQ YoY 2022 2023 YoY BC Card 1,018.2 995.7 1,026.9 3.1% 0.9% 3,895.8 4,025.0 3.3% Skylife 271.1
260.5 262.2 0.6% -3.3% 1,034.2 1,038.7 0.4% 1 Content Subsidiaries 182.9 191.1 194.6 1.8% 6.4% 650.4 687.0 5.6% KT Estate 130.9 142.3 194.0 36.4% 48.2% 488.3 594.5 21.8% 2 kt cloud 158.3 193.8 182.1 -6.0% 15.1% 432.1 678.3 57.0% 1) Content
Subsidiaries : Nasmedia(PlayD incl.), KT Studiogenie(Genie music, Storywiz, and others incl.) 2) kt cloud revenue for 2022 is a total of 2Q~4Q results (established in ‘22.4) Subsidiaries’ OP Contribution (Unit: KRW bn) 196.7 168.7 155.6
129.3 128.5 98.0 69.2 40.3 1Q 22 2Q 22 3Q 22 4Q 22 1Q 23 2Q 23 3Q 23 4Q 23 14

1 2023 Highlights 2 Financial Highlights 3 Business Overview 4 Appendix
15
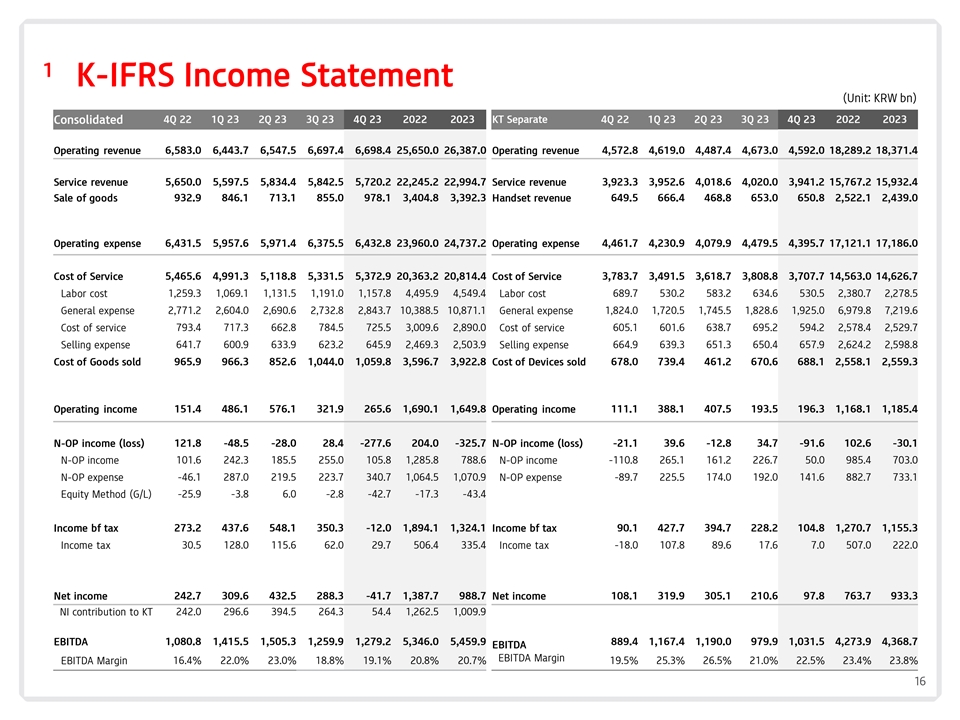
1 K-IFRS Income Statement (Unit: KRW bn) Consolidated 4Q 22 1Q 23 2Q 23 3Q
23 4Q 23 2022 2023 KT Separate 4Q 22 1Q 23 2Q 23 3Q 23 4Q 23 2022 2023 Operating revenue 6,583.0 6,443.7 6,547.5 6,697.4 6,698.4 25,650.0 26,387.0 Operating revenue 4,572.8 4,619.0 4,487.4 4,673.0 4,592.0 18,289.2 18,371.4 Service revenue 5,650.0
5,597.5 5,834.4 5,842.5 5,720.2 22,245.2 22,994.7 Service revenue 3,923.3 3,952.6 4,018.6 4,020.0 3,941.2 15,767.2 15,932.4 Sale of goods 932.9 846.1 713.1 855.0 978.1 3,404.8 3,392.3 Handset revenue 649.5 666.4 468.8 653.0 650.8 2,522.1 2,439.0
Operating expense 6,431.5 5,957.6 5,971.4 6,375.5 6,432.8 23,960.0 24,737.2 Operating expense 4,461.7 4,230.9 4,079.9 4,479.5 4,395.7 17,121.1 17,186.0 5,465.6 4,991.3 5,118.8 5,331.5 5,372.9 20,363.2 20,814.4 3,783.7 3,491.5 3,618.7 3,808.8 3,707.7
14,563.0 14,626.7 Cost of Service Cost of Service Labor cost 1,259.3 1,069.1 1,131.5 1,191.0 1,157.8 4,495.9 4,549.4 Labor cost 689.7 530.2 583.2 634.6 530.5 2,380.7 2,278.5 General expense 2,771.2 2,604.0 2,690.6 2,732.8 2,843.7 10,388.5 10,871.1
General expense 1,824.0 1,720.5 1,745.5 1,828.6 1,925.0 6,979.8 7,219.6 Cost of service 793.4 717.3 662.8 784.5 725.5 3,009.6 2,890.0 Cost of service 605.1 601.6 638.7 695.2 594.2 2,578.4 2,529.7 Selling expense 641.7 600.9 633.9 623.2 645.9 2,469.3
2,503.9 Selling expense 664.9 639.3 651.3 650.4 657.9 2,624.2 2,598.8 965.9 966.3 852.6 1,044.0 1,059.8 3,596.7 3,922.8 678.0 739.4 461.2 670.6 688.1 2,558.1 2,559.3 Cost of Goods sold Cost of Devices sold Operating income 151.4 486.1 576.1 321.9
265.6 1,690.1 1,649.8 Operating income 111.1 388.1 407.5 193.5 196.3 1,168.1 1,185.4 N-OP income (loss) 121.8 -48.5 -28.0 28.4 -277.6 204.0 -325.7 N-OP income (loss) -21.1 39.6 -12.8 34.7 -91.6 102.6 -30.1 101.6 242.3 185.5 255.0 105.8 1,285.8 788.6
-110.8 265.1 161.2 226.7 50.0 985.4 703.0 N-OP income N-OP income N-OP expense -46.1 287.0 219.5 223.7 340.7 1,064.5 1,070.9 N-OP expense -89.7 225.5 174.0 192.0 141.6 882.7 733.1 Equity Method (G/L) -25.9 -3.8 6.0 -2.8 -42.7 -17.3 -43.4 Income bf
tax 273.2 437.6 548.1 350.3 -12.0 1,894.1 1,324.1 Income bf tax 90.1 427.7 394.7 228.2 104.8 1,270.7 1,155.3 Income tax 30.5 128.0 115.6 62.0 29.7 506.4 335.4 Income tax -18.0 107.8 89.6 17.6 7.0 507.0 222.0 Net income 242.7 309.6 432.5 288.3 -41.7
1,387.7 988.7 Net income 108.1 319.9 305.1 210.6 97.8 763.7 933.3 NI contribution to KT 242.0 296.6 394.5 264.3 54.4 1,262.5 1,009.9 1,080.8 1,415.5 1,505.3 1,259.9 1,279.2 5,346.0 5,459.9 889.4 1,167.4 1,190.0 979.9 1,031.5 4,273.9 4,368.7 EBITDA
EBITDA EBITDA Margin EBITDA Margin 16.4% 22.0% 23.0% 18.8% 19.1% 20.8% 20.7% 19.5% 25.3% 26.5% 21.0% 22.5% 23.4% 23.8% 16

2 K-IFRS Balance Sheet (Unit: KRW bn) 4Q 22 1Q 23 2Q 23 3Q 23 4Q 23 4Q 22
1Q 23 2Q 23 3Q 23 4Q 23 Consolidated KT Separate 40,980.7 40,214.4 39,756.0 43,974.8 42,681.3 30,417.8 30,386.9 29,592.2 30,814.8 30,280.2 Assets Assets 12,681.6 12,202.0 11,405.7 15,520.6 14,518.1 6,603.5 6,972.1 6,172.5 7,505.4 7,088.6 Current
assets Current assets 2,449.1 2,109.2 1,805.5 3,110.4 2,879.6 966.3 866.3 625.7 1,477.3 1,242.0 Cash & cash equivalents Cash & cash equi. Trade & other receivables 3,951.8 4,098.7 3,933.1 4,515.4 4,287.3 Trade & other rec. 3,055.6
3,283.3 3,018.4 3,425.8 3,190.3 Inventories 709.2 779.6 636.9 707.4 912.3 Inventories 349.9 380.1 260.1 276.6 368.1 Other current asset 5,571.5 5,214.5 5,030.3 7,187.3 6,438.9 Other current asset 2,231.7 2,442.4 2,268.4 2,325.6 2,288.2 -
Prepaid_Contract cost 1,307.2 1,284.2 1,269.5 1,270.3 1,252.1 - Prepaid_Contract cost 1,386.3 1,367.2 1,351.6 1,360.3 1,340.2 - Contract assets 565.8 560.0 565.8 590.7 581.8 - Contract assets 493.4 488.2 500.3 527.0 535.8 28,299.1 28,012.6 28,350.3
28,454.1 28,163.1 23,814.3 23,414.8 23,419.6 23,309.4 23,191.6 Non-current assets Non-current assets 609.4 473.9 490.7 406.0 451.7 527.0 399.4 402.8 322.1 370.7 Trade & other rec Trade & other rec Tangible assets 14,772.2 14,562.2 14,675.6
14,669.9 14,872.1 Tangible assets 11,540.2 11,240.4 11,276.3 11,288.5 11,492.8 Other current assets 12,917.5 12,976.5 13,184.0 13,378.2 12,839.4 Other current assets 10,764.1 10,793.7 10,775.2 10,753.0 10,380.2 - Prepaid_Contract cost 510.4 484.7
480.4 486.0 475.4 - Prepaid_Contract cost 496.8 476.0 469.8 478.7 464.2 - Contract assets 236.4 232.7 236.8 248.7 240.1 - Contract assets 186.0 183.1 196.3 227.5 219.1 22,566.0 22,062.4 21,302.3 25,253.1 24,120.2 15,559.7 15,766.5 14,817.5 15,831.4
15,236.7 Liabilities Liabilities 10,699.3 10,164.8 9,862.9 13,478.5 13,147.4 6,321.4 6,582.7 6,153.7 6,925.2 6,957.5 Current liabilities Current liabilities 7,371.0 6,424.7 6,225.9 9,264.6 8,054.9 4,672.6 4,477.0 4,253.7 5,021.2 4,459.0 Trade &
other payables Trade & other payables Short-term borrowings 1,827.0 2,224.2 2,105.6 2,368.7 3,058.6 Short-term borrowings 984.7 1,359.5 1,131.5 1,173.8 1,725.2 Others 1,501.2 1,515.9 1,531.4 1,845.2 2,033.9 Others 664.1 746.2 768.6 730.2 773.3 -
Contract liabilities 242.4 264.3 264.1 245.2 229.2 - Contract liabilities 241.0 256.4 235.1 222.6 223.9 11,866.7 11,897.7 11,439.4 11,774.6 10,972.7 9,238.2 9,183.8 8,663.8 8,906.2 8,279.2 Non-current liabilities Non-current liabilities 1,064.1
833.6 818.5 856.0 819.6 1,620.6 1,342.5 1,331.9 1,337.9 1,336.1 Trade & other payables Trade & other payables Long-term borrowings 8,179.6 8,352.9 7,930.4 7,940.8 7,159.6 Long-term borrowings 6,510.8 6,675.8 6,205.6 6,497.5 5,834.7 Others
2,622.9 2,711.2 2,690.5 2,977.9 2,993.6 Others 1,106.8 1,165.5 1,126.3 1,070.8 1,108.4 - Contract liabilities 41.7 44.5 39.3 37.2 49.6 - Contract liabilities 40.4 43.1 33.8 32.4 35.8 18,414.7 18,152.0 18,453.7 18,721.7 18,561.1 14,858.1 14,620.4
14,774.7 14,983.4 15,043.5 Equity Equity Retained earnings 14,257.3 14,008.3 14,404.0 14,570.7 14,494.4 12,347.4 12,123.3 12,429.0 12,541.3 12,544.4 Retained earnings 17

K-IFRS / Separate 3 Subscribers (Unit: Thousands) Wireless 4Q22 1Q 23 2Q 23
3Q 23 4Q 23 QoQ YoY Total 24,062 24,332 24,621 24,903 24,897 0.0% 3.5% - MNO 17,500 17,505 17,643 17,735 17,759 0.1% 1.5% └ 5G 8,449 8,882 9,213 9,514 9,834 3.4% 16.4% └ 4G(LTE) 8,310 8,003 7,855 7,669 7,393 -3.6% -11.0% - MVNO 6,562
6,827 6,978 7,168 7,138 -0.4% 8.8% 1) Churn rate 1.3% 1.0% 1.0% 1.1% 1.1% 0.0%p -0.2%p 2) ARPU (KRW) 33,542 33,771 33,948 33,838 34,302 1.4% 2.3% 1) Churn rate : Based on MNO subscribers (excludes IoT) 2) ARPU = = Wireless revenue* / Wireless
subscribers** * Wireless revenue(3G, LTE, 5G included): Revenue of Voice and Data usage (Interconnection/Subscription fee excluded), VAS, Contract/ Bundled Discounts, and etc. included ** Wireless subscribers: Based on MSIT’s guidelines for
average billed subscribers in quarter (IoT/M2M excluded) (Unit: Thousands) Fixed Line/IPTV 4Q 22 1Q 23 2Q 23 3Q 23 4Q 23 QoQ YoY Telephony 12,581 12,445 12,310 12,184 12,035 -1.2% -4.3% - PSTN 9,376 9,226 9,089 8,960 8,820 -1.6% -5.9% - VoIP 3,206
3,219 3,221 3,225 3,215 -0.3% 0.3% Broadband 9,727 9,774 9,812 9,810 9,827 0.2% 1.0% IPTV (GTV+GTS) 9,432 9,451 9,470 9,430 9,409 -0.2% -0.2% ※ Number of IPTV subscribers above differs from MSIT figures that follow the IPTV law - Number of KT
pay TV subscribers in 1H 2023 is 8,865,968 (6-month average) 18

KT (NYSE:KT)
Graphique Historique de l'Action
De Avr 2024 à Mai 2024

KT (NYSE:KT)
Graphique Historique de l'Action
De Mai 2023 à Mai 2024
