SECURITIES AND EXCHANGE COMMISSION
Washington, D.C. 20549
Form 6-K
REPORT OF
FOREIGN PRIVATE ISSUER
PURSUANT TO RULE 13a-16 OR
15d-16 OF
THE SECURITIES EXCHANGE ACT OF 1934
For the month of November 2023
Commission File Number 1-14926
KT Corporation
(Translation of registrant’s name into English)
90, Buljeong-ro,
Bundang-gu,
Seongnam-si,
Gyeonggi-do,
Korea
(Address of
principal executive offices)
Indicate by check mark whether the registrant files or will file annual reports under cover of Form
20-F or Form 40-F:
Form
20-F ☒ Form 40-F ☐
SIGNATURES
Pursuant to the requirements of the Securities Exchange Act of 1934, the registrant has duly caused this report to be signed on its behalf by
the undersigned, thereunto duly authorized.
|
|
|
| Dated: November 7, 2023 |
| KT Corporation |
|
|
| By: |
|
/s/ Seunghoon Chi |
| Name: Seunghoon Chi |
| Title: Vice President |
|
|
| By: |
|
/s/ Sanghyun Cho |
| Name: Sanghyun Cho |
| Title: Director |
KT 3Q23 Earnings Release
Disclaimer This presentation has been prepared by KT Corp.(the
“Company”) in accordance with K-IFRS. This presentation contains forward-looking statements, which are subject to risks, uncertainties, and assumptions. This presentation is being presented solely for your information and is subject to
change without notice. No presentation or warranty, expressed or implied, is made and no reliance should be placed on the accuracy, actuality, fairness, or completeness of the information presented. st The Company has applied new accounting standard
of K-IFRS 1115 as of Jan 1 , 2018 and K-IFRS 1116 ‘Leases’ as st of Jan 1 , 2019. There are no obligation to apply the new standard to previous financial statements. The Company, its affiliates or representatives accept no liability
whatsoever for any losses arising from any information contained in the presentation. This presentation does not constitute an offer or invitation to purchase or subscribe for any shares of the Company, and no part of this presentation shall form
the Basis of or be relied upon in connection with any contract or commitment. Any decision to purchase shares of the Company could be made solely on the Basis of information, which has been publicly filed with the Securities and Exchange Commission
or the Korea Stock Exchange and distributed to all investors. The contents of this presentation may not be reproduced, redistributed or passed on, directly or indirectly, to any other person or published, in whole or in part, for any purpose. If you
have any questions related to this material, please contact the IR department. Tel: +82-2-3495-3254, 3262, 3265, 3557, 3558, 3564, 3595, 5339, 5341, 5344 Fax: +82-2-3495-5917 2
2 Financial Highlights 3 Business Overview 4 Appendix 3

1 3Q23 Highlights Financials Continued robust growth of B2C/B2B businesses
and subsidiaries (Unit: KRW) Consolidated KT Separate Revenue 4,673.0bn (YoY +1.8%) 6,697.4bn (YoY +3.4%) Operating 321.9bn (YoY -28.9%) 193.5bn (YoY -40.2%) Profit ※ Excluding the impact of wage negotiation results and content sourcing cost
smoothing, OP(separate) 383.7bn(YoY +18.6%), OP(cons.) 512.2bn (YoY +13.1%) Key Performance Shareholder Return KRW KT(sep), 4tr. Service Revenue for 2 Consec. Quarters FY’23~’25 Shareholder Return Policy (Announced Oct 17) • B2C,
continues growth through premium subscribers• Resource : 50% of adjusted net income (KT stand-alone) - Wireless YoY +1.6%, Fixed Line YoY +1.8% (Rev.) • Method : Cash dividend, share buyback & cancellation • B2B, DX business
accelerates with 『CT+IT』 expertise• Cash Dividend : Minimum FY2022 DPS level - Enterprise DX YoY +16.1% (Rev.) • Quarterly Dividend : 2024 1Q ~ (after AOI amendment) Subsidiaries, Growth of Major Group Portfolios Management
Strategy 『Digital Service-First』 based on 『CT+IT』 Expertise • BC Card, PLCC and loan businesses lead growth • KT Studiogenie, Originals(Not Others, The Kidnapping Day)show strong ratings• Enhance
competitiveness through differentiated services • Strengthen and integrate IT capabilities based on Telco(CT) • kt cloud, project orders and IDC demand increase • Focus on fundamentals and essentials for sturdy growth • Real
Estate, hotel business & Apt. sales on the rise 4
1 3Q23 Highlights 2 Financial Highlights 3 Business Overview 4 Appendix
5
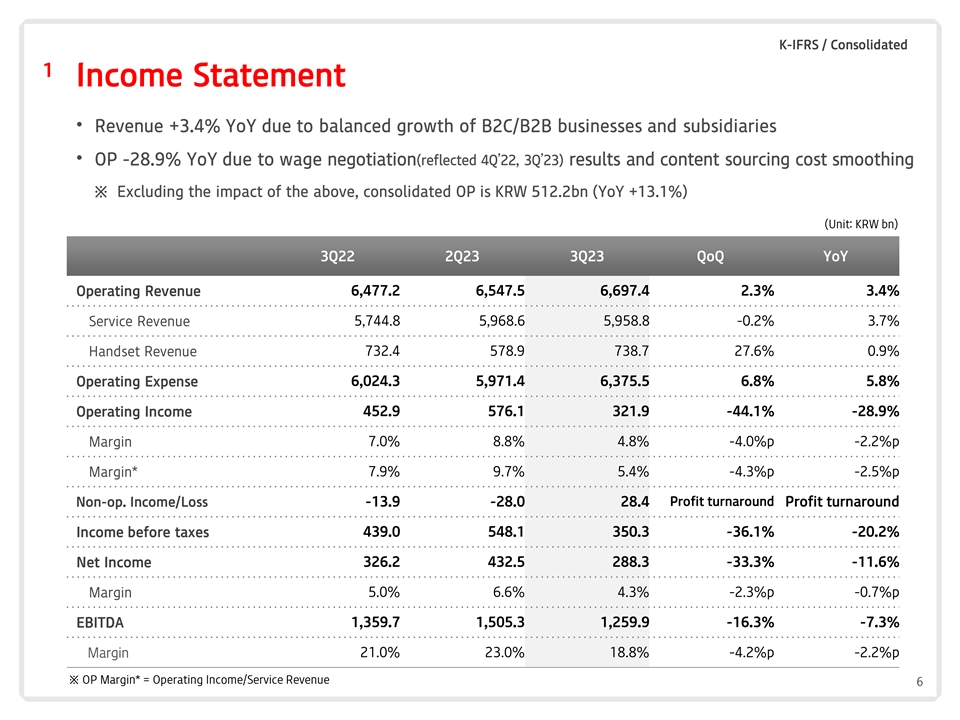
K-IFRS / Consolidated 1 Income Statement • Revenue +3.4% YoY due to
balanced growth of B2C/B2B businesses and subsidiaries • OP -28.9% YoY due to wage negotiation(reflected 4Q’22, 3Q’23) results and content sourcing cost smoothing ※ Excluding the impact of the above, consolidated OP is KRW
512.2bn (YoY +13.1%) (Unit: KRW bn) 3Q22 2Q23 3Q23 QoQ YoY Operating Revenue 6,477.2 6,547.5 6,697.4 2.3% 3.4% Service Revenue 5,744.8 5,968.6 5,958.8 -0.2% 3.7% 732.4 578.9 738.7 27.6% 0.9% Handset Revenue Operating Expense 6,024.3 5,971.4 6,375.5
6.8% 5.8% 452.9 576.1 321.9 -44.1% -28.9% Operating Income Margin 7.0% 8.8% 4.8% -4.0%p -2.2%p Margin* 7.9% 9.7% 5.4% -4.3%p -2.5%p Non-op. Income/Loss -13.9 -28.0 28.4 Profit turnaround Profit turnaround Income before taxes 439.0 548.1 350.3 -36.1%
-20.2% 326.2 432.5 288.3 -33.3% -11.6% Net Income Margin 5.0% 6.6% 4.3% -2.3%p -0.7%p EBITDA 1,359.7 1,505.3 1,259.9 -16.3% -7.3% 21.0% 23.0% 18.8% -4.2%p -2.2%p Margin ※ OP Margin* = Operating Income/Service Revenue 6
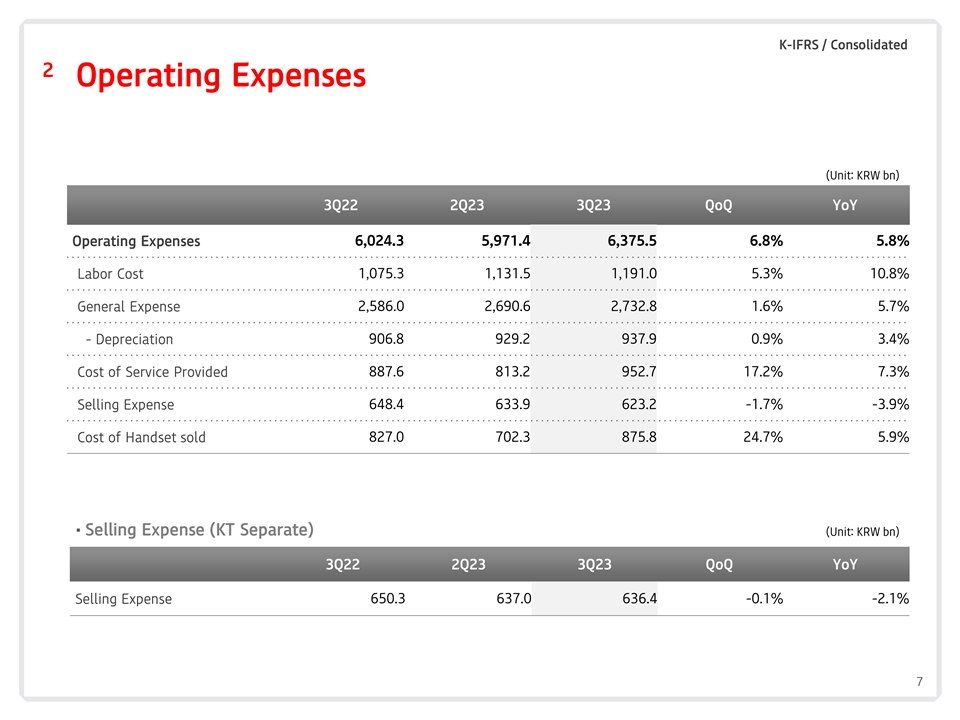
K-IFRS / Consolidated 2 Operating Expenses (Unit: KRW bn) 3Q22 2Q23 3Q23 QoQ
YoY Operating Expenses 6,024.3 5,971.4 6,375.5 6.8% 5.8% Labor Cost 1,075.3 1,131.5 1,191.0 5.3% 10.8% General Expense 2,586.0 2,690.6 2,732.8 1.6% 5.7% - Depreciation 906.8 929.2 937.9 0.9% 3.4% Cost of Service Provided 887.6 813.2 952.7 17.2% 7.3%
648.4 633.9 623.2 -1.7% -3.9% Selling Expense Cost of Handset sold 827.0 702.3 875.8 24.7% 5.9% ▪ Selling Expense (KT Separate) (Unit: KRW bn) 3Q22 2Q23 3Q23 QoQ YoY Selling Expense 650.3 637.0 636.4 -0.1% -2.1% 7
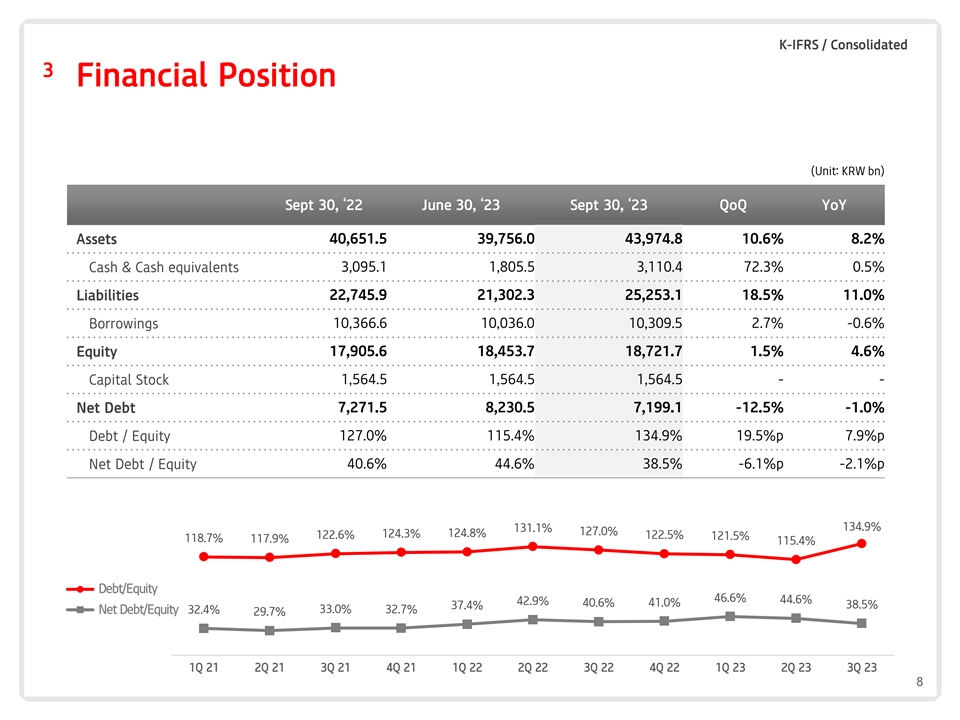
K-IFRS / Consolidated 3 Financial Position (Unit: KRW bn) Sept 30,
‘22 June 30, ‘23 Sept 30, ‘23 QoQ YoY Assets 40,651.5 39,756.0 43,974.8 10.6% 8.2% Cash & Cash equivalents 3,095.1 1,805.5 3,110.4 72.3% 0.5% 22,745.9 21,302.3 25,253.1 18.5% 11.0% Liabilities 10,366.6 10,036.0 10,309.5 2.7%
-0.6% Borrowings 17,905.6 18,453.7 18,721.7 1.5% 4.6% Equity 1,564.5 1,564.5 1,564.5 - - Capital Stock Net Debt 7,271.5 8,230.5 7,199.1 -12.5% -1.0% Debt / Equity 127.0% 115.4% 134.9% 19.5%p 7.9%p Net Debt / Equity 40.6% 44.6% 38.5% -6.1%p -2.1%p
134.9% 131.1% 127.0% 124.8% 124.3% 122.6% 122.5% 121.5% 118.7% 117.9% 115.4% D 부채비율 ebt/Equity 46.6% 44.6% 42.9% 41.0% 40.6% 38.5% 37.4% 33.0% 32.7% N 순부채비율 et Debt/Equity 32.4% 29.7% 1Q
21 2Q 21 3Q 21 4Q 21 1Q 22 2Q 22 3Q 22 4Q 22 1Q 23 2Q 23 3Q 23 8
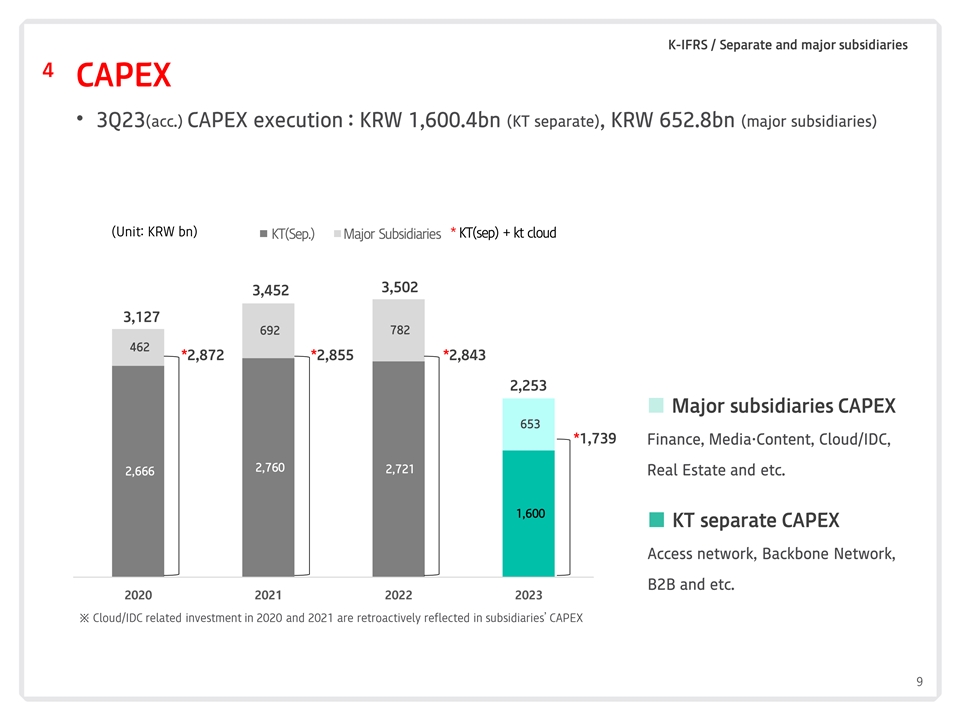
K-IFRS / Separate and major subsidiaries 4 CAPEX • 3Q23(acc.) CAPEX
execution : KRW 1,600.4bn (KT separate), KRW 652.8bn (major subsidiaries) (Unit: KRW bn) KT KT((S 별도 ep.)) M 주요 ajor그룹사 Subsidiaries * KT(sep) + kt cloud 3,502 3,452 3,127 692 782 462 *2,872 *2,855
*2,843 2,253 ■ Major subsidiaries CAPEX 653 *1,739 Finance, Media·Content, Cloud/IDC, 2,760 2,721 2,666 Real Estate and etc. 1,600 ■ KT separate CAPEX Access network, Backbone Network, B2B and etc. 2020 2021 2022 2023 ※
Cloud/IDC related investment in 2020 and 2021 are retroactively reflected in subsidiaries’ CAPEX 9
1 3Q23 Highlights 2 Financial Highlights 3 Business Overview 4 Appendix
10
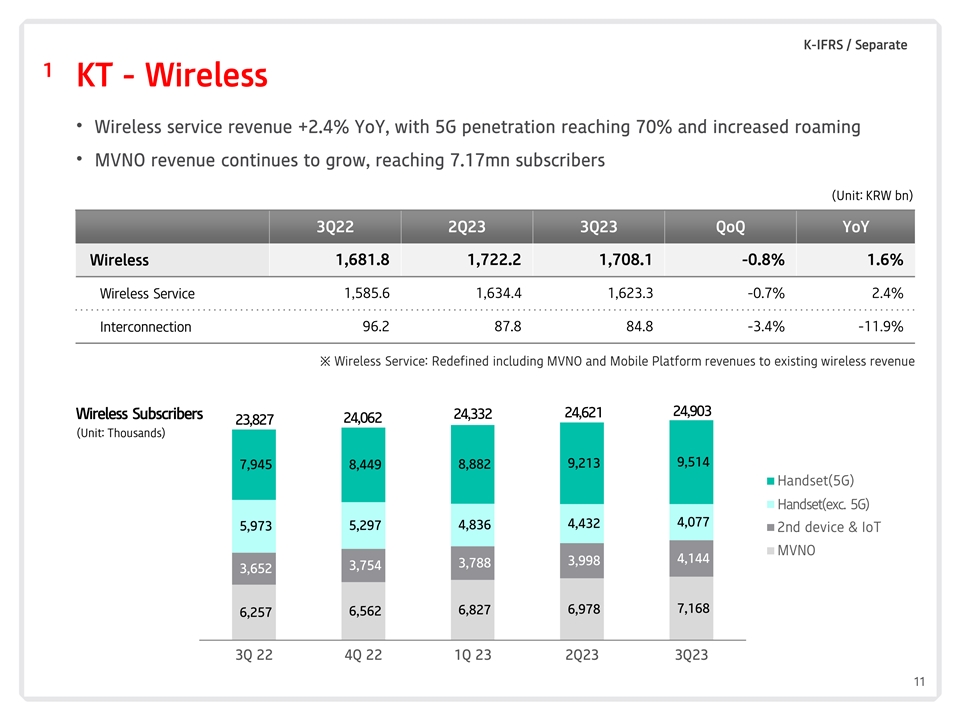
K-IFRS / Separate 1 KT - Wireless • Wireless service revenue +2.4%
YoY, with 5G penetration reaching 70% and increased roaming • MVNO revenue continues to grow, reaching 7.17mn subscribers (Unit: KRW bn) 3Q22 2Q23 3Q23 QoQ YoY Wireless 1,681.8 1,722.2 1,708.1 -0.8% 1.6% Wireless Service 1,585.6 1,634.4
1,623.3 -0.7% 2.4% Interconnection 96.2 87.8 84.8 -3.4% -11.9% ※ Wireless Service: Redefined including MVNO and Mobile Platform revenues to existing wireless revenue 24,903 24,621 24,332 Wireless Subscribers 24,062 23,827 (Unit: Thousands)
9,514 9,213 7,945 8,449 8,882 Handset(5G) H Ha an nd dss ee t(te (5 xcG . 외 5G)) 4,077 4,432 4,836 5,973 5,297 2nd device & IoT MVNO 4,144 3,998 3,788 3,754 3,652 7,168 6,827 6,978 6,562 6,257 3Q 22 4Q 22 1Q 23 2Q23 3Q23 11

K-IFRS / Separate 2 KT – Fixed Line • Broadband revenue +3.2%
YoY, with GiGA subscribers portion reaching 68% • Media revenue +3.9% YoY, led by increased premium IPTV subscribers (Unit: KRW bn) 3Q22 2Q23 3Q23 QoQ YoY Fixed Line 1,306.4 1,320.7 1,330.1 0.7% 1.8% Broadband 6,00.3 612.4 619.4 1.2% 3.2%
Media 504.5 518.0 524.4 1.2% 3.9% Home Telephony 201.6 190.4 186.3 -2.1% -7.6% IPTV Subscribers Broadband Subscribers (Unit: Thousands) (Unit: Thousands) 9,470 9,451 9,812 9,432 9,430 9,810 9,399 9,774 9,727 9,679 68.0% 67.6% 67.3% 66.9% 66.6% 3Q 22
4Q 22 1Q 23 2Q23 3Q23 3Q22 4Q22 1Q23 2Q23 3Q23 Subscribers 가입자수 GiGA % 비중(%) ※ Number of IPTV subscribers above differs from MSIT figures that follow the IPTV law - MSIT’s number of KT pay TV
subscribers is 8,783,984 in 2H 2022 (6 month average) 12

K-IFRS / Separate 3 KT – B2B Service • B2B Service revenue
+2.7% YoY, led mainly by gradual monetization of B2B DX project orders • Enterprise DX revenue +16.1% YoY with increased revenue realized from existing orders (Unit: KRW bn) 3Q22 2Q23 3Q23 QoQ YoY B2B Service 956.2 975.8 981.7 0.6% 2.7% 369.6
367.2 353.8 -3.6% -4.3% Corp. Broadband/data 309.2 335.0 359.0 7.2% 16.1% Enterprise DX 90.9 86.1 85.0 -1.3% -6.5% Corp. Telephony AI/New Biz 120.3 103.0 106.0 3.0% -11.9% Real Estate, etc. 66.2 84.5 77.9 -7.9% 17.6% ※ Corp. Telephony : MVNO
revenue excluded (moved to wireless service) Enterprise DX : remaining IDC/Cloud revenues after establishing kt cloud included B2B Highlights Major B2B orders monetized and continued growth of leased line services √ M-BcN(Military Broadband
Convergence Network) √ Traffic increase from large CPs, high demand for Flexline Provides high-speed internet connectivity for Increased corp. BB/data traffic led by global OTTs, military units including the army, navy, air force, and rising
demand for newly launched “Flexline” Marine Corps, and Defense units nationwide *Flexline : Corporate service that provides SD-WAN, bandwidth-adjustable flexible lines, integrated management, and cloud connectivity 13

K-IFRS / Consolidated(each subsidiary) 4 Major Subsidiaries • BC
Card, revenue +1.2% YoY through continued expansion of PLCC revenue and loan business • kt cloud, revenue +34.5% YoY with new private cloud project orders and continued growth of IDC business • kt estate, revenue +30.3% YoY led mainly by
hotel revenue growth and increase in property sales (Unit: KRW bn) Revenues for Major Subsidiaries (consolidated) 3Q22 2Q23 3Q23 QoQ YoY 984.2 1,049.2 995.7 -5.1% 1.2% BC Card Skylife 268.1 261.3 260.5 -0.3% -2.8% Content Subsidiaries 301.2 268.9
290.4 8.0% -3.9% 109.2 145.4 142.3 -2.1% 30.3% KT Estate kt cloud 144.1 153.8 193.8 26.0% 34.5% ※ Content Subsidiaries : Nasmedia(PlayD incl.), KT alpha, KT Studiogenie(Genie music, Storywiz, and others incl.) Subsidiaries’ OP
Contribution 277.5 (Unit: KRW bn) 196.7 168.7 155.6 129.3 128.5 124.7 123.3 98.0 78.2 40.3 1Q 21 2Q 21 3Q 21 4Q 21 1Q 22 2Q 22 3Q 22 4Q 22 1Q 23 2Q 23 3Q 23 14
1 3Q23 Highlights 2 Financial Highlights 3 Business Overview 4 Appendix
15
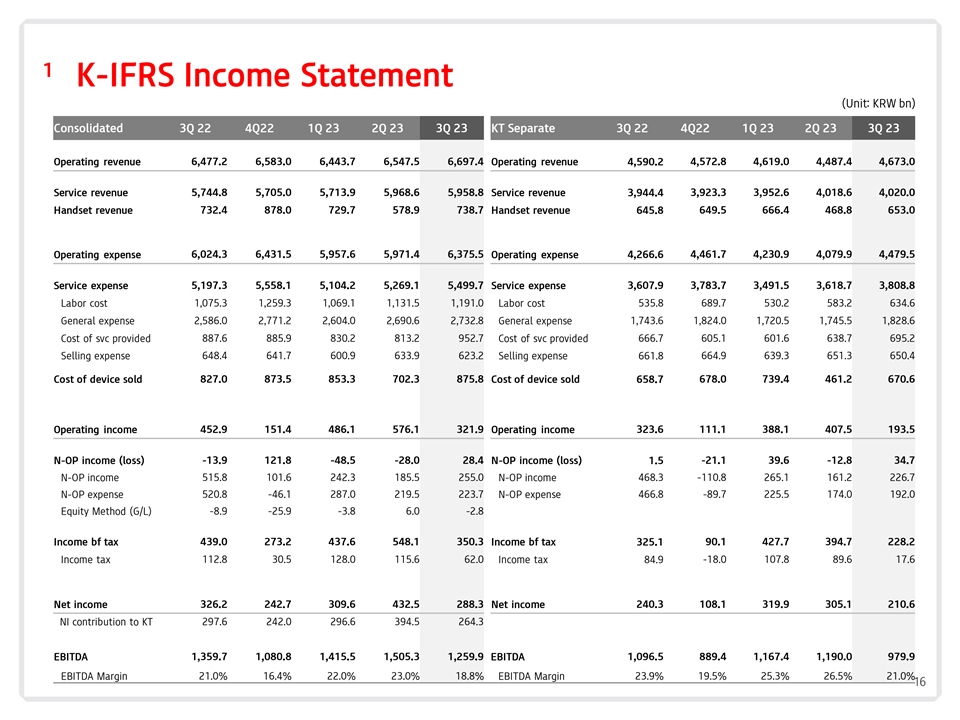
1 K-IFRS Income Statement (Unit: KRW bn) Consolidated 3Q 22 4Q22 1Q 23 2Q
23 3Q 23 KT Separate 3Q 22 4Q22 1Q 23 2Q 23 3Q 23 6,477.2 6,583.0 6,443.7 6,547.5 6,697.4 4,572.8 4,619.0 4,487.4 4,673.0 Operating revenue Operating revenue 4,590.2 Service revenue 5,744.8 5,705.0 5,713.9 5,968.6 5,958.8 Service revenue 3,944.4
3,923.3 3,952.6 4,018.6 4,020.0 Handset revenue 732.4 878.0 729.7 578.9 738.7 Handset revenue 645.8 649.5 666.4 468.8 653.0 Operating expense 6,024.3 6,431.5 5,957.6 5,971.4 6,375.5 Operating expense 4,266.6 4,461.7 4,230.9 4,079.9 4,479.5 Service
expense 5,197.3 5,558.1 5,104.2 5,269.1 5,499.7 Service expense 3,607.9 3,783.7 3,491.5 3,618.7 3,808.8 1,075.3 1,259.3 1,069.1 1,131.5 1,191.0 689.7 530.2 583.2 634.6 Labor cost Labor cost 535.8 General expense 2,586.0 2,771.2 2,604.0 2,690.6
2,732.8 General expense 1,743.6 1,824.0 1,720.5 1,745.5 1,828.6 Cost of svc provided 887.6 885.9 830.2 813.2 952.7 Cost of svc provided 666.7 605.1 601.6 638.7 695.2 Selling expense 648.4 641.7 600.9 633.9 623.2 Selling expense 661.8 664.9 639.3
651.3 650.4 Cost of device sold 827.0 873.5 853.3 702.3 875.8 Cost of device sold 658.7 678.0 739.4 461.2 670.6 Operating income 452.9 151.4 486.1 576.1 321.9 Operating income 323.6 111.1 388.1 407.5 193.5 -13.9 121.8 -48.5 -28.0 28.4 -21.1 39.6
-12.8 34.7 N-OP income (loss) N-OP income (loss) 1.5 515.8 101.6 242.3 185.5 255.0 468.3 -110.8 265.1 161.2 226.7 N-OP income N-OP income N-OP expense 520.8 -46.1 287.0 219.5 223.7 N-OP expense 466.8 -89.7 225.5 174.0 192.0 Equity Method (G/L) -8.9
-25.9 -3.8 6.0 -2.8 Income bf tax 439.0 273.2 437.6 548.1 350.3 Income bf tax 325.1 90.1 427.7 394.7 228.2 Income tax 112.8 30.5 128.0 115.6 62.0 Income tax 84.9 -18.0 107.8 89.6 17.6 326.2 242.7 309.6 432.5 288.3 108.1 319.9 305.1 210.6 Net income
Net income 240.3 NI contribution to KT 297.6 242.0 296.6 394.5 264.3 EBITDA 1,359.7 1,080.8 1,415.5 1,505.3 1,259.9 EBITDA 1,096.5 889.4 1,167.4 1,190.0 979.9 EBITDA Margin 21.0% 16.4% 22.0% 23.0% 18.8% EBITDA Margin 23.9% 19.5% 25.3% 26.5% 21.0%
16

2 K-IFRS Balance Sheet (Unit: KRW bn) Consolidated 3Q 22 4Q22 1Q 23 2Q 23
3Q 23 KT Separate 3Q 22 4Q22 1Q 23 2Q 23 3Q 23 40,651.5 40,980.7 40,214.4 39,756.0 43,974.8 30,417.8 30,386.9 29,592.2 30,814.8 Assets Assets 31,055.2 13,042.2 12,681.6 12,202.0 11,405.7 15,520.6 7,612.4 6,603.5 6,972.1 6,172.5 7,505.4 Current
assets Current assets Cash & cash equi. 3,095.1 2,449.1 2,109.2 1,805.5 3,110.4 Cash & cash equi. 1,645.1 966.3 866.3 625.7 1,477.3 Trade & other rec 4,095.0 3,951.8 4,098.7 3,933.1 4,515.4 Trade & other rec 3,294.1 3,055.6 3,283.3
3,018.4 3,425.8 Inventories 675.7 709.2 779.6 636.9 707.4 Inventories 300.4 349.9 380.1 260.1 276.6 Other current asset 5,176.5 5,571.5 5,214.5 5,030.3 7,187.3 Other current asset 2,372.9 2,231.7 2,442.4 2,268.4 2,325.6 - Prepaid_Contract cost
1,313.5 1,307.2 1,284.2 1,269.5 1,270.3 - Prepaid_Contract cost 1,391.1 1,386.3 1,367.2 1,351.6 1,360.3 - Contract assets 565.8 565.8 560.0 565.8 590.7 - Contract assets 499.5 493.4 488.2 500.3 546.6 27,609.3 28,299.1 28,012.6 28,350.3 28,454.1
23,442.8 23,814.3 23,414.8 23,419.6 23,309.4 Non-current assets Non-current assets Trade & other rec 578.0 609.4 473.9 490.7 406.0 Trade & other rec 485.8 527.0 399.4 402.8 322.1 Tangible assets 14,466.0 14,772.2 14,562.2 14,675.6 14,669.9
Tangible assets 11,209.0 11,540.2 11,240.4 11,276.3 11,288.5 Other current assets 12,565.2 12,917.5 12,976.5 13,184.0 13,378.2 Other current assets 10,745.3 10,764.1 10,793.7 10,775.2 10,753.0 - Prepaid_Contract cost 515.8 510.4 484.7 480.4 486.0 -
Prepaid_Contract cost 500.7 496.8 476.0 469.8 495.8 - Contract assets 249.3 236.4 232.7 236.8 248.7 - Contract assets 194.2 186.0 183.1 196.3 172.1 22,745.9 22,566.0 22,062.4 21,302.3 25,253.1 16,401.5 15,559.7 15,766.5 14,817.5 15,831.4 Liabilities
Liabilities 10,583.6 10,699.3 10,164.8 9,862.9 13,478.5 6,848.2 6,321.4 6,582.7 6,153.7 6,925.2 Current liabilities Current liabilities Trade & other payables 6,795.4 7,371.0 6,424.7 6,225.9 9,264.6 Trade & other payables 4,628.6 4,672.6
4,477.0 4,253.7 5,021.2 2,052.0 1,827.0 2,224.2 2,105.6 2,368.7 1,358.0 984.7 1,359.5 1,131.5 1,173.8 Short-term borrowings Short-term borrowings 1,736.3 1,501.2 1,515.9 1,531.4 1,845.2 861.6 664.1 746.2 768.6 730.2 Others Others 251.6 242.4 264.3
264.1 245.2 249.7 241.0 256.4 235.1 222.6 - Contract liabilities - Contract liabilities 12,162.3 11,866.7 11,897.7 11,439.4 11,774.6 9,238.2 9,183.8 8,663.8 8,906.2 Non-current liabilities Non-current liabilities 9,553.4 1,087.9 1,064.1 833.6 818.5
856.0 1,644.0 1,620.6 1,342.5 1,331.9 1,337.9 Trade & other payables Trade & other payables 8,314.6 8,179.6 8,352.9 7,930.4 7,940.8 6,850.7 6,510.8 6,675.8 6,205.6 6,497.5 Long-term borrowings Long-term borrowings 2,759.8 2,622.9 2,711.2
2,690.5 2,977.9 1,058.7 1,106.8 1,165.5 1,126.3 1,070.8 Others Others 34.1 41.7 44.5 39.3 37.2 33.1 40.4 43.1 33.8 32.4 - Contract liabilities - Contract liabilities 17,905.6 18,414.7 18,152.0 18,453.7 18,721.7 14,653.7 14,858.1 14,620.4 14,774.7
14,983.4 Equity Equity Retained earnings 13,857.3 14,257.3 14,008.3 14,404.0 14,570.7 12,121.9 12,347.4 12,123.3 12,429.0 12,541.3 Retained earnings 17
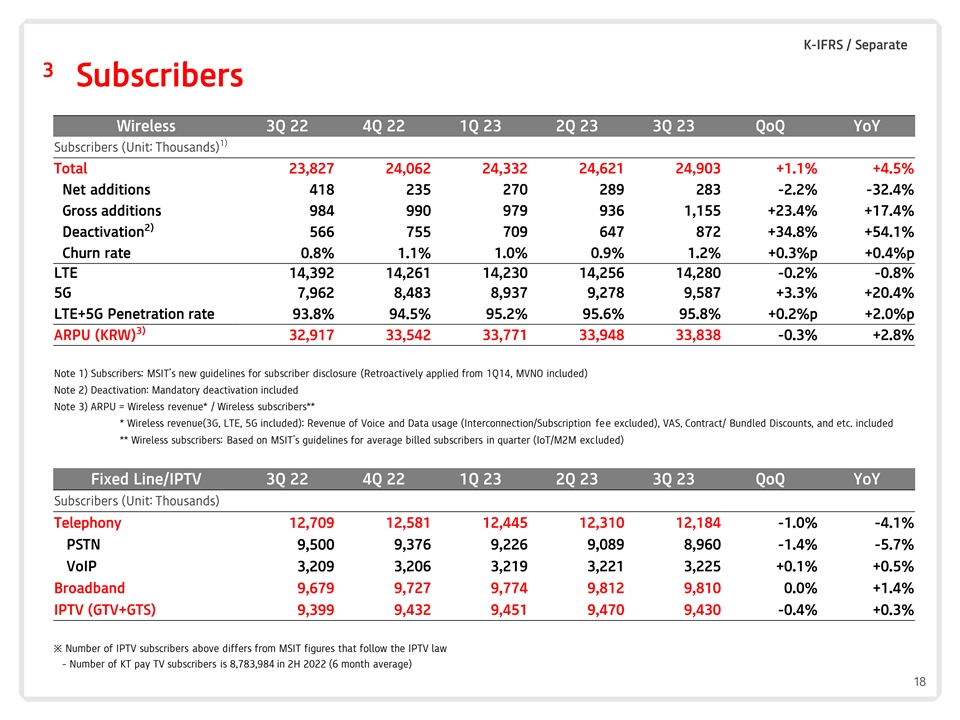
K-IFRS / Separate 3 Subscribers Wireless 3Q 22 4Q 22 1Q 23 2Q 23 3Q 23 QoQ
YoY 1) Subscribers (Unit: Thousands) Total 23,827 24,062 24,332 24,621 24,903 +1.1% +4.5% Net additions 418 235 270 289 283 -2.2% -32.4% Gross additions 984 990 979 936 1,155 +23.4% +17.4% 2) Deactivation 566 755 709 647 872 +34.8% +54.1% Churn rate
0.8% 1.1% 1.0% 0.9% 1.2% +0.3%p +0.4%p LTE 14,392 14,261 14,230 14,256 14,280 -0.2% -0.8% 5G 7,962 8,483 8,937 9,278 9,587 +3.3% +20.4% LTE+5G Penetration rate 95.2% 95.6% 95.8% +0.2%p +2.0%p 93.8% 94.5% 3) ARPU (KRW) 32,917 33,542 33,771 33,948
33,838 -0.3% +2.8% Note 1) Subscribers: MSIT’s new guidelines for subscriber disclosure (Retroactively applied from 1Q14, MVNO included) Note 2) Deactivation: Mandatory deactivation included Note 3) ARPU = Wireless revenue* / Wireless
subscribers** * Wireless revenue(3G, LTE, 5G included): Revenue of Voice and Data usage (Interconnection/Subscription fee excluded), VAS, Contract/ Bundled Discounts, and etc. included ** Wireless subscribers: Based on MSIT’s guidelines for
average billed subscribers in quarter (IoT/M2M excluded) Fixed Line/IPTV 3Q 22 4Q 22 1Q 23 2Q 23 3Q 23 QoQ YoY Subscribers (Unit: Thousands) Telephony 12,709 12,581 12,445 12,310 12,184 -1.0% -4.1% PSTN 9,376 9,226 9,089 8,960 -1.4% -5.7% 9,500 VoIP
3,209 3,206 3,219 3,221 3,225 +0.1% +0.5% Broadband 9,679 9,727 9,774 9,812 9,810 0.0% +1.4% IPTV (GTV+GTS) 9,432 9,451 9,470 9,430 -0.4% +0.3% 9,399 ※ Number of IPTV subscribers above differs from MSIT figures that follow the IPTV law -
Number of KT pay TV subscribers is 8,783,984 in 2H 2022 (6 month average) 18

KT (NYSE:KT)
Graphique Historique de l'Action
De Avr 2024 à Mai 2024

KT (NYSE:KT)
Graphique Historique de l'Action
De Mai 2023 à Mai 2024
