UNITED
STATES
SECURITIES AND EXCHANGE COMMISSION
WASHINGTON, D.C. 20549
FORM 6-K
REPORT OF FOREIGN PRIVATE ISSUER
PURSUANT TO RULE 13a-16 OR 15d-16
OF THE SECURITIES EXCHANGE ACT OF 1934
For the Month of August 2024
Commission File Number: 001-41569
LANVIN GROUP HOLDINGS LIMITED
4F, 168 Jiujiang Road,
Carlowitz & Co, Huangpu District
Shanghai, 200001, China
(Address of principal executive offices)
Indicate by check mark whether the registrant
files or will file annual reports under cover of Form 20-F or Form 40-F.
INCORPORATION
BY REFERENCE
Exhibits 99.1 and 99.2 to
this Form 6-K are incorporated by reference into the registration statement on Form F-3 (No. 333-276476), the post-effective amendment
No. 4 to Form F-1 on Form F-3 (No. 333-269150) and the registration statement on Form F-3 (No. 333-280891) of Lanvin Group Holdings Limited
and shall be a part thereof from the date on which this Report is furnished, to the extent not superseded by documents or reports subsequently
filed or furnished.
EXHIBIT INDEX
SIGNATURES
Pursuant to the requirements of the Securities
Exchange Act of 1934, the registrant has duly caused this report to be signed on its behalf by the undersigned, thereunto duly authorized.
| | LANVIN GROUP HOLDINGS LIMITED |
| | |
| By: | /s/ Zhen Huang |
| | | Name: |
Zhen Huang |
| | | Title: |
Chairman |
Date: August 26, 2024
Exhibit 99.1

Lanvin Group
Posts Revenue of €171 million in H1 2024
Global Challenges
Impact First-Half Results
| · | Group
Revenue was €171 million for H1 2024, a 20% decrease over H1 2023 |
| · | Group
Gross profit margin remained steady, declining just 1% to 57.5%, and Lanvin, St. John and
Caruso all showed marked gross profit margin improvement from better full-price sell-through
and strategic inventory management |
| · | Global
luxury market softness particularly impacted revenue in EMEA and Greater China; as did the
Wholesale Channel; Lanvin brand showed strong growth in APAC, outside of Greater China, with
9% growth |
| · | Wolford
revenue and margin was impacted by a significant shipping delay due to integration issues
with a new logistics provider; and Sergio Rossi saw a planned rationalization of third-party
production resulting in lower revenue |
| · | Strategic
actions were taking in H1 2024 to ensure our brands’ long-term competitiveness globally,
including the appointment of Peter Copping as Lanvin’s new Artistic Director; appointment
of Regis Rimbert as Wolford’s CEO; and the optimization of production and supply chain
management for Sergio Rossi |
| · | Adjusted
EBITDA held steady, decreasing only €1 million, period-over-period due to proactive
cost management initiatives |
| · | All
brands remained committed to improving cost structure while continuing to tactically invest
in marketing for upcoming campaigns |
August 26, 2024 - Lanvin Group (NYSE:
LANV, the “Group”), a global luxury fashion group with Lanvin, Wolford, Sergio Rossi, St. John and Caruso in its portfolio
of brands, today announced its results for the first half of 2024. Despite facing macroeconomic pressures in the global luxury market,
the Group continued to drive its innovative strategies and remained focused on the long-term development of its brands.
The Group achieved revenue of €171 million,
a 20% decrease period-over-period versus 2023. Nonetheless, the Group continued to demonstrate operational stability and strong cost
control through proactive strategic adjustments. With effective measures to improve cost efficiency across brands, Gross profit was at
€98 million, maintaining a 57.5% gross profit margin, reflecting Lanvin Group’s resilience and its potential for sustainable
growth in a challenging environment.
Zhen Huang, Chairman of Lanvin Group,
said: “We faced a tumultuous market in the first half of 2024. While we anticipate this will continue for the near-term, we remain
committed to the long-term growth of our Group and our path to profitability.”
Eric Chan, CEO of Lanvin Group, said:
“Struggles in the wholesale channel compounded the issues of a softening global luxury market, in the first half of 2024. We spent
much of the first half committed to our marketing plan, but also prioritized rationalizing our cost base to fit the current market environment.
Furthermore, we are committed to our product strategy and investing in product development, which is why we are excited to have the new
creative leaders who have joined our family. While we will be proactive in our approach to the near-term slowdown, we remain resolute
in investing in our brands to forge our path forward, and to capitalize on our momentum as the markets improve.”
Review of the First Half 2024 Results
| |
Revenue | | |
Growth
% | | |
CAGR
% | |
Lanvin
Group Revenue by Brand € in Thousands, unless otherwise | |
2022 | | |
2023 | | |
2024 | | |
2023H1
vs | | |
2024H1
vs | | |
’22 H1 – | |
| noted | |
H1 | | |
H1 | | |
H1 | | |
2022H1 | | |
2023H1 | | |
‘24 H1 | |
| Lanvin | |
| 63,949 | | |
| 57,052 | | |
| 48,272 | | |
| -10.8 | % | |
| -15.4 | % | |
| -13.1 | % |
| Wolford | |
| 54,261 | | |
| 58,802 | | |
| 42,594 | | |
| 8.4 | % | |
| -27.6 | % | |
| -11.4 | % |
| St. John | |
| 41,924 | | |
| 46,663 | | |
| 39,981 | | |
| 11.3 | % | |
| -14.3 | % | |
| -2.3 | % |
| Sergio Rossi | |
| 26,969 | | |
| 33,019 | | |
| 20,404 | | |
| 22.4 | % | |
| -38.2 | % | |
| -13.0 | % |
| Caruso | |
| 14,919 | | |
| 19,926 | | |
| 19,734 | | |
| 33.6 | % | |
| -1.0 | % | |
| 15.0 | % |
| Total Brand | |
| 202,022 | | |
| 215,462 | | |
| 170,985 | | |
| 6.7 | % | |
| -20.6 | % | |
| -8.0 | % |
| | |
| | | |
| | | |
| | | |
| | | |
| | | |
| | |
| Eliminations | |
| -322 | | |
| -925 | | |
| -9 | | |
| 187.3 | % | |
| -99.0 | % | |
| -83.3 | % |
| Total Group | |
| 201,700 | | |
| 214,537 | | |
| 170,976 | | |
| 6.4 | % | |
| -20.3 | % | |
| -7.9 | % |
Lanvin Group Consolidated P&L
€ in Thousands,
unless | |
2022 | | |
2023 | | |
2024 | |
| otherwise noted | |
H1 | | |
% | | |
H1 | | |
% | | |
H1 | | |
% | |
| Revenue | |
| 201,700 | | |
| 100.0 | % | |
| 214,537 | | |
| 100.0 | % | |
| 170,976 | | |
| 100.0 | % |
| Gross profit | |
| 112,743 | | |
| 55.9 | % | |
| 125,454 | | |
| 58.5 | % | |
| 98,378 | | |
| 57.5 | % |
| Contribution profit | |
| 5,933 | | |
| 2.9 | % | |
| 14,854 | | |
| 6.9 | % | |
| -7,213 | | |
| -4.2 | % |
| Adjusted EBITDA | |
| -35,519 | | |
| -17.6 | % | |
| -40,916 | | |
| -19.1 | % | |
| -42,111 | | |
| -24.6 | % |
Selected Highlights
Continued cost efficiency initiatives effective
in maintaining Gross profit margin: Gross profit margin for the Group decreased by 1% due to effective efforts to improve cost efficiencies.
Better full-price sell-through, inventory management, and channel mix changes drove gross profit margin up 2% at Lanvin, up 7% at St.
John, and up nearly 3% at Caruso. Despite lower revenue, Sergio Rossi maintained relatively flat gross profit margin, and Wolford’s
gross profit margin was mainly impacted by delays from integration with a new logistics provider that resulted in an inability to absorb
fixed production costs.
Group Adjusted EBITDA declined only 3%, period-over-period:
In the face of strong topline challenges, the Group’s Adjusted EBITDA decreased from €41 million to a €42 million
loss due to effective and timely cost reduction initiatives at the brand level. The Group provided resources and coordinated with brand
executives in the first half to manage through the difficult market conditions.
Lanvin announces new Artistic Director: In
June 2024, Lanvin announced that Peter Copping will be joining the brand in the second half of the year as the new Artistic Director.
Mr. Copping brings to the brand and business a passion for and deep understanding of Lanvin’s heritage and a wealth of industry
experience. He will lead the creative direction of both women’s and menswear and introduce his vision for Lanvin in 2025.
New personnel announcement: Wolford appointed
Regis Rimbert as the new CEO of the brand in June 2024. Mr. Rimbert brings over 20 years of experience in the fashion industry,
where he has led transformative initiatives in retail, online, and international operations.
Lanvin Lab 2.0: Lanvin successfully launched
the second edition of Lanvin Lab with a collaboration with acclaimed contemporary artist, Erwin Wurm. Lanvin’s iconic Pencil Cat
Bag and Cash sneaker were incorporated into a monumental sculpture currently on a five-city tour throughout Greater China.
Review of First Half 2024 Financials
Revenue
For H1 2024, the Group generated revenue of €171
million, a 20% decrease period-over-period. DTC channel revenue decreased by 14% and Wholesale revenue by 30%. Other revenue growth comprised
of royalty and clearance income decreased 15% due to Lanvin’s reduction of clearance inventory. Regional revenue declined in EMEA
by 27% and Greater China at 24% (Asia excluding Greater China decreased by 7%), and North America by 11%.
The main drivers of the decline in revenue were
global market softness coupled with a struggling wholesale market. Additionally, Wolford had an integration issue with its new logistic
provider which significantly delayed shipments, and Sergio Rossi had a strategically planned reduction in third-party production, both
of which also contributed to the revenue decline.
Gross Profit
Gross profit was €98 million, representing
a 58% margin versus €125 million for H1 2023 at a margin of 59%. The Group continues to focus on scale, product mix improvements
and distribution management to drive the gross profit margin expansion.
Contribution Profit(1)
Contribution profit was -€7 million. While
cost reduction initiatives were undertaken, the Group was committed to investing in marketing spend with the long-term brand momentum
in mind, resulting in a lower contribution profit.
Adjusted EBITDA
Adjusted EBITDA for the Group declined to -€42
million versus -€41 million for H1 2023, resulting from lower revenue, but offset by a reduction of fixed general and administrative
expenses, decreasing from 36% to 34% of revenue. In the first half, the Group was able to effectively implement cost reductions to mitigate
the revenue impact.
Results by Segment
Lanvin: Revenue decreased from €57
million in H1 2023 to €48 million in H1 2024, mainly due to a slowdown in global luxury consumption coupled with a challenging wholesale
market. Retail including boutique and outlet was down only 3%, while the overall DTC channel declined by 10%; and Wholesale by 23%.
Globally, EMEA saw the largest decrease at 21%,
driven by a decrease in European wholesale receipts. North America and APAC declined by 9% with Greater China at 14%; APAC excluding
Greater China generated positive 9% growth.
Gross profit decreased to €28 million from
€32 million. Gross profit margin increased from 56% to 58%, due to increased full-price sell-through and strategic inventory management.
Contribution profit declined from a contribution loss of €5 million in H1 2023 to a contribution loss of €9 million in H1 2024.
In June 2024, Lanvin announced the September arrival
of Peter Copping as Artistic Director. The house intends to propel the brand momentum from this significant appointment in the development
and marketing of Mr. Copping’s debut collection launch in 2025.
For the balance of 2024, Lanvin is aggressively
executing initiatives to increase retail and digital traffic and implement operational cost efficiencies to improve DTC profitability.
The brand will continue to emphasize its leather goods and accessories offer and will further build out its seasonless carryover product
offer across categories.
Wolford: Revenue declined by 28% from
€59 million in H1 2023 to €43 million in H1 2024. The decrease was mainly drive by integration issues with its new logistics
provider that resulted in significant delays in shipments. Additionally, the challenging wholesale market in Europe also impacted revenue.
On a channel-basis, DTC decreased by 14% and
Wholesale by 53%. Geographically, EMEA saw the largest decrease at 34%, North America by 10%, and APAC by 24% with Greater China seeing
a 20% decline.
Gross profit margin decreased to 63% from 72%
due to the logistics issues as well as a planned liquidation of excess inventory. Contribution loss was €8 million.
In the first half, Wolford made a number of personnel
changes, most notably, the appointment of Regis Rimbert as CEO. Mr. Rimbert’s experience operating in luxury fashion is extensive
and he will drive second half initiatives to implement a sustainable cost model by transforming supply chain and distribution, as well
as focus on brand positioning and marketing, and improve the client experience.
Sergio Rossi: Revenue declined from €33
million in H1 2023 to €20 million in H1 2024, or 38%. The brand had a 49% decline in its largest market, EMEA, and 22% in APAC with
Greater China decreasing by 34%. The revenue impact was due to continued softness in wholesale as well as a planned reduction of third-party
production. The DTC channel was down 17% overall and e-Commerce by 2%. Wholesale, which includes third-party production, decreased by
60%.
Gross profit margin landed at 50%, relatively
flat from H1 2023, due to the change in channel mix with the decline in wholesale revenue, including the reduction of third-party production.
Contribution profit declined from €6 million to €1 million. The revenue impact was mitigated by cost control initiatives to
maintain positive contribution profit.
For the second half of 2024, the brand will drive
cost efficiencies through planned initiatives and supply chain improvements. Sergio Rossi also plans to continue to right-size its retail
fleet and overhead.
The brand also plans to emphasize new marketing
initiatives celebrating its heritage and renowned shoe archive with the anticipated arrival of the new Creative Director, Paul Andrew.
The brand announced in July 2024, that Paul Andrew will join Sergio Rossi in the second half.
St. John: Revenue decreased from €47
million in H1 2023 to €40 million in H1 2024, a decline of 14%. The revenue impact was consistent across the distribution channels
with DTC, including e-Commerce declining by 15%; and Wholesale by 13%. North America, by far its largest market, decreased by 10%, while
APAC, which represents less than 10% of revenue, was down 46%, due to general market softness.
Gross profit margin was significantly higher
growing from 62% to 69% due to increased full-price sell-through and better channel mix. Contribution profit margin remained steady at
12% from improved marketing efficiency mitigating the decline in revenue.
For the second half of 2024, the brand will continue
to push its “basics” product lines and further refine its retail network and overhead.
Caruso: Despite a challenging global luxury
and wholesale environment, Caruso maintained flat revenue with a 1% decline. Caruso’s Maisons business, its third-party production
unit showed some softness, but it was offset by its propriety Caruso brand business which grew by 21% with strong sales of its ready-to-wear
and made-to-measure products.
Gross profit increased from €5 million to
€6 million, and gross profit margin increased from 26% to 29% from improved in-house production efficiencies and a reduction of
outsourcing. Contribution profit also increased from €4 million to €5 million, and contribution profit margin increased from
22% to 24%.
For the remainder of 2024, the brand will continue
to expand its B2B Maisons business with new client development programs.
2024 Full-Year Outlook
The Group expects a challenging second half of
2024, but will remain proactive in its cost-reduction and operating efficiency efforts. Lanvin and Sergio Rossi plan to further emphasize
marketing initiatives to forge their creative paths for 2025 with the additions of Peter Copping and Paul Andrew, respectively.
Lanvin Group will continue to focus on revenue
expansion opportunities through marketing campaigns to maintain brand momentum and with a tactical approach to expand its store network.
Note: All % changes are calculated on an actual
currency exchange rate basis.
Note: This communication includes certain non-IFRS
financial measures such as Contribution Profit, Contribution Profit Margin, Adjusted Operating Profit, adjusted earnings before interest
and taxes (“Adjusted EBIT”), and adjusted earnings before interest, taxes, depreciation and amortization (“Adjusted
EBITDA”). Please see Use of Non-IFRS Financial Metrics and Non-IFRS Financial Measures and Definition.
| (1) | Contribution Profit defined as Gross Profit
less Selling and Marketing Expenses |
***
Semi-Annual Report
Our semi-annual report, including the interim
condensed consolidated financial statements as of and for the six months ended June 30, 2024, can be downloaded from the Company’s
investor relations website (ir.lanvin-group.com) under the section Financials / SEC Filings, or from the SEC’s website (www.sec.gov).
***
Conference Call
As previously announced, today at 8:00AM EST/8:00PM
CST/2:00PM CET, Lanvin Group will host a conference call to discuss its results for the first half of 2024 and provide an outlook for
the remainder of the year. Management will refer to a slide presentation during the call, which will be made available on the day of
the call. To view the presentation, please visit the "Events" tab of the Group's investor relations website at https://ir.lanvin-group.com.
All participants who would like to join the conference
call must pre-register using the link provided below. Once the registration is complete, participants will receive dial-in numbers, a
passcode, and a registrant ID which can be used to join the conference call. Participants may register at any time, including up to and
after the call starts.
Registration Link:
https://dpregister.com/sreg/10191932/fd4d899a20
A replay of the conference call will be accessible
approximately one hour after the live call until September 2, 2024, by dialing the following numbers:
US Toll Free: 1-877-344-7529
International Toll: 1-412-317-0088
Canada Toll Free: 855-669-9658
Replay Access Code: 9453870
A recorded webcast of the conference call and
a slide presentation will also be available on the Group's investor relations website at https://ir.lanvin-group.com.
***
About Lanvin Group
Lanvin Group is a leading global luxury fashion
group headquartered in Shanghai, China, managing iconic brands worldwide including Lanvin, Wolford, Sergio Rossi, St. John Knits, and
Caruso. Harnessing the power of its unique strategic alliance of industry-leading partners in the luxury fashion sector, Lanvin Group
strives to expand the global footprint of its portfolio brands and achieve sustainable growth through strategic investment and extensive
operational know-how, combined with an intimate understanding and unparalleled access to the fastest-growing luxury fashion markets in
the world. Lanvin Group is listed on the New York Stock Exchange under the ticker symbol 'LANV'. For more information about Lanvin Group,
please visit www.lanvin-group.com, and to view our investor presentation, please visit https://ir.lanvin-group.com.
***
Forward-Looking Statements
This communication, including the section “2024
Full-Year Outlook”, contains “forward-looking statements” within the meaning of the “safe harbor” provisions
of the Private Securities Litigation Reform Act of 1995. Forward-looking statements generally are accompanied by words such as “believe,”
“may,” “will,” “estimate,” “continue,” “anticipate,” “intend,”
“expect,” “should,” “would,” “plan,” “predict,” “potential,”
“seem,” “seek,” “future,” “outlook,” “project” and similar expressions that
predict or indicate future events or trends or that are not statements of historical matters. These forward-looking statements include,
but are not limited to, statements regarding estimates and forecasts of other financial and performance metrics and projections of market
opportunity. These statements are based on various assumptions, whether or not identified in this communication, and on the current expectations
of the respective management of Lanvin Group and are not predictions of actual performance. These forward-looking statements are provided
for illustrative purposes only and must not be relied on by an investor as, a guarantee, an assurance, a prediction or a definitive statement
of fact or probability. Actual events and circumstances are difficult or impossible to predict and will differ from assumptions. Many
actual events and circumstances are beyond the control of Lanvin Group. Potential risks and uncertainties that could cause the actual
results to differ materially from those expressed or implied by forward-looking statements include, but are not limited to, changes adversely
affecting the business in which Lanvin Group is engaged; Lanvin Group’s projected financial information, anticipated growth rate,
profitability and market opportunity may not be an indication of its actual results or future results; management of growth; the impact
of COVID-19 or similar public health crises on Lanvin Group’s business; Lanvin Group’s ability to safeguard the value, recognition
and reputation of its brands and to identify and respond to new and changing customer preferences; the ability and desire of consumers
to shop; Lanvin Group’s ability to successfully implement its business strategies and plans; Lanvin Group’s ability to effectively
manage its advertising and marketing expenses and achieve desired impact; its ability to accurately forecast consumer demand; high levels
of competition in the personal luxury products market; disruptions to Lanvin Group’s distribution facilities or its distribution
partners; Lanvin Group’s ability to negotiate, maintain or renew its license agreements; Lanvin Group’s ability to protect
its intellectual property rights; Lanvin Group’s ability to attract and retain qualified employees and preserve craftmanship skills;
Lanvin Group’s ability to develop and maintain effective internal controls; general economic conditions; the result of future financing
efforts; and those factors discussed in the reports filed by Lanvin Group from time to time with the SEC. If any of these risks materialize
or Lanvin Group’s assumptions prove incorrect, actual results could differ materially from the results implied by these forward-looking
statements. There may be additional risks that Lanvin Group presently does not know, or that Lanvin Group currently believes are immaterial,
that could also cause actual results to differ from those contained in the forward-looking statements. In addition, forward-looking statements
reflect Lanvin Group’s expectations, plans, or forecasts of future events and views as of the date of this communication. Lanvin
Group anticipates that subsequent events and developments will cause Lanvin Group’s assessments to change. However, while Lanvin
Group may elect to update these forward-looking statements at some point in the future, Lanvin Group specifically disclaim any obligation
to do so. These forward-looking statements should not be relied upon as representing Lanvin Group’s assessments of any date subsequent
to the date of this communication. Accordingly, reliance should not be placed upon the forward-looking statements.
***
Use of Non-IFRS Financial Metrics
This communication includes certain non-IFRS
financial measures such as Contribution Profit, Contribution Profit Margin, Adjusted Operating Profit, adjusted earnings before interest
and taxes (“Adjusted EBIT”), and adjusted earnings before interest, taxes, depreciation and amortization (“Adjusted
EBITDA”). These non-IFRS measures are an addition, and not a substitute for or superior to measures of financial performance prepared
in accordance with IFRS and should not be considered as an alternative to net income, operating income or any other performance measures
derived in accordance with IFRS. Reconciliations of non-IFRS measures to their most directly comparable IFRS counterparts are included
in the Appendix to this communication. Lanvin Group believes that these non-IFRS measures of financial results provide useful supplemental
information to investors about Lanvin Group. Lanvin Group believes that the use of these non-IFRS financial measures provides an additional
tool for investors to use in evaluating projected operating results and trends in and in comparing Lanvin Group's financial measures
with other similar companies, many of which present similar non-IFRS financial measures to investors. However, there are a number of
limitations related to the use of these non-IFRS measures and their nearest IFRS equivalents. For example, other companies may calculate
non-IFRS measures differently, or may use other measures to calculate their financial performance, and therefore Lanvin Group's non-IFRS
measures may not be directly comparable to similarly titled measures of other companies. Lanvin Group does not consider these non-IFRS
measures in isolation or as an alternative to financial measures determined in accordance with IFRS. The principal limitation of these
non-IFRS financial measures is that they exclude significant expenses, income and tax liabilities that are required by IFRS to be recorded
in Lanvin Group's financial statements. In addition, they are subject to inherent limitations as they reflect the exercise of judgements
by Lanvin Group about which expense and income are excluded or included in determining these non-IFRS financial measures. In order to
compensate for these limitations, Lanvin Group presents non-IFRS financial measures in connection with IFRS results.
***
Enquiries:
Media
Lanvin Group
Kimberly Zhang
kimberly.zhang@lanvin-group.com
Investors
Lanvin Group
James Kim
james.kim@lanvin-group.com
Appendix
Lanvin Group Consolidated Income Statement
(€ in Thousands, unless otherwise noted)
| |
2022 | | |
2023 | | |
2024 | |
| Lanvin
Group Consolidated P&L | |
H1 | | |
% | | |
H1 | | |
% | | |
H1 | | |
% | |
| Revenue | |
| 201,700 | | |
| 100.0 | % | |
| 214,537 | | |
| 100.0 | % | |
| 170,976 | | |
| 100.0 | % |
| Cost of sales | |
| -88,957 | | |
| -44.1 | % | |
| -89,083 | | |
| -41.5 | % | |
| -72,598 | | |
| -42.5 | % |
| | |
| | | |
| | | |
| | | |
| | | |
| | | |
| | |
| Gross Profit | |
| 112,743 | | |
| 55.9 | % | |
| 125,454 | | |
| 58.5 | % | |
| 98,378 | | |
| 57.5 | % |
| Marketing and selling expenses | |
| -106,810 | | |
| -53.0 | % | |
| -110,600 | | |
| -51.6 | % | |
| -105,591 | | |
| -61.8 | % |
| General and administrative expenses | |
| -75,771 | | |
| -37.6 | % | |
| -76,544 | | |
| -35.7 | % | |
| -58,065 | | |
| -34.0 | % |
| Other operating income and expenses | |
| 8,378 | | |
| 4.2 | % | |
| -7,960 | | |
| -3.7 | % | |
| 5,457 | | |
| 3.2 | % |
| | |
| | | |
| | | |
| | | |
| | | |
| | | |
| | |
| Loss from operations before
non-underlying items | |
| -61,460 | | |
| -30.5 | % | |
| -69,650 | | |
| -32.5 | % | |
| -59,821 | | |
| -35.0 | % |
| Non-underlying items | |
| 570 | | |
| 0.3 | % | |
| 9,666 | | |
| 4.5 | % | |
| 3,143 | | |
| 1.8 | % |
| | |
| | | |
| | | |
| | | |
| | | |
| | | |
| | |
| Loss from operations | |
| -60,890 | | |
| -30.2 | % | |
| -59,984 | | |
| -28.0 | % | |
| -56,678 | | |
| -33.1 | % |
| Finance cost – net | |
| -8,080 | | |
| -4.0 | % | |
| -11,970 | | |
| -5.6 | % | |
| -13,187 | | |
| -7.7 | % |
| | |
| | | |
| | | |
| | | |
| | | |
| | | |
| | |
| Loss before income tax | |
| -68,970 | | |
| -34.2 | % | |
| -71,954 | | |
| -33.5 | % | |
| -69,865 | | |
| -40.9 | % |
| Income tax benefits / (expenses) | |
| 256 | | |
| 0.1 | % | |
| -271 | | |
| -0.1 | % | |
| 489 | | |
| 0.3 | % |
| | |
| | | |
| | | |
| | | |
| | | |
| | | |
| | |
| Loss for the period | |
| -68,714 | | |
| -34.1 | % | |
| -72,225 | | |
| -33.7 | % | |
| -69,376 | | |
| -40.6 | % |
| | |
| | | |
| | | |
| | | |
| | | |
| | | |
| | |
| Contribution Profit (1) | |
| 5,933 | | |
| 2.9 | % | |
| 14,854 | | |
| 6.9 | % | |
| -7,213 | | |
| -4.2 | % |
| Adjusted Operating Profit (1) | |
| -69,838 | | |
| -34.6 | % | |
| -61,690 | | |
| -28.8 | % | |
| -65,278 | | |
| -38.2 | % |
| Adjusted EBIT (1) | |
| -57,163 | | |
| -28.3 | % | |
| -67,679 | | |
| -31.5 | % | |
| -58,994 | | |
| -34.5 | % |
| Adjusted EBITDA (1) | |
| -35,519 | | |
| -17.6 | % | |
| -40,916 | | |
| -19.1 | % | |
| -42,111 | | |
| -24.6 | % |
Lanvin Group Consolidated Balance Sheet
(€ in Thousands, unless otherwise noted)
| | |
2023 | | |
2024 | |
| Lanvin Group Consolidated Balance Sheet | |
FY | | |
H1 | |
| Assets | |
| | | |
| | |
| Non-current assets | |
| | | |
| | |
| Intangible assets | |
| 210,439 | | |
| 211,818 | |
| Goodwill | |
| 69,323 | | |
| 69,323 | |
| Property, plant and equipment | |
| 43,731 | | |
| 42,972 | |
| Right-of-use assets | |
| 128,853 | | |
| 139,126 | |
| Deferred income tax assets | |
| 13,427 | | |
| 12,905 | |
| Other non-current assets | |
| 15,540 | | |
| 15,383 | |
| | |
| 481,313 | | |
| 491,527 | |
| Current assets | |
| | | |
| | |
| Inventories | |
| 107,184 | | |
| 106,809 | |
| Trade receivables | |
| 45,657 | | |
| 35,436 | |
| Other current assets | |
| 25,650 | | |
| 25,487 | |
| Cash and bank balances | |
| 28,130 | | |
| 18,308 | |
| | |
| 206,621 | | |
| 186,040 | |
| Total Assets | |
| 687,934 | | |
| 677,567 | |
| Liabilities | |
| | | |
| | |
| Non-current liabilities | |
| | | |
| | |
| Non-current borrowings | |
| 32,381 | | |
| 28,070 | |
| Non-current lease liabilities | |
| 112,898 | | |
| 120,250 | |
| Non-current provisions | |
| 3,174 | | |
| 3,932 | |
| Employee benefits | |
| 17,972 | | |
| 17,320 | |
| Deferred income tax liabilities | |
| 52,804 | | |
| 51,623 | |
| Other non-current liabilities | |
| 14,733 | | |
| 15,021 | |
| | |
| 233,962 | | |
| 236,216 | |
| Current liabilities | |
| | | |
| | |
| Trade payables | |
| 78,576 | | |
| 81,052 | |
| Bank overdrafts | |
| 280 | | |
| 429 | |
| Current borrowings | |
| 35,720 | | |
| 98,219 | |
| Current lease liabilities | |
| 32,871 | | |
| 35,649 | |
| Current provisions | |
| 6,270 | | |
| 5,273 | |
| Other current liabilities | |
| 134,627 | | |
| 128,005 | |
| | |
| 288,344 | | |
| 348,627 | |
| Total Liabilities | |
| 522,306 | | |
| 584,843 | |
| Net assets | |
| 165,628 | | |
| 92,724 | |
| Equity | |
| | | |
| | |
| Equity attributable to owners of the Company | |
| | | |
| | |
| Share capital | |
| *(2) | | |
| *(2) | |
| Treasury shares | |
| -65,405 | | |
| -55,991 | |
| Other reserves | |
| 806,677 | | |
| 793,990 | |
| Accumulated losses | |
| -571,931 | | |
| -629,248 | |
| | |
| 169,341 | | |
| 108,751 | |
| Non- controlling interests | |
| -3,713 | | |
| -16,027 | |
| Total Equity | |
| 165,628 | | |
| 92,724 | |
Lanvin Group Consolidated Cash Flow
(€
in Thousands, unless otherwise noted)
| | |
2022 | | |
2023 | | |
2024 | |
| Lanvin Group Consolidated Cash Flow | |
H1 | | |
H1 | | |
H1 | |
| Net cash used in operating activities | |
| -51,825 | | |
| -58,118 | | |
| -33,483 | |
| Net cash used in investing activities | |
| -5,556 | | |
| -28,531 | | |
| -3,780 | |
| Net cash flows generated from financing activities | |
| 17,465 | | |
| 26,396 | | |
| 26,646 | |
| Net change in cash and cash equivalents | |
| -39,916 | | |
| -60,253 | | |
| -10,617 | |
| | |
| | | |
| | | |
| | |
| Cash and cash equivalents less bank overdrafts at the beginning of the period | |
| 88,658 | | |
| 91,749 | | |
| 27,850 | |
| Effect of foreign exchange differences on cash and cash equivalents | |
| 2,185 | | |
| -649 | | |
| 646 | |
| Cash and cash equivalents less bank overdrafts at end of the period | |
| 50,927 | | |
| 30,847 | | |
| 17,879 | |
Lanvin Brand Key Financials(3)
(€
in thousands, unless otherwise noted)
| Lanvin Brand | |
2022 | | |
2023 | | |
2024 | | |
23
H1
v | | |
24
H1
v | | |
22
H1–
24 H1 | |
| Key Financials | |
H1 |
| |
% | | |
H1 |
| |
% | | |
H1 |
| |
% | | |
22 H1 | | |
23 H1 | | |
CAGR | |
| Key Financials on P&L | |
|
| |
| | |
|
| |
| | |
|
| |
| | |
| | |
| | |
| |
| Revenues | |
63,949 |
| |
100.0 | % | |
57,052 |
| |
100.0 | % | |
48,272 |
| |
100.0 | % | |
-10.8 | % | |
-15.4 | % | |
-13.1 | % |
| Gross Profit | |
30,048 |
| |
47.0 | % | |
31,959 |
| |
56.0 | % | |
28,004 |
| |
58.0 | % | |
| | |
| | |
| |
| Selling and distribution expenses | |
-34,360 |
| |
-53.7 | % | |
-36,793 |
| |
-64.5 | % | |
-37,389 |
| |
-77.5 | % | |
| | |
| | |
| |
| Contribution Profit (1) | |
-4,312 |
| |
-6.7 | % | |
-4,834 |
| |
-8.5 | % | |
-9,385 |
| |
-19.4 | % | |
| | |
| | |
| |
| | |
|
| |
| | |
|
| |
| | |
|
| |
| | |
| | |
| | |
| |
| Revenues by Geography | |
|
| |
| | |
|
| |
| | |
|
| |
| | |
| | |
| | |
| |
| EMEA | |
34,779 |
| |
54.4 | % | |
29,443 |
| |
51.6 | % | |
23,154 |
| |
48.0 | % | |
-15.3 | % | |
-21.4 | % | |
-18.4 | % |
| North America | |
15,255 |
| |
23.9 | % | |
13,195 |
| |
23.1 | % | |
11,981 |
| |
24.8 | % | |
-13.5 | % | |
-9.2 | % | |
-11.4 | % |
| Greater China | |
12,362 |
| |
19.3 | % | |
11,092 |
| |
19.4 | % | |
9,527 |
| |
19.7 | % | |
-10.3 | % | |
-14.1 | % | |
-12.2 | % |
| Other | |
1,553 |
| |
2.4 | % | |
3,322 |
| |
5.8 | % | |
3,610 |
| |
7.5 | % | |
113.9 | % | |
8.7 | % | |
52.5 | % |
| | |
|
| |
| | |
|
| |
| | |
|
| |
| | |
| | |
| | |
| |
| Revenues by Channel | |
|
| |
| | |
|
| |
| | |
|
| |
| | |
| | |
| | |
| |
| DTC | |
30,879 |
| |
48.3 | % | |
26,780 |
| |
46.9 | % | |
24,072 |
| |
49.9 | % | |
-13.3 | % | |
-10.1 | % | |
-11.7 | % |
| Wholesale | |
30,799 |
| |
48.2 | % | |
23,022 |
| |
40.4 | % | |
17,639 |
| |
36.5 | % | |
-25.2 | % | |
-23.4 | % | |
-24.3 | % |
| Other | |
2,271 |
| |
3.6 | % | |
7,250 |
| |
12.7 | % | |
6,561 |
| |
13.6 | % | |
219.3 | % | |
-9.5 | % | |
70.0 | % |
Wolford Brand Key Financials(3)
(€
in thousands, unless otherwise noted)
| Wolford Brand | |
2022 | | |
2023 | | |
2024 | | |
23 H1
v | | |
24 H1
v | | |
22
H1 –
24 H1 | |
| Key
Financials | |
H1 | | |
% | | |
H1 | | |
% | | |
H1 | | |
% | | |
22
H1 | | |
23
H1 | | |
CAGR | |
| Key Financials on P&L | |
| | |
| | |
| | |
| | |
| | |
| | |
| | |
| | |
| |
| Revenues | |
54,261 | | |
100.0 | % | |
58,802 | | |
100.0 | % | |
42,594 | | |
100.0 | % | |
8.4 | % | |
-27.6 | % | |
-11.4 | % |
| Gross Profit | |
38,383 | | |
70.7 | % | |
42,062 | | |
71.5 | % | |
26,795 | | |
62.9 | % | |
| | |
| | |
| |
| Selling and distribution expenses | |
-40,337 | | |
-74.3 | % | |
-38,128 | | |
-64.8 | % | |
-34,916 | | |
-82.0 | % | |
| | |
| | |
| |
| Contribution Profit (1) | |
-1,954 | | |
-3.6 | % | |
3,934 | | |
6.7 | % | |
-8,121 | | |
-19.1 | % | |
| | |
| | |
| |
| | |
| | |
| | |
| | |
| | |
| | |
| | |
| | |
| | |
| |
| Revenues by Geography | |
| | |
| | |
| | |
| | |
| | |
| | |
| | |
| | |
| |
| EMEA | |
38,202 | | |
70.4 | % | |
40,083 | | |
68.2 | % | |
26,453 | | |
62.1 | % | |
4.9 | % | |
-34.0 | % | |
-16.8 | % |
| North America | |
12,891 | | |
23.8 | % | |
14,224 | | |
24.2 | % | |
12,747 | | |
29.9 | % | |
10.3 | % | |
-10.4 | % | |
-0.6 | % |
| Greater China | |
2,799 | | |
5.2 | % | |
4,107 | | |
7.0 | % | |
3,274 | | |
7.7 | % | |
46.7 | % | |
-20.3 | % | |
8.2 | % |
| Other | |
370 | | |
0.7 | % | |
388 | | |
0.7 | % | |
120 | | |
0.3 | % | |
4.9 | % | |
-69.1 | % | |
-43.0 | % |
| | |
| | |
| | |
| | |
| | |
| | |
| | |
| | |
| | |
| |
| Revenues by Channel | |
| | |
| | |
| | |
| | |
| | |
| | |
| | |
| | |
| |
| DTC | |
39,102 | | |
72.1 | % | |
39,453 | | |
67.1 | % | |
33,812 | | |
79.4 | % | |
0.9 | % | |
-14.3 | % | |
-7.0 | % |
| Wholesale | |
14,557 | | |
26.8 | % | |
18,665 | | |
31.7 | % | |
8,715 | | |
20.5 | % | |
28.2 | % | |
-53.3 | % | |
-22.6 | % |
| Other | |
602 | | |
1.1 | % | |
684 | | |
1.2 | % | |
67 | | |
0.2 | % | |
13.6 | % | |
-90.2 | % | |
-66.6 | % |
Sergio Rossi Brand Key Financials(3)
(€
in thousands, unless otherwise noted)
| Sergio Rossi | |
| | |
| | |
| | |
23 H1 | | |
24 H1 | | |
22 H1 – | |
| Brand Key | |
2022 | | |
2023 | | |
2024 | | |
v | | |
v | | |
24 H1 | |
| Financials | |
H1 | | |
% | | |
H1 | | |
% | | |
H1 | | |
% | | |
22
H1 | | |
23
H1 | | |
CAGR | |
| Key Financials on P&L | |
| | |
| | |
| | |
| | |
| | |
| | |
| | |
| | |
| |
| Revenues | |
26,969 | | |
100.0 | % | |
33,019 | | |
100.0 | % | |
20,404 | | |
100.0 | % | |
22.4 | % | |
-38.2 | % | |
-13.0 | % |
| Gross Profit | |
14,798 | | |
54.9 | % | |
17,135 | | |
51.9 | % | |
10,218 | | |
50.1 | % | |
| | |
| | |
| |
| Selling and distribution expenses | |
-11,180 | | |
-41.5 | % | |
-11,355 | | |
-34.4 | % | |
-9,490 | | |
-46.5 | % | |
| | |
| | |
| |
| Contribution Profit (1) | |
3,618 | | |
13.4 | % | |
5,780 | | |
17.5 | % | |
728 | | |
3.6 | % | |
| | |
| | |
| |
| | |
| | |
| | |
| | |
| | |
| | |
| | |
| | |
| | |
| |
| Revenues by Geography | |
| | |
| | |
| | |
| | |
| | |
| | |
| | |
| | |
| |
| EMEA | |
14,267 | | |
52.9 | % | |
18,509 | | |
56.0 | % | |
9,528 | | |
46.7 | % | |
29.7 | % | |
-48.5 | % | |
-18.3 | % |
| North America | |
643 | | |
2.4 | % | |
846 | | |
2.6 | % | |
281 | | |
1.4 | % | |
31.5 | % | |
-66.8 | % | |
-33.9 | % |
| Greater China | |
5,252 | | |
19.5 | % | |
6,350 | | |
19.2 | % | |
4,174 | | |
20.5 | % | |
20.9 | % | |
-34.3 | % | |
-10.8 | % |
| Other | |
6,808 | | |
25.2 | % | |
7,315 | | |
22.2 | % | |
6,420 | | |
31.5 | % | |
7.5 | % | |
-12.2 | % | |
-2.9 | % |
| | |
| | |
| | |
| | |
| | |
| | |
| | |
| | |
| | |
| |
| Revenues by Channel | |
| | |
| | |
| | |
| | |
| | |
| | |
| | |
| | |
| |
| DTC | |
14,650 | | |
54.3 | % | |
16,847 | | |
51.0 | % | |
13,976 | | |
68.5 | % | |
15.0 | % | |
-17.0 | % | |
-2.3 | % |
| Wholesale | |
12,319 | | |
45.7 | % | |
16,172 | | |
49.0 | % | |
6,428 | | |
31.5 | % | |
31.3 | % | |
-60.3 | % | |
-27.8 | % |
| Other | |
0 | | |
0.0 | % | |
0 | | |
0.0 | % | |
0 | | |
0.0 | % | |
NM | | |
NM | | |
NM | |
St. John Brand Key Financials(3)
(€
in thousands, unless otherwise noted)
| St. John Brand |
|
2022 |
|
|
2023 |
|
|
2024 |
|
|
23 H1
v |
|
|
24 H1
v |
|
|
22 H1 –
24 H1 |
|
| Key Financials |
|
% |
|
|
H1 |
|
|
% |
|
|
% |
|
|
H1 |
|
|
% |
|
|
22 H1 |
|
|
23 H1 |
|
|
CAGR |
|
| Key Financials on P&L |
|
|
|
|
|
|
|
|
|
|
|
|
|
|
|
|
|
|
|
|
|
|
|
|
|
|
|
| Revenues |
|
41,924 |
|
|
100.0 |
% |
|
46,663 |
|
|
100.0 |
% |
|
39,981 |
|
|
100.0 |
% |
|
11.3 |
% |
|
-14.3 |
% |
|
-2.3 |
% |
| Gross Profit |
|
25,754 |
|
|
61.4 |
% |
|
29,024 |
|
|
62.2 |
% |
|
27,696 |
|
|
69.3 |
% |
|
|
|
|
|
|
|
|
|
| Selling and distribution expenses |
|
-21,167 |
|
|
-50.5 |
% |
|
-23,719 |
|
|
-50.8 |
% |
|
-23,036 |
|
|
-57.6 |
% |
|
|
|
|
|
|
|
|
|
| Contribution Profit (1) |
|
4,587 |
|
|
10.9 |
% |
|
5,305 |
|
|
11.4 |
% |
|
4,660 |
|
|
11.7 |
% |
|
|
|
|
|
|
|
|
|
| |
|
|
|
|
|
|
|
|
|
|
|
|
|
|
|
|
|
|
|
|
|
|
|
|
|
|
|
| Revenues by Geography |
|
|
|
|
|
|
|
|
|
|
|
|
|
|
|
|
|
|
|
|
|
|
|
|
|
|
|
| EMEA |
|
343 |
|
|
0.8 |
% |
|
731 |
|
|
1.6 |
% |
|
299 |
|
|
0.7 |
% |
|
113.2 |
% |
|
-59.1 |
% |
|
-6.6 |
% |
| North America |
|
39,130 |
|
|
93.3 |
% |
|
41,585 |
|
|
89.1 |
% |
|
37,316 |
|
|
93.3 |
% |
|
6.3 |
% |
|
-10.3 |
% |
|
-2.3 |
% |
| Greater China |
|
2,283 |
|
|
5.4 |
% |
|
4,251 |
|
|
9.1 |
% |
|
2,247 |
|
|
5.6 |
% |
|
86.2 |
% |
|
-47.1 |
% |
|
-0.8 |
% |
| Other |
|
168 |
|
|
0.4 |
% |
|
96 |
|
|
0.2 |
% |
|
119 |
|
|
0.3 |
% |
|
-42.8 |
% |
|
24.8 |
% |
|
-15.8 |
% |
| |
|
|
|
|
|
|
|
|
|
|
|
|
|
|
|
|
|
|
|
|
|
|
|
|
|
|
|
| Revenues by Channel |
|
|
|
|
|
|
|
|
|
|
|
|
|
|
|
|
|
|
|
|
|
|
|
|
|
|
|
| DTC |
|
30,493 |
|
|
72.7 |
% |
|
37,760 |
|
|
80.9 |
% |
|
32,161 |
|
|
80.4 |
% |
|
23.8 |
% |
|
-14.8 |
% |
|
2.7 |
% |
| Wholesale |
|
11,431 |
|
|
27.3 |
% |
|
8,828 |
|
|
18.9 |
% |
|
7,704 |
|
|
19.3 |
% |
|
-22.8 |
% |
|
-12.7 |
% |
|
-17.9 |
% |
| Other |
|
0 |
|
|
0.0 |
% |
|
75 |
|
|
0.2 |
% |
|
116 |
|
|
0.3 |
% |
|
NM |
|
|
55.3 |
% |
|
NM |
|
Caruso Brand Key Financials(3)
(€ in thousands, unless otherwise noted)
| Caruso Brand Key |
|
2022 |
|
|
2023 |
|
|
2024 |
|
|
23 H1
v |
|
|
24 H1
v |
|
|
22 H1 –
24 H1 |
|
| Financials |
|
H1 |
|
|
% |
|
|
H1 |
|
|
% |
|
|
H1 |
|
|
% |
|
|
22 H1 |
|
|
23 H1 |
|
|
CAGR |
|
| Key Financials on P&L |
|
|
|
|
|
|
|
|
|
|
|
|
|
|
|
|
|
|
|
|
|
|
|
|
|
|
|
| Revenues |
|
14,919 |
|
|
100.0 |
% |
|
19,926 |
|
|
100.0 |
% |
|
19,734 |
|
|
100.0 |
% |
|
33.6 |
% |
|
-1.0 |
% |
|
15.0 |
% |
| Gross Profit |
|
3,731 |
|
|
25.0 |
% |
|
5,233 |
|
|
26.3 |
% |
|
5,723 |
|
|
29.0 |
% |
|
|
|
|
|
|
|
|
|
| Selling and distribution expenses |
|
-668 |
|
|
-4.5 |
% |
|
-842 |
|
|
-4.2 |
% |
|
-936 |
|
|
-4.7 |
% |
|
|
|
|
|
|
|
|
|
| Contribution Profit (1) |
|
3,063 |
|
|
20.5 |
% |
|
4,391 |
|
|
22.0 |
% |
|
4,787 |
|
|
24.3 |
% |
|
|
|
|
|
|
|
|
|
| |
|
|
|
|
|
|
|
|
|
|
|
|
|
|
|
|
|
|
|
|
|
|
|
|
|
|
|
| Revenues by Geography |
|
|
|
|
|
|
|
|
|
|
|
|
|
|
|
|
|
|
|
|
|
|
|
|
|
|
|
| EMEA |
|
11,380 |
|
|
76.2 |
% |
|
16,260 |
|
|
81.6 |
% |
|
16,795 |
|
|
85.1 |
% |
|
42.9 |
% |
|
3.3 |
% |
|
21.5 |
% |
| North America |
|
2,710 |
|
|
18.2 |
% |
|
2,674 |
|
|
13.4 |
% |
|
2,003 |
|
|
10.1 |
% |
|
-1.3 |
% |
|
-25.1 |
% |
|
-14.0 |
% |
| Greater China |
|
219 |
|
|
1.5 |
% |
|
32 |
|
|
0.2 |
% |
|
18 |
|
|
0.1 |
% |
|
-85.5 |
% |
|
-43.4 |
% |
|
-71.3 |
% |
| Other |
|
610 |
|
|
4.1 |
% |
|
960 |
|
|
4.8 |
% |
|
918 |
|
|
4.7 |
% |
|
57.3 |
% |
|
-4.4 |
% |
|
22.7 |
% |
| |
|
|
|
|
|
|
|
|
|
|
|
|
|
|
|
|
|
|
|
|
|
|
|
|
|
|
|
| Revenues by Channel |
|
|
|
|
|
|
|
|
|
|
|
|
|
|
|
|
|
|
|
|
|
|
|
|
|
|
|
| DTC |
|
0 |
|
|
0.0 |
% |
|
0 |
|
|
0.0 |
% |
|
31 |
|
|
0.2 |
% |
|
NM |
|
|
NM |
|
|
NM |
|
| Wholesale |
|
14,919 |
|
|
100.0 |
% |
|
19,926 |
|
|
100.0 |
% |
|
19,703 |
|
|
99.8 |
% |
|
33.6 |
% |
|
-1.1 |
% |
|
14.9 |
% |
| Other |
|
0 |
|
|
0.0 |
% |
|
0 |
|
|
0.0 |
% |
|
0 |
|
|
0.0 |
% |
|
NM |
|
|
NM |
|
|
NM |
|
Lanvin Group Brand Footprint
| | |
Jun 2023 | | |
Dec 2023 | | |
Jun 2024 | |
| DOS by Brand | |
DOS (4) | | |
DOS (4) | | |
DOS (4) | |
| Lanvin | |
| 32 | | |
| 36 | | |
| 37 | |
| Wolford | |
| 156 | | |
| 150 | | |
| 140 | |
| St. John | |
| 44 | | |
| 45 | | |
| 42 | |
| Sergio Rossi | |
| 50 | | |
| 48 | | |
| 47 | |
| Caruso | |
| 0 | | |
| 0 | | |
| 0 | |
| Total | |
| 282 | | |
| 279 | | |
| 266 | |
Non-IFRS Financial Measures Reconciliation
(€
in Thousands, unless otherwise noted)
| | |
2022 | | |
2023 | | |
2024 | |
| Reconciliation of Contribution Profit | |
H1 | | |
H1 | | |
H1 | |
| Revenue | |
| 201,700 | | |
| 214,537 | | |
| 170,976 | |
| Cost of sales | |
| -88,957 | | |
| -89,083 | | |
| -72,598 | |
| Gross Profit | |
| 112,743 | | |
| 125,454 | | |
| 98,378 | |
| Marketing and selling expenses | |
| -106,810 | | |
| -110,600 | | |
| -105,591 | |
| Contribution Profit (1) | |
| 5,933 | | |
| 14,854 | | |
| -7,213 | |
| General and administrative expenses | |
| -75,771 | | |
| -76,544 | | |
| -58,065 | |
| Adjusted Operating Profit (1) | |
| -69,838 | | |
| -61,690 | | |
| -65,278 | |
| | |
2022 | | |
2023 | | |
2024 | |
| Reconciliation of Adjusted EBIT | |
H1 | | |
H1 | | |
H1 | |
| Loss for the period | |
| -68,714 | | |
| -72,225 | | |
| -69,376 | |
| Add / (Deduct) the impact of: | |
| | | |
| | | |
| | |
| Income tax expenses | |
| -256 | | |
| 271 | | |
| -489 | |
| Finance cost—net | |
| 8,080 | | |
| 11,970 | | |
| 13,187 | |
| Non-underlying items | |
| -570 | | |
| -9,666 | | |
| -3,143 | |
| Loss from operations before non-underlying items | |
| -61,460 | | |
| -69,650 | | |
| -59,821 | |
| Add / (Deduct) the impact of: | |
| | | |
| | | |
| | |
| Share based compensation | |
| 4,297 | | |
| 1,971 | | |
| 827 | |
| Adjusted EBIT (1) | |
| -57,163 | | |
| -67,679 | | |
| -58,994 | |
| | |
2022 | | |
2023 | | |
2024 | |
| Reconciliation of Adjusted EBITDA | |
H1 | | |
H1 | | |
H1 | |
| Loss from operations before non-underlying items | |
| -61,460 | | |
| -69,650 | | |
| -59,821 | |
| D&A post IFRS16 | |
| 23,094 | | |
| 21,518 | | |
| 22,456 | |
| Provision and impairment losses | |
| 6,500 | | |
| -3,241 | | |
| -2,220 | |
| FX (gains)/losses | |
| -7,950 | | |
| 8,486 | | |
| -3,353 | |
| ESOP | |
| 4,297 | | |
| 1,971 | | |
| 827 | |
| Adjusted EBITDA (1) | |
| -35,519 | | |
| -40,916 | | |
| -42,111 | |
Note:
| (1) | These are Non-IFRS Financial Measures
and will be mentioned throughout this communication. Please see Non-IFRS Financial Measures
and Definition. |
| (2) | The amount less than Euro 1,000 is indicated
with "*”. |
| (3) | Brand-level results are presented exclusive
of eliminations. |
| (4) | DOS refers to Directly Operated Stores
which include boutiques, outlets, concession shop-in-shops and pop-up stores. |
Non-IFRS Financial Measures and Definitions
Our management monitors and evaluates operating
and financial performance using several non-IFRS financial measures including: Contribution Profit, Contribution Profit Margin, Adjusted
Operating Profit, Adjusted EBIT and Adjusted EBITDA. Our management believes that these non-IFRS financial measures provide useful and
relevant information regarding our performance and improve their ability to assess financial performance and financial position. They
also provide comparable measures that facilitate management’s ability to identify operational trends, as well as make decisions
regarding future spending, resource allocations and other operational decisions. While similar measures are widely used in the industry
in which we operate, the financial measures that we use may not be comparable to other similarly named measures used by other companies
nor are they intended to be substitutes for measures of financial performance or financial position as prepared in accordance with IFRS.
Contribution Profit is defined as revenue
less the cost of sales and selling and marketing expenses. Contribution Profit subtracts the main variable expenses of selling and marketing
expenses from Gross Profit, and our management believes this measure is an important indicator of profitability at the marginal level.
Below contribution profit, the main expenses are general administrative expenses and other operating expenses (which include foreign
exchange gains or losses and impairment losses). As we continue to improve the management of our portfolio brands, we believe we can
achieve greater economy of scale across the different brands by maintaining the fixed expenses at a lower level as a proportion of revenue.
We therefore use Contribution Profit Margin as a key indicator of profitability at the group level as well as the portfolio brand level.
Contribution Profit Margin is defined
as Contribution Profit divided by revenue.
Adjusted Operating Profit is defined as
Contribution Profit margin less General and administrative expenses
Adjusted EBIT is defined as profit or
loss before income taxes, net finance cost, share based compensation, adjusted for income and costs which are significant in nature and
that management considers not reflective of underlying operational activities, mainly including net gains on disposal of long-term assets,
negative goodwill from acquisition of Sergio Rossi, gain on debt restructuring and government grants.
Adjusted EBITDA is defined as profit or
loss before income taxes, net finance cost, exchange gains/(losses), depreciation, amortization, share based compensation and provisions
and impairment losses adjusted for income and costs which are significant in nature and that management considers not reflective of underlying
operational activities, mainly including net gains on disposal of long-term assets, negative goodwill from acquisition of Sergio Rossi,
gain on debt restructuring and government grants.
Exhibit 99.2

| August 26, 2024 |
| 2
Forward-Looking Statements
This presentation, including the sections “2024 First Half Achievements”, “2024 Outlook”, “Brand-Level Performance” and “Appendix”, contain “forward-looking statements” within the meaning of the “safe harbor” provisions of the Private Securities Litigation Reform Act of 1995. Forward-looking
statements generally are accompanied by words such as “believe,” “may,” “will,” “estimate,” “continue,” “anticipate,” “intend,” “expect,” “should,” “would,” “plan,” “predict,” “potential,” “seem,” “seek,” “future,” “outlook,” “guidance,” “project” and similar expressions that predict or indicate future events or
trends or that are not statements of historical matters. These forward-looking statements include, but are not limited to, statements regarding estimates and forecasts of other financial and performance metrics and projections of market opportunity. These statements are based on various
assumptions, whether or not identified in this presentation, and on the current expectations of the respective management of Lanvin Group and are not predictions of actual performance. These forward-looking statements are provided for illustrative purposes only and must not be relied on by an
investor as, a guarantee, an assurance, a prediction or a definitive statement of fact or probability. Actual events and circumstances are difficult or impossible to predict and will differ from assumptions. Many actual events and circumstances are beyond the control of Lanvin Group. Potential risks
and uncertainties that could cause the actual results to differ materially from those expressed or implied by forward-looking statements include, but are not limited to, Lanvin Group's ability to timely complete its financial closing procedures and finalize its consolidated financial statements for the six
months ended June 30, 2024; changes adversely affecting the business in which Lanvin Group is engaged; Lanvin Group’s projected financial information, anticipated growth rate, profitability and market opportunity may not be an indication of its actual results or future results; management of
growth; the impact of health epidemics, pandemics and similar outbreaks, including the COVID-19 pandemic on Lanvin Group's businesses; Lanvin Group’s ability to safeguard the value, recognition and reputation of its brands and to identify and respond to new and changing customer preferences;
the ability and desire of consumers to shop; Lanvin Group’s ability to successfully implement its business strategies and plans; Lanvin Group’s ability to effectively manage its advertising and marketing expenses and achieve desired impact; its ability to accurately forecast consumer demand; high
levels of competition in the personal luxury products market; disruptions to Lanvin Group’s distribution facilities or its distribution partners; Lanvin Group’s ability to negotiate, maintain or renew its license agreements; Lanvin Group’s ability to protect its intellectual property rights; Lanvin Group’s
ability to attract and retain qualified employees and preserve craftmanship skills; Lanvin Group’s ability to develop and maintain effective internal controls; general economic conditions; the result of future financing efforts; and those factors discussed in the reports filed by Lanvin Group from time to
time with the SEC. If any of these risks materialize or Lanvin Group’s assumptions prove incorrect, actual results could differ materially from the results implied by these forward-looking statements. There may be additional risks that Lanvin Group presently does not know, or that Lanvin Group
currently believes are immaterial, that could also cause actual results to differ from those contained in the forward-looking statements. In addition, forward-looking statements reflect Lanvin Group’s expectations, plans, or forecasts of future events and views as of the date of this presentation.
Lanvin Group anticipates that subsequent events and developments will cause Lanvin Group’s assessments to change. However, while Lanvin Group may elect to update these forward-looking statements at some point in the future, Lanvin Group specifically disclaim any obligation to do so. These
forward-looking statements should not be relied upon as representing Lanvin Group’s assessments of any date subsequent to the date of this presentation. Accordingly, reliance should not be placed upon the forward-looking statements.
Use of Non-IFRS Financial Metrics
This presentation includes certain non-IFRS financial measures (including on a forward-looking basis) such as Contribution Profit, Contribution Profit Margin, Adjusted Operating Profit, adjusted earnings before interest and taxes (“Adjusted EBIT”), and adjusted earnings before interest, taxes,
depreciation and amortization (“Adjusted EBITDA”). These non-IFRS measures are an addition, and not a substitute for or superior to measures of financial performance prepared in accordance with IFRS and should not be considered as an alternative to net income, operating income or any other
performance measures derived in accordance with IFRS. Reconciliations of non-IFRS measures to their most directly comparable IFRS counterparts are included in the Appendix to this presentation. Lanvin Group believes that these non- IFRS measures of financial results (including on a forward-looking basis) provide useful supplemental information to investors about Lanvin Group. Lanvin Group's management uses forward looking non-IFRS measures to evaluate Lanvin Group's projected financial and operating performance. Lanvin Group believes that the use of these non-IFRS financial
measures provides an additional tool for investors to use in evaluating projected operating results and trends in and in comparing Lanvin Group's financial measures with other similar companies, many of which present similar non-IFRS financial measures to investors. However, there are a number of
limitations related to the use of these non-IFRS measures and their nearest IFRS equivalents. For example, other companies may calculate non-IFRS measures differently, or may use other measures to calculate their financial performance, and therefore Lanvin Group's non-IFRS measures may not
be directly comparable to similarly titled measures of other companies. Lanvin Group does not consider these non-IFRS measures in isolation or as an alternative to financial measures determined in accordance with IFRS. The principal limitation of these non-IFRS financial measures is that they
exclude significant expenses, income and tax liabilities that are required by IFRS to be recorded in Lanvin Group's financial statements. In addition, they are subject to inherent limitations as they reflect the exercise of judgements by Lanvin Group about which expense and income are excluded or
included in determining these non-IFRS financial measures. In order to compensate for these limitations, Lanvin Group presents non-IFRS financial measures in connection with IFRS results. |
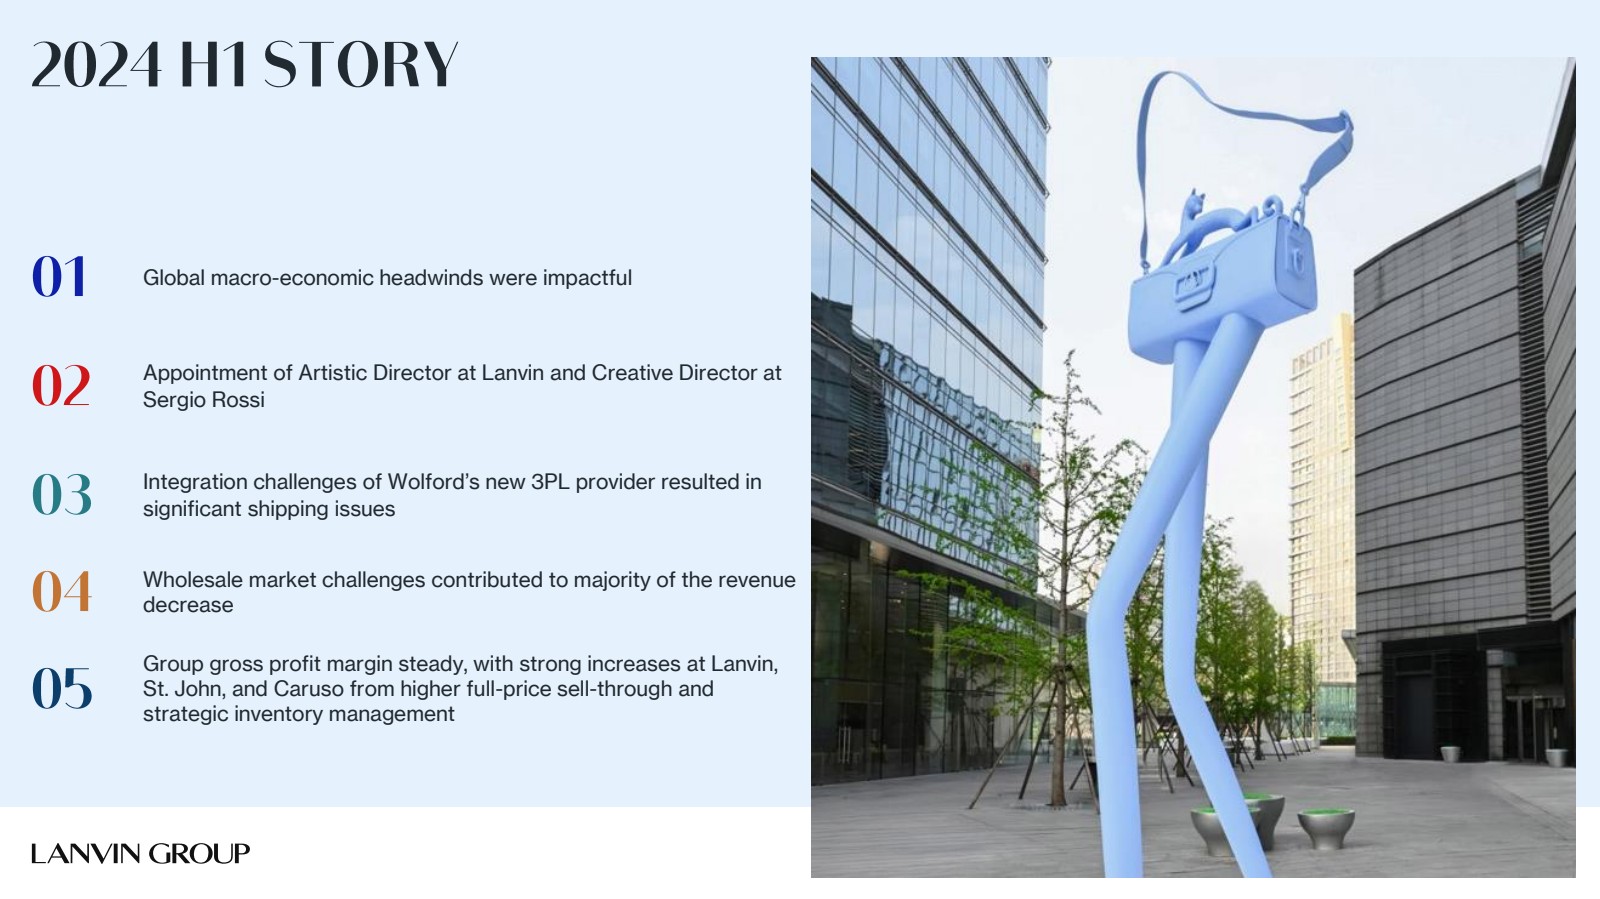
| Global macro-economic headwinds were impactful
Appointment of Artistic Director at Lanvin and Creative Director at
Sergio Rossi
Integration challenges of Wolford’s new 3PL provider resulted in
significant shipping issues
Wholesale market challenges contributed to majority of the revenue
decrease
Group gross profit margin steady, with strong increases at Lanvin,
St. John, and Caruso from higher full-price sell-through and
strategic inventory management |

| 5
FIRST HALF ACHIEVEMENTS
• Peter Copping introduced as
upcoming Artistic Director
• Lanvin Lab 2.0 - partnered with
artist Erwin Wurm for a
monumental bag sculpture that
will tour five key cities in China
• Continued push of the iconic
ballerina and iconic dresses
with the Benjamin Millepied
video project
• Reopening of the South Coast
Plaza boutique in May
• Successful launch of W.O.W
leggings across all channels
with exceptional sell-through
• Opened store in Kuwait City,
marking its first location in the
Middle East
• Successful client events with
Central Park Conservancy and
JP Morgan
• NY flagship store opened
• Successful launch party with
Vogue for St. John Vintage Edit
• Edie Parker x St. John
campaign featuring Leighton
Meister had 2M+ views in 2
weeks with 1.1M likes; grew
TikTok followers by 2000%
• New AAA fashion maison
account gained, first orders
exceeding €1M (to impact H2)
• Successful showcasing of
FW24 and SS25 collections at
Pitti Uomo with great press
coverage; led to new business
development
• First flagship store opened in
Dubai Mall; future store opening
in Abu Dhabi in 2025
• Successful retail pop-ups in
Japan to celebrate the iconic
Mermaid collection SS24
• Paul Andrew announced as
new Creative Director in July
2024; first major seasonal
launch will be in 2025 |
| 6
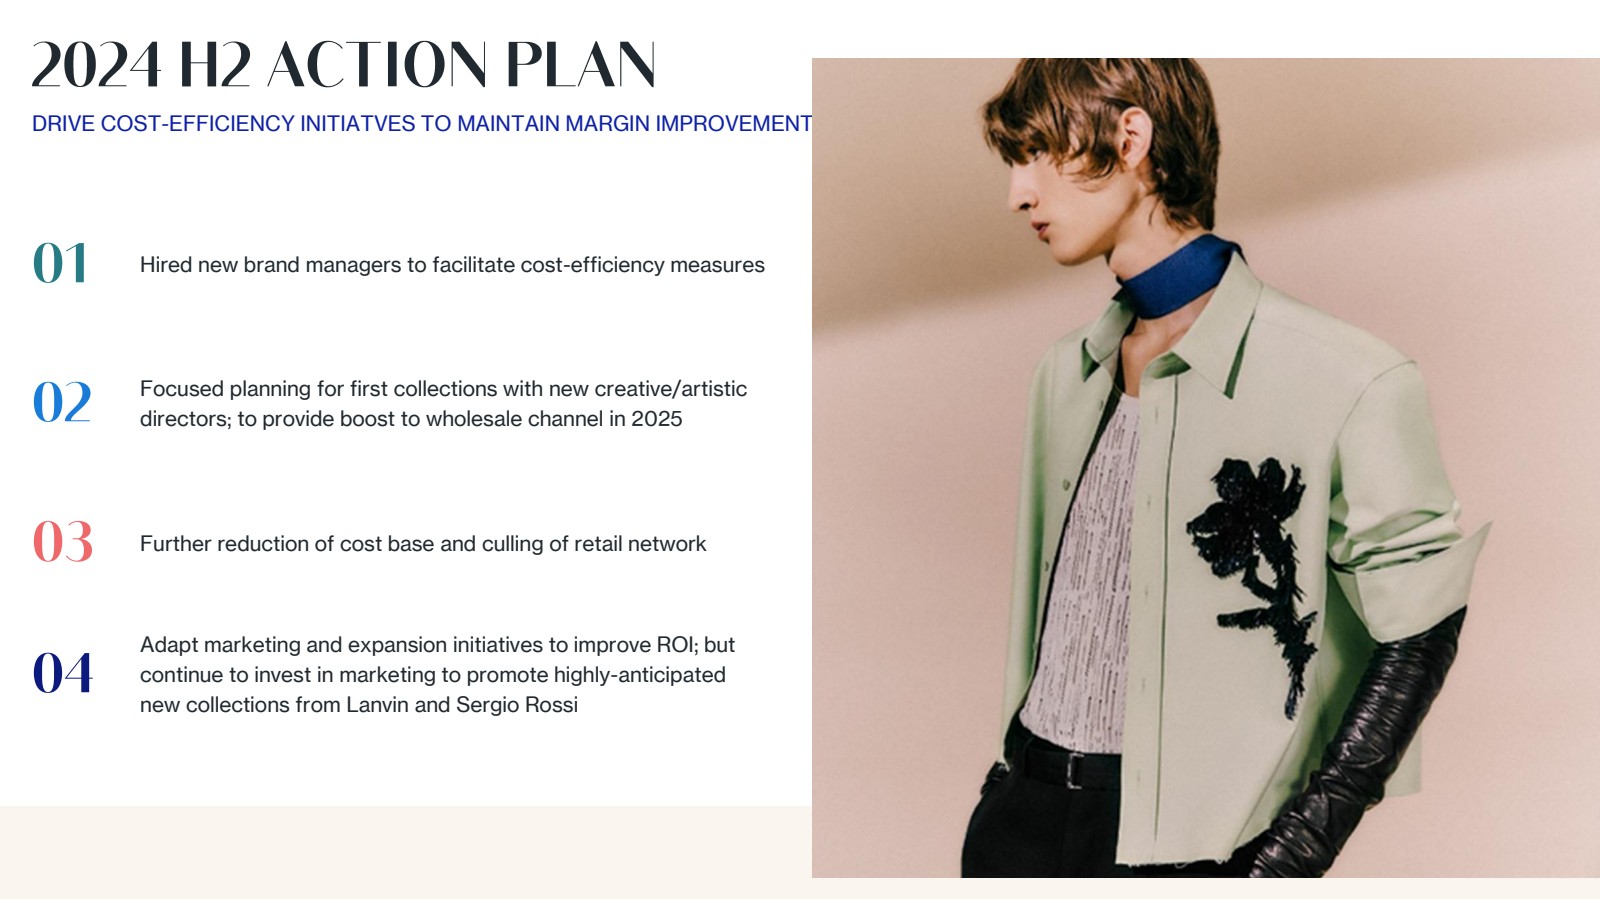
Hired new brand managers to facilitate cost-efficiency measures
Focused planning for first collections with new creative/artistic
directors; to provide boost to wholesale channel in 2025
Further reduction of cost base and more aggressive culling of
retail network
Adapt marketing and expansion initiatives to improve ROI; but
continue to invest in marketing to promote highly-anticipated
new collections from Lanvin and Sergio Rossi
6
DRIVE COST-EFFICIENCY INITIATVES TO MAINTAIN MARGIN IMPROVEMENT |
| 7
THE GROUP IS WORKING ON NEW INITIATIVES TO SUPPORT ITS BRANDS
Working on Group-level partnerships
for product category expansion
opportunities and global logistics
support
Pursuing partnerships for Middle East
expansion as well as building an investor
network
Further synergizing back-office
functions to reduce overhead costs
and improve efficiency |
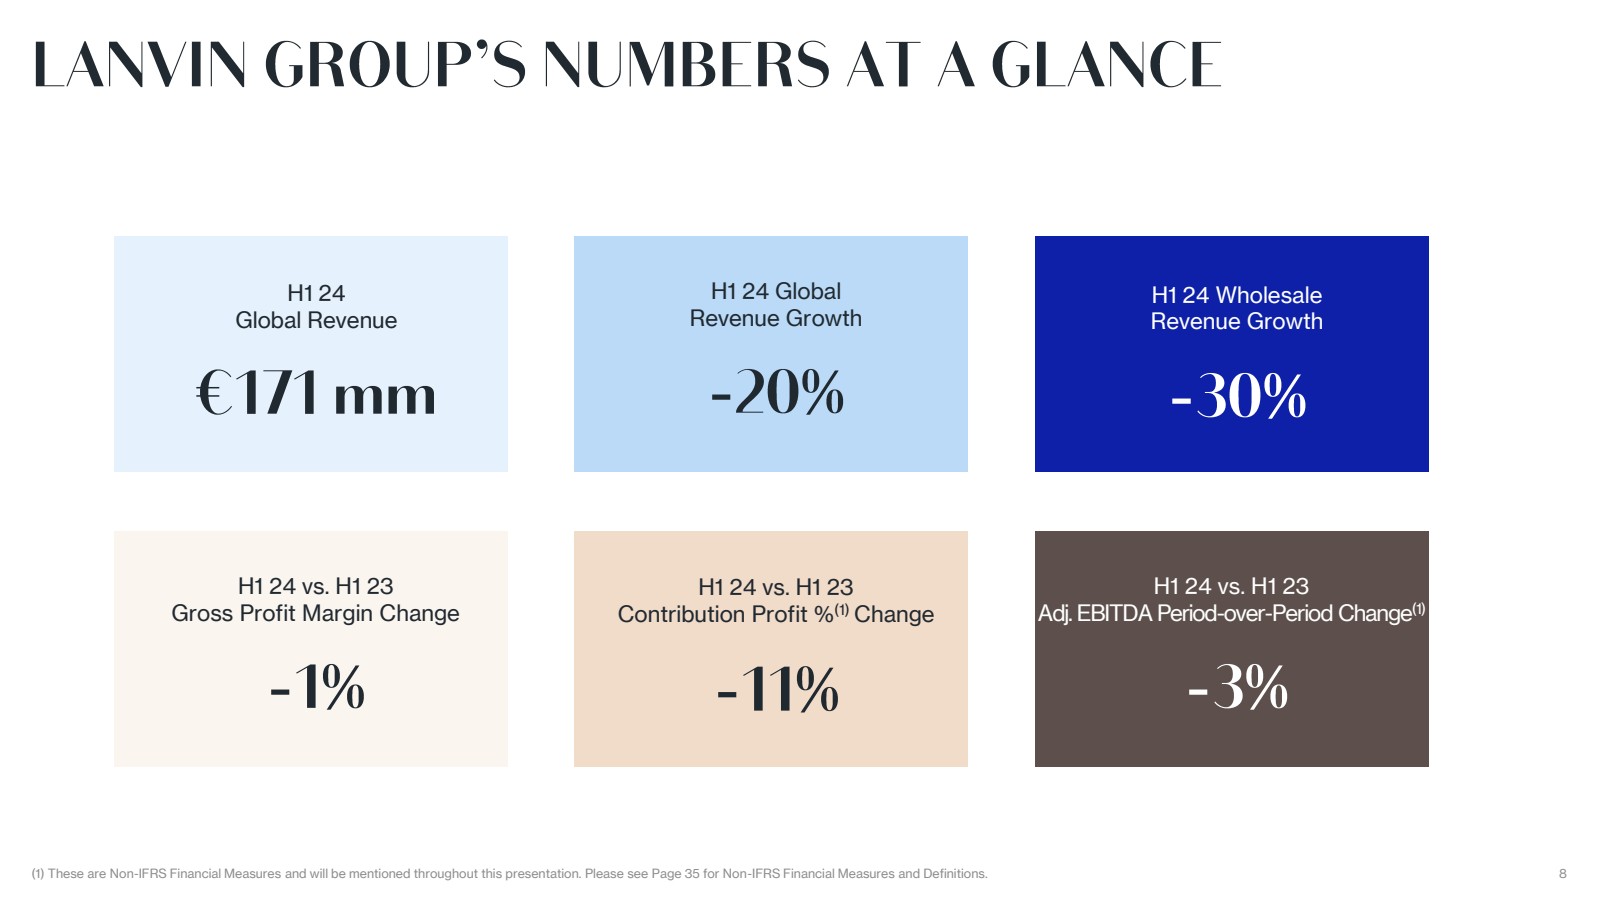
| (1) These are Non-IFRS Financial Measures and will be mentioned throughout this presentation. Please see Page 35 for Non-IFRS Financial Measures and Definitions. 8
H1 24
Global Revenue
H1 24 Wholesale
Revenue Growth
H1 24 Global
Revenue Growth
H1 24 vs. H1 23
Contribution Profit %(1) Change
H1 24 vs. H1 23
Gross Profit Margin Change
H1 24 vs. H1 23
Adj. EBITDA Period-over-Period Change
(1) |
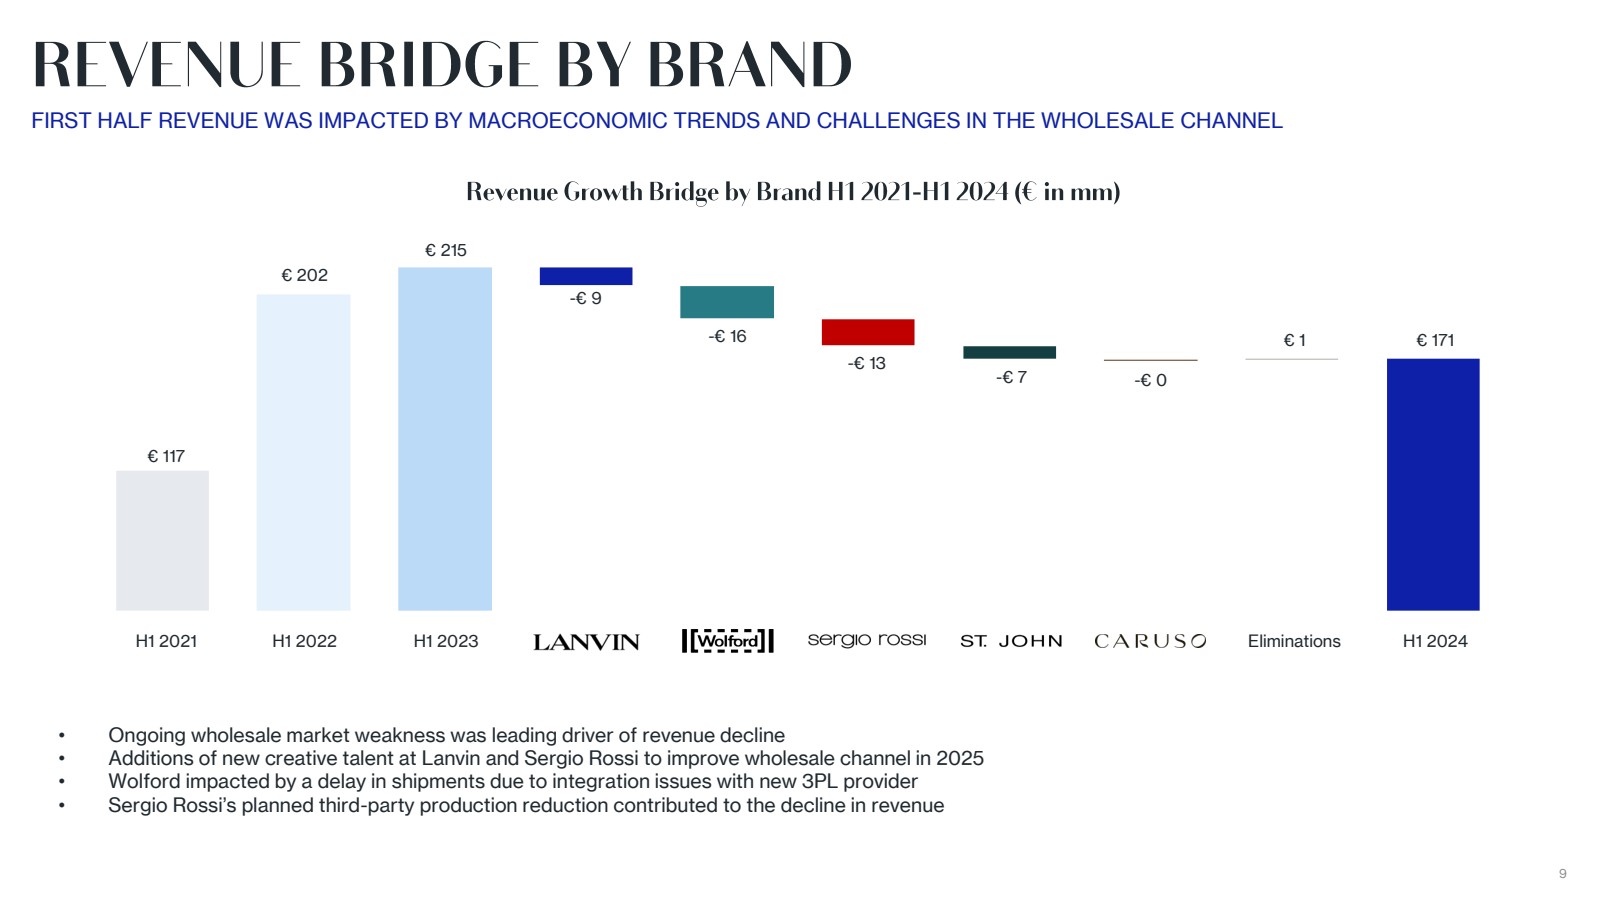
| 9
FIRST HALF REVENUE WAS IMPACTED BY MACROECONOMIC TRENDS AND CHALLENGES IN THE WHOLESALE CHANNEL
• Ongoing wholesale market weakness was leading driver of revenue decline
• Additions of new creative talent at Lanvin and Sergio Rossi to improve wholesale channel in 2025
• Wolford impacted by a delay in shipments due to integration issues with new 3PL provider
• Sergio Rossi’s planned third-party production reduction contributed to the decline in revenue
H1 2021 H1 2022 H1 2023 Eliminations H1 2024
€ 117
€ 202
€ 215
-€ 9
-€ 16
-€ 13
-€ 7 -€ 0
€ 1 € 171 |
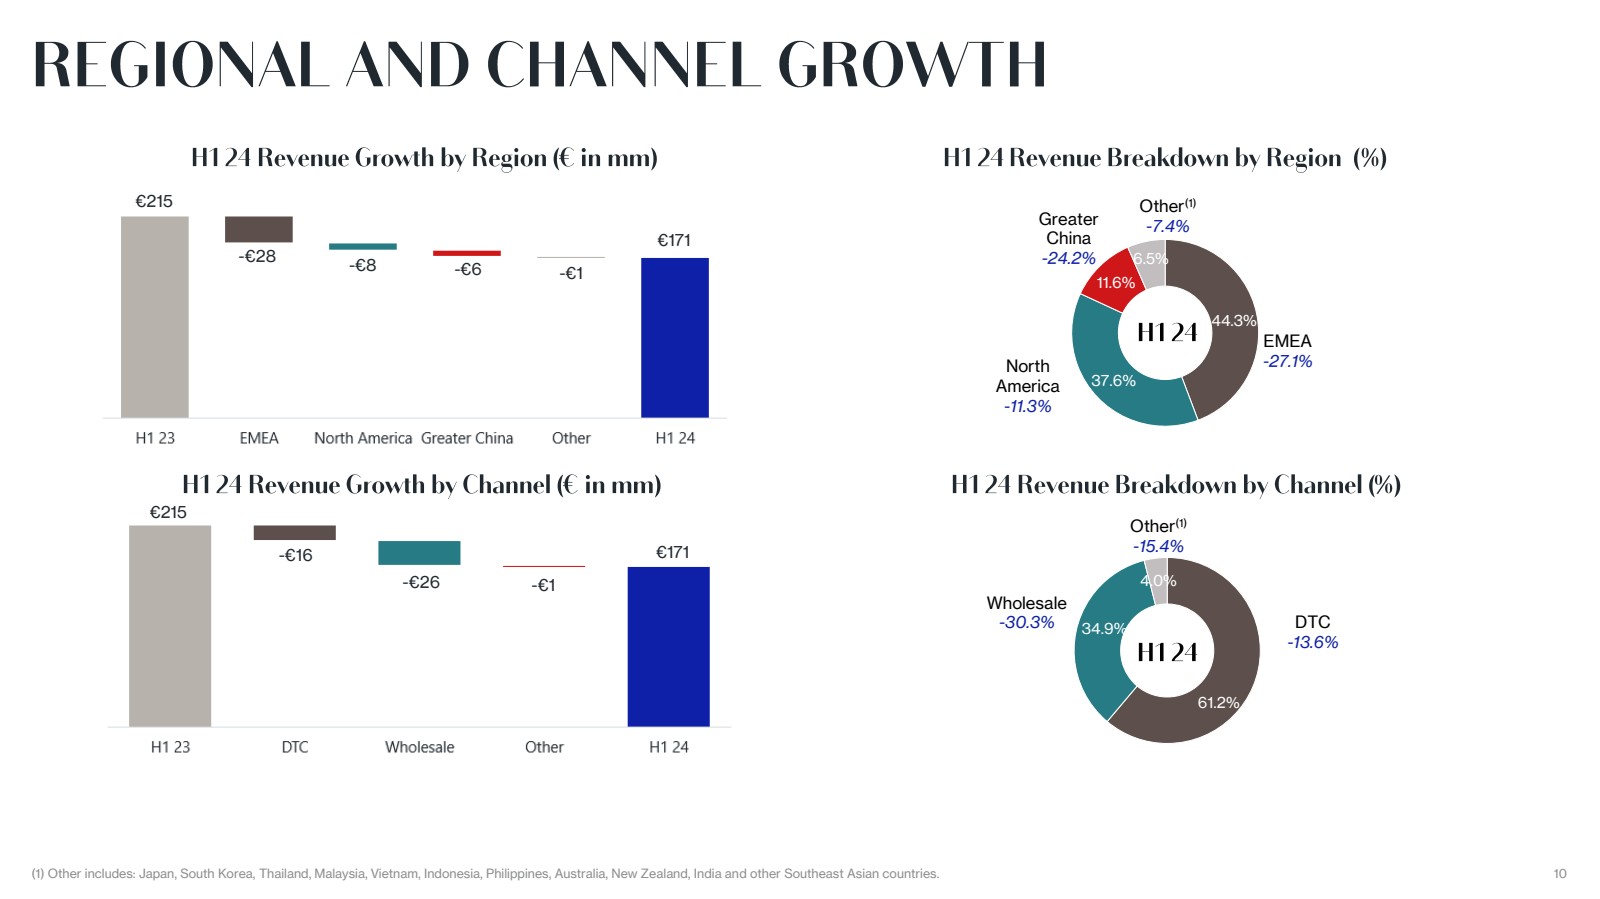
| (1) Other includes: Japan, South Korea, Thailand, Malaysia, Vietnam, Indonesia, Philippines, Australia, New Zealand, India and other Southeast Asian countries. 10
44.3%
37.6%
11.6%
6.5%
North
America
-11.3%
EMEA
-27.1%
Greater
China
-24.2%
Other(1)
-7.4%
€215
61.2%
34.9%
4.0%
Other(1)
-15.4%
DTC
-13.6%
Wholesale
-30.3%
€171
-€28
-€8 -€6 -€1
€215
-€16 €171
-€26 -€1 |
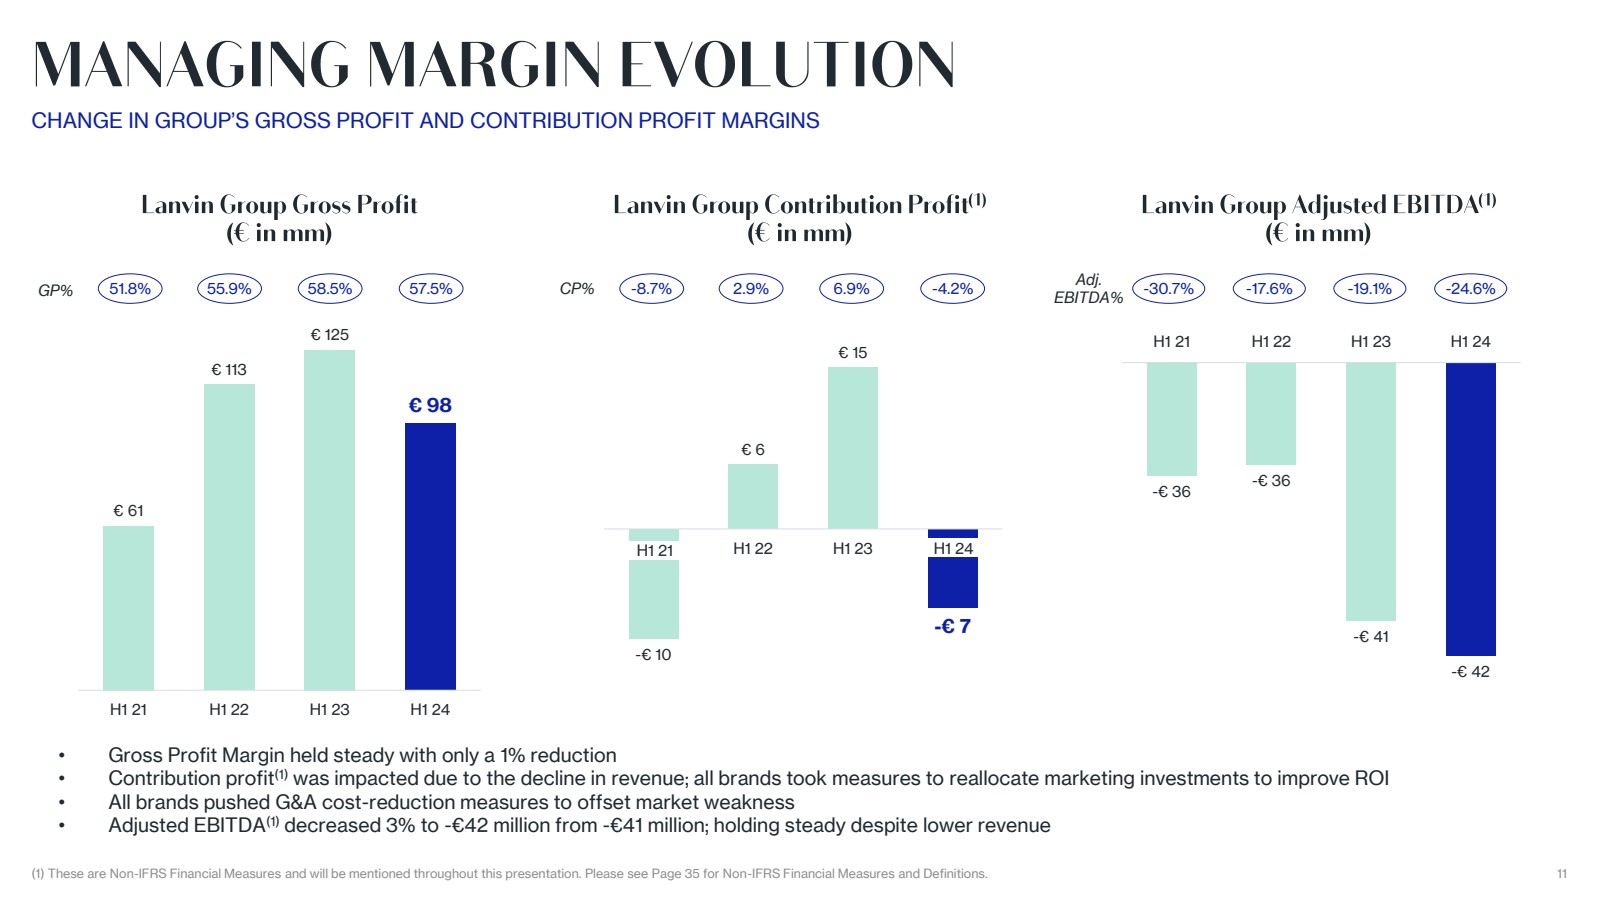
| 11
• Gross Profit Margin held steady with only a 1% reduction
• Contribution profit was impacted due to the decline in revenue; all brands took measures to reallocate marketing investments to improve ROI
• All brands pushed G&A cost-reduction measures to offset market weakness
• Adjusted EBITDA decreased 3% to -€42 million from -€41 million; holding steady despite lower revenue
(1) These are Non-IFRS Financial Measures and will be mentioned throughout this presentation. Please see Page 35 for Non-IFRS Financial Measures and Definitions.
GP% 51.8%
CHANGE IN GROUP’S GROSS PROFIT AND CONTRIBUTION PROFIT MARGINS
€ 61
€ 113
€ 125
€ 98
H1 21 H1 22 H1 23 H1 24
55.9% 58.5% 57.5%
-€ 10
€ 6
€ 15
-€ 7
H1 21 H1 21 H1 22 H1 23 H1 24
CP% -8.7% 2.9% 6.9% -4.2%
-€ 36
-€ 36
-€ 41
-€ 42
H1 21 H1 22 H1 23 H1 24
Adj.
EBITDA% -30.7% -17.6% -19.1% -24.6% |
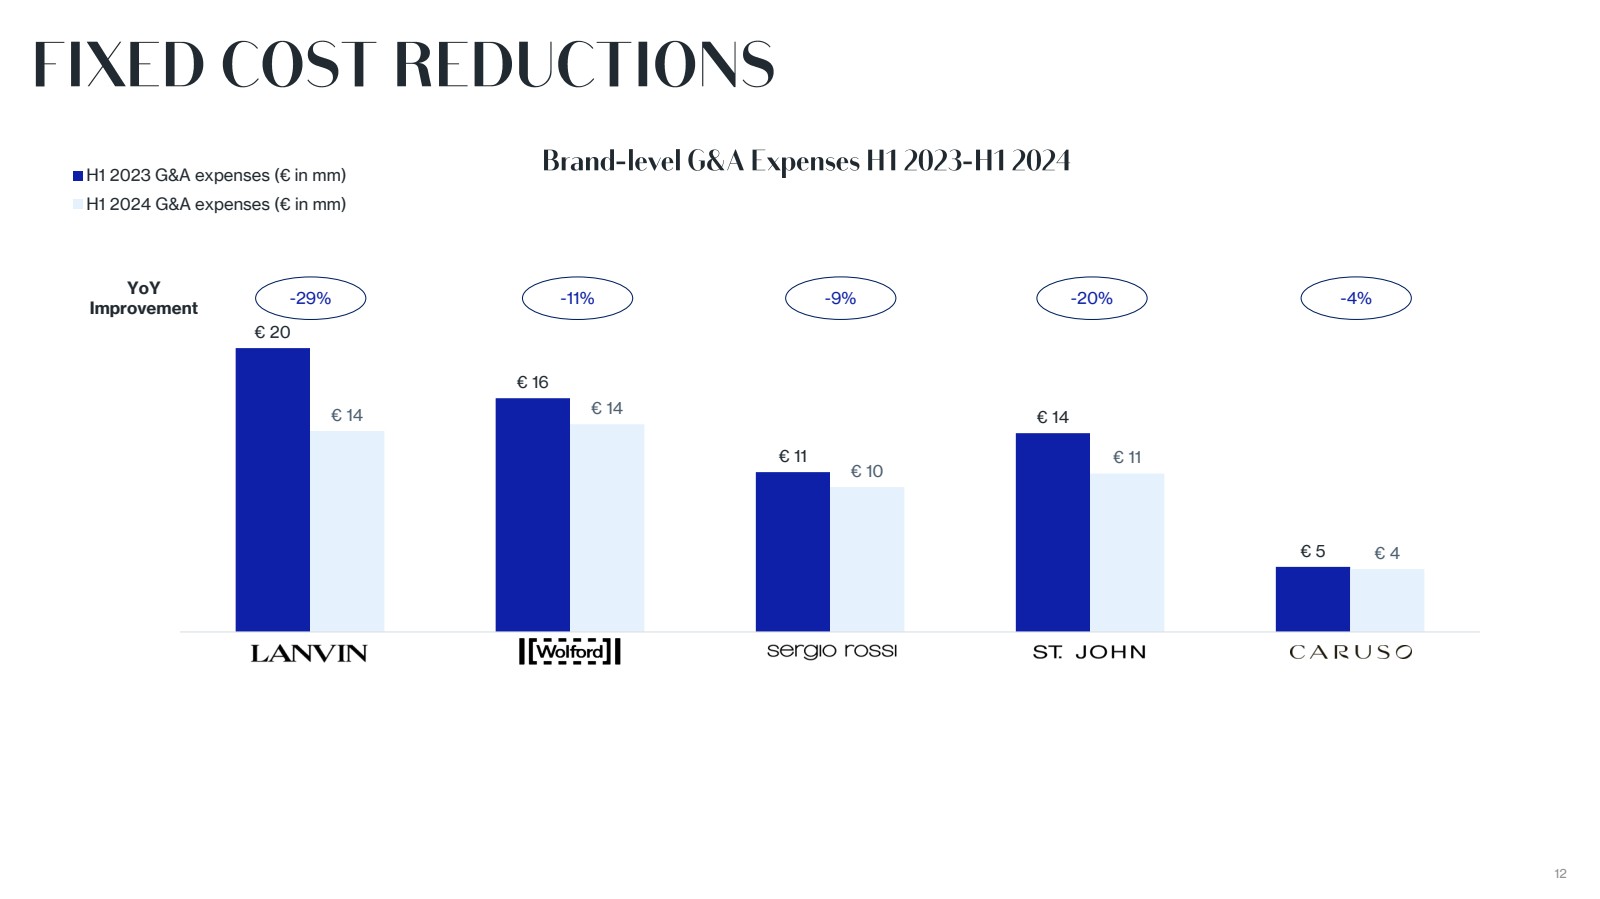
| 12
€ 20
€ 16
€ 11
€ 14
€ 5
€ 14 € 14
€ 10
€ 11
€ 4
0
5
10
15
20
25
H1 2023 G&A expenses (€ in mm)
H1 2024 G&A expenses (€ in mm)
-29% -11% -9% -20% -4% YoY
Improvement |
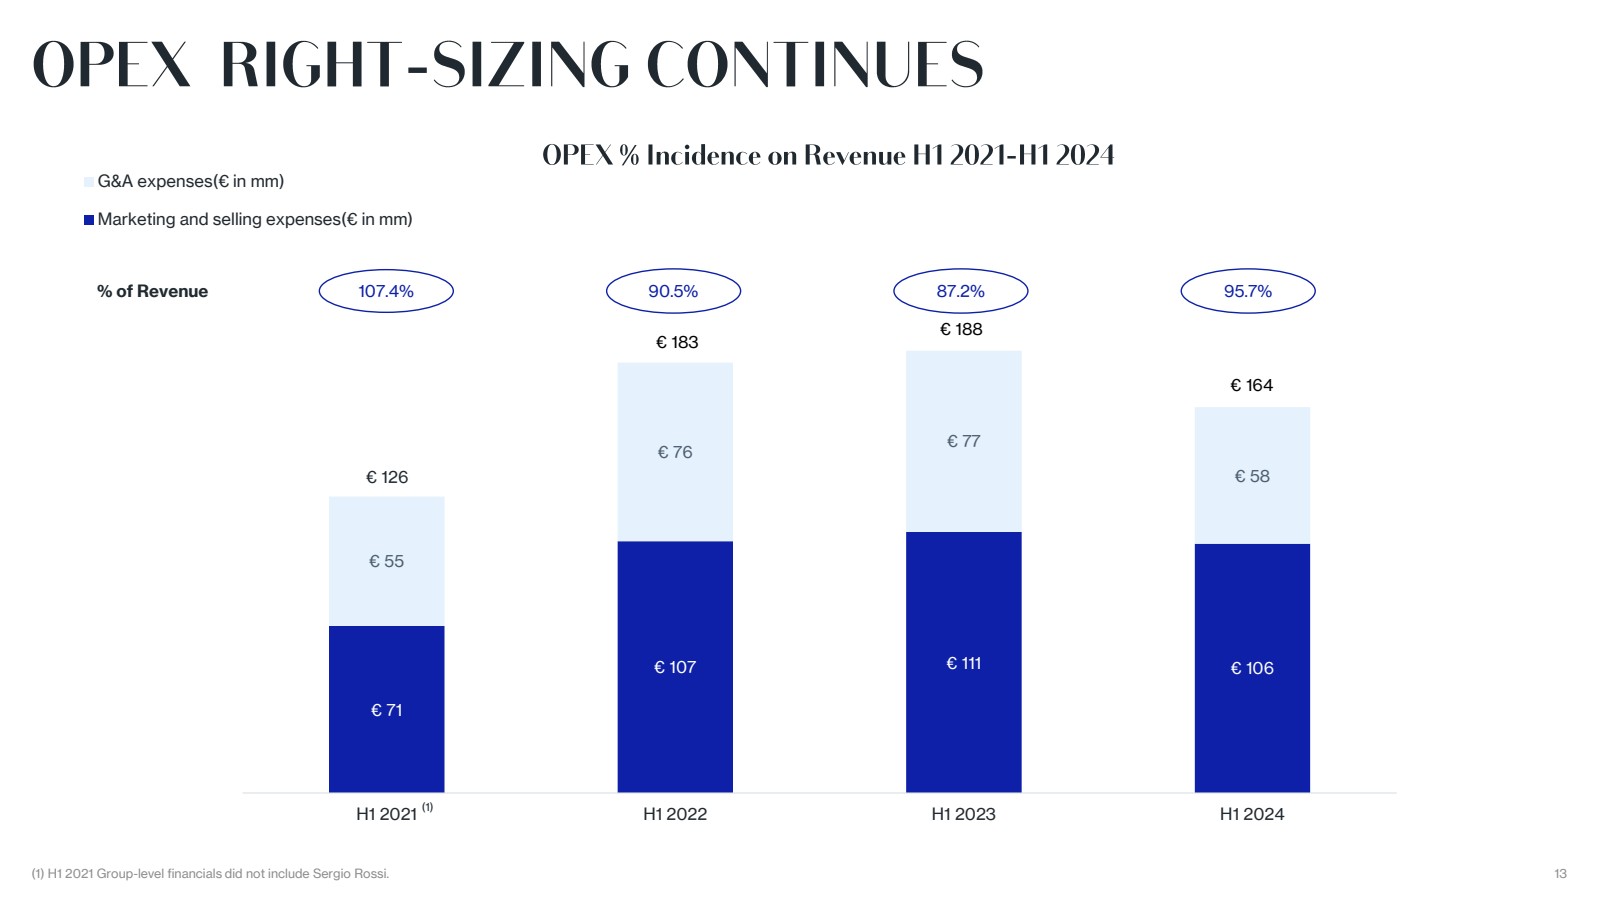
| 13
€ 71
€ 107 € 111 € 106
€ 55
€ 76 € 77
€ 58
0
20
40
60
80
100
120
140
160
180
200
H1 2021 H1 2022 H1 2023 H1 2024
G&A expenses(€ in mm)
Marketing and selling expenses(€ in mm)
€ 126
€ 183
€ 188
€ 164
(1) H1 2021 Group
-level financials did not include Sergio Rossi.
% of Revenue 107.4% 90.5% 87.2% 95.7%
(1) |
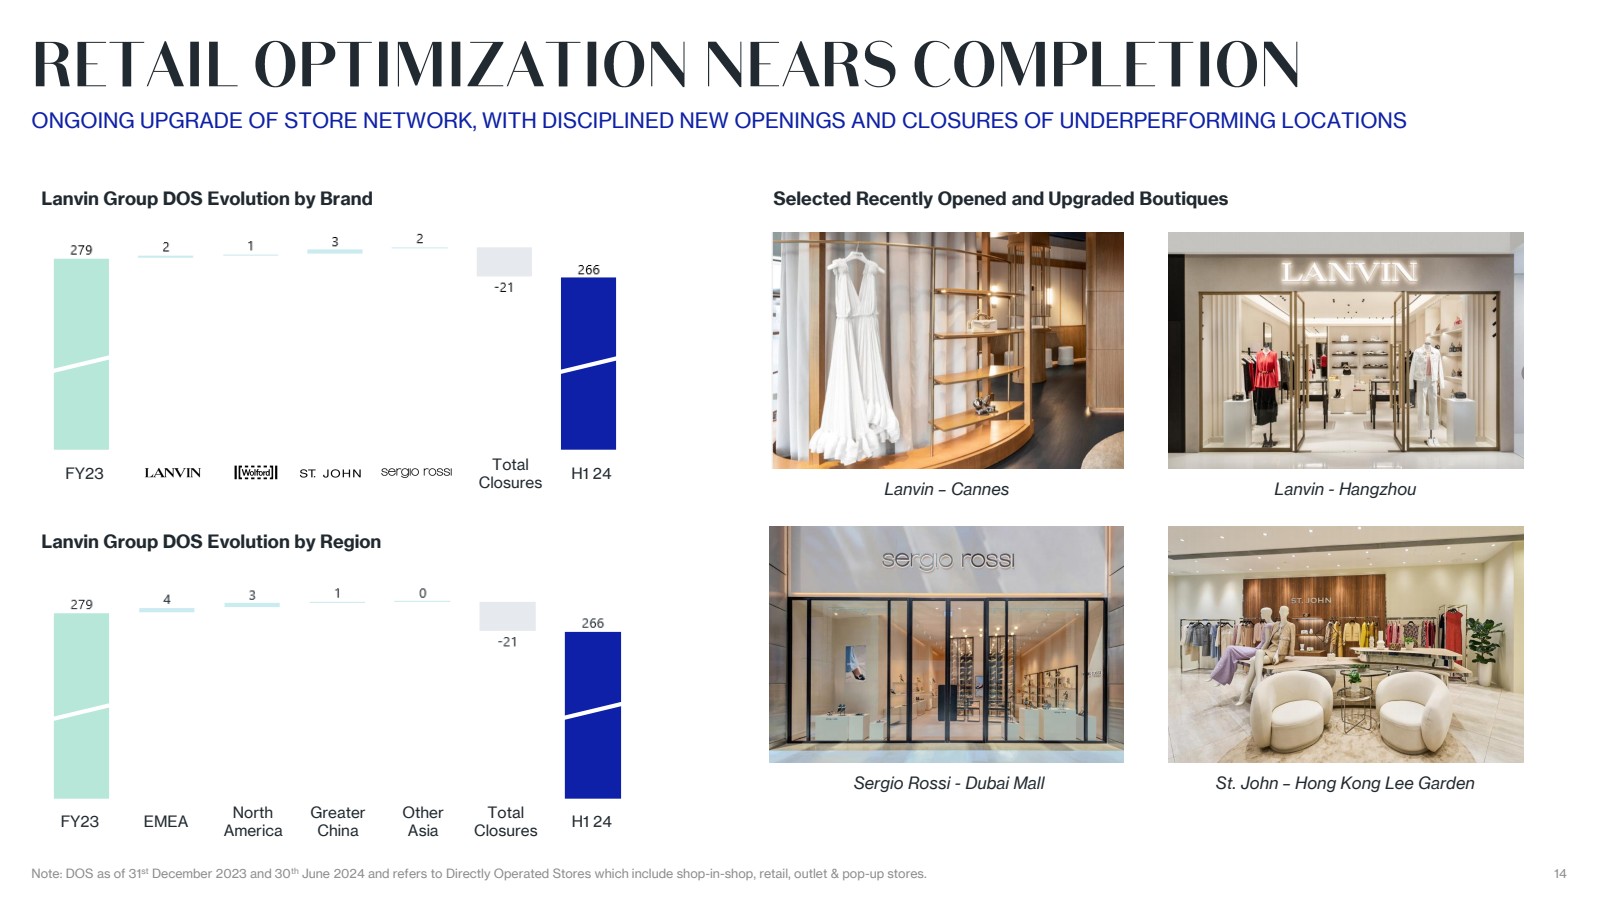
| Note: DOS as of 31st December 2023 and 30th June 2024 and refers to Directly Operated Stores which include shop-in-shop, retail, outlet & pop-up stores. 14
ONGOING UPGRADE OF STORE NETWORK, WITH DISCIPLINED NEW OPENINGS AND CLOSURES OF UNDERPERFORMING LOCATIONS
Lanvin Group DOS Evolution by Brand
Lanvin Group DOS Evolution by Region
FY23 Total
Closures H1 24
FY23 EMEA North
America
Greater
China
Other
Asia
Total
Closures H1 24
Lanvin – Cannes Lanvin - Hangzhou
Sergio Rossi - Dubai Mall St. John – Hong Kong Lee Garden
Selected Recently Opened and Upgraded Boutiques |
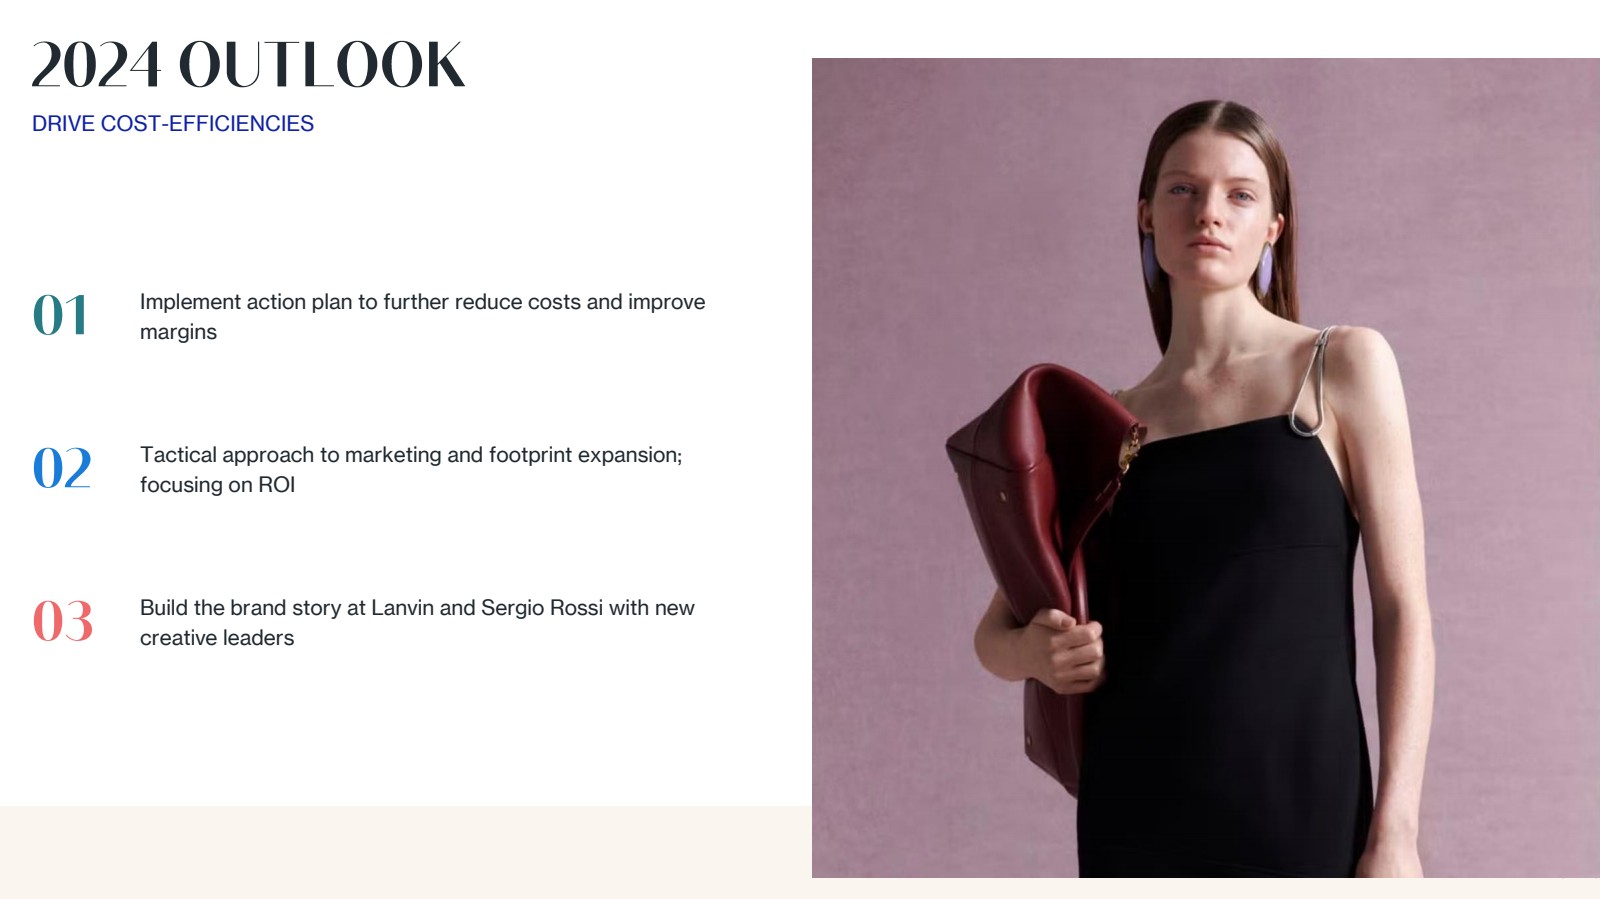
| 15
Implement action plan to further reduce costs and improve
margins
Tactical approach to marketing and footprint expansion;
focusing on ROI
Build the brand story at Lanvin and Sergio Rossi with new
creative leaders
15
DRIVE COST-EFFICIENCIES |
| 17
(1) Non-IFRS Financial Measure. Please see Page 35 for Non-IFRS Financial Measures and Definitions.
Note: Brand-level results are presented exclusive of eliminations.
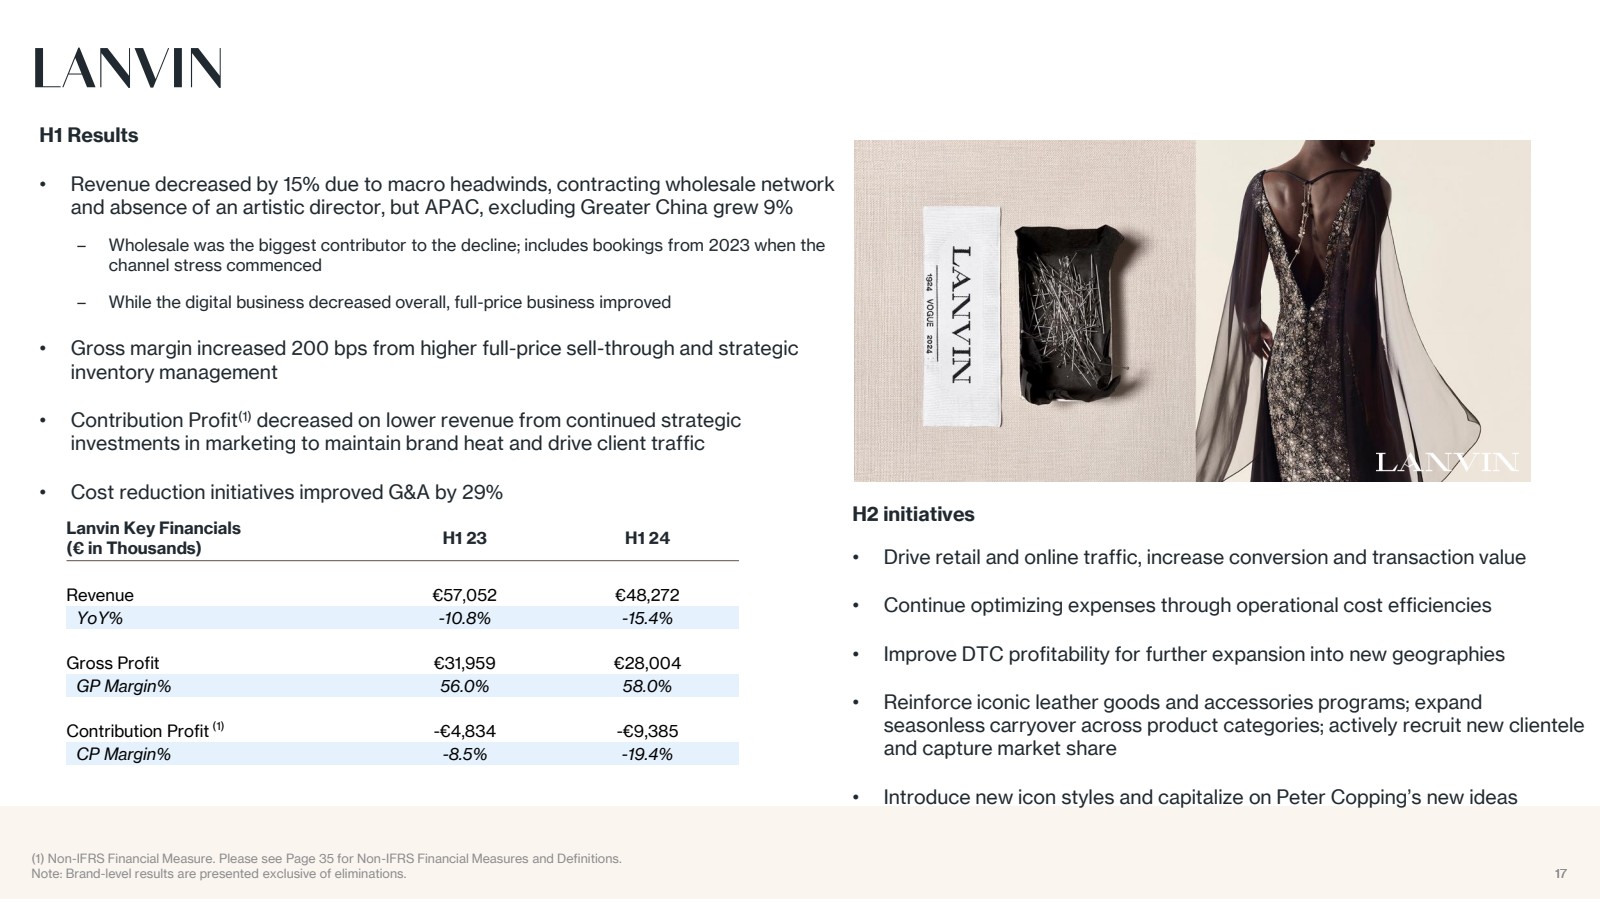
H1 Results
• Revenue decreased by 15% due to macro headwinds, contracting wholesale network
and absence of an artistic director, but APAC, excluding Greater China grew 9%
– Wholesale was the biggest contributor to the decline; includes bookings from 2023 when the
channel stress commenced
– While the digital business decreased overall, full-price business improved
• Gross margin increased 200 bps from higher full-price sell-through and strategic
inventory management
• Contribution Profit decreased on lower revenue from continued strategic
investments in marketing to maintain brand heat and drive client traffic
• Cost reduction initiatives improved G&A by 29%
Lanvin Key Financials
(€ in Thousands) H1 23 H1 24
Revenue €57,052 €48,272
YoY% -10.8% -15.4%
Gross Profit €31,959 €28,004
GP Margin% 56.0% 58.0%
Contribution Profit (1)
-€4,834 -€9,385
CP Margin% -8.5% -19.4%
H2 initiatives
• Drive retail and online traffic, increase conversion and transaction value
• Continue optimizing expenses through operational cost efficiencies
• Improve DTC profitability for further expansion into new geographies
• Reinforce iconic leather goods and accessories programs; expand
seasonless carryover across product categories; actively recruit new clientele
and capture market share
• Introduce new icon styles and capitalize on Peter Copping’s new ideas |
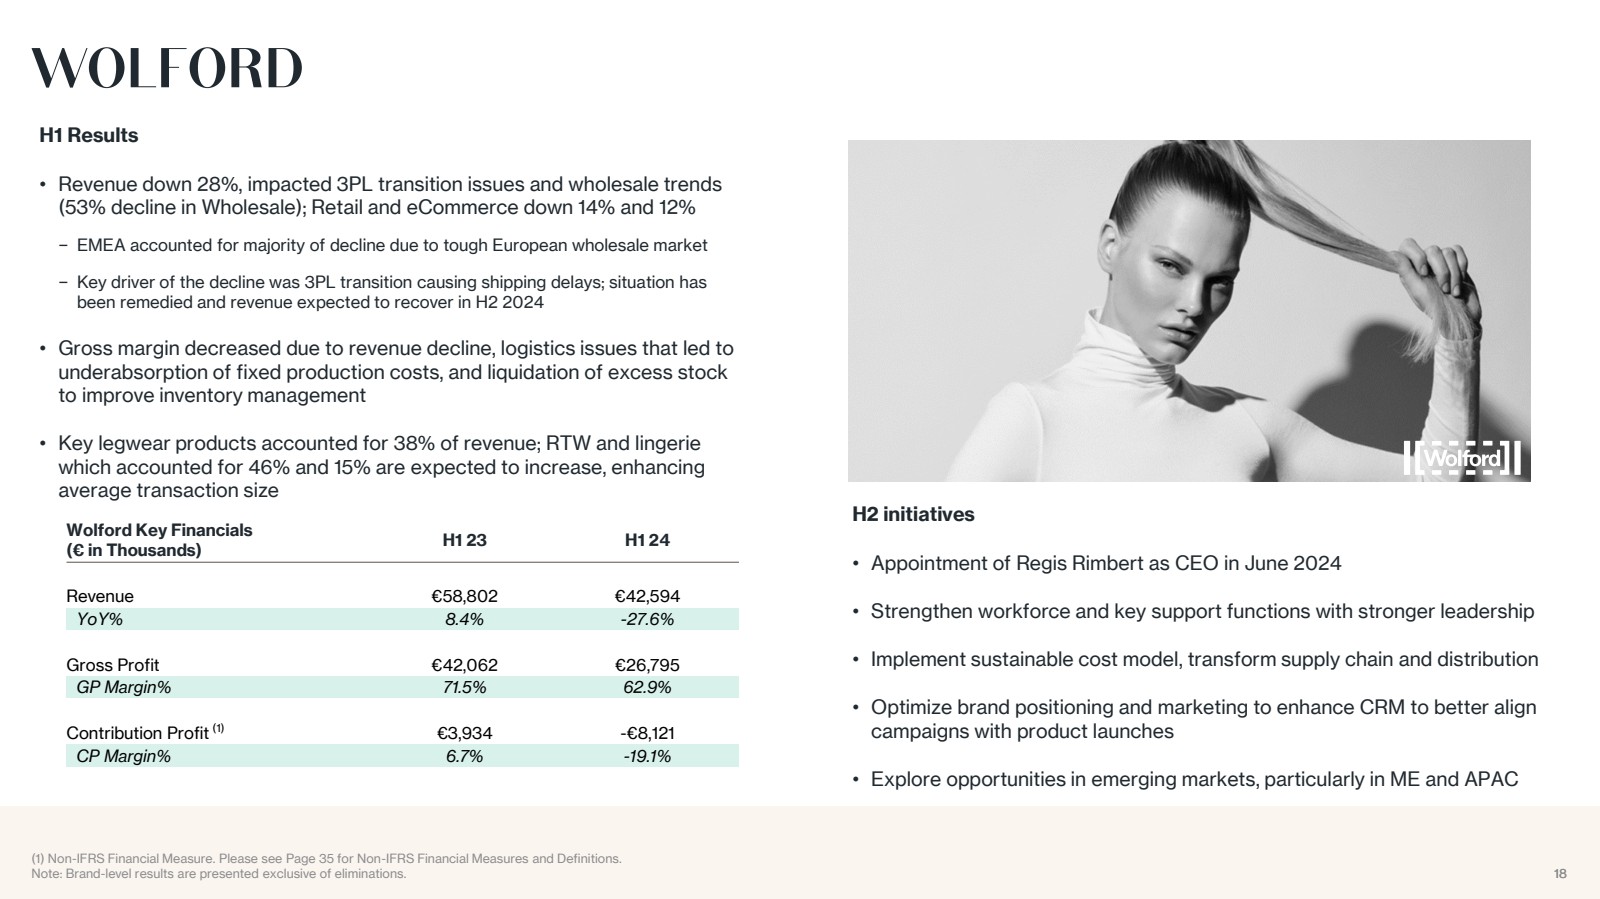
| 18
Wolford Key Financials
(€ in Thousands) H1 23 H1 24
Revenue €58,802 €42,594
YoY% 8.4% -27.6%
Gross Profit €42,062 €26,795
GP Margin% 71.5% 62.9%
Contribution Profit (1) €3,934 -€8,121
CP Margin% 6.7% -19.1%
18
(1) Non-IFRS Financial Measure. Please see Page 35 for Non-IFRS Financial Measures and Definitions.
Note: Brand-level results are presented exclusive of eliminations.
H1 Results
• Revenue down 28%, impacted 3PL transition issues and wholesale trends
(53% decline in Wholesale); Retail and eCommerce down 14% and 12%
− EMEA accounted for majority of decline due to tough European wholesale market
− Key driver of the decline was 3PL transition causing shipping delays; situation has
been remedied and revenue expected to recover in H2 2024
• Gross margin decreased due to revenue decline, logistics issues that led to
underabsorption of fixed production costs, and liquidation of excess stock
to improve inventory management
• Key legwear products accounted for 38% of revenue; RTW and lingerie
which accounted for 46% and 15% are expected to increase, enhancing
average transaction size
H2 initiatives
• Appointment of Regis Rimbert as CEO in June 2024
• Strengthen workforce and key support functions with stronger leadership
• Implement sustainable cost model, transform supply chain and distribution
• Optimize brand positioning and marketing to enhance CRM to better align
campaigns with product launches
• Explore opportunities in emerging markets, particularly in ME and APAC |
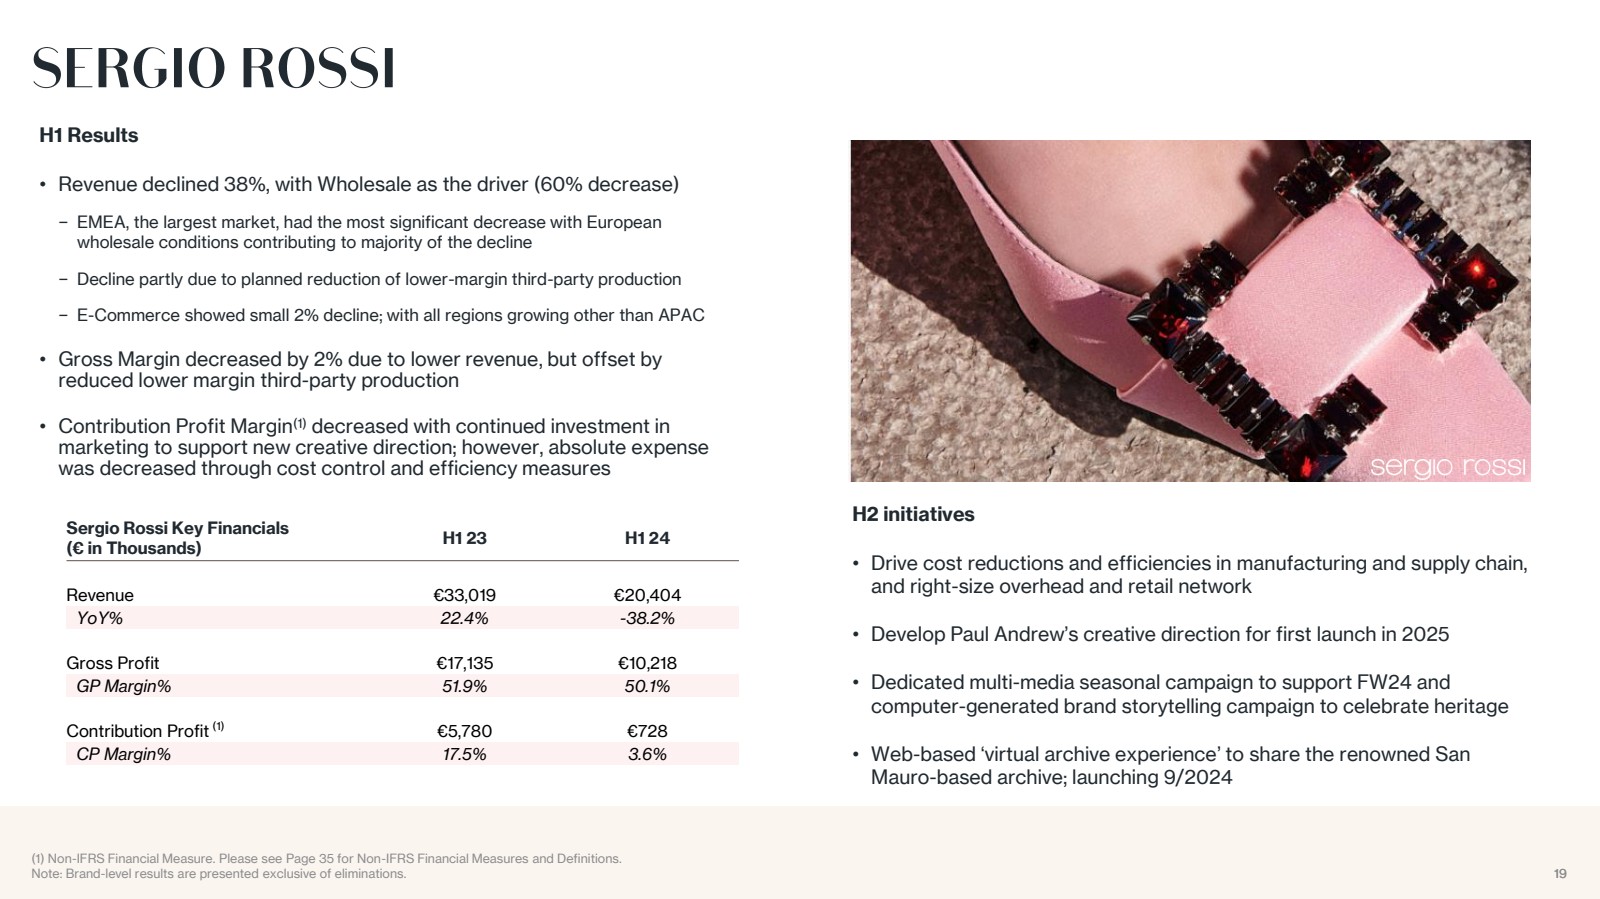
| 19
Sergio Rossi Key Financials
(€ in Thousands) H1 23 H1 24
Revenue €33,019 €20,404
YoY% 22.4% -38.2%
Gross Profit €17,135 €10,218
GP Margin% 51.9% 50.1%
Contribution Profit (1) €5,780 €728
CP Margin% 17.5% 3.6%
19
(1) Non-IFRS Financial Measure. Please see Page 35 for Non-IFRS Financial Measures and Definitions.
Note: Brand-level results are presented exclusive of eliminations.
H1 Results
• Revenue declined 38%, with Wholesale as the driver (60% decrease)
− EMEA, the largest market, had the most significant decrease with European
wholesale conditions contributing to majority of the decline
− Decline partly due to planned reduction of lower-margin third-party production
− E-Commerce showed small 2% decline; with all regions growing other than APAC
• Gross Margin decreased by 2% due to lower revenue, but offset by
reduced lower margin third-party production
• Contribution Profit Margin decreased with continued investment in
marketing to support new creative direction; however, absolute expense
was decreased through cost control and efficiency measures
H2 initiatives
• Drive cost reductions and efficiencies in manufacturing and supply chain,
and right-size overhead and retail network
• Develop Paul Andrew’s creative direction for first launch in 2025
• Dedicated multi-media seasonal campaign to support FW24 and
computer-generated brand storytelling campaign to celebrate heritage
• Web-based ‘virtual archive experience’ to share the renowned San
Mauro-based archive; launching 9/2024 |
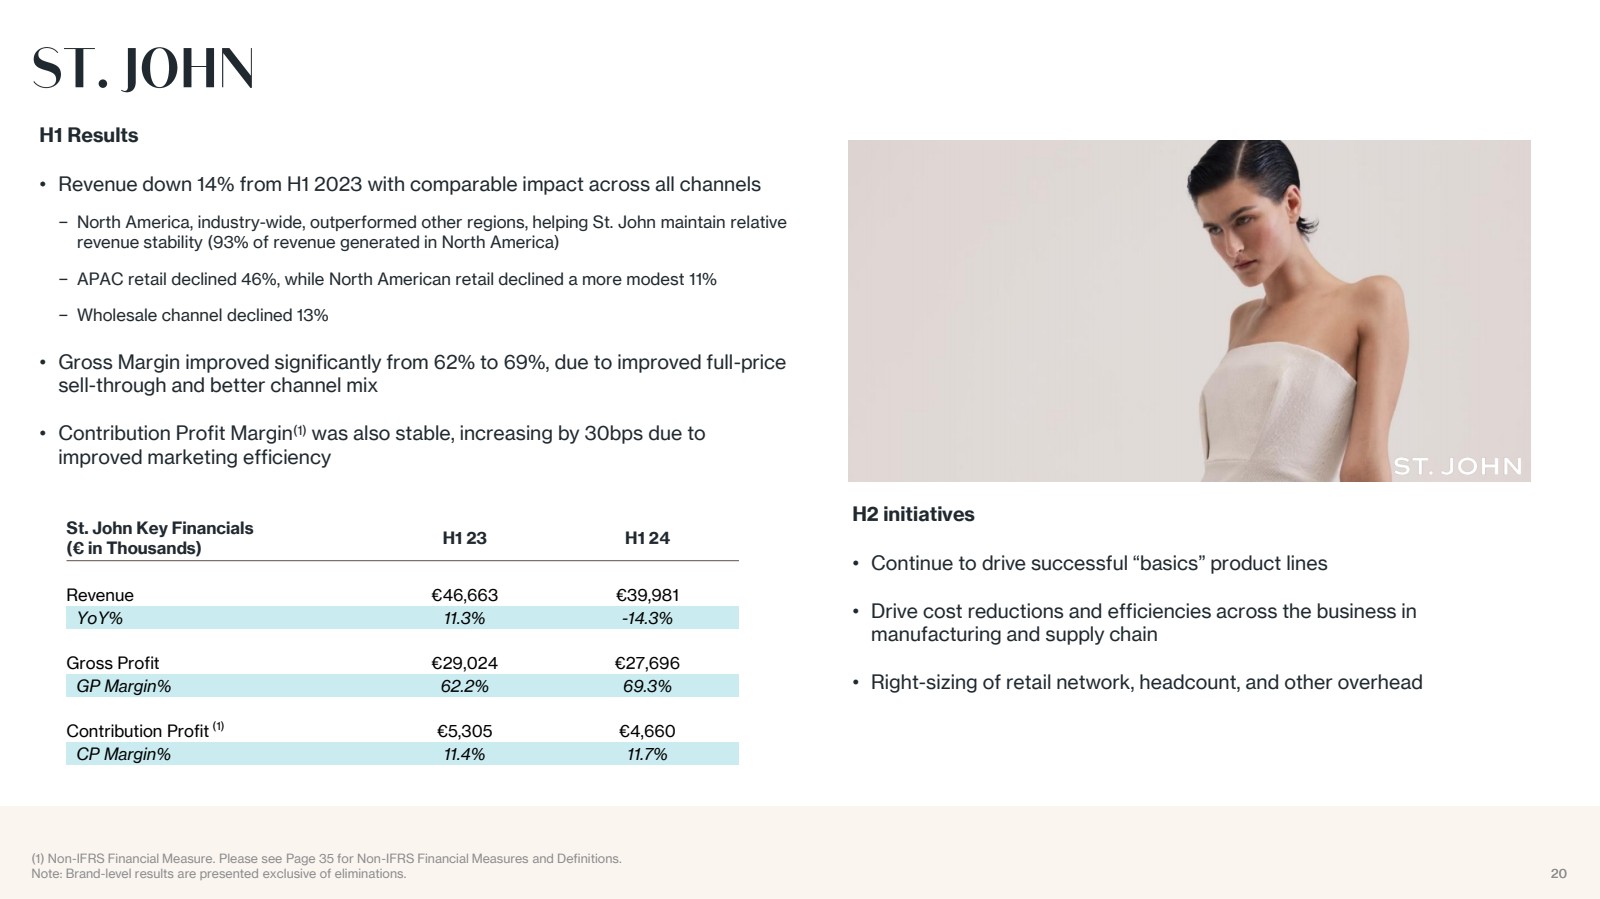
| 20
St. John Key Financials
(€ in Thousands) H1 23 H1 24
Revenue €46,663 €39,981
YoY% 11.3% -14.3%
Gross Profit €29,024 €27,696
GP Margin% 62.2% 69.3%
Contribution Profit (1) €5,305 €4,660
CP Margin% 11.4% 11.7%
20
(1) Non-IFRS Financial Measure. Please see Page 35 for Non-IFRS Financial Measures and Definitions.
Note: Brand-level results are presented exclusive of eliminations.
H1 Results
• Revenue down 14% from H1 2023 with comparable impact across all channels
− North America, industry-wide, outperformed other regions, helping St. John maintain relative
revenue stability (93% of revenue generated in North America)
− APAC retail declined 46%, while North American retail declined a more modest 11%
− Wholesale channel declined 13%
• Gross Margin improved significantly from 62% to 69%, due to improved full-price
sell-through and better channel mix
• Contribution Profit Margin was also stable, increasing by 30bps due to improved
marketing efficiency
H2 initiatives
• Continue to drive successful “basics” product lines
• Drive cost reductions and efficiencies across the business in
manufacturing and supply chain
• Right-sizing of retail network, headcount, and other overhead |
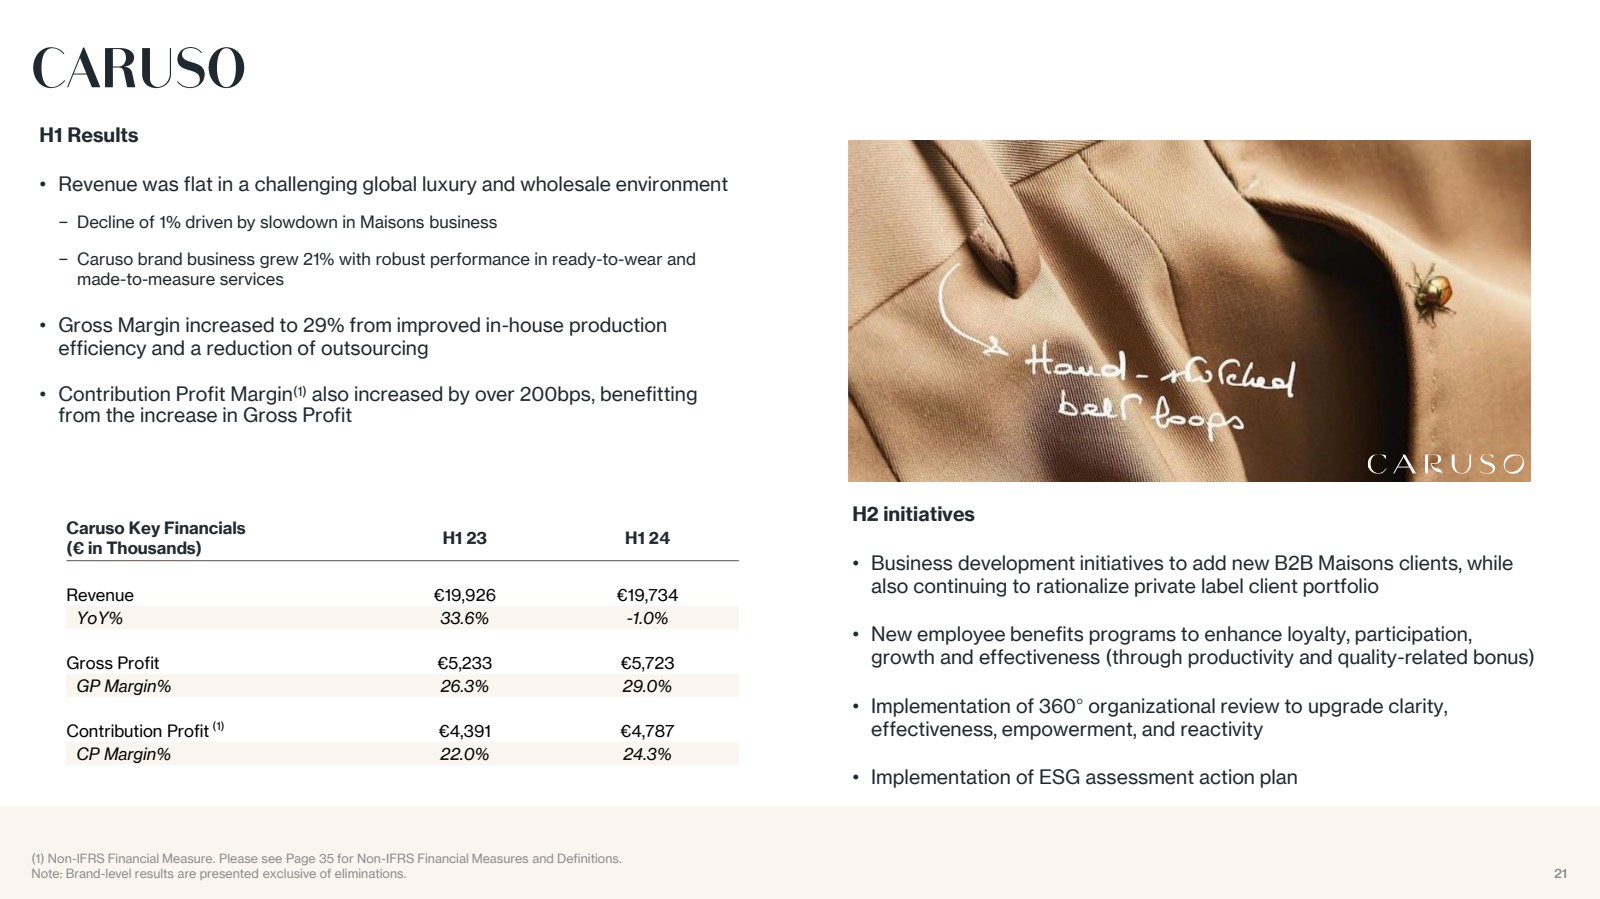
| 21
Caruso Key Financials
(€ in Thousands) H1 23 H1 24
Revenue €19,926 €19,734
YoY% 33.6% -1.0%
Gross Profit €5,233 €5,723
GP Margin% 26.3% 29.0%
Contribution Profit (1) €4,391 €4,787
CP Margin% 22.0% 24.3%
21
(1) Non-IFRS Financial Measure. Please see Page 35 for Non-IFRS Financial Measures and Definitions.
Note: Brand-level results are presented exclusive of eliminations.
H1 Results
• Revenue was flat in a challenging global luxury and wholesale environment
− Decline of 1% driven by slowdown in Maisons business
− Caruso brand business grew 21% with robust performance in ready-to-wear and
made-to-measure services
• Gross Margin increased to 29% from improved in-house production
efficiency and a reduction of outsourcing
• Contribution Profit Margin also increased by over 200bps, benefitting
from the increase in Gross Profit
H2 initiatives
• Business development initiatives to add new B2B Maisons clients, while
also continuing to rationalize private label client portfolio
• New employee benefits programs to enhance loyalty, participation,
growth and effectiveness (through productivity and quality-related bonus)
• Implementation of 360°organizational review to upgrade clarity,
effectiveness, empowerment, and reactivity
• Implementation of ESG assessment action plan |
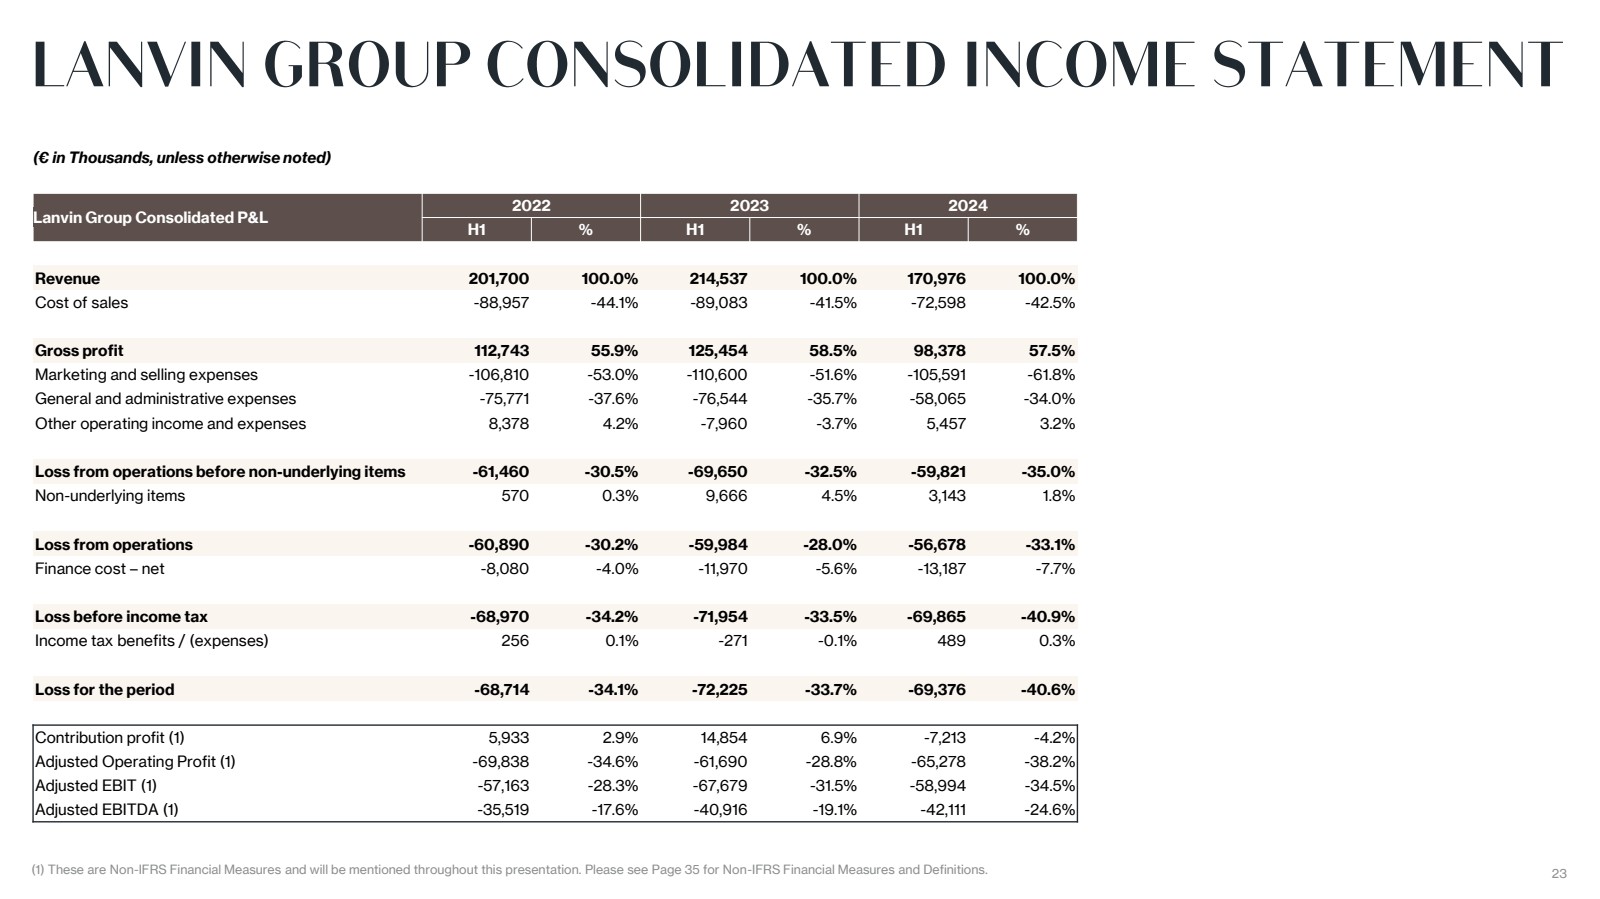
| 23 (1) These are Non-IFRS Financial Measures and will be mentioned throughout this presentation. Please see Page 35 for Non-IFRS Financial Measures and Definitions.
(€ in Thousands, unless otherwise noted)
Lanvin Group Consolidated P&L
2022 2023 2024
H1 % H1 % H1 %
Revenue 201,700 100.0% 214,537 100.0% 170,976 100.0%
Cost of sales -88,957 -44.1% -89,083 -41.5% -72,598 -42.5%
Gross profit 112,743 55.9% 125,454 58.5% 98,378 57.5%
Marketing and selling expenses -106,810 -53.0% -110,600 -51.6% -105,591 -61.8%
General and administrative expenses -75,771 -37.6% -76,544 -35.7% -58,065 -34.0%
Other operating income and expenses 8,378 4.2% -7,960 -3.7% 5,457 3.2%
Loss from operations before non-underlying items -61,460 -30.5% -69,650 -32.5% -59,821 -35.0%
Non-underlying items 570 0.3% 9,666 4.5% 3,143 1.8%
Loss from operations -60,890 -30.2% -59,984 -28.0% -56,678 -33.1%
Finance cost – net -8,080 -4.0% -11,970 -5.6% -13,187 -7.7%
Loss before income tax -68,970 -34.2% -71,954 -33.5% -69,865 -40.9%
Income tax benefits / (expenses) 256 0.1% -271 -0.1% 489 0.3%
Loss for the period -68,714 -34.1% -72,225 -33.7% -69,376 -40.6%
Contribution profit (1) 5,933 2.9% 14,854 6.9% -7,213 -4.2%
Adjusted Operating Profit (1) -69,838 -34.6% -61,690 -28.8% -65,278 -38.2%
Adjusted EBIT (1) -57,163 -28.3% -67,679 -31.5% -58,994 -34.5%
Adjusted EBITDA (1) -35,519 -17.6% -40,916 -19.1% -42,111 -24.6% |
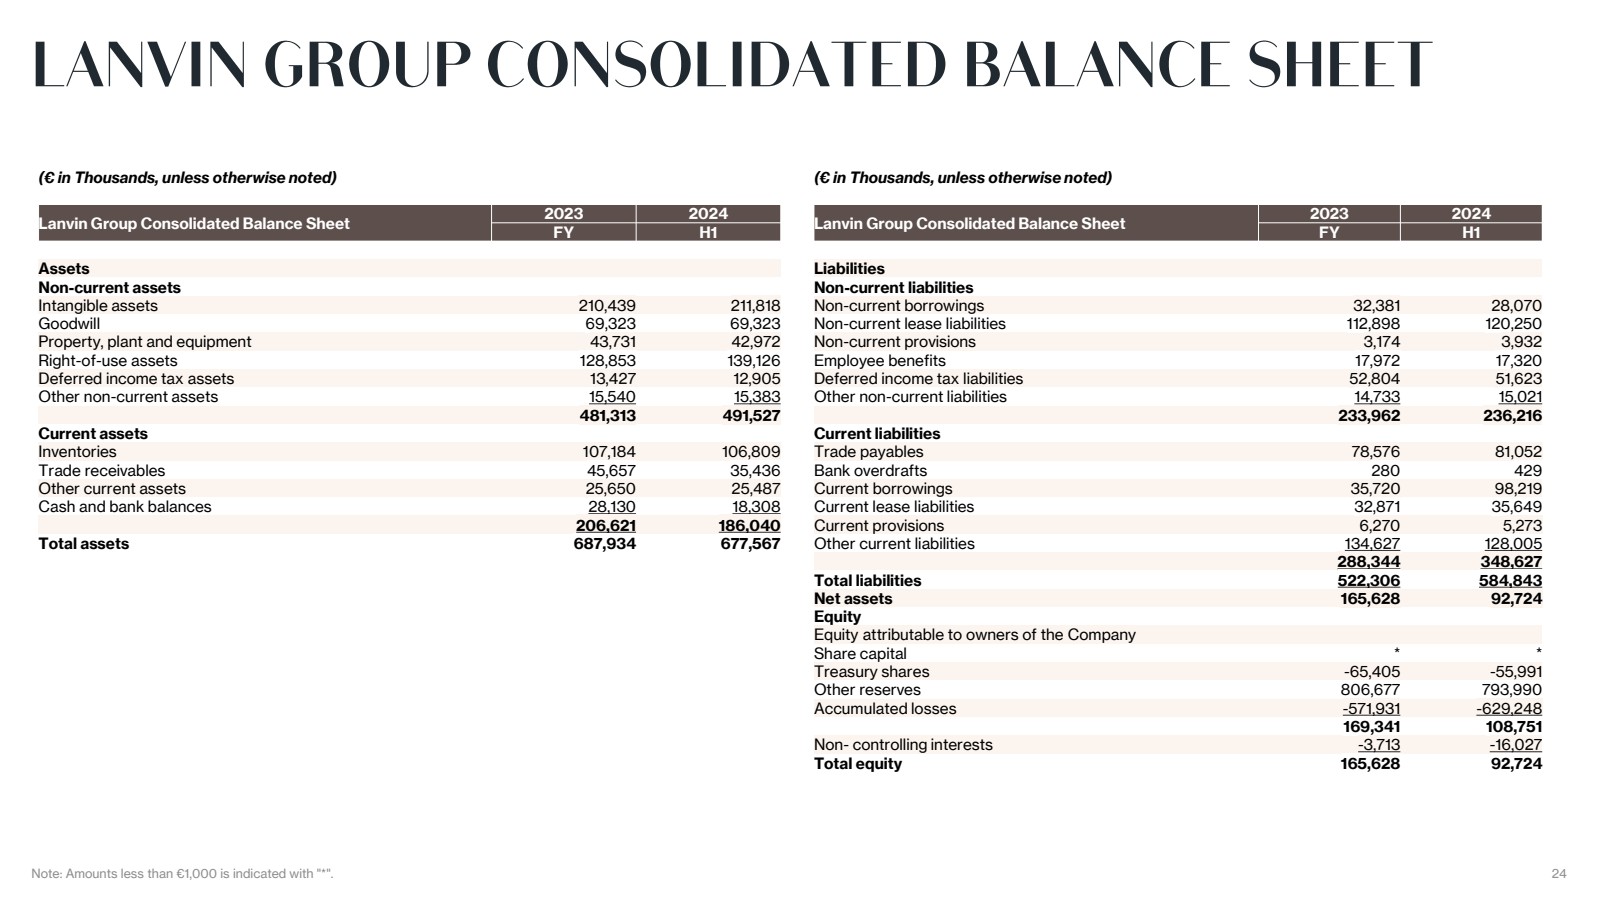
| Note: Amounts less than €1,000 is indicated with "*". 24
(€ in Thousands, unless otherwise noted)
Lanvin Group Consolidated Balance Sheet 2023 2024
FY H1
Assets
Non-current assets
Intangible assets 210,439 211,818
Goodwill 69,323 69,323
Property, plant and equipment 43,731 42,972
Right-of-use assets 128,853 139,126
Deferred income tax assets 13,427 12,905
Other non-current assets 15,540 15,383
481,313 491,527
Current assets
Inventories 107,184 106,809
Trade receivables 45,657 35,436
Other current assets 25,650 25,487
Cash and bank balances 28,130 18,308
206,621 186,040
Total assets 687,934 677,567
(€ in Thousands, unless otherwise noted)
Lanvin Group Consolidated Balance Sheet 2023 2024
FY H1
Liabilities
Non-current liabilities
Non-current borrowings 32,381 28,070
Non-current lease liabilities 112,898 120,250
Non-current provisions 3,174 3,932
Employee benefits 17,972 17,320
Deferred income tax liabilities 52,804 51,623
Other non-current liabilities 14,733 15,021
233,962 236,216
Current liabilities
Trade payables 78,576 81,052
Bank overdrafts 280 429
Current borrowings 35,720 98,219
Current lease liabilities 32,871 35,649
Current provisions 6,270 5,273
Other current liabilities 134,627 128,005
288,344 348,627
Total liabilities 522,306 584,843
Net assets 165,628 92,724
Equity
Equity attributable to owners of the Company
Share capital * *
Treasury shares -65,405 -55,991
Other reserves 806,677 793,990
Accumulated losses -571,931 -629,248
169,341 108,751
Non- controlling interests -3,713 -16,027
Total equity 165,628 92,724 |
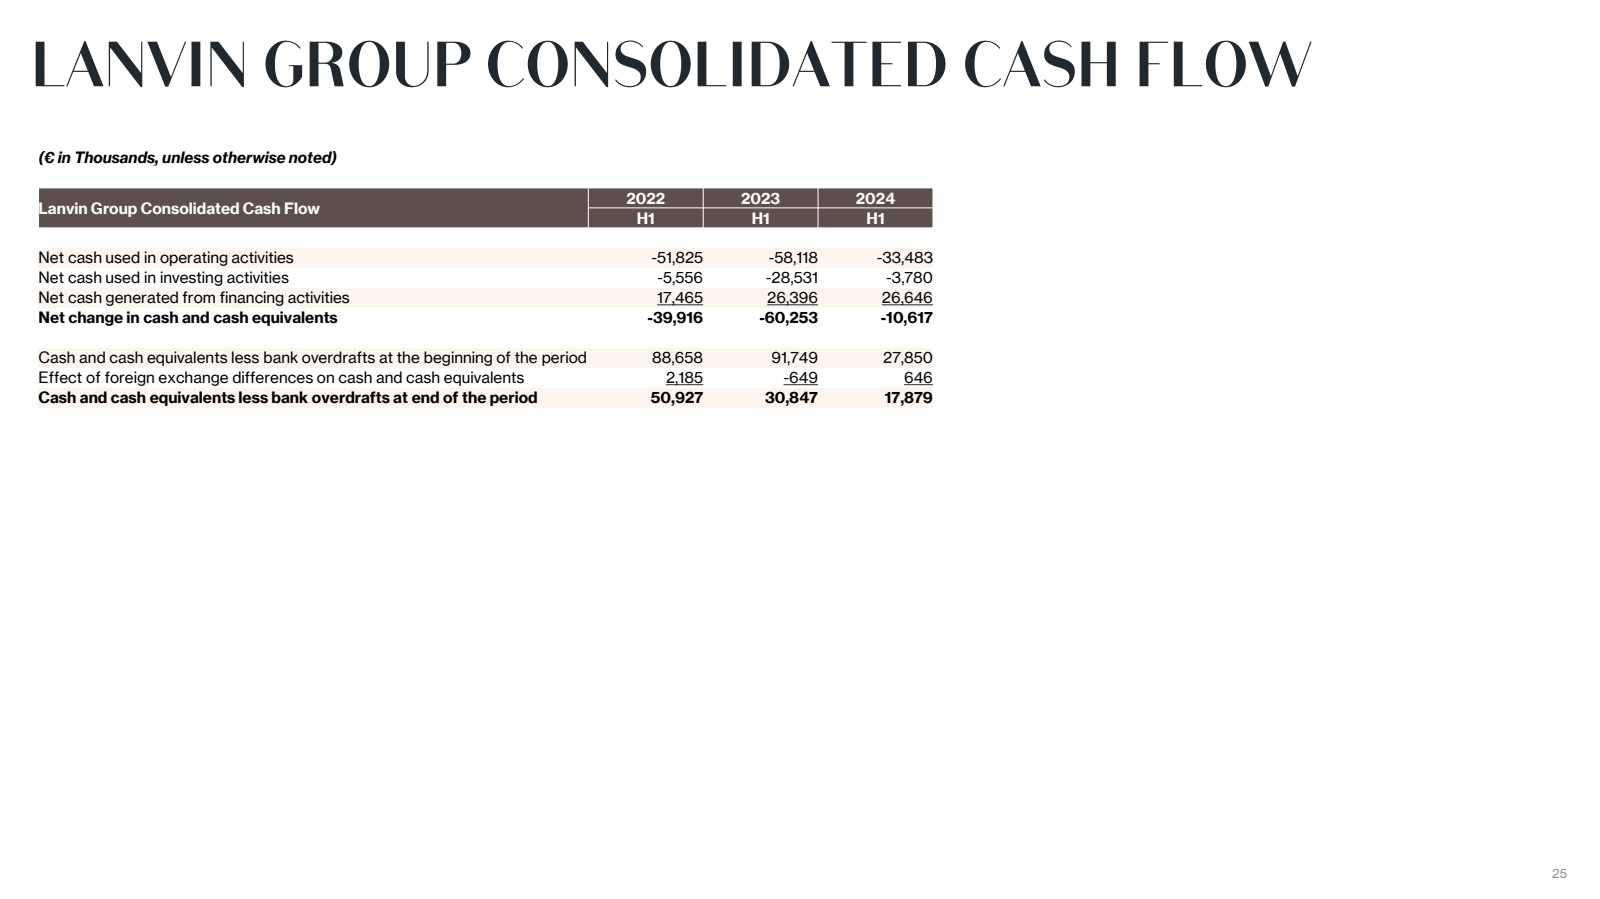
| 25
(€ in Thousands, unless otherwise noted)
Lanvin Group Consolidated Cash Flow 2022 2023 2024
H1 H1 H1
Net cash used in operating activities -51,825 -58,118 -33,483
Net cash used in investing activities -5,556 -28,531 -3,780
Net cash generated from financing activities 17,465 26,396 26,646
Net change in cash and cash equivalents -39,916 -60,253 -10,617
Cash and cash equivalents less bank overdrafts at the beginning of the period 88,658 91,749 27,850
Effect of foreign exchange differences on cash and cash equivalents 2,185 -649 646
Cash and cash equivalents less bank overdrafts at end of the period 50,927 30,847 17,879 |
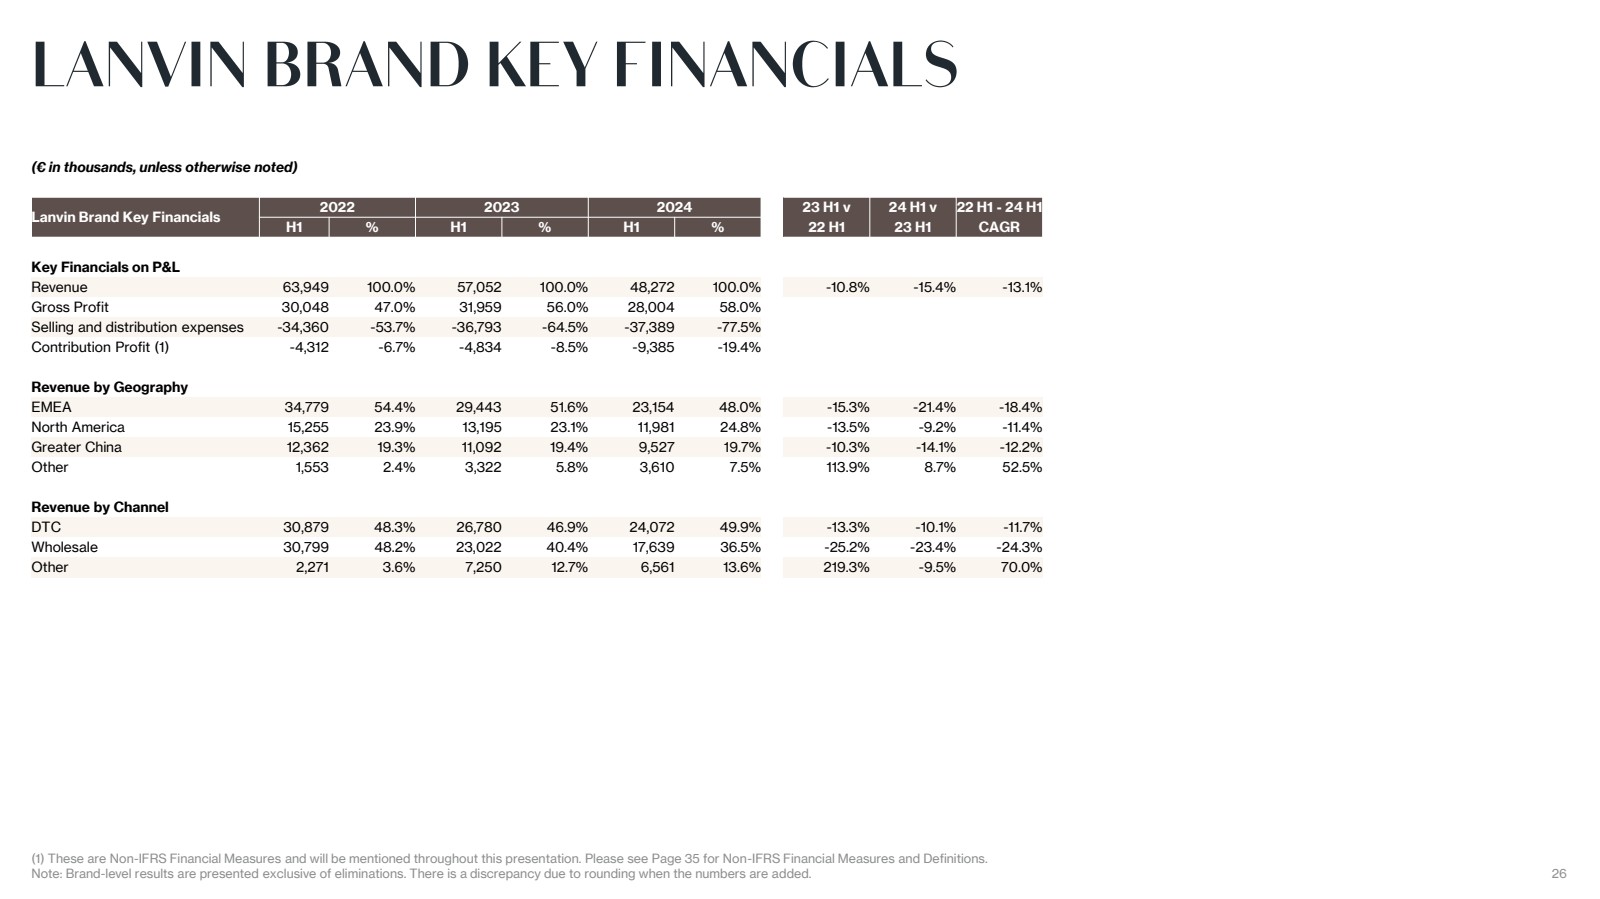
| 26
(1) These are Non-IFRS Financial Measures and will be mentioned throughout this presentation. Please see Page 35 for Non-IFRS Financial Measures and Definitions.
Note: Brand-level results are presented exclusive of eliminations. There is a discrepancy due to rounding when the numbers are added.
(€ in thousands, unless otherwise noted)
Lanvin Brand Key Financials 2022 2023 2024 23 H1 v 24 H1 v 22 H1 - 24 H1
H1 % H1 % H1 % 22 H1 23 H1 CAGR
Key Financials on P&L
Revenue 63,949 100.0% 57,052 100.0% 48,272 100.0% -10.8% -15.4% -13.1%
Gross Profit 30,048 47.0% 31,959 56.0% 28,004 58.0%
Selling and distribution expenses -34,360 -53.7% -36,793 -64.5% -37,389 -77.5%
Contribution Profit (1) -4,312 -6.7% -4,834 -8.5% -9,385 -19.4%
Revenue by Geography
EMEA 34,779 54.4% 29,443 51.6% 23,154 48.0% -15.3% -21.4% -18.4%
North America 15,255 23.9% 13,195 23.1% 11,981 24.8% -13.5% -9.2% -11.4%
Greater China 12,362 19.3% 11,092 19.4% 9,527 19.7% -10.3% -14.1% -12.2%
Other 1,553 2.4% 3,322 5.8% 3,610 7.5% 113.9% 8.7% 52.5%
Revenue by Channel
DTC 30,879 48.3% 26,780 46.9% 24,072 49.9% -13.3% -10.1% -11.7%
Wholesale 30,799 48.2% 23,022 40.4% 17,639 36.5% -25.2% -23.4% -24.3%
Other 2,271 3.6% 7,250 12.7% 6,561 13.6% 219.3% -9.5% 70.0% |
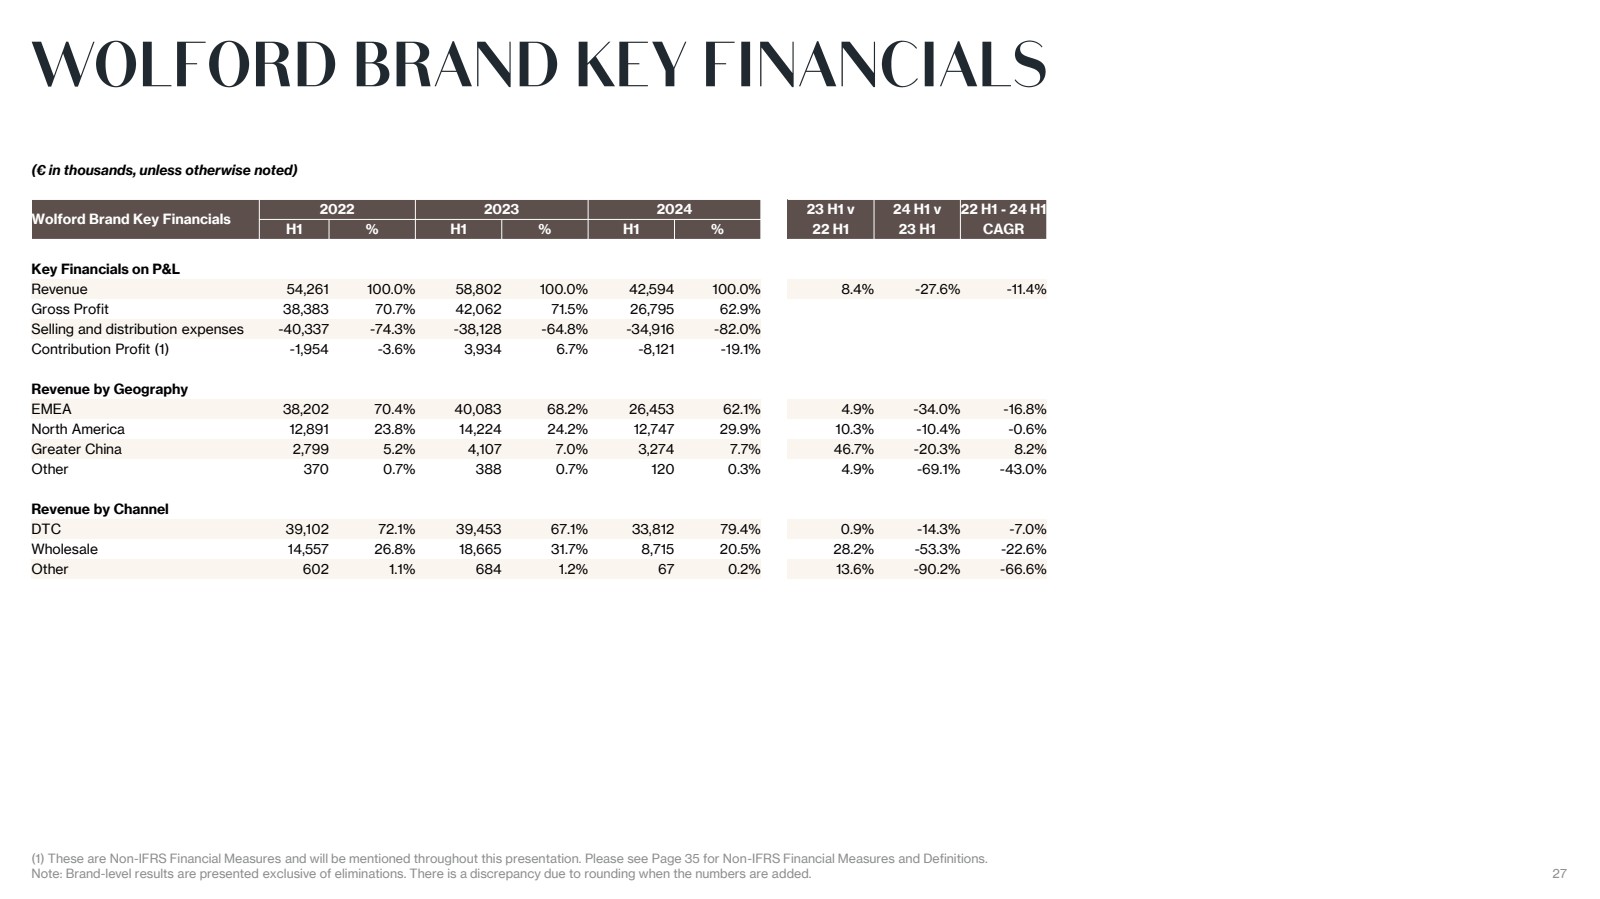
| 27
(1) These are Non-IFRS Financial Measures and will be mentioned throughout this presentation. Please see Page 35 for Non-IFRS Financial Measures and Definitions.
Note: Brand-level results are presented exclusive of eliminations. There is a discrepancy due to rounding when the numbers are added.
(€ in thousands, unless otherwise noted)
Wolford Brand Key Financials 2022 2023 2024 23 H1 v 24 H1 v 22 H1 - 24 H1
H1 % H1 % H1 % 22 H1 23 H1 CAGR
Key Financials on P&L
Revenue 54,261 100.0% 58,802 100.0% 42,594 100.0% 8.4% -27.6% -11.4%
Gross Profit 38,383 70.7% 42,062 71.5% 26,795 62.9%
Selling and distribution expenses -40,337 -74.3% -38,128 -64.8% -34,916 -82.0%
Contribution Profit (1) -1,954 -3.6% 3,934 6.7% -8,121 -19.1%
Revenue by Geography
EMEA 38,202 70.4% 40,083 68.2% 26,453 62.1% 4.9% -34.0% -16.8%
North America 12,891 23.8% 14,224 24.2% 12,747 29.9% 10.3% -10.4% -0.6%
Greater China 2,799 5.2% 4,107 7.0% 3,274 7.7% 46.7% -20.3% 8.2%
Other 370 0.7% 388 0.7% 120 0.3% 4.9% -69.1% -43.0%
Revenue by Channel
DTC 39,102 72.1% 39,453 67.1% 33,812 79.4% 0.9% -14.3% -7.0%
Wholesale 14,557 26.8% 18,665 31.7% 8,715 20.5% 28.2% -53.3% -22.6%
Other 602 1.1% 684 1.2% 67 0.2% 13.6% -90.2% -66.6% |
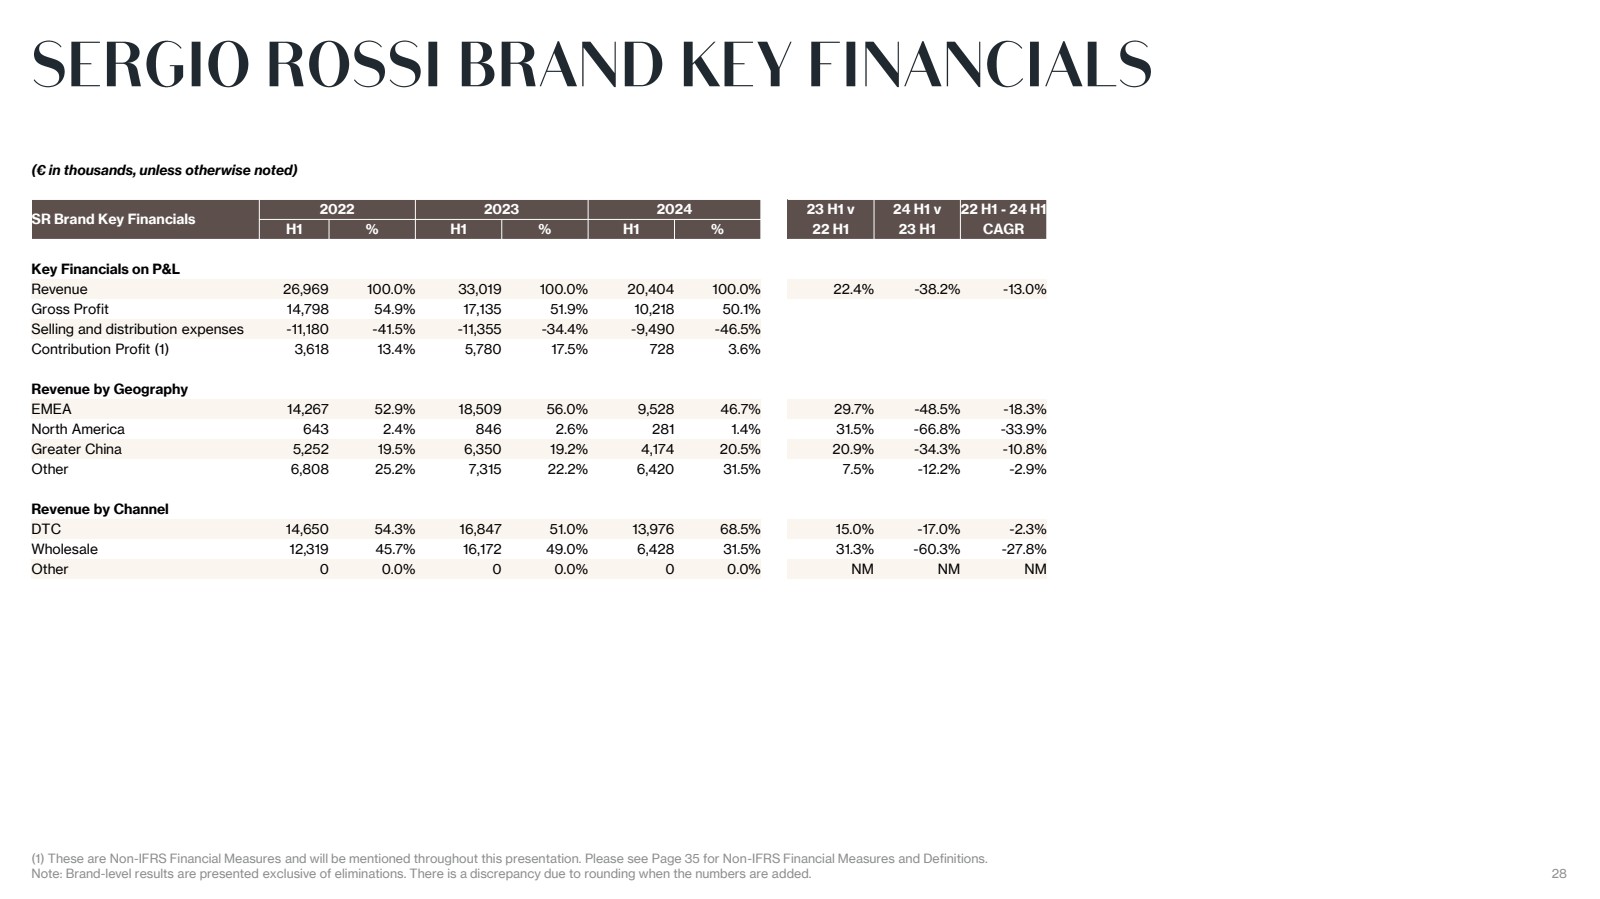
| 28
(1) These are Non-IFRS Financial Measures and will be mentioned throughout this presentation. Please see Page 35 for Non-IFRS Financial Measures and Definitions.
Note: Brand-level results are presented exclusive of eliminations. There is a discrepancy due to rounding when the numbers are added.
(€ in thousands, unless otherwise noted)
SR Brand Key Financials 2022 2023 2024 23 H1 v 24 H1 v 22 H1 - 24 H1
H1 % H1 % H1 % 22 H1 23 H1 CAGR
Key Financials on P&L
Revenue 26,969 100.0% 33,019 100.0% 20,404 100.0% 22.4% -38.2% -13.0%
Gross Profit 14,798 54.9% 17,135 51.9% 10,218 50.1%
Selling and distribution expenses -11,180 -41.5% -11,355 -34.4% -9,490 -46.5%
Contribution Profit (1) 3,618 13.4% 5,780 17.5% 728 3.6%
Revenue by Geography
EMEA 14,267 52.9% 18,509 56.0% 9,528 46.7% 29.7% -48.5% -18.3%
North America 643 2.4% 846 2.6% 281 1.4% 31.5% -66.8% -33.9%
Greater China 5,252 19.5% 6,350 19.2% 4,174 20.5% 20.9% -34.3% -10.8%
Other 6,808 25.2% 7,315 22.2% 6,420 31.5% 7.5% -12.2% -2.9%
Revenue by Channel
DTC 14,650 54.3% 16,847 51.0% 13,976 68.5% 15.0% -17.0% -2.3%
Wholesale 12,319 45.7% 16,172 49.0% 6,428 31.5% 31.3% -60.3% -27.8%
Other 0 0.0% 0 0.0% 0 0.0% NM NM NM |
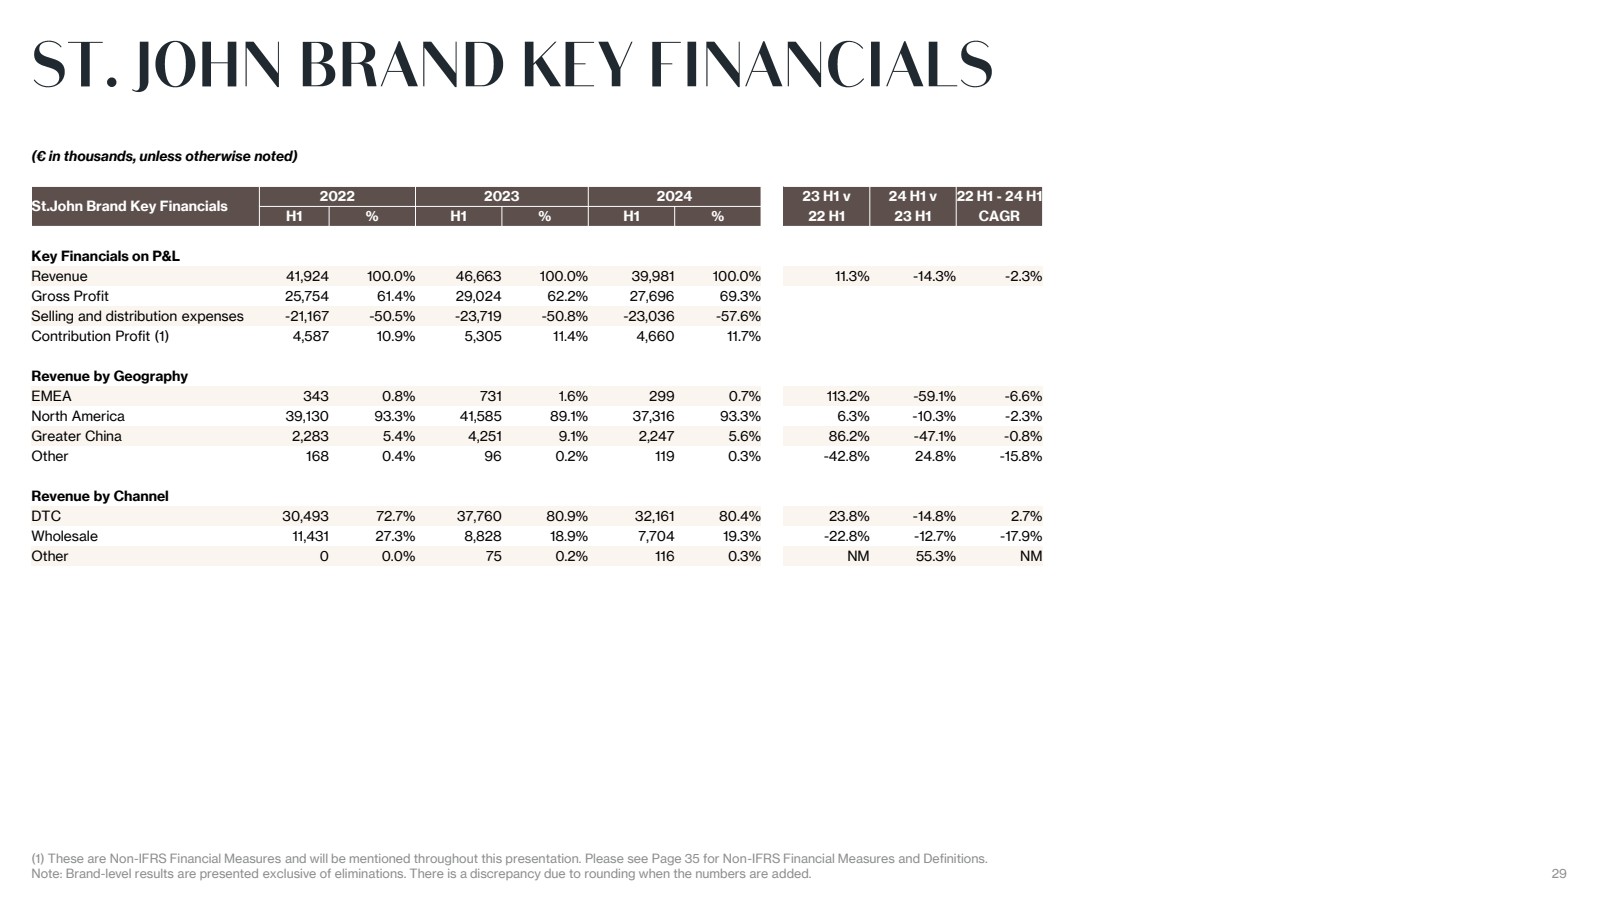
| 29
(1) These are Non-IFRS Financial Measures and will be mentioned throughout this presentation. Please see Page 35 for Non-IFRS Financial Measures and Definitions.
Note: Brand-level results are presented exclusive of eliminations. There is a discrepancy due to rounding when the numbers are added.
(€ in thousands, unless otherwise noted)
St.John Brand Key Financials 2022 2023 2024 23 H1 v 24 H1 v 22 H1 - 24 H1
H1 % H1 % H1 % 22 H1 23 H1 CAGR
Key Financials on P&L
Revenue 41,924 100.0% 46,663 100.0% 39,981 100.0% 11.3% -14.3% -2.3%
Gross Profit 25,754 61.4% 29,024 62.2% 27,696 69.3%
Selling and distribution expenses -21,167 -50.5% -23,719 -50.8% -23,036 -57.6%
Contribution Profit (1) 4,587 10.9% 5,305 11.4% 4,660 11.7%
Revenue by Geography
EMEA 343 0.8% 731 1.6% 299 0.7% 113.2% -59.1% -6.6%
North America 39,130 93.3% 41,585 89.1% 37,316 93.3% 6.3% -10.3% -2.3%
Greater China 2,283 5.4% 4,251 9.1% 2,247 5.6% 86.2% -47.1% -0.8%
Other 168 0.4% 96 0.2% 119 0.3% -42.8% 24.8% -15.8%
Revenue by Channel
DTC 30,493 72.7% 37,760 80.9% 32,161 80.4% 23.8% -14.8% 2.7%
Wholesale 11,431 27.3% 8,828 18.9% 7,704 19.3% -22.8% -12.7% -17.9%
Other 0 0.0% 75 0.2% 116 0.3% NM 55.3% NM |
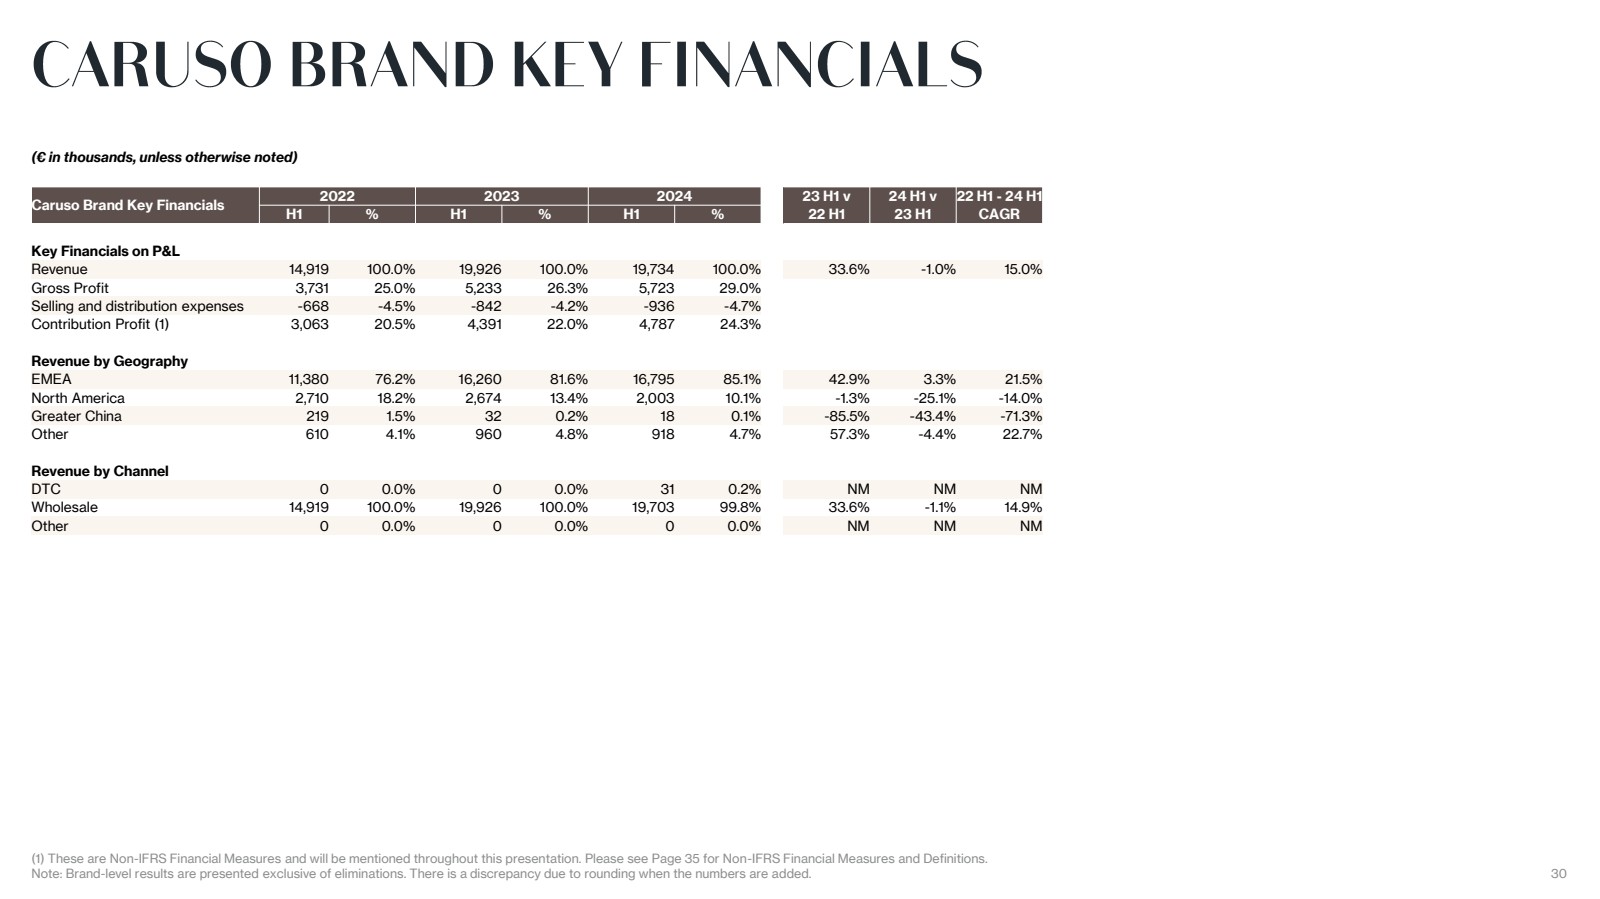
| 30
(1) These are Non-IFRS Financial Measures and will be mentioned throughout this presentation. Please see Page 35 for Non-IFRS Financial Measures and Definitions.
Note: Brand-level results are presented exclusive of eliminations. There is a discrepancy due to rounding when the numbers are added.
(€ in thousands, unless otherwise noted)
Caruso Brand Key Financials 2022 2023 2024 23 H1 v 24 H1 v 22 H1 - 24 H1
H1 % H1 % H1 % 22 H1 23 H1 CAGR
Key Financials on P&L
Revenue 14,919 100.0% 19,926 100.0% 19,734 100.0% 33.6% -1.0% 15.0%
Gross Profit 3,731 25.0% 5,233 26.3% 5,723 29.0%
Selling and distribution expenses -668 -4.5% -842 -4.2% -936 -4.7%
Contribution Profit (1) 3,063 20.5% 4,391 22.0% 4,787 24.3%
Revenue by Geography
EMEA 11,380 76.2% 16,260 81.6% 16,795 85.1% 42.9% 3.3% 21.5%
North America 2,710 18.2% 2,674 13.4% 2,003 10.1% -1.3% -25.1% -14.0%
Greater China 219 1.5% 32 0.2% 18 0.1% -85.5% -43.4% -71.3%
Other 610 4.1% 960 4.8% 918 4.7% 57.3% -4.4% 22.7%
Revenue by Channel
DTC 0 0.0% 0 0.0% 31 0.2% NM NM NM
Wholesale 14,919 100.0% 19,926 100.0% 19,703 99.8% 33.6% -1.1% 14.9%
Other 0 0.0% 0 0.0% 0 0.0% NM NM NM |
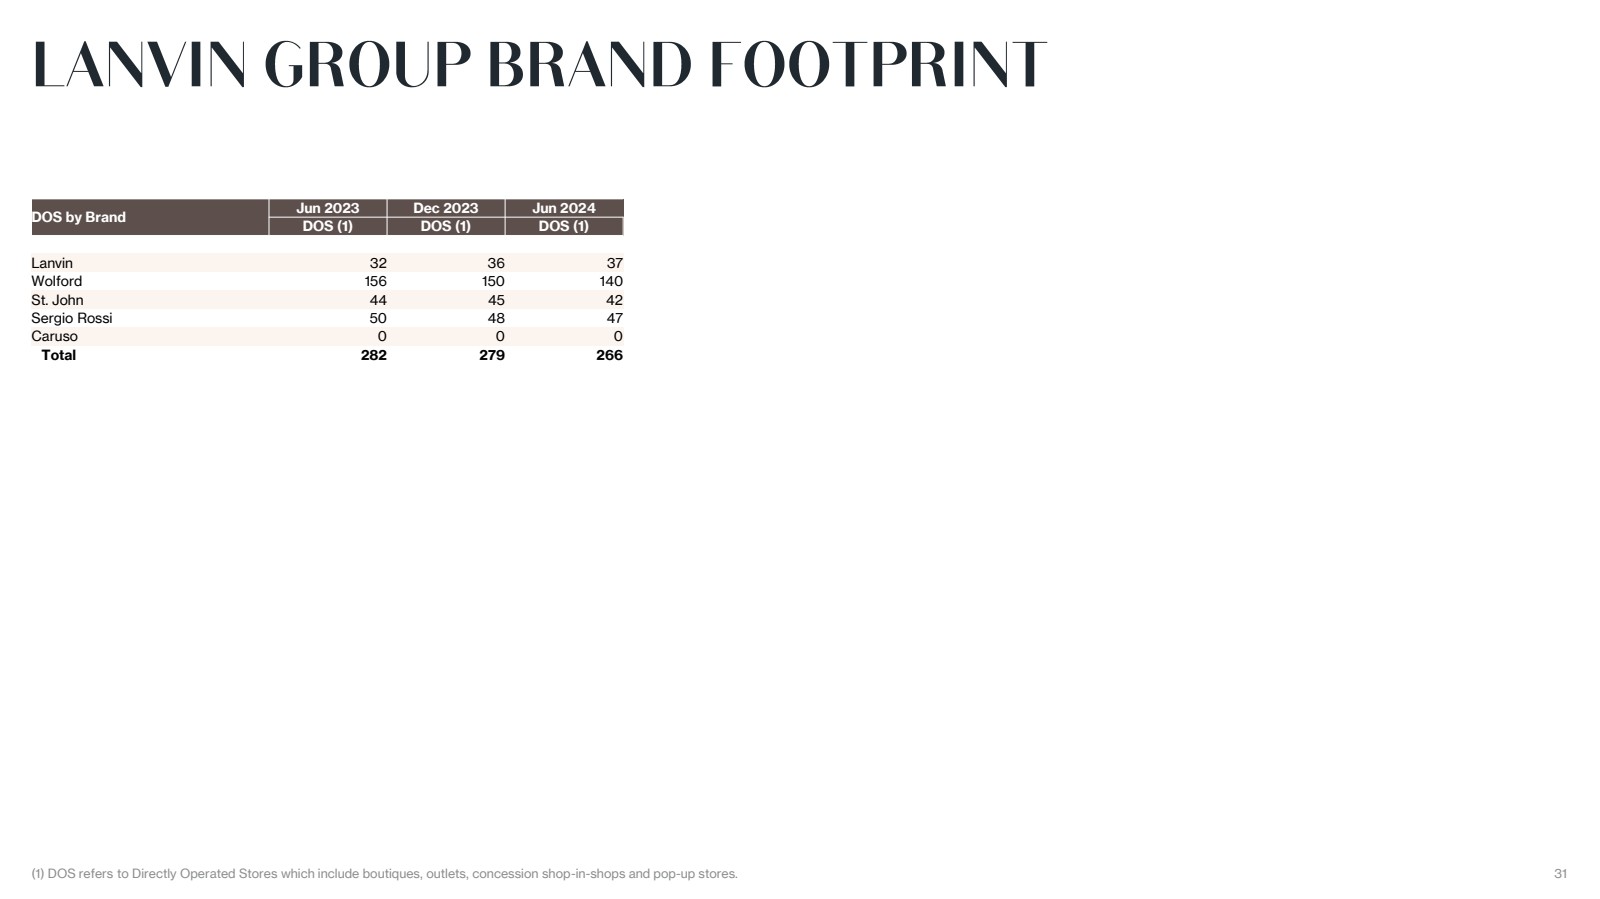
| (1) DOS refers to Directly Operated Stores which include boutiques, outlets, concession shop-in-shops and pop-up stores. 31
DOS by Brand (1) (2) (1) (2) Jun 2023 Dec 2023 Jun 2024
DOS (1) DOS (1) DOS (1)
Lanvin 32 36 37
Wolford 156 150 140
St. John 44 45 42
Sergio Rossi 50 48 47
Caruso 0 0 0
Total 282 279 266 |
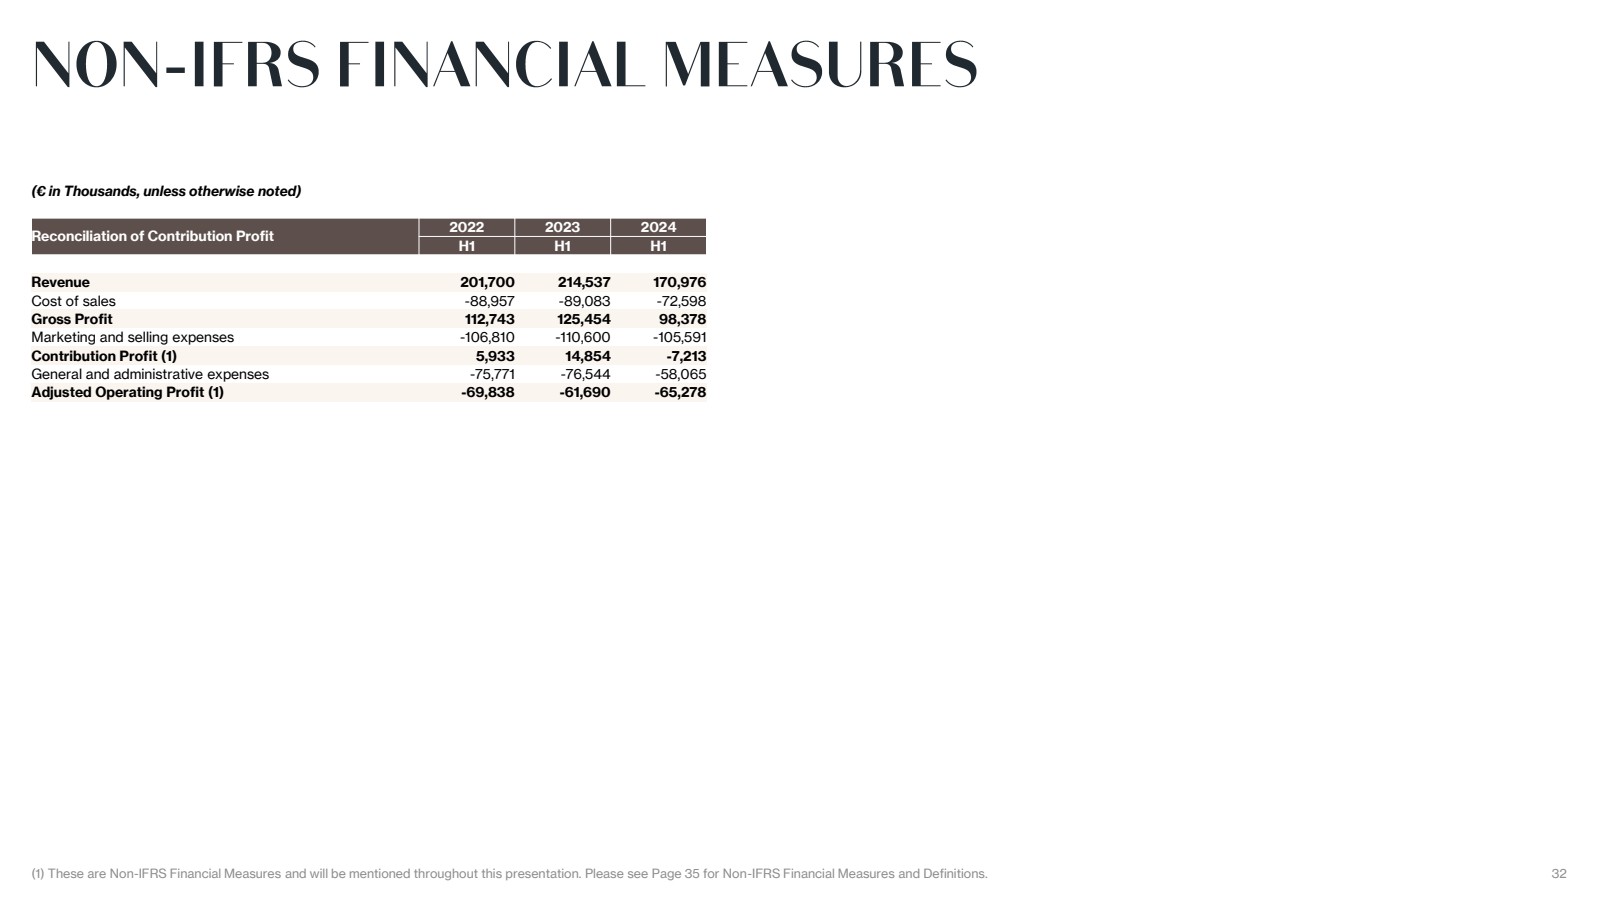
| (1) These are Non-IFRS Financial Measures and will be mentioned throughout this presentation. Please see Page 35 for Non-IFRS Financial Measures and Definitions. 32
(€ in Thousands, unless otherwise noted)
Reconciliation of Contribution Profit 2022 2023 2024
H1 H1 H1
Revenue 201,700 214,537 170,976
Cost of sales -88,957 -89,083 -72,598
Gross Profit 112,743 125,454 98,378
Marketing and selling expenses -106,810 -110,600 -105,591
Contribution Profit (1) 5,933 14,854 -7,213
General and administrative expenses -75,771 -76,544 -58,065
Adjusted Operating Profit (1) -69,838 -61,690 -65,278 |
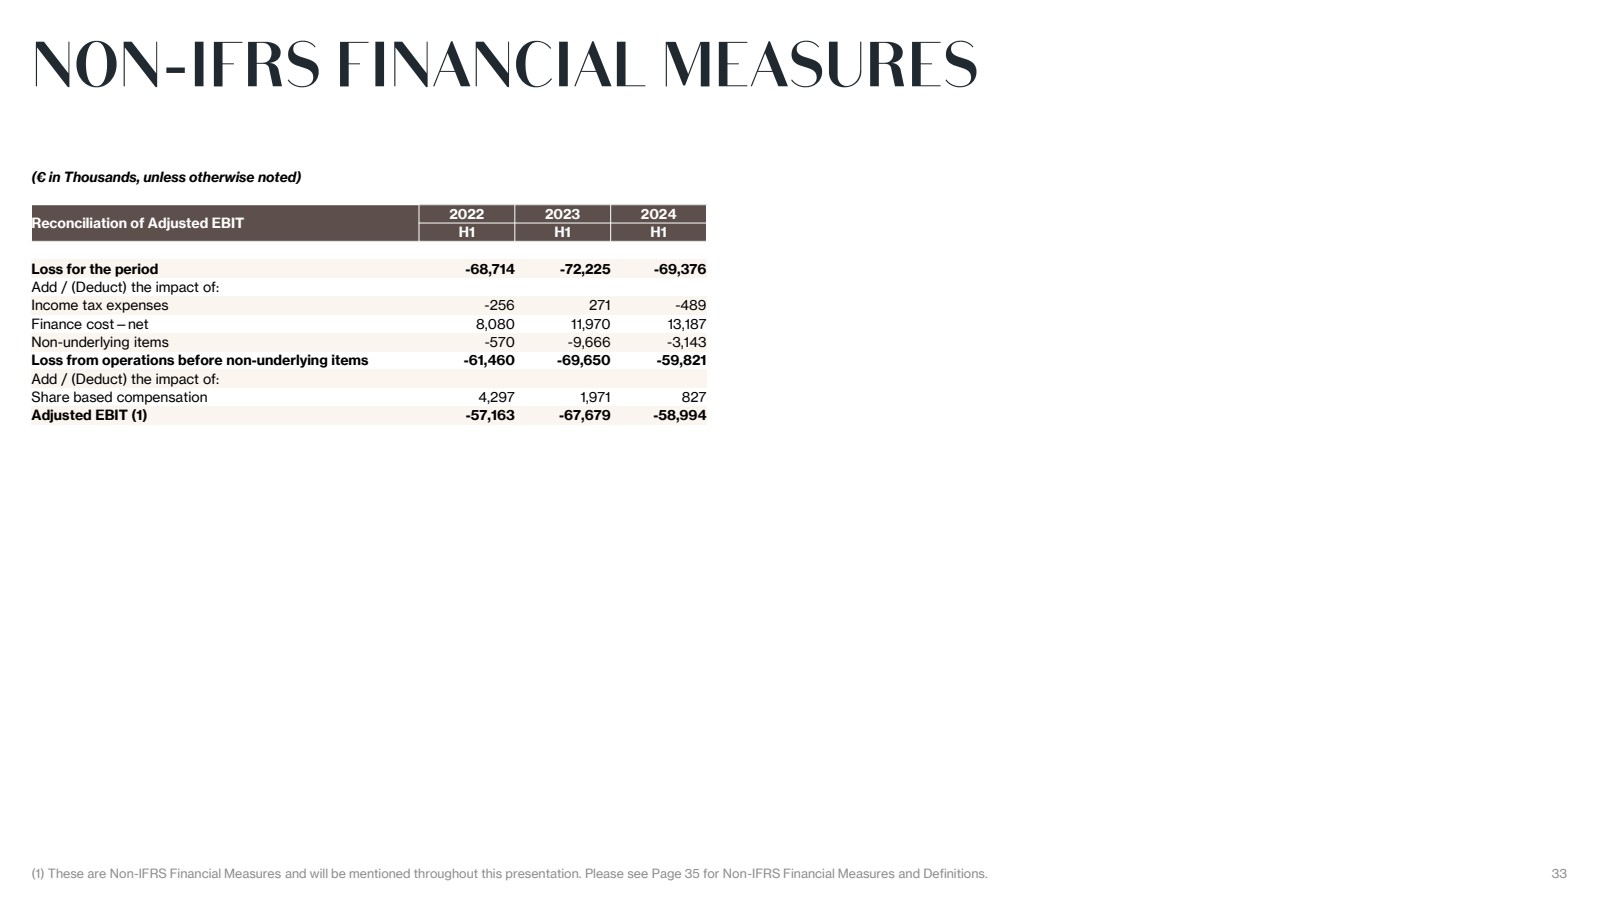
| (1) These are Non-IFRS Financial Measures and will be mentioned throughout this presentation. Please see Page 35 for Non-IFRS Financial Measures and Definitions. 33
(€ in Thousands, unless otherwise noted)
Reconciliation of Adjusted EBIT 2022 2023 2024
H1 H1 H1
Loss for the period -68,714 -72,225 -69,376
Add / (Deduct) the impact of:
Income tax expenses -256 271 -489
Finance cost—net 8,080 11,970 13,187
Non-underlying items -570 -9,666 -3,143
Loss from operations before non-underlying items -61,460 -69,650 -59,821
Add / (Deduct) the impact of:
Share based compensation 4,297 1,971 827
Adjusted EBIT (1) -57,163 -67,679 -58,994 |
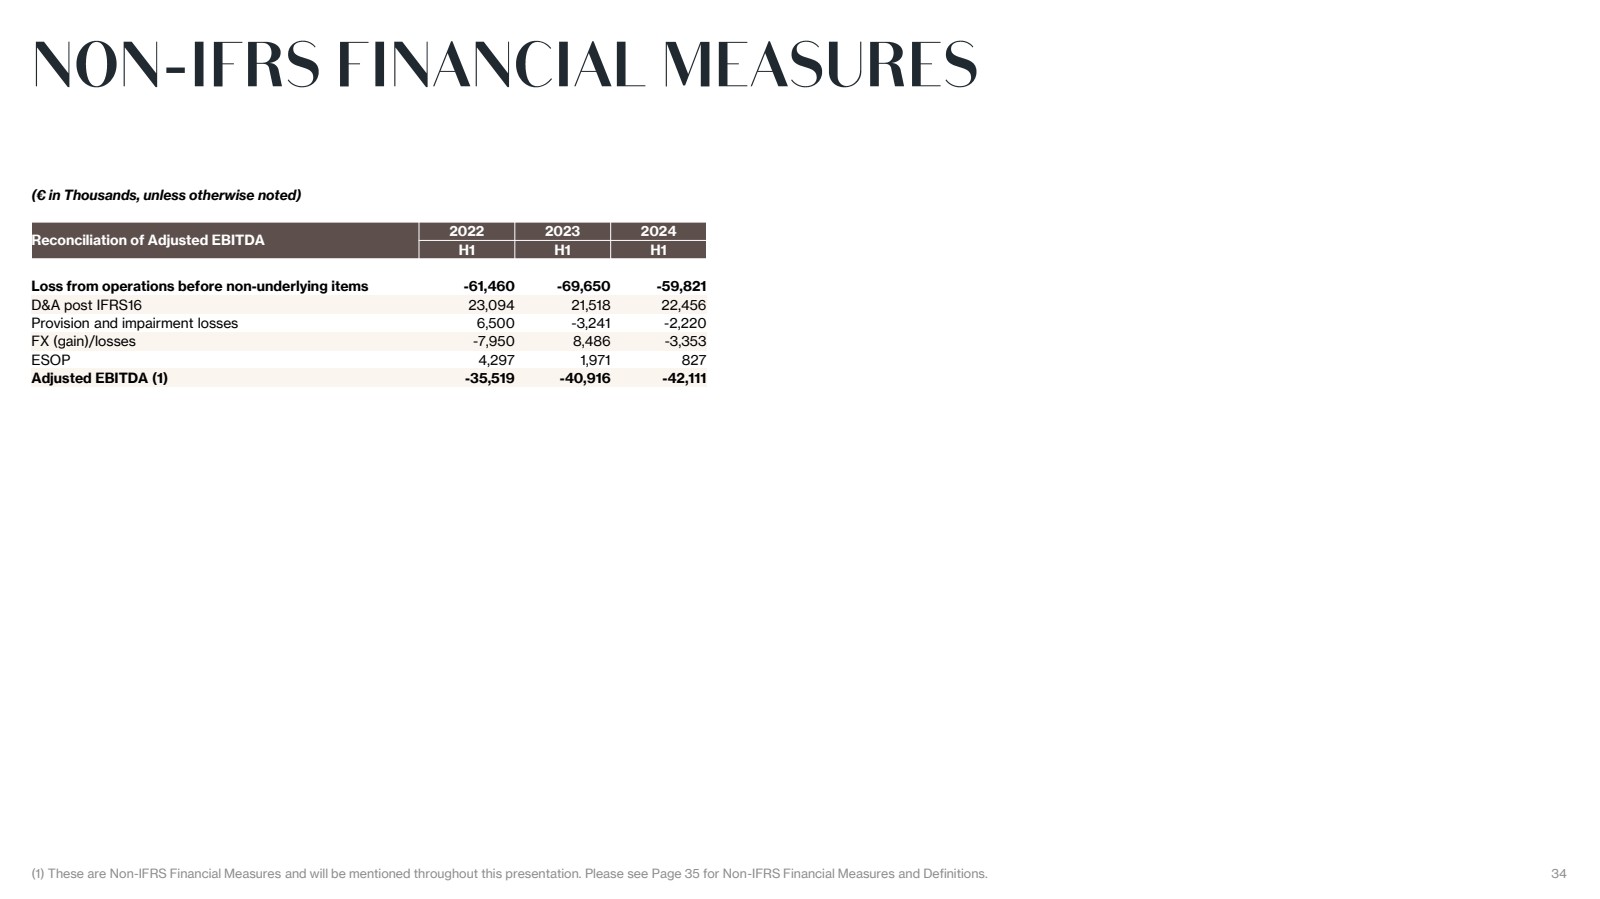
| (1) These are Non-IFRS Financial Measures and will be mentioned throughout this presentation. Please see Page 35 for Non-IFRS Financial Measures and Definitions. 34
(€ in Thousands, unless otherwise noted)
Reconciliation of Adjusted EBITDA 2022 2023 2024
H1 H1 H1
Loss from operations before non-underlying items -61,460 -69,650 -59,821
D&A post IFRS16 23,094 21,518 22,456
Provision and impairment losses 6,500 -3,241 -2,220
FX (gain)/losses -7,950 8,486 -3,353
ESOP 4,297 1,971 827
Adjusted EBITDA (1) -35,519 -40,916 -42,111 |
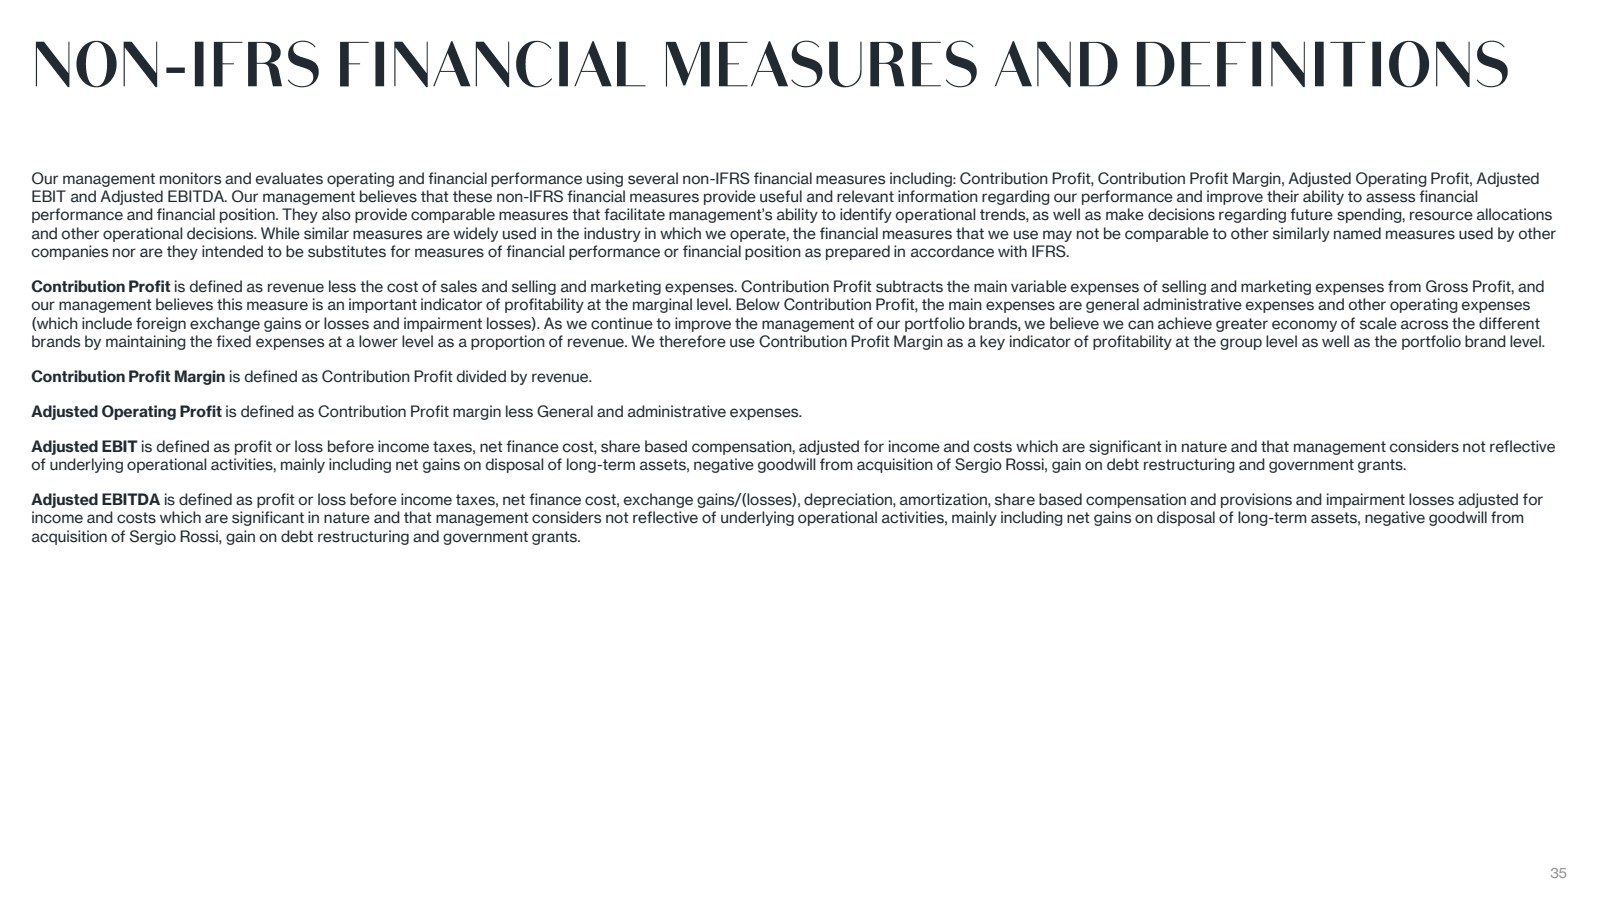
| 35
Our management monitors and evaluates operating and financial performance using several non-IFRS financial measures including: Contribution Profit, Contribution Profit Margin, Adjusted Operating Profit, Adjusted
EBIT and Adjusted EBITDA. Our management believes that these non-IFRS financial measures provide useful and relevant information regarding our performance and improve their ability to assess financial
performance and financial position. They also provide comparable measures that facilitate management’s ability to identify operational trends, as well as make decisions regarding future spending, resource allocations
and other operational decisions. While similar measures are widely used in the industry in which we operate, the financial measures that we use may not be comparable to other similarly named measures used by other
companies nor are they intended to be substitutes for measures of financial performance or financial position as prepared in accordance with IFRS.
Contribution Profit is defined as revenue less the cost of sales and selling and marketing expenses. Contribution Profit subtracts the main variable expenses of selling and marketing expenses from Gross Profit, and
our management believes this measure is an important indicator of profitability at the marginal level. Below Contribution Profit, the main expenses are general administrative expenses and other operating expenses
(which include foreign exchange gains or losses and impairment losses). As we continue to improve the management of our portfolio brands, we believe we can achieve greater economy of scale across the different
brands by maintaining the fixed expenses at a lower level as a proportion of revenue. We therefore use Contribution Profit Margin as a key indicator of profitability at the group level as well as the portfolio brand level.
Contribution Profit Margin is defined as Contribution Profit divided by revenue.
Adjusted Operating Profit is defined as Contribution Profit margin less General and administrative expenses.
Adjusted EBIT is defined as profit or loss before income taxes, net finance cost, share based compensation, adjusted for income and costs which are significant in nature and that management considers not reflective
of underlying operational activities, mainly including net gains on disposal of long-term assets, negative goodwill from acquisition of Sergio Rossi, gain on debt restructuring and government grants.
Adjusted EBITDA is defined as profit or loss before income taxes, net finance cost, exchange gains/(losses), depreciation, amortization, share based compensation and provisions and impairment losses adjusted for
income and costs which are significant in nature and that management considers not reflective of underlying operational activities, mainly including net gains on disposal of long-term assets, negative goodwill from
acquisition of Sergio Rossi, gain on debt restructuring and government grants. |
Lanvin (NYSE:LANV)
Graphique Historique de l'Action
De Jan 2025 à Fév 2025

Lanvin (NYSE:LANV)
Graphique Historique de l'Action
De Fév 2024 à Fév 2025

