UNITED STATES
SECURITIES AND EXCHANGE COMMISSION
Washington, D.C. 20549
FORM 6-K
REPORT OF FOREIGN PRIVATE ISSUER
PURSUANT TO RULE 13a-16 OR 15d-16
UNDER THE SECURITIES EXCHANGE ACT OF 1934
For the month of November 2023
Commission File Number: 001-40685
METALS ACQUISITION LIMITED
(Translation of registrant’s name into
English)
3rd Floor, 44 Esplanade, St.
St. Helier, Jersey, JE49WG
Tel: +(817) 698-9901
(Address of principal executive office)
Indicate by check mark whether the registrant files or will file annual
reports under cover of Form 20-F or Form 40-F.
Form 20-F x
Form 40-F ¨
On November 14, 2023, Metals Acquisition Limited
issued a press release announcing an operational update on the CSA Copper Mine.
The information in this Form
6-K shall not be deemed “filed” for purposes of Section 18 of the Securities Exchange Act of 1934 (the “Exchange
Act”) or otherwise subject to the liabilities of that section, nor shall it be deemed incorporated by reference in any filing under
the Securities Act of 1933 or the Exchange Act.
The press release is
furnished as Exhibit 99.1 to this Report on Form 6-K.
EXHIBIT INDEX
SIGNATURE
Pursuant to the requirements
of the Securities Exchange Act of 1934, the registrant has duly caused this report to be signed on its behalf by the undersigned, thereunto
duly authorized.
| METALS ACQUISITION LIMITED |
|
| |
|
|
| By: |
/s/ Michael James McMullen |
|
| |
Name: |
Michael James McMullen |
|
| |
Title: |
Chief Executive Officer |
|
Date: November 14, 2023
Exhibit 99.1

November 14, 2023
Metals Acquisition Limited Provides Operational Update
ST. HELIER, Jersey--(BUSINESS WIRE)--Metals Acquisition Limited (NYSE:
MTAL):
Metals Acquisition Limited (“MAC”
or the “Company”) today provides a market update on the following aspects of the CSA Copper Mine for the September quarter:
| · | Total Reportable Injury Frequency Rate (“TRIFR”)
reduced slightly to 9.5 per million hours and zero Lost Time Injuries (“LTI”) |
| · | September quarter production of 9,845 tonnes
of copper and 115,000 ounces of silver |
| · | September quarter C11 costs
of US$1.86/lb down from US$3.02/lb and US$2.90/lb in the immediate two quarters prior to MAC ownership, as post acquisition offtake terms
and cost reductions were implemented. Site general administration (“G+A”) costs are inclusive of US$1.5 million of exploration
costs equivalent to US$0.07/lb |
| · | Approval of the new Rehabilitation Cost Estimate
(“RCE”) by the NSW Resource Regulator at A$44 million and approval of the Stage 10 lift of the Tailings Storage Facility (“TSF”) |
| · | Cash on hand as of the date of this release of
US$48 million |
Mick McMullen CEO, commented “Since acquiring
the CSA Copper Mine just five months ago, the results demonstrate that our team has continued to identify opportunities to unlock value,
while not compromising safety. We have accomplished a lot in a short period and the work being done now will yield strong returns in 2024
and beyond. I am particularly excited about the positive trends in safety, production and cost reduction that our team have been able
to implement in such a short period.
1 MAC’s results are reported under International Financial
Reporting Standards (IFRS). This release may also include certain non-IFRS measures including C1 costs. These C1 cost measures are used
internally by management to assess the performance of our business, make decisions on the allocation of our resources and assess operational
management. Non-IFRS measures have not been subject to audit or review and should not be considered as an indication of or alternative
to an IFRS measure of financial performance. Historical C1 costs for the CSA Copper Mine prior to the acquisition by MAC include the costs
of the previous offtake agreement that was terminated on closing of the acquisition by MAC in June 2023.
1
The rapid advances made on the various permitting
initiatives further cement our view that CSA is a Tier 1 asset in a mining friendly jurisdiction. We will continue to work relentlessly
to unlock additional value at CSA and any future assets that fit within our strategy.”
Unless stated otherwise all references to dollar
or $ are in US$.
ESG
Safety
The TRIFR for the CSA Copper Mine has reduced
slightly from 10.2 to 9.5 for the quarter (refer Figure 1). This is below the NSW underground metalliferous TRIFR for 2022 of 11.97. The
LTI rate of zero compares favourably with the NSW underground metalliferous LTI of 2.6 for 2022.
Whilst MAC believes that safety can continue to
be improved in the future, MAC also believes that remaining at this relatively low level is a great result coming immediately after a
change of ownership and all the operational changes being made at the mine.
Figure 1 - CSA Copper Mine Recordable Injuries
Trailing 12 months

ESG management at the CSA Copper Mine site has
performed above expectations throughout this quarter for the newly acquired asset with various approvals received in short order and a
strong environmental performance.

Regulatory
Key regulatory activities that occurred throughout
the quarter include:
| · | The CSA Copper Mine’s rehabilitation objectives
(“ROBJ’s”) were reviewed to align with the NSW Resource Regulators requirements and submitted on 27th September 2023. |
| · | MAC received the acceptance from the NSW Resource
Regulator for the updated Rehabilitation Cost Estimate (“RCE”) for CML5 (being the CSA Copper Mine’s key tenure). This
RCE is a bond/guarantee which needs to be provided to the NSW government to provide security for the rehabilitation and closure requirements
on the site and is a total of A$44m. |
Approvals
Approvals at the CSA Copper Mine are predominately
through the local Cobar Shire Council as the approving authority, as an integrated development. The following development applications
were approved during the September Quarter.
| · | Stage 9 STSF buttress approved |
| · | Stage 10 Lift and Stage 10 Buttress approved |
| · | Railway dam Borrow Pit approved |
MAC has been actioning significant changes at
the CSA Copper Mine and working closely with local stakeholders during this period of change. The community and approval authorities have
been supportive during this period and MAC continues to believe that Cobar in western NSW is a Tier 1 mining jurisdiction which is becoming
increasingly important in this period of global instability.
Production
The September quarter is the first full quarter
of CSA’s ownership under MAC and was a period of significant change in the organisation. Table 1 contains a summary by quarter for
the year to date.
Table 1 - Quarterly Operational Performance
of the CSA Copper Mine
| | |
Q1 2023 | | |
Q2 2023 | | |
Q3 2023 | |
| Ore Tonnes Milled | |
| 240,698 | | |
| 254,380 | | |
| 300,328 | |
| Grade Milled | |
| 3.7 | % | |
| 3.1 | % | |
| 3.4 | % |
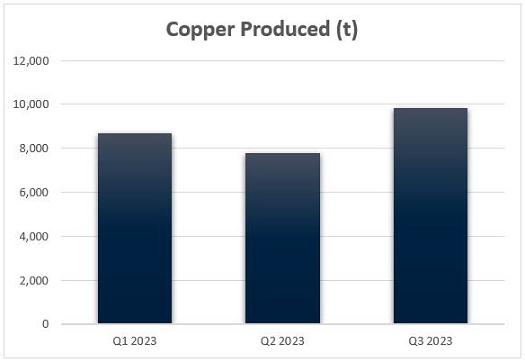
| Copper Produced (t) | |
| 8,691 | | |
| 7,779 | | |
| 9,845 | |
| Silver Produced (oz) | |
| 100,092 | | |
| 84,517 | | |
| 115,081 | |
| | |
| | | |
| | | |
| | |
| Mining Cost/t Ore Mined (US$) | |
$ | 97.5 | | |
$ | 88.8 | | |
$ | 79.1 | |
| Processing Cost/t Milled (US$) | |
$ | 26.4 | | |
$ | 28.0 | | |
$ | 19.8 | |
| G+A Cost/t Milled (US$) | |
$ | 28.9 | | |
$ | 33.0 | | |
$ | 29.3 | |
| C11 (US$/lb) | |
$ | 2.90 | | |
$ | 3.02 | | |
$ | 1.86 | |
| Average Cu Price Received (US$/lb) | |
$ | 4.12 | | |
$ | 3.80 | | |
$ | 3.81 | |
| Development Cost/metre (US$) | |
$ | 18,677 | | |
$ | 11,773 | | |
$ | 10,225 | |
| Total Capital Cost (US$ million) | |
$ | 12.66 | | |
$ | 13.15 | | |
$ | 10.62 | |
The September quarter was the highest quarterly
copper and silver production (Fig 2) for 2023. Whilst this was a good result from the operations team, the production in the month of
September was below plan as a result of a 4 week delay in accessing a high grade stope due to a regulator imposed prohibition notice
relating to ventilation requirements, with actions being taken to reduce the risk of such prohibitions occurring in the future.
On an annual basis the mine turns over approximately
70 stopes, the top 5 or 6 of which account for up to 1/3 of the contained metal mined. Therefore, any delays accessing these high-grade
stopes can negatively impact production in the short term. Access to this stoping area has subsequently been restored and the high grade
(+4% copper) material is now being mined.
Site G+A costs are inclusive of exploration costs
that total US$1.5 million in the September quarter, equivalent to US$0.07/lb of the C1 cash cost.
The average received copper
price was flat quarter on quarter and declined slightly from the first quarter in line with market prices.
Figure 2 - CSA Copper Mine Quarterly Copper
Production
A large number of staffing changes were carried
out during the quarter.
Specific changes include:
| · | Rob Walker commenced as the new General Manager
on 31 July 2023 |
| · | MAC corporate environmental manager appointed
and commenced |
| · | Underground manager appointed and commenced |
| · | MAC corporate contracts manager appointed and
commenced |
| · | HR Manager appointed and commenced |
Total headcount of employees and contractors has
been significantly reduced during the September quarter and now sits at just over 500 people on an FTE basis.
A total of US$1.1 million in restructuring costs
were incurring during the September quarter associated with headcount reductions and have been excluded from the C1 costs as non-recurring.
As seen in Figure 3, C1 cash costs have shown
a rapid decline under MAC’s ownership. As discussed below, MAC is refining the split between mining operating and mining capital
costs in the current quarter.
Figure 3 - CSA Copper Mine C1 Cash Costs

MAC management believes that there are additional
opportunities at the CSA Copper Mine to reduce costs with increased focus on productivity improvements and will continue to implement
additional productivity measures to further reduce C1 costs. Figure 4 provides an illustration of the improvements in productivity that
has already been demonstrated at the mine.
Figure 4 - CSA Copper Mine Tonnes Milled per
Employee

Productivity will have an inverse relationship
to C1 as seen in Figures 3 and 4.
Apart from copper production, the largest driver
of C1 costs is the mining unit rate as mining accounts for approximately 60% of total site operating costs. Figure 5 illustrates the improvement
in the mining unit rate since MAC took ownership of the mine which directional improvement, however these unit rates are still high in
the Australian context and many of the changes made in late September will only make an impact in the fourth quarter. The mine has
a high fixed cost base and the contractor and headcount reductions are targeted at reducing those fixed costs but ultimately material unit
rate reductions will need to also see volume increases.
Work is underway to achieve a higher degree of
granularity on the mining costs and to more accurately determine the split between operating and capital mining costs.
Figure 5 - CSA Copper Mine Mining Unit Rate

The other significant component of the mining
capital costs are development costs, which have been very high at CSA historically. Figure 6 demonstrates the improvements that have been
achieved in the cost per metre of development over the course of the year, and under new management. It should be noted that these are
still high unit rates as compared to Australian peers and MAC believes that further opportunities for reductions exists.
Figure 6 - CSA Copper Mine Mining Development
Costs

Figures 7 and 8 shows the unit rates for processing
and site G+A, with the former improving strongly and the latter slightly improving quarter on quarter. Both are heavily dependent on milled
ore volumes due to their high fixed cost nature.
Figure 7 - CSA Copper Mine Processing Unit Rate

Figure 8 - CSA Copper Mine Site G+A Unit Rate

Capital spend (including capitalized development)
has trended down over the year as seen in Figure 9. This reflects both the completion of the mill replacement works in the second quarter
and the reduction in mine development unit rates into the third quarter.
During the month of September 19 of the 21
major projects team were demobilised from site (all contractors) with the cost reduction benefit from this to be seen from October onwards.
Figure 9 - CSA Copper Mine Site Capital Expenditure

Preliminary construction works on the next lift
for TSF commenced in September which will slightly increase capital spend in the fourth quarter relative to the third quarter. Overall
capital spend for the year is likely to be lower than the US$58 million that MAC had previously estimated and will likely be closer to
US$50 million with a H2 run rate of US$44 - $46 million.
Overall, considering the significant changes at
the mine, the production and cost performance trends are pleasing and provide a strong platform to build on for the December quarter
and into 2024.
Mine Plan, Resource and Reserve
Since taking ownership the MAC team has been actively
looking for ways to improve on the previous mine plan. Figure 10 illustrates the known mineralisation in the immediate mine environment.
The bulk of the current mining is in QTSN (circa
75% of production) and QTSC with additional minor production from the East and West deposits (not shown due to angle of section). The
mine commenced production as a lead-zinc-silver mine near surface from the Upper Level Zone A mineralisation and then progressed into
the current copper deposit from the Upper Level Zone B approximately 400m below surface. There is significant remnant mineralisation in
both the Upper Zone A and Zone B areas and none of this is in the current mineral resource estimate as all the data is in hard copy. Work
is underway to digitize this material to bring it into the mineral resource estimate in the future.
The Upper Level Zone C is the top of the current
mineral resource and contains significant mineralisation that is not in the current mine plan. Work is under way to bring that material
into the mine plan and a significant number of stopes have been designed and physical inspections completed. This material is typically
in the circa 3% Cu diluted grade range however it is very close vertically to the crusher dump pocket and would have lower unit rate costs
than the ore from the bottom of QTSN.
Drilling of the QTS S Upper A mineralisation was
completed over the last 3 months with a view to bringing that into the mineral resource estimate. This is a relatively narrow but very
high-grade zone and during October the Company completed a mine design and is out to tender on the mining works associated with the
development of this. During the December quarter a decision will be made on the optimal development plan and whether to carry out
the works as an owner mining or contractor operation.
Finally, the Company has been remodelling the
resource at a lower cut-off grade based on the new cost structure post-closing. This work is well underway and will be fed into the mine
planning for the 2023 resource and reserve update.
Figure 10 - CSA Copper Mine Long Section Showing
Deposits

Finance and Corporate
The Company continues to progress work and consideration
of undertaking an additional listing on the Australian Securities Exchange (ASX). The Company is well progressed with this work
stream and, subject to board approval and various factors out of the Company’s control (including market conditions), anticipates
proceeding with the ASX listing in calendar Q1 2024. The timing and quantum of any associated equity raise would be market dependent and
the Company cannot provide any certainty as to when or if an ASX listing or associated equity raise would occur.
Subsequent to the end of the quarter, on 13 October 2023,
the Company completed a Private Placement (PIPE) with new and existing investors for gross proceeds of US$20,098,056 at a price of US$11/share
for a total of 1,827,096 new shares issued. At the time of this report the Company’s share capital is as shown below in Table 2.
Table 2
| Pro Forma Ownership | |
M Shares | | |
M Securities | | |
% of Capital
Structure | |
| Shares on Issue/Oct PIPE | |
| 50.13 | | |
| 50.13 | | |
| 72.5 | % |
Founder / Sponsor Warrants
(6,535,304 at $11.50/sh strike) | |
| - | | |
| 6.54 | | |
| 9.5 | % |
Investor Warrants
(8,838,260 at $11.50/sh strike) | |
| - | | |
| 8.84 | | |
| 13 | % |
Subordinated Debt Warrants
(3,187,500 at $12.50/sh strike) | |
| - | | |
| 3.18 | | |
| 5 | % |
| Total | |
| 50.13 | | |
| 68.80 | | |
| 100 | % |
During the quarter, the Company delivered 3,375
tonnes of copper into the hedge book at an average price of US$3.72/lb.
At the end of September, the remaining copper
hedge book consisted of the following:
| Year | |
Tonnes | | |
Price US$/lb | |
| 2023 | |
| 3,375 | | |
$ | 3.72 | |
| 2024 | |
| 12,420 | | |
$ | 3.72 | |
| 2025 | |
| 12,420 | | |
$ | 3.72 | |
As of the date of this report the Company had
US$48 million of cash on hand.
Contacts
|
Mick McMullen
Chief Executive Officer
Metals Acquisition Limited.
+1 (817) 698-9901
mick.mcmullen@metalsacqcorp.com |
Dan Vujcic
Chief Development Officer and Interim Chief Financial
Officer
Metals Acquisition Limited.
+61 451 634 120
dan.vujcic@metalsacqcorp.com |
About Metals Acquisition Limited
Metals Acquisition Limited (NYSE: MTAL) is a company
focused on operating and acquiring metals and mining businesses in high quality, stable jurisdictions that are critical in the electrification
and decarbonization of the global economy.
Forward Looking Statements
This press release includes “forward-looking
statements.” MAC’s actual results may differ from expectations, estimates, and projections and, consequently, you should not
rely on these forward-looking statements as predictions of future events. Words such as “expect,” “estimate,”
“project,” “budget,” “forecast,” “anticipate,” “intend,” “plan,”
“may,” “will,” “could,” “should,” “believes,” “predicts,” “potential,”
“continue,” and similar expressions (or the negative versions of such words or expressions) are intended to identify such
forward- looking statements. These forward-looking statements include, without limitation, MAC’s expectations with respect to future
performance of the CSA Mine . These forward-looking statements involve significant risks and uncertainties that could cause the actual
results to differ materially from those discussed in the forward-looking statements. Most of these factors are outside MAC’s control
and are difficult to predict. Factors that may cause such differences include, but are not limited to: the ability to recognize the anticipated
benefits of the business combination, which may be affected by, among other things; the supply and demand for copper; the future price
of copper; the timing and amount of estimated future production, costs of production, capital expenditures and requirements for additional
capital; cash flow provided by operating activities; unanticipated reclamation expenses; claims and limitations on insurance coverage;
the uncertainty in mineral resource estimates; the uncertainty in geological, metallurgical and geotechnical studies and opinions; infrastructure
risks; and dependence on key management personnel and executive officers; and other risks and uncertainties indicated from time to time
in the definitive proxy statement/prospectus relating to the business combination that MAC filed with the SEC relating to its acquisition
of the CSA Copper Mine, including those under “Risk Factors” therein, and in MAC’s other filings with the SEC. MAC cautions
readers not to place undue reliance upon any forward-looking statements, which speak only as of the date made. MAC does not undertake
or accept any obligation or undertaking to release publicly any updates or revisions to any forward-looking statements to reflect any
change in its expectations or any change in events, conditions, or circumstances on which any such statement is based.
More information on potential factors that could
affect MAC’s or CSA Copper Mine’s financial results is included from time to time in MAC’s public reports filed with
the SEC. If any of these risks materialize or MAC’s assumptions prove incorrect, actual results could differ materially from the
results implied by these forward-looking statements. There may be additional risks that MAC does not presently know, or that MAC currently
believes are immaterial, that could also cause actual results to differ from those contained in the forward-looking statements. In addition,
forward-looking statements reflect MAC’s expectations, plans or forecasts of future events and views as of the date of this communication.
MAC anticipates that subsequent events and developments will cause its assessments to change. However, while MAC may elect to update these
forward-looking statements at some point in the future, MAC specifically disclaims any obligation to do so, except as required by law.
These forward- looking statements should not be relied upon as representing MAC’s assessment as of any date subsequent to the date
of this communication. Accordingly, undue reliance should not be placed upon the forward-looking statements.
Non-IFRS financial information
MAC’s results are reported under International
Financial Reporting Standards (IFRS). This release may also include certain non-IFRS measures including C1 costs. These C1 cost measures
are used internally by management to assess the performance of our business, make decisions on the allocation of our resources and assess
operational management. Non-IFRS measures have not been subject to audit or review and should not be considered as an indication of or
alternative to an IFRS measure of financial performance.
MAC Copper (NYSE:MTAL)
Graphique Historique de l'Action
De Jan 2025 à Fév 2025

MAC Copper (NYSE:MTAL)
Graphique Historique de l'Action
De Fév 2024 à Fév 2025

