Wallbridge Mining Company Limited (TSX: WM,
OTCQB:WLBMF) (“
Wallbridge” or the
“
Company”) today announced that it has received
the final assay results from its 1,303 metre Phase 2 drilling
program completed in September 2024 at its 100% owned Fenelon Gold
Project (“
Fenelon”).
The Phase 2 program comprised four targeted
infill holes drilled within an approximate 150 metre by 250 metre
area to provide greater definition of gold resources within the
upper levels of the high-grade Tabasco zone. Significant highlights
include:
- 5.68 g/t Au over 1.5 metres in
drill hole FA-24-581
- 3.93 g/t Au over 2.5 metres, 14.66
g/t Au over 1.5 metres in drill hole FA-24-582
- 7.03 g/t Au over 0.5 metres, 2.70
g/t Au over 3.0 metres in drill hole FA-24-583
- 5.92 g/t Au over
2.7 metres in drill hole FA-24-584
“We’re pleased to announce our final drill
results for 2024. The grades returned from these latest four holes
provide further confirmation of the position and extent of the
principal structures that extend upward from the high-grade core of
the Fenelon gold resource,” commented Brian W. Penny, Wallbridge
Chief Executive Officer. “We look forward to releasing the results
of an updated Preliminary Economic Assessment at Fenelon in the
first quarter of 2025 and will continue to provide regular updates
to the market on our corporate activities,” concluded Mr.
Penny.
Earlier this year and during 2023, Wallbridge
released a series of results from delineation and infill drilling
completed at Fenelon subsequent to the announcement of the 2023
mineral resource estimate (see Wallbridge news releases dated May
22, 2024, February 7, 2024, June 6, 2023, March 6, 2023, January
17, 2023, and Amended and Re-stated: NI 43-101 Technical Report
dated December 29, 2023).
Links to a drill hole location map and
cross-sections for the drill holes reported in this news release
are provided here: Fenelon Gold Project: Q2 2024 Plan View Map
& Cross-Sections
Additional details from the recently completed
drilling are provided in the summary table below:
|
Wallbridge Fenelon Gold Project: 2024 Phase 2 Drill Assay
Highlights |
|
Drill Hole |
|
From(m) |
To(m) |
Length(m) |
Au(g/t) |
Zone/Corridor |
|
FA-24-581 |
|
235.5 |
237.0 |
1.5 |
5.68 |
Tabasco |
|
FA-24-582 |
|
143.5 |
146.0 |
2.5 |
3.93 |
Tabasco |
|
Including |
|
143.5 |
144.5 |
1.0 |
8.46 |
|
|
|
|
144.5 |
145.0 |
0.5 |
0.10 |
|
|
|
|
145.0 |
146.0 |
1.0 |
1.17 |
|
|
|
* |
248.0 |
249.5 |
1.5 |
14.66 |
Tabasco |
|
Including |
|
248.0 |
248.5 |
0.5 |
4.84 |
|
|
|
* |
248.5 |
249.5 |
1.0 |
19.57 |
|
|
|
|
301.0 |
309.0 |
8.0 |
2.91 |
Tabasco |
|
Including |
|
301.0 |
302.5 |
1.5 |
4.96 |
|
|
|
|
302.5 |
304.0 |
1.5 |
0.05 |
|
|
FA-24-582 (cont’d) |
|
304.0 |
305.0 |
1.0 |
11.95 |
|
|
|
|
305.0 |
305.5 |
0.5 |
0.09 |
|
|
|
|
305.5 |
307.0 |
1.5 |
1.69 |
|
|
|
|
307.0 |
308.0 |
1.0 |
0.02 |
|
|
|
|
308.0 |
309.0 |
1.0 |
1.20 |
|
|
FA-24-583 |
|
121.5 |
122.0 |
0.5 |
7.03 |
Tabasco |
|
|
|
266.5 |
269.5 |
3.0 |
2.70 |
Tabasco |
|
FA-24-584 |
|
219.0 |
221.7 |
2.7 |
5.92 |
Tabasco |
|
Including |
|
219.0 |
220.0 |
1.0 |
0.52 |
|
|
|
|
220.0 |
221.0 |
1.0 |
14.91 |
|
|
|
|
221.0 |
221.7 |
0.7 |
0.50 |
|
|
Notes |
|
|
|
|
|
|
|
1 Highlighted assay composites have been selected
based on a Metal Factor >5 gm*mtrs and/or includes a result
>5 g/t (MF = Au g/t * Interval length). |
|
2 Asterisk * denotes visible gold (VG) observed in
drill core. |
|
3 True widths are estimated to be 60-90% of the
reported core length intervals. |
Links to tables with complete summary assay
results and drillhole location information are provided
here: Fenelon Gold Project: Drill Assay Summary
and Location Information Dec 2024.
Quality Assurance / Quality Control
Wallbridge maintains a Quality Assurance/Quality
Control ("QA/QC") program for all its exploration
projects using industry best practices. Key elements of the QA/QC
program include verifiable chain of custody for samples, regular
insertion of blanks and certified reference materials, and
completion of secondary check analyses performed at a separate
independent accredited laboratory. Drill core is halved and shipped
in sealed bags to SGS Canada Inc. in Val d’Or, Quebec where they
are re-distributed to other SGS laboratory facilities according to
the analytical method being requested by Wallbridge. Gold analyses
are routinely performed via fire assay with ICP-OES finish methods.
For greater precision and accuracy, samples assaying 10 g/t Au or
greater are re-assayed via metallic screen fire assay method or
fire assay/gravimetric finish, depending on the amount of sample
material remaining available. Samples containing visible gold are
submitted directly for analysis by metallic screen fire assay
method.
SGS Natural Resources analytical laboratories
operate under a Quality Management System that conforms to the
requirements of ISO/IEC 17025. All of SGS’ Canadian analytical
sites are accredited by the Standards Council of Canada (SCC) for
specific mineral tests listed on the scope of accreditation to the
ISO/IEC 17025 standard. ISO/IEC 17025 addresses both the quality
management system and the technical aspects of operating a testing
laboratory. Physical sample preparation involving accredited test
methods as listed on the scope of accreditation may be performed at
other sites listed on the SGS Canada Inc – Natural Resources –
Minerals group accreditation or at offsite sample preparation
laboratories that are monitored regularly for quality control and
quality assurance practices, including SGS Canada Inc, Garson, SGS
Canada Inc, Val d’Or and SGS Canada Inc, Grand
Falls-Windsor.
Qualified Person
The Qualified Person responsible for the
technical content of this news release is Mr. Mark A. Petersen,
M.Sc., P.Geo. (OGQ AS-10796; PGO 3069), Senior Exploration
Consultant for Wallbridge.
About Wallbridge
Mining
Wallbridge is focused on creating value through
the exploration and sustainable development of gold projects along
the Detour-Fenelon Gold Trend in Québec’s Northern Abitibi region
while respecting the environment and communities where it
operates.
Wallbridge’s most advanced projects, Fenelon
Gold (“Fenelon”) and Martiniere Gold
(“Martiniere”) incorporate a combined 3.05 million
ounces of indicated gold resources and 2.35 million ounces of
inferred gold resources. Fenelon and Martiniere are located within
an 830 square kilometre exploration land package in the Northern
Abitibi region of Quebec.
Wallbridge has reported a positive Preliminary
Economic Assessment (“PEA”) at Fenelon that
estimates average annual gold production of 212,000 ounces over 12
years.
For further information please visit the
Company’s website at https://wallbridgemining.com/ or
contact:
Wallbridge Mining Company
Limited
Brian Penny, CPA, CMA CEO Tel: (416)
716-8346 Email:
bpenny@wallbridgemining.com M: +1 416 716 8346
Tania Barreto, CPIR Director, Investor
Relations Email: tbarreto@wallbridgemining.com M:
+1 289 819 3012
Cautionary Note Regarding
Forward-Looking Information
The information in this document may contain
forward-looking statements or information (collectively,
“FLI”) within the meaning of applicable Canadian
securities legislation. FLI is based on expectations, estimates,
projections and interpretations as at the date of this
document.
All statements, other than statements of
historical fact, included herein are FLI that involve various
risks, assumptions, estimates and uncertainties. Generally, FLI can
be identified by the use of statements that include, but are not
limited to, words such as “seeks”, “believes”, “anticipates”,
“plans”, “continues”, “budget”, “scheduled”, “estimates”,
“expects”, “forecasts”, “intends”, “projects”, “predicts”,
“proposes”, "potential", “targets” and variations of such words and
phrases, or by statements that certain actions, events or results
“may”, “will”, “could”, “would”, “should” or “might”, “be taken”,
“occur” or “be achieved.”
FLI in this document may include, but is not
limited to: statements regarding the results of the PEA; the
potential future performance of the Common Shares; future drill
results; the Company’s ability to convert inferred resources into
measured and indicated resources; environmental matters;
stakeholder engagement and relationships; parameters and methods
used to estimate the MRE’s at Fenelon and Martiniere (collectively
the “Deposits”); the prospects, if any, of the
Deposits; future drilling at the Deposits; and the significance of
historic exploration activities and results.
FLI is designed to help you understand
management’s current views of its near- and longer-term prospects,
and it may not be appropriate for other purposes. FLI by their
nature are based on assumptions and involve known and unknown
risks, uncertainties and other factors which may cause the actual
results, performance, or achievements of the Company to be
materially different from any future results, performance or
achievements expressed or implied by such FLI. Although the FLI
contained in this document is based upon what management believes,
or believed at the time, to be reasonable assumptions, the Company
cannot assure shareholders and prospective purchasers of securities
of the Company that actual results will be consistent with such
FLI, as there may be other factors that cause results not to be as
anticipated, estimated or intended, and neither the Company nor any
other person assumes responsibility for the accuracy and
completeness of any such FLI. Except as required by law, the
Company does not undertake, and assumes no obligation, to update or
revise any such FLI contained in this document to reflect new
events or circumstances. Unless otherwise noted, this document has
been prepared based on information available as of the date of this
document. Accordingly, you should not place undue reliance on the
FLI, or information contained herein.
Furthermore, should one or more of the risks,
uncertainties or other factors materialize, or should underlying
assumptions prove incorrect, actual results may vary materially
from those described in FLI.
Assumptions upon which FLI is based, without
limitation, include: the results of exploration activities, the
Company’s financial position and general economic conditions; the
ability of exploration activities to accurately predict
mineralization; the accuracy of geological modelling; the ability
of the Company to complete further exploration activities; the
legitimacy of title and property interests in the Deposits; the
accuracy of key assumptions, parameters or methods used to estimate
the MREs and in the PEA; the ability of the Company to obtain
required approvals; geological, mining and exploration technical
problems; failure of equipment or processes to operate as
anticipated; the evolution of the global economic climate; metal
prices; foreign exchange rates; environmental expectations;
community and non-governmental actions; and, the Company’s ability
to secure required funding. Risks and uncertainties about
Wallbridge's business are discussed in the disclosure materials
filed with the securities regulatory authorities in Canada, which
are available at www.sedarplus.ca.
Cautionary Notes to United States
Investors
Wallbridge prepares its disclosure in accordance
with NI 43-101 which differs from the requirements of the U.S.
Securities and Exchange Commission (the
"SEC"). Terms relating to mineral properties,
mineralization and estimates of mineral reserves and mineral
resources and economic studies used herein are defined in
accordance with NI 43-101 under the guidelines set out in CIM
Definition Standards on Mineral Resources and Mineral Reserves,
adopted by the Canadian Institute of Mining, Metallurgy and
Petroleum Council on May 19, 2014, as amended. NI 43-101 differs
significantly from the disclosure requirements of the SEC generally
applicable to US companies. As such, the information presented
herein concerning mineral properties, mineralization and estimates
of mineral reserves and mineral resources may not be comparable to
similar information made public by U.S. companies subject to the
reporting and disclosure requirements under the U.S. federal
securities laws and the rules and regulations thereunder.
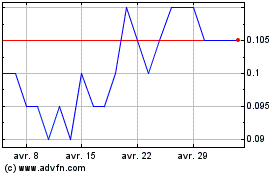
Wallbridge Mining (TSX:WM)
Graphique Historique de l'Action
De Jan 2025 à Fév 2025

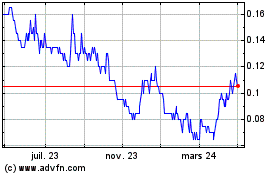
Wallbridge Mining (TSX:WM)
Graphique Historique de l'Action
De Fév 2024 à Fév 2025


