UNITED STATES
SECURITIES AND EXCHANGE COMMISSION
Washington, D.C. 20549
FORM 20-F/A
Amendment No. 1
| ☐ | REGISTRATION STATEMENT PURSUANT TO SECTION 12(b) OR (g) OF THE SECURITIES EXCHANGE ACT OF 1934 |
OR
| ☒ | ANNUAL REPORT PURSUANT TO SECTION 13 OR 15 (d) OF THE SECURITIES EXCHANGE ACT OF 1934 FOR THE FISCAL
YEAR ENDED DECEMBER 31, 2022 |
OR
| ☐ | TRANSITION REPORT PURSUANT TO SECTION 13 OR 15(d) OF THE SECURITIES EXCHANGE ACT OF 1934 |
OR
| ☐ | SHELL COMPANY REPORT PURSUANT TO SECTION 13 OR 15(d) OF THE SECURITIES EXCHANGE ACT OF 1934 |
Date of event requiring this shell company
report
For the transition period from _____________________
to ____________________
Commission file number 001-32702
ALMADEN MINERALS LTD.
(Exact name of Registrant as specified
in its charter)
British Columbia, Canada
(Jurisdiction of incorporation or organization)
1333 Johnston Street, #210, Vancouver,
British Columbia V6H 3R9
(Address of principal executive offices)
Korm Trieu, ktrieu@almadenminerals.com, 1333 Johnston Street, #210,
Vancouver, BC V6H 3R9
(Name, Telephone, E-mail and/or Facsimile number and Address of Company
Contact Person)
| Securities registered or to be registered pursuant to Section 12(b) of the Act. |
| Title of each class |
Trading symbol |
Name of each exchange on which registered |
| |
|
|
| Common shares without Par Value |
AAU |
NYSE American |
| |
|
|
Securities registered or to be registered
pursuant to Section 12(g) of the Act.
None
(Title of Class)
Securities for which there is a reporting
obligation pursuant to Section 15(d) of the Act.
None
Indicate the number of outstanding shares of each of the issuer’s classes of capital or
common shares as of the close of the period covered by the annual report.
137,221,408
Indicate by check mark if the registrant is a well-known seasoned issuer,
as defined in Rule 405 of the Securities Act.
☐ Yes ☒ No
If this report is an annual or transition report, indicate by check mark
if the registrant is not required to file report pursuant to Section 13 or 15(d) of the Securities Exchange Act of 1934.
☐ Yes ☒ No
Indicate by check mark whether the registrant (1) has filed all reports
required to be filed by Section 13 or 15(d) of the Securities Exchange Act of 1934 during the preceding 12 months (or for such shorter
period that the registrant was required to file such reports), and (2) has been subject to such filing requirements for the past 90 days.
☒ Yes ☐ No
Indicate by check mark whether the registrant has submitted electronically
every Interactive Data File required to be submitted pursuant to Rule 405 of Regulation S-T (§232.405 of this chapter) during the
preceding 12 months (or for such shorter period that the Registrant was required to submit such files).
☒ Yes ☐ No
Indicate by check mark whether the registrant is a large accelerated filer,
an accelerated filer or a non-accelerated filer. See definition of “accelerated filer and large accelerated filer” in Rule
12b-2 of the Exchange Act.
| Large accelerated filer ☐ | |
Accelerated filer ☐ | |
Non-accelerated filer ☒ | |
Emerging Growth Company ☒ |
If an emerging growth company that prepares its financial statements in
accordance with U.S. GAAP, indicate by check mark if the registrant has elected not to use the extended transition period for complying
with any new or revised financial accounting standards† provided pursuant to Section 13(a) of the Exchange Act. ☐
Indicate by check mark whether the registrant has filed a report on
and attestation to its management’s assessment of the effectiveness of its internal control over financial reporting under
Section 404(b) of the Sarbanes-Oxley Act (15 U.S.C. 7262(b)) by the registered public accounting firm that prepared or issued its
audit report. ☐
If securities are registered pursuant to
Section 12(b) of the Act, indicate by check mark whether the financial statements of the registrant included in the filing reflect the
correction of an error to previously issued financial statements. ☐1
Indicate by check mark whether any of those
error corrections are restatements that required a recovery analysis of incentive-based compensation received by any of the registrant’s
executive officers during the relevant recovery period pursuant to §240.10D-1(b). ☐1
Indicate by check mark which basis of accounting the registrant has used to prepare the financial
statements included in this filing:
| U.S. GAAP ☐ |
International Financial Reporting Standards as issued
by the International Accounting Standards Board ☒ |
Other ☐ |
1 Checkboxes are blank pending adoption of
the underlying rules.
If “Other” has been checked in response to the previous question, indicate by check
mark which financial statement item the registrant has elected to follow.
☐ Item 17 ☐ Item 18
If this is an annual report, indicate by check mark whether the registrant
is a shell company (as defined in Rule 12b-2 of the Exchange Act).
☐ Yes ☒ No
(APPLICABLE ONLY TO ISSUERS INVOLVED IN BANKRUPTCY PROCEEDS DURING THE
PAST FIVE YEARS)
Indicate by check mark whether the registrant has filed all documents and reports required to
be filed by Section 12, 13 or 15(d) of the Securities Exchange Act of 1934 subsequent to the distribution of securities under a plan confirmed
by a court.
☐
Yes ☐ No
Under the Jumpstart Our Business Startups Act of 2012 (the "JOBS Act"),
Almaden is classified as an "Emerging Growth Company". The Company will continue to be deemed an emerging growth company until
the earliest on the last day of our fiscal year during which (i) annual gross revenue exceeds $1.07 billion or (ii) the Company issues
more than $1.0 billion in non-convertible debt in a three-year period. Almaden will lose its status as an emerging growth company on the
last day of its fiscal year following the fifth anniversary of the date of the first sale of common equity securities pursuant to an effective
registration statement. The Company will also lose its status as an emerging growth company if at any time it is deemed to be a large
accelerated filer.
As an emerging growth company, Almaden is exempt from Section 404(b) of
the Sarbanes-Oxley Act of 2002, as amended (the “Sarbanes-Oxley Act”), which requires a public company’s auditor to
attest to, and report on, management’s assessment of its internal controls. The Company is also exempt from Sections 14A(a) and
(b) of the Securities Exchange Act of 1934, as amended (the “Exchange Act”), which require companies to hold shareholder advisory
votes on executive compensation and golden parachute compensation.
Almaden has elected to use the extended transition period for complying
with new or revised accounting standards under Section 102(b)(2) of the Jobs Act, that allows the Company to delay the adoption of new
or revised accounting standards that have different effective dates for public and private companies until those standards apply to private
companies. As a result of this election, Almaden’s financial statements may not be comparable to companies that comply with public
company effective dates.
Explanatory Note
Almaden Minerals Inc. (“we”, “our”, “us”,
the “Company” and “Almaden”) is filing this Amendment No. 1 on Form 20-F/A (this “Amendment”) to our
Annual Report on Form 20-F for the fiscal year ended December 31, 2022 (the “Original Filing”), filed with the Securities
and Exchange Commission (the “SEC”) on April 27, 2023, in response to comments received from the SEC. We are filing this Amendment
to revise Item 4. Information on the Company and Exhibit 14.2 S-K 1300 Technical Report Summary of the Ixtaca Gold-Silver Project as previously
filed on April 28, 2022.
This Amended Annual Report as of the filing date of the Form 20-F (the
“Filing Date”) does not reflect events that may have occurred subsequent to the Filing Date and does not modify or update
our disclosures in the Original Filing.
Item 4. Information on the Company
D. Property, Plants and Equipment
Company’s Principal Property
The Tuligtic Project, which hosts the Company’s Ixtaca discovery,
is the only project material to the Company. The Tuligtic Project property (the “Tuligtic Property” or the “Property”)
is located in Puebla State, Mexico at 618,800m east and 2,176,100m north (UTM NAD83 Zone 14 coordinates).
The Tuligtic Property/Ixtaca Project – Mexico
Location and Access
The Ixtaca deposit, the epithermal gold-silver target within the Tuligtic
Property, is located 8 km northwest of the town of San Francisco Ixtacamaxtitlán, the county seat of the municipality of Ixtacamaxtitlán,
Puebla State. The Ixtaca Project is accessible by driving 40 km east along Highway 119 from Apizaco, an industrial center located approximately
50 km north of Puebla City by two-lane Highway, and then north approximately 2 km along a paved road to the town of Santa Maria. The trip
from Apizaco to site can be driven in approximately 1.5 hours. There is also access to the Tuligtic Property using gravel roads from the
northeast via Tezhuitan and Cuyoaco, from the south via Libres and from the northwest via Chignahuapan. The Xicohtencatl Industrial
complex lies 30 km southwest by paved road from the Ixtaca Project, and houses agricultural, chemical, biomedical and industrial manufacturing
facilities and is serviced by rail. Puebla, the fourth largest city in Mexico has a population in excess of 4 million people, and includes
one of the largest Volkswagen automotive plants outside Germany.
The Topography on the Tuligtic Property is generally moderate to
steep hills with incised stream drainages. Elevation ranges from 2,300 meters (m) above sea level in the south to 2,800 m in the north.
Vegetation is dominantly cactus and pines and the general area is also somewhat cultivated with subsistence vegetables, bean and corn
crops. The Ixtaca Zone (as defined below) exploration area has been previously cleared and logged. The region has a temperate climate
with mean monthly temperatures ranging from 16°C in June to 12°C in January. The area experiences approximately 714 mm of precipitation
annually with the majority falling during the rainy season, between June and September. Annual evapotranspiration is estimated to be 774
mm. Exploration can be conducted year-round within the Tuligtic Property; however, road building and drilling operations may be impacted
by weather to some degree during the rainy season. Electricity is available on the Tuligtic Property from the national electricity grid
that services nearby towns such as Santa Maria and Zacatepec. The surface rights locally are privately owned and Almaden has negotiated
voluntary surface land use agreements with surface landowners within the exploration area prior to beginning activities. To date Almaden
has secured through purchase agreements over 1,139 hectares, from numerous independent owners.

Claims and Title
The Tuligtic Property was staked by Almaden in 2001, following the identification
of surficial clay deposits that were interpreted to represent high-level epithermal alteration. The Property originally consisted of approximately
14,000 hectares (the “Original Concessions”), as shown below:
| Claim Name |
Claim Number |
Area (hectares) |
Valid Until Date |
| Cerro Grande |
219469 |
11,202 |
March 5, 2053 |
| Cerro Grande 2 |
233434 |
3,028 |
February 23, 2059 |
| Total |
|
14,230 |
|
On February 17, 2022, the Company announced that the SCJN reached a decision
in respect of the Mineral Title Lawsuit involving the Company’s mineral claims (for background see Item 8. Financial Information,
sub-heading “Legal Proceedings”). On April 27, 2022, the Company announced that the SCJN published its final decision regarding
the Mineral Title Lawsuit.
The final decision of the SCJN determines that the Mexican mineral title
law is constitutional, but that before issuing Almaden’s mineral titles, Economia should have provided for a consultation procedure
with relevant indigenous communities. The decision orders Economia to declare Almaden’s mineral titles ineffective (“insubsistentes”)
and to then issue them to Almaden following Economia’s compliance with a series of steps necessary to meet its obligation to carry
out the necessary procedures to consult with indigenous communities.
The final SCJN decision (i) expands indigenous consultation requirements;
(ii) provides details regarding the procedure for indigenous consultation prior to the grant of mineral claims; and (iii) clarifies that
the Company’s applications were submitted pursuant to the legal framework in force at the time. The Company understands that its
Mineral Rights are safeguarded while the mining authorities comply with conditions and requirements contained in the SCJN decision.
On July 4, 2022, the Company reported that Economia was officially notified
of the final decision of the SCJN relating to the Mineral Title Lawsuit, and in turn notified Almaden that the Company’s mineral
titles relating to the Ixtaca Project were “ineffective”. The Company understands this to mean that the mineral title reverted
to application status, and that these applications preserve the mineral rights for Almaden but do not allow the Company to engage in exploration
until such time as Economia completes the steps required in the court-ordered indigenous consultation in the area covered by the mineral
title applications.
On February 22, 2023, the Company reported that Economia had made a submission
to the District Court, which is implementing the SCJN decision, to deny the two mineral title applications which were first made by Almaden
in 2002 and 2008, and which in turn led to the grant of mineral titles in 2003 and 2009, respectively (see the “Original Concessions”,
above). In its District Court submission, Economia states that it reviewed the original claim applications on file and resolved, despite
acting to the contrary in 2003 and 2009, that the applications contain technical faults which preclude the grant of the mineral claims
(the “Economia Submission”). Economia is therefore seeking to deny the grant of the mineral claims prior to engaging in the
indigenous consultation ordered by the SCJN. These mineral claims underpin the Ixtaca deposit which was discovered by Almaden in 2010,
and were reduced to application status because of the February, 2022 decision of the SCJN. Almaden believes that this action by Economia
is inconsistent with the Mexican Mining Law, the SCJN decision, and international law. The Company submitted arguments challenging the
Economia Submission to the District Court, but on April 13, 2023, the Company reported that the District Court ruled in favour of the
Economia Submission. The Company is appealing this ruling to a higher court, and additional legal action is being considered. In the meantime,
Almaden has been advised that so long as these appeals are continuing, Almaden’s mineral title applications from 2002 and 2008 remain
in place thus preserving the mineral rights.
The Company had also, in November, 2022 during the time that the Company’s
rights to the area of the Ixtaca project were protected by its original title applications, submitted amended title applications which
substantially reduced the area being requested. To date the General Directorate of Mines within Economia has not responded to these amended
mineral title applications, and they were not considered by the District Court in its decision regarding the Economia Submission.
Further information on the Amparo is provided in Item 8 below under the
heading “Legal Proceedings”.
Almaden’s interest with respect to the Tuligtic Property is held
by Minera Gorrion S.A. de C.V., a subsidiary of Almaden, through the holding company, Puebla Holdings Inc., and is subject to a 2% NSR
in favour of Almadex.
To maintain a claim in good standing in Mexico, the holder is required
to meet annual exploration or exploitation expenditure requirements. Given that the Original Concessions have reverted to application
status, the Company has been advised that currently there are no taxes or expenditure requirements relating to them.
Geological Setting of the Tuligtic Project and Ixtaca Zone
The Ixtaca Project is situated within the Trans Mexican Volcanic Belt (TMVB),
a Tertiary to recent intrusive volcanic arc extending approximately east-west across Mexico from coast to coast and ranging in width from
10 to 300km. The TMVB is the most recent episode of a long lasting magmatic activity which, since the Jurassic, produced a series of partially
overlapping arcs as a result of the eastward subduction of the Farallon plate beneath western Mexico (Ferrari, 2011). The basement rocks
of the eastern half of the TMVB are Precambrian terranes, including biotite orthogneiss and granulite affected by granitic intrusions,
grouped into the Oaxaquia microcontinent (Ferrari et al., 2011; Fuentes-Peralta and Calderon, 2008). These are overlain by the Paleozoic
Mixteco terrane, consisting of a metamorphic sequence known as the Acatlan complex and a fan delta sedimentary sequence known as the Matzitzi
formation. Another sedimentary complex is found on top of the Mixteco terrane, represented by various paleogeographic elements such as
the Mesozoic basins of Tlaxiaco, Zongolica, Zapotitlan, and Tampico-Misantla (Fuentes-Peralta and Calderon, 2008). The subducting plates
associated with the TMVB are relatively young, with the Rivera plate dated at 10Ma (million years) and the Cocos plate at 11 to 17Ma.
.
The stratigraphy of the Tuligtic area can be divided into two main sequences:
a Mesozoic sedimentary rock sequence related to the Zongolica basin and a sequence of late Tertiary igneous extrusive rocks belonging
to the TMVB (Fuentes-Peralta & Calderon, 2008; Tritlla et al., 2004). The sedimentary sequence is locally intruded by plutonic rocks
genetically related to the TMVB. The sedimentary complex at Tuligtic corresponds to the Upper Tamaulipas formation (Reyes-Cortes 1997).
This formation, Late Jurassic to Early Cretaceous in age, is regionally described (Reyes-Cortes, 1997) as a sequence of grey-to-white
limestone, slightly argillaceous, containing bands and nodules of black chert. The drilling conducted by Almaden allows for more detailed
characterisation of the Upper Tamaulipas Formation carbonate units in the Tuligtic area. The sequence on the Project consists of clastic
calcareous rocks. The limestone unit variably bedded, generally light grey but locally dark grey to black, with local chert rich sections
graded into what have been named transition units and shale (also black shale). The transition units are brown calcareous siltstones and
grainstones. These rocks are not significant in the succession but mark the transition from limestone to underlying calcareous shale.
Typical of the transition units are coarser grain sizes. The lower calcareous “shale” units exhibit pronounced laminated bedding
and is typically dark grey to black in colour, although there are green coloured beds as well. The shale units appear to have been subjected
to widespread calc-silicate alteration.
Both the shale and transition units have very limited surface exposure
and may be recessive. The entire carbonate package of rocks has been intensely deformed by the Laramide orogeny, showing complex thrusting
and chevron folding in the hinge zones of a series of thrust-related east verging anticlines in the Ixtaca area (Tritlla et al., 2004;
Coller, 2011). The calcareous shale units appear to occupy the cores of the anticlines while the thick bedded limestone units occupy the
cores of major synclines identified in the Ixtaca zone.
The Tamaulipas Formation carbonate rocks are intruded in the mid-Miocene
by a series of magmatic rocks. The compositions are very variable, consisting of hornblende-biotite-bearing tonalites, quartz-plagioclase-hornblende
diorites, and, locally, aphanitic diabase dykes (Carrasco-Nunez et al., 1997). In the central part of the Tuligtic Property porphyry mineralization
is hosted by and associated with a hornblende-biotite-quartz phyric granodiorite body. The contact between the granodiorite and the limestone
is marked by the development of a prograde skarn.
In the Ixtaca deposit epithermal area of the Project, the limestone basement
units are crosscut by intermediate dykes that are often intensely altered. In the vicinity of the Ixtaca zone these dykes are well mineralized
especially at their contacts with limestone country rock. Petrography has shown that epithermal alteration in the dykes, marked by illite,
adularia, quartz and pyrite overprints earlier calc-silicate endoskarn mineralogies (Leitch, 2011). Two main orientations are identified
for dykes in the Ixtaca area; 060 degrees (parallel to the Main Ixtaca and Ixtaca North zones) and 330 degrees (parallel to the Chemalaco
Zone).
An erosional unconformity surface has been formed subsequent to the intrusion
of the porphyry mineralization-associated granodiorites. This paleo topographical surface locally approximates the current topography.
Although not well exposed the unconformity is marked by depression localised accumulations of basal conglomerate comprised of intrusive
and sedimentary boulders.
Two styles of alteration and mineralization have been identified in the
area: (1) copper-molybdenum porphyry style alteration and mineralization hosted by diorite and quartz-diorite intrusions; (2) silver-gold
low-sulphidation epithermal quartz-bladed calcite veins hosted primarily by carbonate rocks and spatially associated with overlying volcanic
hosted texturally destructive clay alteration and replacement silicification.
Outcropping porphyry-style alteration and mineralization is observed in
the bottoms of several drainages where the altered intrusive complex is exposed in erosional windows beneath post mineral unconsolidated
ash deposits. Multiple late and post mineral intrusive phases have been identified crossing an early intensely altered and quartz-veined
medium-grained feldspar phyric diorite named the Principal Porphyry. Other intrusive types include late and post mineral mafic dykes and
an inter-mineral feldspar-quartz phyric diorite. Late mineral mafic dykes are fine grained and altered to chlorite with accessory pyrite.
Calc-silicate (garnet-clinopyroxene) altered limestone occurs in proximity to the intrusive contacts and is crosscut by late quartz-pyrite
veins. Early biotite alteration of the principal porphyry consists of biotite-orthoclase flooding of the groundmass. Quartz veins associated
with early alteration have irregular boundaries and are interpreted to be representative of A-style porphyry veins. These are followed
by molybdenite veins which are associated with the same wall rock alteration. Chalcopyrite appears late in the early alteration sequence.
Late alteration is characterized by intense zones of muscovite-illite-pyrite overprinting earlier quartz-K-feldspar-pyrite ± chalcopyrite
veining and replacing earlier hydrothermal orthoclase and biotite. Stockwork quartz-pyrite crosscuts the A-style veins and is associated
with muscovite-illite alteration of biotite. The quartz-sericite alteration can be texturally destructive resulting in white friable quartz
veined and pyrite rich rock. Pyrite is observed replacing chalcopyrite and in some instances chalcopyrite remains only as inclusions within
late stage pyrite grains.
Epithermal mineralization on the Tuligtic Property is considered to have
no genetic relationship to the porphyry alteration and mineralization described above. The epithermal system is well preserved and there
is evidence of a paleosurface as steam heated kaolinite and replacement silica alteration occur at higher elevations where the upper part
of the Coyoltepec pyroclastic deposit is preserved.
The Upper Tamaulipas formation carbonates (limestone and shale units),
the dykes that crosscut it and the upper Coyoltepec volcanic subunit (variously referred to as volcanics, tuff or ash) are the host rocks
to the epithermal system at Ixtaca. The epithermal alteration occurs over a roughly 5 by 5 kilometre area and occurs as intense kaolinite-alunite
alteration and silicification in volcanic rocks. This alteration is interpreted to represent the upper portion of a well preserved epithermal
system. The bulk of the mineralisation occurs in the carbonate (limestone and shale) as colloform banded epithermal vein zones. Unlike
many epithermal vein systems in Mexico, the bulk of the veining in the Ixtaca zone has low base metal contents and gold and silver occur
as electrum and other sulphides. SEM work has demonstrated that silver does not occur with galena or tetrahedrite in any significant way.
In the main limestone unit (80% of recoverable metal in the FS) the silver to gold ratio of the mineralisation is roughly estimated to
average ~65:1 while in the shale it is roughly estimated to be slightly higher at ~75:1.
History of Past Work
To the Company’s knowledge, no modern exploration has been conducted
on the Ixtaca Project prior to Almaden’s acquisition of claims during 2001 and there is no record of previous mining; as such, this
is a maiden discovery.
During January 2003, Almaden completed a program of geologic mapping, rock,
stream silt sampling and induced polarization (IP) geophysical surveys at the Tuligtic Property (then known as the “Santa Maria
Prospect”). The exploration identified both a porphyry copper and an epithermal gold target within an approximately 5 x 5km area
of intensely altered rock. At the porphyry copper target, stockwork quartz-pyrite veins associated with minor copper mineralization overprint
earlier potassic alteration within a multi-phase intrusive body. A single north-south oriented IP survey line identified a greater than
2km long elevated chargeability response coincident with the exposed altered and mineralized intrusive system. Volcanic rocks exposed
1km to the south of the mineralized intrusive display replacement silicification and sinter indicative of the upper parts of an epithermal
system (the “Ixtaca Zone”). Quartz-calcite veins returning anomalous values in gold and silver and textural evidence of boiling
have been identified within limestone roughly 100m below the sinter. The sinter and overlying volcanic rocks are anomalous in mercury,
arsenic, and antimony.
Additional IP surveys and soil sampling were conducted in January and February
2005, further defining the porphyry copper target as an area of high chargeability and elevated copper, molybdenum, silver and gold in
soil. A total of eight (8) east-west oriented lines, 3km in length, spaced at intervals of 200m have been completed over mineralized intrusive
rocks intermittently exposed within gullies cutting through the overlying unmineralized ash deposits.
The Tuligtic Property was optioned to Pinnacle Mines Ltd. in 2006 and the
option agreement was terminated in 2007 without completing significant exploration.
The Property was subsequently optioned to Antofagasta Minerals S.A. (Antofagasta)
on March 23, 2009. During 2009 and 2010 Antofagasta, under Almaden operation, carried out IP geophysical surveys and a diamond drill program
targeting the copper porphyry prospect. Three additional IP survey lines were completed, and in conjunction with the previous nine (9)
IP lines, a 2 x 2.5km chargeability high anomaly, open to the west and south, was defined. The 2009 drilling consisted of 2,973m within
seven (7) holes that largely intersected skarn type mineralization.
On February 16, 2010, Almaden announced that Antofagasta terminated its
option to earn an interest in the Property.
In July 2010, Almaden initiated a preliminary diamond drilling program
to test epithermal alteration within the Tuligtic Property, resulting in the discovery of the Ixtaca Zone. The target was based on exploration
data gathered by Almaden since 2001 including high gold and silver in soil and a chargeability and resistivity high anomaly (derived from
an IP geophysical survey conducted by Almaden) topographically beneath Cerro Caolin, a prominent clay and silica altered hill. This alteration,
barren in gold and silver, was interpreted by Almaden to represent the top of an epithermal system which required drill testing to depth.
The first hole, TU-10-001 intersected 302.42 metres of 1.01g/t gold and 48g/t silver and multiple high grade intervals including 44.35
metres of 2.77g/t gold and 117.7g/t silver.
As at December 31, 2022, the net book value of the Ixtaca Project was $63,115,076 (December
31, 2021 - $61,431,639).
Present Condition of Project
Geology and Mineral Resources
The veining of Ixtaca epithermal system displays characteristics representative
of low and intermediate sulphidation deposits. These include typical mill feed and gangue mineralogy (electrum Ag-sulphides, sphalerite,
galena, adularia, quartz and carbonates), mineralization dominantly in open space veins (colloform banding, cavity filling).
At the base of the overlying clay altered volcanics disseminated gold-silver
mineralisation occurs in association with pyrite and minor veining. Locally this mineralisation can be high grade but largely associated
with lower Ag:Au ratios roughly estimated to average 20:1.
To date two main vein orientations have been identified in the Ixtaca deposit:
| · | 060 trending sheeted veins hosted by limestone; |
| · | 330 trending veins hosted by shale; |
The bulk of the resource and over 80% of the mill feed is hosted by the
limestone in the Main Ixtaca and Ixtaca North zones as swarms of sheeted and anastomosing high grade banded epithermal veins. There is
no disseminated mineralisation within the host rock to the vein swarms, which is barren and unaltered limestone. To the northeast of the
limestone hosted mineralisation, the Chemalaco zone, a 330 striking and west dipping vein zone hosted by shale, also forms part of the
deeper resource.
Rock Creek Mill
Almaden entered into an option agreement to acquire the Rock Creek Mill
in October 2015. The Rock Creek Mill is a completed mill that was located outside of Nome, Alaska and which only operated for several
months before its owner suspended its mining operation in 2008. The mill has been kept in excellent condition on care and maintenance.
The Rock Creek Mill was built to process 7,000 tonnes per day. It includes
a three-stage crushing plant, gravity circuit, ball mill, floatation cells and leaching facilities. Also included in the option agreement
are conveyors, metallurgical and chemical fire assay laboratories, a water treatment plant, full electrical circuitry and generators,
and spare parts.
Almaden exercised its right and option under the option agreement and has
purchased the Rock Creek Mill and related assets for a total of US$6,500,000, subject to adjustment under certain circumstances.
In addition to the cash payments, Almaden also issued to the optionor 407,997
Almaden common shares valued at $273,358 upon receipt of regulatory approval, which were issued on November 25, 2016.
During the year ended December 31, 2018, Almaden obtained ownership and
title to the mill equipment, which remains located in Nome, Alaska.
The Rock Creek Mill has been incorporated into the Ixtaca economic studies.
Amended Preliminary Economic Assessment
On January 22, 2016, Almaden’s independent consultants prepared a
Technical Report titled "Preliminary Economic Assessment of the Ixtaca Project”, which provided further detail to its December
9, 2015 press release summarizing the results of integrating the optioned Rock Creek Mill and a smaller, higher grade, payback focused
pit on potential mine economics. An amended technical report was completed on April 13, 2016 (the “Amended PEA”); however
the amendments were not material changes and the Report’s data, inputs, interpretation, conclusions and results all remained unchanged.
This report was prepared in accordance with National Instrument 43-101 – Standards of Disclosure for Mineral Projects (“NI
43-101”). NI 43-101 is a rule developed by the Canadian Securities Administrators that establishes standards for all public disclosure
an issuer makes of scientific and technical information concerning mineral projects. These standards differ from the mining property disclosure
rules specified in Subpart 1300 of Regulation S-K under the United States Securities Act of 1933 (“Subpart 1300”) promulgated
by the SEC.
The Amended PEA followed the historical PEAs released in 2014 and 2015
(“Historical PEAs”) which evaluated larger throughput development alternatives. The primary reasons for providing an update
to the Historical PEAs were to show the impact of significantly reduced initial capital cost on project economics and, given the significant
decrease in precious metals prices, to demonstrate the viability of a mine plan which focused on the near surface high grade limestone
hosted portions of the Ixtaca Zone deposit.
This mine plan was a smaller higher grade scenario than those described
in Almaden’s Historical PEA studies. In addition, the Amended PEA incorporated the optioned Rock Creek mill as well as results from
various engineering studies related to the project which had been conducted since the Historical PEAs were completed. The Amended PEA
incorporated:
| · | The same resource model as the Historical PEAs; |
| · | The Rock Creek Mill, which was optioned by the Company in October 2015, with average throughput of 7,500
tonnes per day; |
| · | A smaller, near surface and payback focussed pit; |
| · | A mine production schedule which targets higher grades earlier; |
| · | Optimised waste placement and tailings management facilities; |
| · | A 2% NSR now held by Almadex. |
Pre-Feasibility Study (“PFS”)
Upon completion of the Amended PEA, Almaden began the work required for
a Pre-Feasibility Study on the Ixtaca Project. During 2016, Almaden completed the necessary geotechnical, geomechanical, and hydrologic
field programs, and also optimized site layout through updated waste placement and facilities locations. A new metallurgical program was
also completed on the limestone domain, which represents approximately 82% of the total gold equivalent ounces produced over the life
of the mine in the PFS. This report was also prepared in accordance with NI 43-101, the standards for which differ from the mining property
disclosure rules specified in Subpart 1300 promulgated by the SEC.
The completed PFS is dated May 17, 2017 and included an updated resource
model. The mine production schedule also included the optioned Rock Creek Mill while targeting higher grades earlier, using smaller, payback
focused starter pits.
Feasibility Study (“Study”)
Upon completion of the PFS, Almaden began the work required for a Feasibility
Study on the Ixtaca Project. The Study and resulting mine plan incorporate significant changes from the PFS including filtered (dry stack)
tailings, ore sorting, increased throughput and an improved mine schedule. Collectively the changes result in a reduced project footprint
and improved economics.
Almaden engaged a team of consultants led by Moose Mountain Technical Services
(“MMTS”) to undertake this Study. As of the date of the Study and of the date hereof, the aforementioned Named Experts or,
as applicable, Designated Professionals, to the best of the Company's knowledge, after reasonable inquiry, beneficially own, directly
or indirectly, less than 1% of the Common Shares of the Company or any of the Company’s associates or affiliates, and none
of them have any registered or beneficial ownership, direct or indirect, of property of the Company or any of the Company’s associates
or affiliates.
The completed Study is dated January 24, 2019, and an update to the FS
is dated October 3, 2019. The Study was prepared in accordance with NI 43-101, the standards for which differ from the mining property
disclosure rules specified in Subpart 1300 promulgated by the SEC. A technical report summary which summarises the Study in a manner intended
to be in accordance with Subpart 1300 of Regulation S-K (the “TRS”) has been filed as an exhibit to this Annual Report. The
TRS is a review and summary of the previous technical work carried out up to the date of the Study. No significant technical work has
been conducted subsequent to this Study and all exploration, legal, permitting and other project updates subsequent to the Study are provided
elsewhere in this 20F. The Study was filed as a Feasibility Study under 43-101 standards. However, since Subpart 1300 standards are different
than 43-101 standards, such as a lower range for cost estimates and contingencies, the Study likely would not meet Subpart 1300 requirements
for a Feasibility-level study.
TRS HIGHLIGHTS
(All values shown in this section discussing the TRS are in $US unless
noted otherwise. Base case uses $1275/oz gold and $17/oz silver prices. Gold and silver equivalency calculations assume 75:1 ratio).
| · | Average annual production of 108,500 ounces gold and 7.06 million ounces silver (203,000
gold equivalent ounces, or 15.2 million silver equivalent ounces) over first 6 years; |
| | · | After-tax internal rate of return (“IRR”) of 42% and after-tax payback period
of 1.9 years; |
| | · | After-tax net present value (“NPV”) of $310 million at a 5% discount rate; |
| | · | Initial Capital of $174 million; |
| | · | Conventional open pit mining with a Proven and Probable Mineral Reserve of 1.39 million
ounces of gold and 85.2 million ounces of silver; |
| | · | Pre-concentration uses ore sorting to produce a total of 48 million tonnes of mill feed
averaging 0.77 g/t gold and 47.9 g/t silver (2.03 g/t gold equivalent over first 6 years, 1.41 g/t gold equivalent over life of mine); |
| · | Average life-of-mine (“LOM”) annual production of 90,800 ounces gold and 6.14
million ounces silver (173,000 gold equivalent ounces, or 12.9 million silver equivalent ounces); |
| | · | Operating cost $716 per gold equivalent ounce, or $9.55 per silver equivalent ounce; |
| | · | All-in Sustaining Costs (“AISC”), including operating costs, sustaining capital,
expansion capital, private and public royalties, refining and transport of $850 per gold equivalent ounce, or $11.30 per silver equivalent
ounce; |
| | · | Elimination of tailings dam by using filtered tailings significantly reduces the project
footprint and water usage |
Capital and Operating Costs
Initial capital cost for the Ixtaca gold-silver project is $174 million
and sustaining capital (including expansion capital) is $111 million over the LOM. The estimated expansion capital of $64.5 million will
be funded from cashflow in Year 4 for the throughput ramp-up in Year 5. Estimated LOM operating costs are $26.8 per tonne mill feed. The
following tables summarize the cost components:
Initial Capital Costs ($ millions)
| Mining |
22.2 |
| Process |
80.2 |
| Onsite Infrastructure |
24.3 |
| Offsite Infrastructure |
7.5 |
| Indirects, EPCM, Contingency and Owner’s Costs |
39.9 |
| Total |
174.2 |
Expansion Capital Costs ($ millions)
| Mining |
$1.2 |
| Process |
$56.9 |
| Infrastructure |
$1.5 |
| Indirects, EPCM, Contingency and Owner’s Costs |
$5.0 |
| Total |
$64.5 |
LOM Average Operating Costs ($)
| Mining costs |
$/tonne milled |
$15.2 |
| Processing |
$/tonne milled |
$10.5 |
| G&A |
$/tonne milled |
$1.1 |
| Total |
$/tonne milled |
$26.8 |
Economic Results and Sensitivities
A summary of financial outcomes comparing base case metal prices to alternative
metal price conditions are presented below. The TRS base case prices are derived from current common peer usage, while the alternate cases
consider the project’s economic outcomes at varying prices witnessed at some point over the three years prior to the Study.
Summary of Ixtaca Economic Sensitivity to Precious Metal Prices (Base Case is Bold)
| Gold Price ($/oz) |
1125 |
1200 |
1275 |
1350 |
1425 |
| Silver Price ($/oz) |
14 |
15.5 |
17 |
18.5 |
20 |
| |
| Pre-Tax NPV 5% ($million) |
229 |
349 |
470 |
591 |
712 |
| Pre-Tax IRR (%) |
35% |
46% |
57% |
67% |
77% |
| Pre-Tax Payback (years) |
2.0 |
1.8 |
1.6 |
1.4 |
1.3 |
| |
| After-Tax NPV 5% ($million) |
151 |
233 |
310 |
388 |
466 |
| After-Tax IRR (%) |
25% |
34% |
42% |
49% |
57% |
| After-Tax Payback (years) |
2.6 |
2.1 |
1.9 |
1.7 |
1.5 |
Mineral Resource Estimate
On January 31, 2013 the Company announced a maiden resource on the Ixtaca
Zone, which was followed by a resource update on January 22, 2014 and another on May 17, 2017. Since that time an additional 104 holes
have been completed, and this data is also included in the Mineral Resource Estimate which is summarised in the table below. The data
available for the resource estimation consisted of 649 drill holes assayed for gold and silver. Wireframes constraining mineralised domains
were constructed based on geologic boundaries defined by mineralisation intensity and host rock type. Higher grade zones occur where there
is a greater density of epithermal veining. These higher grade domains have good continuity and are cohesive in nature.
Of the total drill holes, 558 intersected the mineralised solids and were
used to make the resource estimate. Capping was completed to reduce the effect of outliers within each domain. Uniform down hole 3-meter
composites were produced for each domain and used to produce semivariograms for each variable. Grades were interpolated into blocks 10
x 10 x 6 meters in dimension by ordinary kriging. Specific gravities were determined for each domain from drill core. Estimated blocks
were classified as either Measured, Indicated or Inferred based on drill hole density and grade continuity.
Table showing the Measured, Indicated and Inferred Mineral Resource Statement
(exclusive of Reserves) with the Base Case 0.3 g/t AuEq Cut-Off highlighted. AuEq calculation is based on average prices of $1250/oz gold
and $18/oz silver.
Ixtaca Zone Measured, Indicated and Inferred Mineral Resource Statement (exclusive of Reserves)
| |
AuEq |
Tonnes
> Cut-off |
Grade>Cut-off |
Contained
Metal x1000 |
| |
Cut-off
(g/t) |
('000000) |
Au
(g/t) |
Ag
(g/t) |
AuEq
(g/t) |
Au
(oz) |
Ag
(oz) |
AuEq
(oz) |
| Measured |
0.3 |
11.7 |
0.39 |
16.7 |
0.63 |
148 |
6,317 |
239 |
| Indicated |
0.3 |
40.4 |
0.32 |
16.8 |
0.56 |
412 |
21,870 |
726 |
| Measured
+ Indicated |
0.3 |
52.2 |
0.34 |
16.8 |
0.58 |
560 |
28,187 |
965 |
| Inferred |
0.3 |
40.4 |
0.32 |
16.8 |
0.56 |
412 |
21,870 |
726 |
| 1. | Ixtaca Mineral Resources Estimate have an effective date of 8 July 2018. |
| 2. | Base Case 0.3 g/t AuEq Cut-Off grade is highlighted. AuEq calculation based on average prices of $1250/oz
gold and $18/oz silver. The Base Case cut-off grade includes consideration of the open pit mining method, 90% metallurgical recovery,
mining costs of $1.82/t, average processing costs of $11.7, G&A costs of $1.81/t |
| 3. | Mineral Resources are reported exclusive of those Mineral Resources that have been converted to Mineral
Reserves. Mineral Resources that are not Mineral Reserves do not have demonstrated economic viability. |
| 4. | The estimate of Mineral Resources may be materially affected by environmental, permitting, legal or
other relevant issues. The Mineral Resources have been classified according to the definitions outlined in the SEC Disclosure by Registrants
Engaged in Mining Operations. |
| 5. | All figures were rounded to reflect the relative accuracy of the estimates and may result in summation
differences. |
Mineral Reserve Estimate
Mineral Reserves in the table below have been developed by MMTS with an
effective date of November 30, 2018, The Mineral Reserves are based on an engineered open pit mine plan.
Mineral Reserves
| |
Tonnes |
Diluted Average Grades |
Contained Metal |
| |
(millions) |
Au (g/t) |
Ag (g/t) |
Au - '000 ozs |
Ag - '000 ozs |
| Proven |
31.6 |
0.70 |
43.5 |
714 |
44,273 |
| Probable |
41.4 |
0.51 |
30.7 |
673 |
40,887 |
| TOTAL |
73.1 |
0.59 |
36.3 |
1,387 |
85,159 |
| · | Mineral
Reserves have an effective date of November 30, 2018. The qualified person responsible for
the Mineral Reserves is Jesse Aarsen, P.Eng of Moose Mountain Technical Services. |
| | · | The cut-off grade used for
ore/waste determination is NSR>=$14/t |
| | · | All Mineral Reserves in this
table are Proven and Probable Mineral Reserves. The Mineral Reserves are not in addition
to the Mineral Resources but are a subset thereof. All Mineral Reserves stated above account
for mining loss and dilution. |
| | · | Associated metallurgical
recoveries (gold and silver, respectively) have been estimated as 90% and 90% for limestone,
50% and 90% for volcanic, 50% and 90% for black shale. |
| | · | Reserves
are based on a US$1,300/oz gold price, US$17/oz silver price and an exchange rate of US$1.00:MXP20.00. |
| | · | Reserves are converted from
resources through the process of pit optimization, pit design, production schedule and supported
by a positive cash flow model. |
| | · | Rounding as required by reporting
guidelines may result in summation differences. |
Legal, political, environmental, or other risks that could materially affect
the potential development of the Mineral Reserves are provided in this Form 20-F under the heading “Risk Factors”.0
Mine Plan
The Ixtaca gold-silver project is planned as a typical open pit mining
operation using contractor mining. Initial production will ramp up to a mill feed rate of 7,650 tonnes per day followed by an expansion
to 15,300 tonnes per day from Year 5 onwards.
An ore control system is planned to provide field control for the loading
equipment to selectively mine ore grade material separately from the waste.
Mining operations will be based on 365 operating days per year with three
8 hour shifts per day.
Processing
The TRS reflects the Rock Creek process plant which has been purchased
by Almaden. Run of mine ore will be crushed in a three-stage crushing circuit to -9 mm.
The TRS also incorporates ore sorting, test work for which has shown the
ability to separate barren or low grade limestone host rock encountered within the vein swarm from vein and veined material (see Almaden
news release of July 16th 2018). Product from the secondary crusher will be screened in to coarse (+20mm), mid-size (12 to
20 mm), and fine (-12mm) fractions. Coarse and mid-size ore will be sorted by an XRT ore sort machine to eject waste rock. Fine ore will
bypass the ore sorting and is sent directly to the mill.
Ore sort waste from Limestone and Black Shale is below waste/ore cutoff
grade and is placed in the waste rock dump. Ore sort ‘waste’ from the Volcanic unit is low grade ore and will be stockpiled
for processing later in the mine life. Ore sorting pre-concentration increases the mill feed gold and silver grades by 32% and 31% respectively
compared to run of mine (ROM) grades. The table below shows ROM grades with ore sort waste removed from the ROM, and the resulting mill
feed.
Ore Sort Mill Feed grade improvement
| |
|
ROM |
Ore sort |
Mill |
| |
|
Ore |
Waste |
Feed |
| Limestone |
million tonnes |
51.5 |
18.8 |
32.7 |
| Au g/t |
0.572 |
0.24 |
0.763 |
| Ag g/t |
37.5 |
12.0 |
52.2 |
| Black Shale |
million tonnes |
12.2 |
6.3 |
5.8 |
| Au g/t |
0.517 |
0.25 |
0.806 |
| Ag g/t |
44.4 |
20.0 |
70.8 |
| Volcanic |
million tonnes |
9.4 |
- |
9.4 |
| Au g/t |
0.790 |
- |
0.790 |
| Ag g/t |
18.6 |
- |
18.6 |
| TOTAL |
million tonnes |
73.1 |
25.1 |
48.0 |
| Au g/t |
0.591 |
0.24 |
0.773 |
| Ag g/t |
36.3 |
14.0 |
47.9 |
Crushed ore is transported to the grinding circuit by an over land conveyor.
Grinding to 75 microns is carried out with ball milling in a closed circuit with cyclones. Cyclone underflow is screened and the screen
undersize is treated in semi-batch centrifugal gravity separators to produce a gravity concentrate.
The gravity concentrate will be treated in an intensive leach unit with
gold and silver recovered from electrowinning cells.
The cyclone overflow will be treated in a flotation unit to produce a flotation
concentrate. After regrinding the flotation concentrate leaching will be carried out in 2 stages. CIL leaching for 24 hours will complete
gold extraction, followed by agitated tank leaching to complete silver leaching. A carbon desorption process will recover gold and silver
from the CIL loaded carbon, and a Merrill Crowe process will recover gold and silver from pregnant solution from the agitated leach circuit.
Cyanide destruction on leach residue is carried out using the SO2/Air
process. Final tailings are thickened and filtered then dry stacked and co-disposed with mine waste rock.
Average process recoveries from mill feed to final product over the life
of mine are summarized below for each ore type.
Average Life of Mine Process Recoveries from Mill Feed
| |
Gold |
Silver |
| Limestone |
88.5% |
86.8% |
| Volcanic |
64.4% |
76.3% |
| Black Shale |
54.5% |
84.7% |
Water and Waste Management
One of Almaden’s top priorities at Ixtaca is water quality and a
mine plan that provides a permanent and consistent long-term supply of water for residents. The plan outlined in the TRS has evolved through
the open dialogue between the Company and residents over the past number of years and as part of the Social Investment Plan consultation
(see section below on “Community”).
Rainfall in the Ixtaca vicinity falls primarily during a relatively short
rainy season. With no local water storage facilities, the flash flows of water are currently lost to the communities. Under the TRS, rainwater
will be captured during the rainy season in the water storage reservoir and slowly released during the dry season, for use by both the
mining operation and local residents.
Extensive geochemical studies have evaluated the potential for acid rock
drainage and metal leaching from the waste rock and tailings using globally accepted standardised methods of laboratory testing and in
compliance with Mexican regulations. Most of the waste rock at Ixtaca is limestone, and the studies of both waste rock and tailings have
consistently shown that there is more than enough neutralising potential present in the waste rock to neutralise any acid generated. Testing
to date also indicates low potential for metal leaching. These results along with the excellent access to potential markets in the growing
industrial state of Puebla, indicate the potential for rock waste and tailings from the Ixtaca deposit to be secondary resources such
as aggregate and cement feedstock. These opportunities were examined in 2019 as part of the Company’s commitment to best sustainable
practices.
In consideration of these findings and the hydrologic conditions at Ixtaca,
Almaden and its consultants reviewed Best Available Technology and Best Applicable Practice in the design and planning of tailings management
at Ixtaca, which resulted in selecting a dry-stack tailings facility which would include co-disposal of waste with filtered tailings,
use much less water than traditional slurry facilities, reduce the mine footprint, allow for better dust control, and enable earlier rehabilitation
of the tailings and waste disposal areas.
Community Consultations
Almaden has a long history of engagement with communities in the region
around the Ixtaca Project. Amongst many other initiatives, the Company has trained and employed drillers and driller helpers from the
local area, held ten large-scale community meetings totalling over 4,500 people, taken 500 local adults on tours of operating mines in
Mexico, and held monthly technical meetings on a diverse range of aspects relating to the mining industry and the Ixtaca Project. At the
end of 2021, the Company convened an outdoor end of year gathering in a large open space and is very appreciative of the ongoing support
and optimism from local communities regarding the future of the project and the tremendous value that we can collectively deliver to the
local area through project development.
In 2017, Almaden engaged a third-party consultant to lead a community consultation
and impact assessment at the Ixtaca Project. In Mexico, only the energy industry requires completion of such an assessment (known in Mexico
as a Trámite Evaluación de Impacto Social, or “EVIS”) as part of the permitting process. The purpose of these
studies is to identify the people in the area of influence of a project (“Focus Area”), and assess the potential positive
and negative consequences of project development to assist in the development of mitigation measures and the formation of social investment
plans. To Almaden’s knowledge, this is the first time a formal EVIS has been completed in the minerals industry in Mexico, and as
such reflects the Company’s commitment to best national and international standards in Ixtaca project development.
The EVIS and subsequent work on the development of a Social Investment
Plan were conducted according to Mexican and international standards such as the Guiding Principles on Business and Human Rights, the
Equator Principles, and the OECD Guidelines for Multinational Enterprises and Due Diligence Guidance for Meaningful Stakeholder Engagement
in the Extractive Sector.
Fieldwork for the EVIS was conducted by an interdisciplinary group of nine
anthropologists, ethnologists and sociologists graduated from various universities, who lived in community homes within the Ixtaca Focus
Area during the study to allow for ethnographic immersion and an appreciation for the local customs and way of life. This third-party
consultation sought voluntary participation from broad, diverse population groups, with specific attention to approximately one thousand
persons in the Focus Area.
This extensive consultation resulted in changes to some elements of the
mine design, including the planned construction of a permanent water reservoir to serve the local area long after mine closure, and the
shift to dry-stack filtered waste management.
In March 2020, the Company announced that it has partnered with a local
community group focused on irrigation development, and together with them coordinated with the Federal Government water authority (“CONAGUA”),
to co-fund a new water reservoir in Zacatepec, a community located close to the Ixtaca mine development area. Next steps will involve
adding new pipelines, tanks, and other structures to enhance the irrigation potential in support of local agricultural production.
This reservoir is one of the projects identified which could bring immediate
benefits to the local area even prior to Ixtaca development. The Company looks forward to advancing further elements of the community
Social Investment Plan as mine permitting and construction advance.
The Company has now commenced a HRIA at the Ixtaca project. The HRIA will
be conducted in accordance with best international practice and in observance of the latest developments in international human rights
legislation and precedents. It will seek to predict, identify, characterize, and assess the impacts the project may have on these matters
and will propose strategies which amplify the positive impacts and mitigate or compensate for any negative ones.
Economic Contributions
The TRS anticipates that approximately 600 direct jobs will be created
during the peak of construction, and 420 jobs will be generated during operations. Assuming base case metal prices, under this TRS Ixtaca
is anticipated to generate approximately US$130 million in Federal taxes, US$50 million in State taxes and US$30 million in Municipal
taxes.
Closure and Reclamation
Mine waste areas will be reclaimed and re-vegetated at the end of mining
activity. At closure, all buildings will be removed and remaining facilities, except for the water storage dam (WSD), will be reclaimed
and re-vegetated. The WSD and the availability of this water to the local communities will remain after closure.
Opportunities
Several opportunities excluded from the base case economics have been identified
in the TRS.
| · | Results from the ore sorting tests identified several opportunities to increase the ore sort efficiency
and could result in a further increase in mill feed grades. These opportunities will be investigated with future test work. |
| · | Gold extraction recoveries in the minor black shale unit are currently impeded by the presence of carbonaceous
material. Recent test work including carbon pre-flotation and ultra-fine gravity separation has demonstrated that the carbon can be liberated
and removed with a significant improvement in gold recovery. This test work is ongoing and is expected to improve the black shale gold
recovery. |
| · | Test work carried out on Ixtaca limestone waste rock samples concluded that Ixtaca limestone waste rock
is suitable for many types of concrete use and other applications such as shotcrete, subgrade, asphalt aggregate or railroad ballast with
little effort and processing. Concrete produced with tests on Ixtaca limestone aggregate performed very well, achieving the 28-day design
compressive strength of 30 MPa already at 7 days, and more than 40 MPa at 28 and 56 days. |
| | | |
| | | Ixtaca is connected by 60 km of paved road to the industrial
city Apizaco, 120 km of paved road to the state capital of Puebla, and 170 km of paved road to Mexico City. |
| | | |
| | | The sale of limestone ore sort rejects (a waste product) as an
aggregate presents a very significant potential source of revenue to the Project at no additional capital or operating cost to the Project.
There is also potential to sell some of the waste rock as an aggregate. |
| · | Fine aggregate from crushing and grinding operations is also expected to perform in a similar way to the
coarse aggregate. Chemical analysis of the fine aggregate indicates that it is also suitable as a raw material for the production of lime
cement or Portland cement if properly processed and blended with suitable silica aluminates. |
Next Engineering and Development Steps
In December 2020, the Company announced that it received notification from
the Mexican federal permitting authority, SEMARNAT, that the Company’s initial MIA, a required permit in order to proceed to construction
and operation of the Ixtaca Project, did not receive approval. The Company originally submitted the MIA in early 2019.
The reasons cited by SEMARNAT for not approving the MIA include insufficient
technical information regarding the impacts of the Ixtaca Project on the environment, local and regional area. Although not formally vested
with authority on indigenous matters under a specific local body of law, SEMARNAT also expressed its opinion that indigenous persons are
present in the area affected by the Ixtaca Project and indicated that this needs to be addressed in the context of obligations assumed
by Mexico under ILO Convention 169 regarding the human right to free, prior, informed consultation of indigenous communities.
The Company intends to proceed with the completion of the HRIA during 2023.
Almaden has now substantially completed a revised MIA permit application which incorporates additional data available to the Company as
well as data gathered in further field studies. The Company expects to submit the MIA application once the HRIA document is completed
and if and when the indigenous consultation is finalized. In the normal course, MIA permits may take up to one year for review by SEMARNAT
after submission.
Qualified Persons, Sample Preparation, Analyses, Quality Control and
Assurance
The independent qualified person responsible for the TRS is Jesse Aarsen,
P.Eng., of Moose Mountain Technical Services. A copy of the TRS, and Mr. Aarson’s consent, are included as exhibits to this Annual
Report.
The analyses used in the preparation of the mineral resource statement
were carried out at ALS Chemex Laboratories of North Vancouver (“ALS”) using industry standard analytical techniques. All
strongly altered or epithermal-mineralized intervals of core have been sampled. Almaden employs a maximum sample length of 2 to 3m in
unmineralized lithologies, and a maximum sample length of 1m in mineralized lithologies. During the years 2010 and 2011, Almaden employed
a minimum sample length of 20cm. The minimum sample length was increased to 50cm from 2012 onwards to ensure the availability of sufficient
material for replicate analysis. Drill core is half-sawn using industry standard diamond core saws. After cutting, half the core is placed
in a new plastic sample bag and half is placed back in the core box. Sample numbers are written on the outside of the sample bags and
a numbered tag placed inside the bag. Sample bags are sealed using a plastic cable tie. Sample numbers are checked against the numbers
on the core box and the sample book.
ALS sends its own trucks to the Ixtaca Project to take custody of the samples
at the Santa Maria core facility and transports them to its sample preparation facility in Guadalajara or Zacatecas, Mexico. Prepared
sample pulps are then forwarded by ALS personnel to the ALS North Vancouver, British Columbia laboratory, which is ISO/IEC 17025:2017
and ISO 9001: 2015 certified, for analysis.
For gold, samples are first analysed by fire assay and atomic absorption
spectroscopy (“AAS”). Samples that return values greater than 10 g/t gold using this technique are then re-analysed by fire
assay but with a gravimetric finish. Silver is first analysed by Inductively Coupled Plasma - Atomic Emission Spectroscopy (“ICP-AES”).
Samples that return values greater than 100 g/t silver by ICP-AES are then re analysed by HF-HNO3-HCLO4 digestion with HCL leach and ICP-AES
finish. Of these samples those that return silver values greater than 1,500 g/t are further analysed by fire assay with a gravimetric
finish. Blanks, field duplicates and certified standards were inserted into the sample stream as part of Almaden’s quality assurance
and control program. In addition to the in-house QAQC measures employed by Almaden, Kris Raffle, P.Geo. of APEX Geoscience Ltd., completed
an independent review of blank, field duplicate and certified standard analyses. All QAQC values falling outside the limits of expected
variability were flagged and followed through to ensure completion of appropriate reanalyses. No discrepancies were noted within
the drill hole database, and all QAQC failures were dealt with and handled with appropriate reanalyses.
Current Work
In December 2020, the Company announced that its initial MIA was not approved
by Mexican authorities. The Company substantially completed a revised MIA permit application which incorporates additional data available
to the Company as well as data gathered in further field studies. The Company expects to submit the MIA application once the HRIA document
and the indigenous consultation are finalized. In the normal course, MIA permits may take up to one year for review by SEMARNAT after
submission.
Upcoming / Outlook
Almaden has access to sufficient funding to conduct its anticipated work
program for the next fiscal year at the Ixtaca Project. The Company intends to proceed with the completion of the HRIA during 2023 and
expects to submit the MIA application once the HRIA document is completed and if and when the indigenous consultation is finalized.
PART III
Item 19. Exhibits
A. The financial statements and notes thereto as required under Item 18
are attached hereto and found immediately following the text of this Annual Report.
Audited Financial Statements
Independent registered Public Accounting Firm reports on the consolidated financial statements,
dated March 24, 2023
Consolidated statements of financial position at December 31, 2022 and 2021
Consolidated statements of comprehensive loss for the years ended December 31, 2022, 2021 and
2020
Consolidated statements of changes in equity for the years ended December 31, 2022, 2021 and
2020
Consolidated statements of cash flows for the years ended December 31, 2022, 2021 and 2020
Summary of significant accounting policies and other explanatory information
B. Index to Exhibits
| |
|
| 1. |
Certificate of Amalgamation |
| |
Amalgamation Agreement |
| |
- Incorporated by reference to the Company’s Form Annual Report on Form 20-F for the year ended December 31, 2001, as filed with the Commission on May 17, 2002. |
| |
|
| 1.1 |
Articles |
| |
- Incorporated by reference to the Company’s Form Annual Report on Form 20-F for the year ended December 31, 2005, as filed with the Commission on March 30, 2006. |
| |
|
| 2. |
Instruments defining the rights of holders of equity or debt securities being registered |
| |
- Refer to Exhibit No. 1. |
| |
|
| 3. |
Voting trust agreements. The Voting Trust Agreement dated December 17, 2009 between Ernesto Echavarria, as grantor, and Messrs Duane and Morgan Poliquin, as voting trustees.
- Incorporated by reference to the Company’s Form 20-F for the year ended December 31,
2013 and filed with the Commission on March 31, 2014. |
| |
|
| 4.1 |
Arrangement Agreement dated May 11, 2015 in connection with the Company’s statutory Plan of Arrangement with Almadex and filed with the Commission on March 31, 2016. |
| |
|
| 4.2 |
Administrative Services Agreement between the Company and Almadex Minerals Limited dated May 15, 2015 and filed with the Commission on March 31, 2016. |
| |
|
| 4.3 |
First Amending Agreement to the May 15, 2015 Administrative Services Agreement between the Company and Almadex Minerals Limited dated December 16, 2015 and filed with the Commission on March 31, 2016. |
| |
|
| 4.4 |
Executive Employment Contract between the Company and Duane Poliquin dated effective January 1, 2016 and filed with the Commission on March 31, 2016. |
| |
|
| 4.5 |
Amending Agreement dated April 1, 2016 to the Executive Compensation Contract with Morgan Poliquin dated January 29, 2013 and filed with the Commission on March 30, 2017. |
| |
|
| 4.6 |
Amending Agreement dated April 1, 2016 to the Executive Employment Contract with Duane Poliquin dated January 1, 2016 and filed with the Commission on March 30, 2017. |
| |
|
| 4.7 |
Amending agreement to the Executive Compensation Contract with Morgan Poliquin dated January 1, 2019 and filed with the Commission on March 15, 2019. |
| 4.8 |
Amending agreement to the Executive Compensation Contract with Duane Poliquin dated January 1, 2019 and filed with the Commission on March 15, 2019. |
| |
|
| 4.9 |
Administrative Services Agreement between the Company and Almadex Minerals Ltd. (formerly 1154229 B.C. Ltd.) dated March 29, 2018 and filed with the Commission on March 15, 2019. |
| |
|
| 4.10 |
Gold Loan Agreement between the Company and Almadex Minerals Ltd. dated effective May 14th, 2019 and filed with the commission on March 27, 2020. |
| |
|
| 4.11 |
Short Form Base Shelf Prospectus and filed with the commission on February 25, 2021 |
| |
|
| 4.12 |
Form of Placement Agency Agreement dated March 16, 2021
- Incorporated by reference to the Form 6-K and filed with the Commission on March 16, 2021 |
| |
|
| 4.13 |
Form of Securities Purchase Agreement
- Incorporated by reference to the Form 6-K and filed with the Commission on March 16, 2021 |
| |
|
| 4.14** |
Salary Deferral and Amendment Agreement and filed with the Commission on April 27, 2023 |
| |
|
| 5. |
List of foreign patents – N/A |
| |
|
| 6. |
Calculation of earnings per share – N/A |
| |
|
| 7. |
Explanation of calculation of ratios – N/A |
| |
|
| 8.** |
List of subsidiaries and filed with the Commission on April 27, 2023 |
| |
|
| 9. |
Statement pursuant to the instruction to Item 8.A.4, regarding the financial statement filed in registration |
| |
Statements for initial public offerings of securities – N/A |
| |
|
| 10. |
Any notice required by Rule 104 of Regulation BTR – N/A |
| |
|
| 11 |
Audit Committee Charter |
| |
|
| 11.1 |
Nominating and Corporate Governance Committee-Duties and Responsibility |
| |
|
| 11.2 |
Compensation Committee-Responsibilities and Duties |
| |
|
| 11.3 |
Code of Business Ethics |
| |
|
| 11.4 |
Code of Business Conduct and Ethics for Directors |
| |
|
| 11.5 |
Communications Policy |
| |
|
| 11.6 |
Securities Trading Policy |
| |
|
| 11.7 |
Whistleblower Policy |
| |
|
| 11.8 |
Privacy Policy |
| |
- Incorporated by reference to the Company’s Annual Report on Form 20-F for the year ended December 31, 2005, as filed with the Commission on March 30, 2006. |
| |
|
| 11.9 |
Shareholder Rights Plan dated April 13, 2011, as amended and reconfirmed at the 2017 Annual General Meeting and as reconfirmed at the 2020 Annual General Meeting.
- Incorporated by reference to the Form 6-K filed with the Commission on April 15, 2011. |
| |
|
| 11.10 |
Amended Advance Notice Policy dated January 28, 2013, as amended May 1, 2015 as filed with the Commission on March 29, 2018. |
| |
|
| 11.11 |
Amended Majority Voting Policy – adopted by the Board of Directors on May 7, 2013, as amended effective May 15, 2017 as filed with the Commission on March 29, 2018. |
| |
|
| 12.1 * |
Certification of CEO Pursuant to Securities Exchange Act, Rules 13a-14 and 15d-14 as Adopted Pursuant to Section 302 of the Sarbanes-Oxley Act of 2002 |
| |
|
| 12.2 * |
Certification of CFO Pursuant to Securities Exchange Act, Rules 13a-14 and 15d-14 as Adopted Pursuant to Section 302 of the Sarbanes-Oxley Act of 2002 |
| |
|
| 13.1 * |
Certification of CEO Pursuant to the Sarbanes-Oxley Act, 18 U.S.C. Section 1350, As Adopted Pursuant to Section 906 of the Sarbanes-Oxley Act of 2002 |
| |
|
| 13.2 * |
Certification of CFO Pursuant to the Sarbanes-Oxley Act, 18 U.S.C. Section 1350, As Adopted Pursuant to Section 906 of the Sarbanes-Oxley Act of 2002 |
| |
|
| 14.1 * |
Consent of Jesse Aarsen |
| |
|
| 14.2 * |
Amended S-K 1300 Technical Report Summary of the Ixtaca Gold-Silver Project |
| |
|
| 101.INS** |
Inline XBRL Instance Document |
| 101.SCH** |
Inline XBRL Taxonomy Extension Schema Documents |
| 101.CAL** |
Inline XBRL Taxonomy Extension Calculation Linkbase Document |
| 101.DEF** |
Inline XBRL Taxonomy Extension Definition Linkbase Document |
| 101.LAB** |
Inline XBRL Taxonomy Extension Label Linkbase Document |
| 101.PRE** |
Inline XBRL Taxonomy Extension Presentation Linkbase Document |
| 104** |
Cover Page Interactive Data File (embedded within Inline XBRL document) |
| ** | Previously filed with the Commission on April 27, 2023. |
SIGNATURE
The Registrant hereby certifies that it meets all of the requirements for filing this Amendment
No.1 to the Annual Report on Form 20-F/A and that it has duly caused and authorized the undersigned to sign this Amendment No. 1 on its
behalf.
Almaden Minerals Ltd.
Registrant
| Dated: September 27, 2023 |
By /s/Morgan Poliquin |
| |
Morgan Poliquin, CEO |
21
EXHIBIT 12.1
SECTION 302 OF THE SARBANES-OXLEY ACT
CEO CERTIFICATION
I, Morgan Poliquin, certify that:
1. I have reviewed this Amendment No. 1 to the annual report on Form 20-F/A of Almaden Minerals Ltd.;
2. Based on my knowledge, this report does not contain any untrue statement of a material fact or omit to state a material fact necessary
to make the statements made, in light of the circumstances under which such statements were made, not misleading with respect to the period
covered by this report;
3. Based on my knowledge, the financial statements, and other financial information included in this report, fairly present in all material
respects the financial condition, results of operations and cash flows of the Company as of, and for, the periods presented in this report;
4. The Company’s other certifying officer and I are responsible for establishing and maintaining disclosure controls and procedures
(as defined in Exchange Act Rules 13a-15(e) and 15d-15(e)) and internal control over financial reporting (as defined in Exchange Act Rules
13a-15(f) and 15d-15(f)) for the Company and have:
(a)
Designed such disclosure controls and procedures, or caused such disclosure controls and procedures to be designed under our supervision,
to ensure that material information relating to the Company, including its consolidated subsidiaries, is made known to us by others within
those entities, particularly during the period in which this report is being prepared;
(b)
Designed
such internal control over financial reporting, or caused such internal control over financial reporting to be designed under our supervision,
to provide reasonable assurance regarding the reliability of financial reporting and the preparation of financial statements for external
purposes in accordance with generally accepted accounting principles;
(c)
Evaluated the effectiveness of the Company’s disclosure controls and procedures and presented in this report our conclusions about
the effectiveness of the disclosure controls and procedures, as of the end of the period covered by this report based on such evaluation;
and
(d)
Disclosed in this report any change in the Company’s internal control over financial reporting that occurred during the period covered
by the annual report that has materially affected, or is reasonably likely to materially affect, the Company’s internal control
over financial reporting; and
5. The Company’s other certifying officer and I have disclosed, based on our most recent evaluation of internal control over financial
reporting, to the Company’s auditors and the audit committee of the Company’s board of directors (or persons performing the
equivalent functions):
(a)
All significant deficiencies and material weaknesses in the design or operation of internal control over financial reporting which are
reasonably likely to adversely affect the Company’s ability to record, process, summarize and report financial information; and
(b)
Any fraud, whether or not material, that involves management or other employees who have a significant role in the Company’s internal
control over financial reporting.
| Date: September 27, 2023 |
/s/Morgan Poliquin |
| |
Morgan Poliquin |
| |
Chief Executive Officer |
EXHIBIT 12.2
SECTION 302 OF THE SARBANES-OXLEY ACT
CFO CERTIFICATION
I, Korm Trieu, certify that:
1. I have reviewed this Amendment No.1 to the annual report on Form 20-F/A of Almaden Minerals Ltd.;
2.
Based on my knowledge, this report does not contain any untrue statement of a material fact or omit to state a material fact necessary
to make the statements made, in light of the circumstances under which such statements were made, not misleading with respect to the period
covered by this report;
3. Based on my knowledge, the financial statements, and other financial information included in this report, fairly present in all material
respects the financial condition, results of operations and cash flows of the Company as of, and for, the periods presented in this report;
4. The Company’s other certifying officer and I are responsible for establishing and maintaining disclosure controls and procedures
(as defined in Exchange Act Rules 13a-15(e) and 15d-15(e)) and internal control over financial reporting (as defined in Exchange Act Rules
13a-15(f) and 15d-15(f)) for the Company and have:
(a)
Designed such disclosure controls and procedures, or caused such disclosure controls and procedures to be designed under our supervision,
to ensure that material information relating to the Company, including its consolidated subsidiaries, is made known to us by others within
those entities, particularly during the period in which this report is being prepared;
(b)
Designed
such internal control over financial reporting, or caused such internal control over financial reporting to be designed under our supervision,
to provide reasonable assurance regarding the reliability of financial reporting and the preparation of financial statements for external
purposes in accordance with generally accepted accounting principles;
(c)
Evaluated the effectiveness of the Company’s disclosure controls and procedures and presented in this report our conclusions about
the effectiveness of the disclosure controls and procedures, as of the end of the period covered by this report based on such evaluation;
and
(d)
Disclosed in this report any change in the Company’s internal control over financial reporting that occurred during the period covered
by the annual report that has materially affected, or is reasonably likely to materially affect, the Company’s internal control
over financial reporting; and
5. The Company’s other certifying officer and I have disclosed, based on our most recent evaluation of internal control over financial
reporting, to the Company’s auditors and the audit committee of the Company’s board of directors (or persons performing the
equivalent functions):
(a)
All significant deficiencies and material weaknesses in the design or operation of internal control over financial reporting which are
reasonably likely to adversely affect the Company’s ability to record, process, summarize and report financial information; and
(b)
Any fraud, whether or not material, that involves management or other employees who have a significant role in the Company’s internal
control over financial reporting.
| Dated: September 27, 2023 |
/s/Korm Trieu |
| |
Korm Trieu |
| |
Chief Financial Officer |
EXHIBIT 13.1
SECTION 906 OF THE SARBANES-OXLEY ACT
CEO CERTIFICATION
In connection with this Amendment No.1 to the annual report of Almaden
Minerals Ltd. (the “Company”) on Form 20-F/A for the fiscal year ending December 31, 2022 as filed with the Securities and
Exchange Commission on the date hereof (the “Report”), I, Morgan Poliquin, Chief Executive Officer of the Company, certify,
pursuant to 18 U.S.C. Section 1350, as adopted pursuant to Section 906 of the Sarbanes-Oxley Act of 2002, that to my knowledge:
| | 1. | The Report fully complies with the requirements of Section 13(a) or 15(d) of the Securities Exchange Act of 1934, as amended; and |
| | | |
| 2. | The information contained in the Report fairly presents, in all material respects, the financial condition
and results of operations of the Company. |
/s/”Morgan Poliquin”
Name: Morgan Poliquin
Title: Chief Executive Officer
September 27, 2023
EXHIBIT 13.2
SECTION 906 OF THE SARBANES-OXLEY ACT
CFO CERTIFICATION
In connection with this Amendment No. 1 to the annual report of Almaden
Minerals Ltd. (the “Company”) on Form 20-F/A for the fiscal year ending December 31, 2022 as filed with the Securities and
Exchange Commission on the date hereof (the “Report”), I, Korm Trieu, Chief Financial Officer of the Company, certify, pursuant
to 18 U.S.C. Section 1350, as adopted pursuant to Section 906 of the Sarbanes-Oxley Act of 2002, that to my knowledge:
| | 1. | The Report fully complies with the requirements of Section 13(a) or 15(d) of the Securities Exchange Act of 1934, as amended; and |
| | | |
| 2. | The information contained in the Report fairly presents, in all material respects, the financial condition
and results of operations of the Company. |
/s/”Korm Trieu”
Name: Korm Trieu
Title: Chief Financial Officer
September 27, 2023
EXHIBIT 14.1
Jesse J. Aarsen
Moose Mountain Technical Services
#210 1510 – 2nd Street North
Cranbrook, British Columbia, Canada V1C 3L2
CONSENT OF QUALIFIED PERSON
I, Jesse Aarsen, in connection with the Amendment No. 1 to the Annual Report
on Form 20-F/A of Almaden Minerals Ltd. for the year ended December 31, 2022 (the “20-F/A”):
| |
(a) |
Consent to the public filing of the Amended Technical Report Summary entitled “Ixtaca Gold-Silver Project, Puebla State, Mexico” dated September 27, 2023, that was prepared in accordance with Subpart 1300 of Regulation S-K promulgated by the U.S. Securities and Exchange Commission as an exhibit to the 20-F/A; |
| |
(b) |
Consent to the use of my name and my status as the “Qualified Person”, or any information, reference, quotation or summarization from the Amended Technical Report Summary for which I am responsible in the 20-F/A; and |
| |
(c) |
Confirm that I have read the portions of the 20-F/A relating to the Amended Technical Report Summary, and that such portions of the 20-F/A fairly and accurately reflect such information. |
Dated at Vancouver, BC, this 27th day of September, 2023
“Jesse J. Aarsen”
Jesse J. Aarsen, P.Eng
Moose Mountain Technical Services
Exhibit 14.2
Ixtaca Gold - Silver Project Puebla State, Mexico S - K 1300 Technical Report Summary Submitted to: Almaden Minerals Ltd. Effective Date: 24 January 2019 Report Date: 28 April 2022 Amended Date: 27 September 2023 Report Authors: Jesse Aarsen, P.Eng. Company: Moose Mountain Technical Services EGBC Permit to Practice #1003309
Ixtaca - S - K 1300 Technical Report Summary TABLE OF CONTENTS 1. Summary ................................................................................................................... 15 2. Introduction................................................................................................................. ... ........... 15 3. Property Description and Location............................................................................................ 16 4. Accessibility, Climate, Local Resources, Infrastructure, Physiography...................................... 16 5. History ............................................................................................................................. ... ....... 16 6. Geological Setting and Mineralization ...................................................................................... 17 7. Exploration.................................................................................................................. ... ............ 18 8. Drilling..................................................................................................................... ... ................ 18 9. Sample Preparation, Analyses and Security .............................................................................. 19 10. Data Verification................................................................................................................. ... .... 20 11. Metallurgy ............................................................................................................................. ... . 20 12. Resource Estimate ..................................................................................................................... 21 13. Geomechanical .......................................................................................................................... 23 Page 2 1.12.1 1.12.2 Ash Tuff and Upper Volcanics ........................................................................................... 23 Rock Units (Limestone, Shale, Dikes)................................................................................ 24 13. Proposed Development Plan ..................................................................................................... 24 14. Production and Processing ........................................................................................................ 27 15. Tailings Co - disposal and Water Management........................................................................... 28 1.15.1 1.15.2 West T/RSF........................................................................................................................ 28 Water Management ......................................................................................................... 28 1.16 1.17 1.18 1.19 1.20 2.0 3.0 4.0 5.0 6.0 6.1 6.2 6.3 Capital and Operating Costs ...................................................................................................... 29 Economic Analysis ..................................................................................................................... 29 Environmental and Social Considerations ................................................................................. 31 Project Execution Plan ............................................................................................................... 33 Conclusions and Recommendations.......................................................................................... 34 Introduction .............................................................................................................. 35 Property Description and Location ............................................................................. 35 Accessibility, Climate, Local Resources, Infrastructure and Physiography ................... 40 History ....................................................................................................................... 41 Geological Setting and Mineralization ........................................................................ 43 Regional Geology ....................................................................................................................... 43 Property Geology...................................................................................................................... . 45 Mineralization............................................................................................................... ... .......... 50 6.3.1 Steam Heated Alteration, Replacement Silicification and Other Surficial Geothermal Manifestations at Ixtaca..................................................................................................................... 55 4. Deposit Types ............................................................................................................................ 59 1. Epithermal Gold - Silver Deposits ........................................................................................... 59 2. The Ixtaca Zone Epithermal System ...................................................................................... 62 3. Porphyry Copper - Gold - Molybdenum and Lead - Zinc Skarn Deposits ................................... 64 1. Exploration ................................................................................................................ 65 2. Surface Exploration Work.......................................................................................................... 65 1. Rock Geochemistry ............................................................................................................... 65 2. Soil and Stream Sediment Geochemistry.............................................................................. 66
Ixtaca - S - K 1300 Technical Report Summary 3. Ground Geophysics ............................................................................................................... 69 4. Exploration Potential............................................................................................................. 71 2. Drilling..................................................................................................................... ... ................ 77 1. Main Ixtaca and Ixtaca North Zones...................................................................................... 81 2. Chemalaco Zone.................................................................................................................... 88 3. Hydrogeology................................................................................................................. ... ......... 94 1. Meteorology.................................................................................................................. ... ..... 94 2. Surface Hydrology ................................................................................................................. 95 3. Surface Water Quality ........................................................................................................... 96 4. Groundwater ......................................................................................................................... 99 5. Groundwater Quality .......................................................................................................... 103 4. Geomechanical ........................................................................................................................ 105 1. Ash Tuff and Upper Volcanics ............................................................................................. 105 2. Rock Units (Limestone, Shale, Dikes) .................................................................................. 105 1. Sample Preparation, Analyses and Security ............................................................. 107 2. Sample Preparation and Analyses ........................................................................................... 107 1. Rock Grab and Soil Geochemical Samples .......................................................................... 107 2. Almaden Drill Core .............................................................................................................. 108 3. Independent Consultant’s Drill Core................................................................................... 109 3. Quality Assurance / Quality Control Procedures..................................................................... 110 1. Analytical Standards............................................................................................................ 110 2. Blanks ............................................................................................................................. ... .. 117 3. Duplicates................................................................................................................... ... ...... 118 4. Data Verification ..................................................................................................... 120 5. Independent Audit of Almaden Drillhole Database ................................................................ 120 1. Collar Coordinate and Downhole Survey Databases .......................................................... 120 2. Drill Core Assay Database.................................................................................................... 121 6. Site Visit ............................................................................................................................. ... ... 122 Page 3 10.0 10.1 10.2 10.3 10.4 Mineral Processing and Metallurgical Testing .......................................................... 123 Introduction................................................................................................................. ... ......... 123 Metallurgical Test Work History.............................................................................................. 123 Samples...................................................................................................................... ... ........... 126 Mineralogy................................................................................................................... ... ......... 129 10.4.1 10.4.2 10.4.3 Limestone.................................................................................................................... ... . 129 Volcanic..................................................................................................................... ... ... 130 Black Shale ...................................................................................................................... 132 10.5 Diagnostic Leaching ................................................................................................................. 135 10.5.1 10.5.2 10.5.3 Limestone.................................................................................................................... ... . 136 Volcanic..................................................................................................................... ... ... 136 Black Shale ...................................................................................................................... 136 10.6 Comminution Test Work ......................................................................................................... 137 10.6.1 10.6.2 10.6.3 Limestone.................................................................................................................... ... . 138 Volcanic..................................................................................................................... ... ... 138 Black Shale ...................................................................................................................... 138 7. Ore Sorting...................................................................................................................... ... ...... 138 1. How it works ................................................................................................................... 139
Ixtaca - S - K 1300 Technical Report Summary 10.7.2 10.7.3 10.7.4 10.7.5 Page 4 Limestone Ore Sort Amenability Tests ........................................................................... 140 Limestone Ore Sort Performance Tests ......................................................................... 141 Black Shale Ore Sort Performance Tests......................................................................... 144 Volcanic Ore Sort Performance Tests ............................................................................. 146 10.8 10.9 Whole Ore Leaching ................................................................................................................ 148 Gravity Concentration ............................................................................................................. 148 1. Limestone.................................................................................................................... ... . 148 2. Volcanic..................................................................................................................... ... ... 152 3. Black Shale ...................................................................................................................... 154 10. Flotation of Gravity Tails ..................................................................................................... 157 1. Flotation Optimization (2016)......................................................................................... 157 2. Flotation Variability Test Work (2018)............................................................................ 158 11. Leaching of gravity concentrate.......................................................................................... 161 12. Leaching of flotation concentrate ....................................................................................... 162 1. Limestone.................................................................................................................... ... . 162 2. Volcanic..................................................................................................................... ... ... 167 3. Black Shale ...................................................................................................................... 168 13. Leach Residue Detox ........................................................................................................... 173 14. Carbon Adsorption and Merrill - Crowe................................................................................ 173 15. Settling tests and Filtration ................................................................................................. 174 16. Recommended Flowsheet................................................................................................... 176 17. Metallurgical Performance Projections .............................................................................. 176 18. Aggregate test work on Ixtaca Limestone Waste Rock....................................................... 177 19. Qualified Person’s Opinion.................................................................................................. 179 1. Mineral Resource Estimates..................................................................................... 180 2. Data Analysis ........................................................................................................................... 180 3. Composites ............................................................................................................................. . 185 4. Variography ............................................................................................................................. 186 5. Block Model ............................................................................................................................. 189 6. Bulk Density ............................................................................................................................. 189 7. Grade Interpolation ................................................................................................................. 191 8. Classification ............................................................................................................................ 193 9. Block Model Verification .............................................................................................................. 196 11.9 12.0 12.1 12.2 12.3 12.4 13.0 13.1 13.2 Qualified Person’s Opinion ...................................................................................................... 200 Mineral Reserve Estimates ...................................................................................... 201 Cut - Off Grade .......................................................................................................................... 201 Loss and Dilution ..................................................................................................................... 202 Mineral Reserves ..................................................................................................................... 202 Qualified Person’s Opinion ...................................................................................................... 203 Mining Method........................................................................................................ 203 Introduction................................................................................................................. ... ......... 203 Mining Study Basis................................................................................................................... 204 13.2.1 13.2.2 13.2.3 13.2.4 Mine Planning Datum ..................................................................................................... 204 Resource Classes ............................................................................................................. 204 Metallurgical Recovery for Mine Planning ...................................................................... 204 Cut - off Grade .................................................................................................................. 204
Ixtaca - S - K 1300 Technical Report Summary 13.2.5 Mining Dilution and Loss................................................................................................. 204 13.3 Economic Pit Limits.................................................................................................................. 205 Page 5 13.3.1 13.3.2 13.3.3 LG Cost Inputs ................................................................................................................. 205 LG Slope Inputs ............................................................................................................... 205 LG Sensitivity Cases......................................................................................................... 206 13.4 Detailed Pit Designs ................................................................................................................. 209 13.4.1 13.4.2 13.4.3 13.4.4 Pit Phase Selection.......................................................................................................... 209 Pit Design Slope Inputs and Bench Configuration .......................................................... 209 Haul Road Design Parameters ........................................................................................ 210 Pit Design Results............................................................................................................ 210 13.5 Rock Storage Facilities ............................................................................................................. 214 13.5.1 13.5.2 RSF Design Inputs............................................................................................................ 214 South RSF Surface Water Management ......................................................................... 215 13.6 13.7 13.8 Mine Haul Road Designs.......................................................................................................... 218 Ore Stockpiles .......................................................................................................................... 219 Mine Production Schedule ...................................................................................................... 219 13.8.1 13.8.2 End of Period Maps......................................................................................................... 222 Pre - Production Mine Operations (Year - 1) ..................................................................... 222 13.9 Mine Operations................................................................................................................... ... 226 13.9.1 13.9.2 13.9.3 Direct Mining Unit Operations (Contractor) ................................................................... 227 GME and Technical (Owner) ........................................................................................... 230 Mine Operations Organizational Chart........................................................................... 231 1. Processing and Recovery Methods........................................................................... 232 2. Process Flowsheet ................................................................................................................... 232 3. Acquisition of the Rock Creek Processing Plant ...................................................................... 234 4. Process Design Criteria ............................................................................................................ 234 5. Process Description ................................................................................................................. 236 14.4.1 14.4.2 14.4.3 14.4.4 General...................................................................................................................... ... ... 236 Crushing and Ore Sorting................................................................................................ 236 Fine Ore Stockpile ........................................................................................................... 237 Processing Plant .............................................................................................................. 237 5. Reagents and Power Consumption ......................................................................................... 244 6. Process Water and Power ....................................................................................................... 245 7. Process Personnel.................................................................................................................... 246 1. Infrastructure .......................................................................................................... 247 2. Site Access ............................................................................................................................. .. 247 3. Power........................................................................................................................ ... ............ 247 4. Fuel ............................................................................................................................. ... .......... 247 5. Water Supply ........................................................................................................................... 249 6. Mine Maintenance Facility ...................................................................................................... 252 7. Tailings Management .............................................................................................................. 252 15.6.1 15.6.2 15.6.3 15.6.4 Tailings Storage Alternatives .......................................................................................... 253 Design Criteria Summary ................................................................................................ 253 Tailings and Rock Storage Design ................................................................................... 256 West Tailings and Rock Storage Facility Closure............................................................. 260 15.7 Site Wide Water Management................................................................................................ 261
Ixtaca - S - K 1300 Technical Report Summary 1. Market Studies ........................................................................................................ 262 2. Market Studies ........................................................................................................................ 262 3. Commodity Price Projections .................................................................................................. 262 4. Comments on Section 16......................................................................................................... 262 5. Environmental Studies, Permitting, and Plans, Negotiations, or Agreements with local individuals or groups............................................................................................................ 263 6. Environmental Studies............................................................................................................. 263 Page 6 17.1.1 17.1.2 17.1.3 17.1.4 17.1.5 17.1.6 17.1.7 Meteorology ................................................................................................................... 263 Surface Hydrology........................................................................................................... 264 Surface Water Quality..................................................................................................... 264 Groundwater.................................................................................................................. . 267 Groundwater Quality ...................................................................................................... 271 Geochemistry................................................................................................................. . 273 Flora and Fauna .............................................................................................................. 274 17.2 17.3 Permitting ............................................................................................................................. ... 276 Social and Community Engagement........................................................................................ 277 17.3.1 17.3.2 17.3.3 17.3.4 Local Communities.......................................................................................................... 277 Community Engagement ................................................................................................ 277 Land Acquisition.............................................................................................................. 279 Potential Social or Community Requirements and/or Plans .......................................... 279 17.4 Mine Closure...................................................................................................................... ... ... 279 17.4.1 17.4.2 17.4.3 17.4.4 17.4.5 17.4.6 17.4.7 17.4.8 17.4.9 Open Pit .......................................................................................................................... 279 West Tailings and Rock Storage Facility.......................................................................... 279 South Rock Storage Facility............................................................................................. 280 Water Dams .................................................................................................................... 280 Buildings.................................................................................................................... ... ... 280 Roads........................................................................................................................ ... .... 280 Diversions................................................................................................................... ... .. 280 Wells ............................................................................................................................. .. 281 Monitoring ...................................................................................................................... 281 17.5 18.0 18.1 18.2 Qualified Person’s Opinion ...................................................................................................... 281 Capital and Operating Costs..................................................................................... 282 Introduction................................................................................................................. ... ......... 282 Capital Costs ............................................................................................................................ 282 18.2.1 Basis of Estimate ............................................................................................................. 283 18.3 Operating Cost Estimate.......................................................................................................... 289 18.3.1 18.3.2 18.3.3 18.3.4 Operating Cost Summary................................................................................................ 289 Mining ............................................................................................................................. 290 Processing ....................................................................................................................... 291 General & Administration (G&A) .................................................................................... 292 18.4 Closure Cost Estimate.............................................................................................................. 292 1. Economic Analysis ................................................................................................... 293 2. Cautionary Statement ............................................................................................................. 293 3. Assumptions ............................................................................................................................ 293 4. Taxes and Mining Duties ......................................................................................................... 294 5. Analysis ............................................................................................................................. ... .... 294
Ixtaca - S - K 1300 Technical Report Summary 19.5 Economic Results and Sensitivities.......................................................................................... 297 1. Adjacent Properties ................................................................................................. 298 2. Cuyoaco Property .................................................................................................................... 298 3. Minera Frisco S.A. de C.V. Espejeras ....................................................................................... 298 4. Other Relevant Data and Information...................................................................... 299 5. Preliminary Development Schedule ........................................................................................ 299 6. Interpretation and Conclusions................................................................................ 300 7. Introduction................................................................................................................. ... ......... 300 8. Mineral Tenure, Surface Rights ............................................................................................... 300 9. Geology and Mineralization .................................................................................................... 300 10. Exploration, Drilling and Analytical Data Collection in Support of Mineral Resource Estimation 300 11. Metallurgical Testwork ............................................................................................................ 301 12. Mineral Resource Estimates .................................................................................................... 301 13. Mineral Reserves ..................................................................................................................... 302 14. Mine Plan......................................................................................................................... ... ..... 302 15. Geomechanical ........................................................................................................................ 302 Page 7 22.10 22.11 22.12 22.13 Tailings, Rock, and Water Management ............................................................................. 303 Environmental, Permitting and Social Considerations........................................................ 305 Capital and Operating Cost Estimates................................................................................. 305 Economic Analysis ............................................................................................................... 305 23.0 23.1 23.2 23.3 Recommendations................................................................................................... 306 Geology and Exploration ......................................................................................................... 306 Tailings, Rock, and Water Management Recommendations .................................................. 306 Mining Recommendations ...................................................................................................... 307 23.3.1 23.3.2 23.3.3 Open Pit Mining .............................................................................................................. 307 Underground Mining Potential....................................................................................... 307 Geomechanical recommendations ................................................................................. 308 23.4 23.5 23.6 23.7 23.8 23.9 23.10 Metallurgy and Process Recommendations ............................................................................ 309 Environmental Recommendations .......................................................................................... 309 Infrastructure Recommendations ........................................................................................... 309 Aggregate Potential ................................................................................................................. 309 Cement Potential.................................................................................................................... . 309 Risk Assessment................................................................................................................... ... . 310 Budget ............................................................................................................................. ... . 310 24.0 25.0 References............................................................................................................... 311 Reliance on information provided by the registrant ................................................. 313 APPENDIX A - LIST OF DRILL HOLES .................................................................................. 314
Ixtaca - S - K 1300 Technical Report Summary LIST OF TABLES Table 1 - 1 Ixtaca Zone Measured, Indicated and Inferred Mineral Resource Statement (inclusive of Mineral Reserves).................................................................................................................... ... ........ 22 Table 1 - 2 Ixtaca Zone Measured, Indicated and Inferred Mineral Resource Statement (exclusive of Mineral Reserves).................................................................................................................... ... ........ 23 Page 8 Table 1 - 3 Table 1 - 4 Table 1 - 5 Table 1 - 6 Table 1 - 7 Table 1 - 8 Table 1 - 9 Table 1 - 10 Table 1 - 11 Table 1 - 12 Table 1 - 13 Table 2 - 1 Table 3 - 1 Table 3 - 2 Table 6 - 1 Table 7 - 1 Table 7 - 2 Table 7 - 3 Table 7 - 4 Table 7 - 5 Table 9 - 1 Table 10 - 1 Recovered In - pit Reserve and Diluted Grade........................................................................ 25 Ore Sort Mill Feed grade improvement ................................................................................ 27 Average Life of Mine Process Recoveries from Mill Feed ..................................................... 28 Projected Initial Capital Costs (USD million) ......................................................................... 29 Summary of Average LOM Operating Costs ( $ /tonne mill feed) .......................................... 29 Revenue before transport, refining, and royalties ................................................................ 30 Summary All - in sustaining cost (exclusive of initial capital) ................................................. 30 Summary of Ixtaca Economic Sensitivity to Precious Metal Prices (Base Case is Bold) ........ 30 Summary of Economic Results and Sensitivities to Operating Costs ( $ Million) .................. 31 Summary of Economic Results and Sensitivities to Exchange Rate ( $ Million) ..................... 31 Summary of Economic Results and Sensitivities to Capital Cost ( $ Million) ......................... 31 QPs, and Site Visits ................................................................................................................ 35 Tuligtic Property Mineral Claims ........................................................................................... 36 Exploitation Claim Minimum Expenditure/Production Value Requirements ....................... 39 Classification of Epithermal Deposits .................................................................................... 61 Tuligtic Property Drilling Summary 2010 - 2016 ..................................................................... 77 Tuligtic Property Down Hole Survey Statistics ...................................................................... 80 Section 10 + 675 E Significant Drill Intercepts (Main Ixtaca and Ixtaca North Zones) ............. 84 Section 10 + 375 E Significant Drill intercepts (Main Ixtaca Zone) .......................................... 87 Section 50 + 050 N Significant Drill intercepts (Chemalaco Zone) ........................................... 89 Authors Independent Drill Core Sample Assays .................................................................. 122 History of Metallurgical testing campaigns for the Ixtaca Project ...................................... 124 Table 10 - 2 Variability Samples for Stage 3 Metallurgical Test Work - Limestone Sample Head Assays .. 128 Table 10 - 3 Table 10 - 4 Table 10 - 5 Table 10 - 6 Table 10 - 7 Table 10 - 8 Table 10 - 9 Table 10 - 10 Table 10 - 11 Table 10 - 12 Table 10 - 13 Table 10 - 14 Table 10 - 15 Table 10 - 16 Table 10 - 17 Table 10 - 18 Table 10 - 19 Limestone Ore Sample Chemical and mineral composition ............................................... 129 Volcanic Sample Chemical and mineral composition ......................................................... 130 Black Shale Sample Chemical and mineral composition..................................................... 133 Stage 1 and 2 Comminution Results (2014 and 2016) ........................................................ 137 Limestone Comminution Variability Results (2018)............................................................ 137 Limestone Ore Sort Test Results Summary ......................................................................... 142 Limestone Ore Sort Mass Balance Summary ...................................................................... 143 Black Shale Ore Sort Test Results Summary ................................................................... 144 Black Shale Ore Sort Mass Balance Summary................................................................. 146 Black Shale Ore Sort Test Results Summary ................................................................... 146 Volcanic Ore Sort Mass Balance Summary ..................................................................... 148 2013 Limestone EGRG results......................................................................................... 149 2016 Limestone EGRG results......................................................................................... 149 2013 Volcanic EGRG results ............................................................................................ 152 2016 Volcanic EGRG results ............................................................................................ 152 2013 Black Shale EGRG results ....................................................................................... 154 2016 Blackshale EGRG results......................................................................................... 154
Ixtaca - S - K 1300 Technical Report Summary Table 10 - 20 Table 10 - 21 Table 10 - 22 Table 10 - 23 Table 10 - 24 Table 10 - 25 Table 10 - 26 Table 10 - 27 Table 10 - 28 Table 10 - 29 Table 11 - 1 Table 11 - 2 Table 11 - 3 Table 11 - 4 Table 11 - 5 Table 11 - 6 Table 11 - 7 Table 11 - 8 Table 11 - 9 Table 11 - 10 Table 11 - 11 Table 11 - 12 Table 11 - 13 Table 11 - 15 Table 12 - 1 Table 12 - 2 Table 12 - 3 Table 12 - 4 Table 13 - 1 Table 13 - 2 Table 13 - 3 Table 13 - 4 Table 13 - 5 Table 13 - 6 Table 13 - 7 Page 9 Flotation Conditions ........................................................................................................ 158 Ultrafine gravity concentration on flotation rougher concentrate ................................ 172 Carbon Loading and Merrill - Crowe tests ........................................................................ 174 Static Thickener Tests ..................................................................................................... 175 Dynamic Thickener Tests ................................................................................................ 175 Ixtaca ore Ore Sort Performance .................................................................................... 176 Limestone Process Plant Metallurgical Projections ........................................................ 177 Volcanic and Black Shale Process Plant Metallurgical Projections ................................. 177 Ixtaca limestone aggregate testing standards ................................................................ 178 Ixtaca limestone testing of aggregate potential ............................................................. 179 Assay Statistics for Gold and Silver Sorted by Mineralized Zone ........................................ 184 Capped Levels for Gold and Silver ....................................................................................... 184 Capped Assay Statistics for Gold and Silver Sorted by Domain .......................................... 185 3 m Composite Statistics for Gold and Silver Sorted by Mineralized Zone .......................... 185 Pearson Correlation Coefficients for Au – Ag Geologic Domains ....................................... 186 Semivariogram Parameters for Gold and Silver .................................................................. 187 Specific Gravity Determinations Sorted by Cross Section................................................... 190 Specific Gravity Determinations Sorted by Lithology ......................................................... 190 Kriging Parameters for Gold in Each Domain ...................................................................... 192 Measured Resource for Total Blocks (inclusive of Mineral Reserves) ............................ 195 Indicated Resource for Total Blocks (inclusive of Mineral Reserves) ............................. 195 Inferred Resource for Total Blocks (inclusive of Mineral Reserves) ............................... 195 Measured + Indicated Resource for Total Blocks (inclusive of Mineral Reserves) ......... 196 Comparison of Composite Mean Au Grade to Block Mean Au Grade ............................ 196 Metal Prices and NSP .......................................................................................................... 201 Process Recoveries for Block Model NSR coding ................................................................ 201 Dilution Grades.................................................................................................................... 202 Mineral Reserves................................................................................................................. 203 Metallurgical Recovery Assumptions .................................................................................. 204 LG Operating Cost Inputs .................................................................................................... 205 Bench Face Angles.............................................................................................................. 206 Inter - Ramp Angles (Final)................................................................................................... 206 Ixtaca Ultimate Pit Limit Contents (NSR>=$12.50) ............................................................. 208 Ixtaca Pit Recommended Slope Angles – Final Walls.......................................................... 210 RSF Capacities................................................................................................................... ... 218 Table 13 - 8 Production Schedule Summary............................................................................................... 220 Table 13 - 9 Table 13 - 10 Table 13 - 11 Table 14 - 1 Table 14 - 2 Table 15 - 1 Table 15 - 2 Table 18 - 1 Table 18 - 2 Table 18 - 3 Hauler Cycle Time Assumptions .......................................................................................... 228 Primary Mining Fleet Schedule For Key Periods ............................................................. 229 Mine Operations Support Equipment For Key Periods................................................... 229 Summary of Process Initial Design Criteria ......................................................................... 234 Reagents and Consumables Summary ................................................................................ 245 Regional Rainfall Data ......................................................................................................... 249 Ixtaca West Tailings and Rock Storage Facility Design Criteria Summary........................... 253 Initial Capital Cost Summary ............................................................................................... 282 Sustaining Capital Cost Summary........................................................................................ 282 Expansion Capital Cost Summary........................................................................................ 283
Ixtaca - S - K 1300 Technical Report Summary Table 18.4 Table 18 - 5 Table 18 - 6 Table 18 - 7 Table 18 - 8 Table 18 - 9 Table 19 - 1 Table 19 - 2 Table 19 - 3 Table 19 - 4 Table 19 - 5 Table 19 - 6 Table 23 - 1 Page 10 Allowances for Contingencies ............................................................................................. 288 LOM Operating Cost Summary............................................................................................ 290 Mining Operating Cost Summary ........................................................................................ 291 Process Initial Operating Cost Summary ............................................................................. 291 Process Personnel ............................................................................................................... 292 Annual G&A Costs ............................................................................................................... 292 Inputs for Economic Analysis .............................................................................................. 294 Cash Flow Summary ............................................................................................................ 296 Summary of Ixtaca Economic Sensitivity to Precious Metal Prices (Base Case is Bold) ...... 297 Summary of Economic Results and Sensitivities to Operating Costs ( $ Million) ................ 297 Summary of Economic Results and Sensitivities to Exchange Rate ( $ Million) ................... 298 Summary of Economic Results and Sensitivities to Capital Cost ( $ Million) ....................... 298 Recommendations Budget .................................................................................................. 310
Ixtaca - S - K 1300 Technical Report Summary LIST OF FIGURES Page 11 Figure 1 - 1 Figure 3 - 1 Figure 3 - 2 Figure 6 - 1 Figure 6 - 2 Figure 6 - 3 Figure 6 - 4 Figure 6 - 5 Figure 6 - 6 Figure 6 - 7 Ixtaca General Arrangement ................................................................................................ 26 General Location ................................................................................................................... 37 Tuligtic Property Mineral Claims .......................................................................................... 38 Regional Geology .................................................................................................................. 44 Stratigraphic Column of the Ixtaca Area .............................................................................. 46 Geology of the Ixtaca Area ................................................................................................... 47 Chert Limestone .................................................................................................................... 48 Shale (Calcareous Silstone) from the Chemalaco Zone ....................................................... 49 Post Mineral Unconsolidated Volcanic Ash Deposits. Generally less than 1m thick ......... 50 Looking to the east of Cerro Caolin with Relative positions of Altered Volcanics, Unconformity, Limestone and the Main Ixtaca Vein Swarm ........................................................... 52 Figure 6 - 8 Photo of Cerro Caolin of the Main Ixtaca Vein Swarm From North Looking to the South Showing the Contact between the Clay Altered Volcanic and Limestone Units ............................. 53 Figure 6 - 9 Figure 6 - 10 Figure 6 - 11 Figure 6 - 12 Example of Banded Veining of the Main Ixtaca Vein Swarm Zone of ................................ 53 Altered, Veined and Mineralised Volcanics .................................................................... 55 The Vein System of the Ixtaca Main Zone , from Almaden , Jan 2019 ........................... 57 Photo (2001) of Historic Clay Exploration Pits in Clay Altered Volcanic Rocks. Looking to West. Photo Taken from near Section 10+300 ................................................................................. 58 Figure 6 - 13 Figure 6 - 14 Schematic Cross - section of an Epithermal Au - Ag Deposit , from Hedenquist et al., 2000 59 Photos of Epithernal Veining from Ixtaca, Hishikari Japan and Well Scale from the Active Geothermal System, Broadlands Ohaaki, New Zealand .................................................................. 60 Figure 6 - 15 Selected styles and geometry of epithermal deposits illustrating the structural setting of the limestone hosted veining at Ixtaca, a vein swarm and local stockwork. Taken from Sillitoe (1993). Figure 7 - 1 Figure 7 - 2 Figure 7 - 3 Figure 7 - 4 63 Rock Sample Gold Anomalies and Target Areas .................................................................. 66 Exploration Overview Showing Gold in Soil Anomalies and Extent of Geophysical Surveys 68 Gold in Soil Anomalies, ASTER Satellite Hydroxyl responses and Target Areas ................. 69 IP Chargeability and Resistivity Section Showing Soil Results and Targets. The red target was drill tested with hole TU - 10 - 001 and resulted in the Discovery of the Main Ixtaca Vein Swarm Zone Figure 7 - 5 Figure 7 - 6 Figure 7 - 7 70 Exploration Targets on the Tuligtic Project ......................................................................... 72 ASTER Satellite Hydroxyl (Clay) responses Outlining Clay Altered Volanics ...................... 73 Overview Photo of the Waihi Vein Deposit New Zealand . Historic Martha Pit on vein swarm in foreground. Surface projections of the concealed and more recently discovered Favona and Correnso veins also shown. ............................................................................................................... 74 Figure 7 - 8 Cross Section of the Favona Vein Swarm and System, Waihi Deposit New Zealand showing the concealed nature of the deposit ................................................................................................. 75 Figure 7 - 9 Model for Further Exploration at the Tuligtic Project. From Almaden, Jan 2019 ............. 76 Figure 7 - 10 100 Azimuth Section (Looking East) Showing the Assay Results of Discovery hole TU - 10 - 001 which intersected the Main Ixtaca Zone Vein Swarm. From Almaden, Jan 2019 ................... 79 Figure 7 - 11 Figure 7 - 12 Drillhole Locations ............................................................................................................ 83 Section 10+675E through the Ixtaca Main and North Zones .......................................... 92
Ixtaca - S - K 1300 Technical Report Summary Figure 7 - 13 Figure 7 - 14 Figure 7 - 15 Page 12 Figure 8 - 1 Figure 8 - 2 Figure 8 - 3 Figure 10 - 1 Figure 10 - 2 Section 10+375E through the Ixtaca Main Zone ............................................................. 93 Section 50+050N through the Chemalaco Zone .............................................................. 94 Surface and Ground Water Quality Sampling Sites. Source: Knight Piesold, March 2017 98 QA/QC Analytical Standards .............................................................................................. 112 QA/QC Blanks ..................................................................................................................... 118 QA/QC Duplicates ............................................................................................................... 119 Ixtaca Metallurgical Domains......................................................................................... 123 Plan View Of Drill holes used for Stage 1 and 2 Metallurgical Test Work ...................... 127 Figure 10 - 3 Location of Variability Samples for Stage 3 Metallurgical Test Work – 3D View from NW... 128 Figure 10 - 4 Limestone ore: estimated percentage deportment by mineral species ............................. 130 Figure 10 - 5 Volcanic: estimated percentage deportment by mineral species ....................................... 132 Figure 10 - 6 Black Shale : estimated percentage deportment by mineral species .................................. 134 Figure 10 - 7 Black Shale : organic carbon mineral distribution ................................................................ 134 Figure 10 - 8 Gold diagnoistic Leach .......................................................................................................... 135 Figure 10 - 9 Silver diagnoistic Leach ......................................................................................................... 136 Figure 10 - 10: Typical Limestone high grade veining (GMET - 17 - 04 at 88 to 89 m depth) ...................... 138 Figure 10 - 11: XRT Ore Sorting .................................................................................................................. 139 Figure 10 - 12: Tomra high capacity commercial XRT Ore Sorting Machine ............................................ 140 Figure 10 - 13: Ixtaca XRT Amenability Test exh142s ................................................................................. 140 Figure 10 - 14: Limestone Ore Sort Mass Balance ..................................................................................... 143 Figure 10 - 15: Black Shale Concentrate Yield vs Tailings Au Grade ......................................................... 145 Figure 10 - 16: Black Shale Ore Sort Mass Balance ................................................................................... 145 Figure 10 - 17: Volcanic Ore Sort Mass Balance ........................................................................................ 147 Figure 10 - 18: Limestone gravity recovery vs grind size .......................................................................... 150 Figure 10 - 19: 2018 Limestone gravity recovery vs head grade (P80 = 75 µm) ....................................... 150 Figure 10 - 20: 2018 Limestone Gold - industrial gravity recovery model ............................................... 151 Figure 10 - 21: 2018 Limestone Silver - industrial gravity recovery model .............................................. 151 Figure 10 - 22: 2018 Volcanic Gold - industrial gravity recovery model ................................................... 153 Figure 10 - 23: 2018 Volcanic Silver - industrial gravity recovery model ................................................. 153 Figure 10 - 24: 2016 Black Shale Gold recovery sensitivty to number of passes ..................................... 155 Figure 10 - 25: 2018 Black Shale Gold - industrial gravity recovery model .............................................. 156 Figure 10 - 26: 2018 Black Shale Silver - industrial gravity recovery model ............................................ 156 Figure 10 - 27: Summary of Gold recovery by flotation grindsize (2016) ................................................. 157 Figure 10 - 28 : Summary of Silver recovery by flotation grindsize ( 2016 ) ............................................... 157 Figure 10 - 29 : Gold recovery to combined flotation and gravity concentrate by head grade ............... 159 Figure 10 - 30 : Silver recovery to combined flotation and gravity concentrate by head grade .............. 159 Figure 10 - 31 : Gold flotation recovery sensitivity to flotation reagent .................................................. 160 Figure 10 - 32: Silver flotation recovery sensitivity to flotation reagent ................................................. 160 Figure 10 - 33: Gravity concentrate intensitve leach gold recovery ......................................................... 161 Figure 10 - 34: Limestone Gold Leach Rates Limestone (2016) ................................................................ 163 Figure 10 - 35: Limestone Silver Leach Rates Limestone (2016) ............................................................... 163 Figure 10 - 36: Carbon absorption rates .................................................................................................... 164 Figure 10 - 37: Carbon absorption capacity test – gold loading ............................................................... 164 Figure 10 - 38: Carbon absorption capacity test – silver loading .............................................................. 165 Figure 10 - 39: CIL Gold recovery vs head grade ....................................................................................... 165
Ixtaca - S - K 1300 Technical Report Summary Figure 10 - 40: CIL Silver recovery vs head grade ...................................................................................... 166 Figure 10 - 41: CIL – Gold in Solution ......................................................................................................... 166 Figure 10 - 42: Volcanic gold leach kinetics at different grind sizes ......................................................... 167 Figure 10 - 43: Volcanic silver leach kinetics at different grind sizes ....................................................... 167 Figure 10 - 44: Black Shale carbon backscatter exh142s ............................................................................ 168 Figure 10 - 45 : Black Shale carbon rejection exploratory testwork ......................................................... 169 Figure 10 - 46 : Ultrafine gravity concentration of black shale at Metsolve laboratory .......................... 171 Figure 10 - 47 : Black Shale – gravity concentration of preflotation concentrate .................................... 171 Figure 10 - 48: Black Shale – gravity concentration of flotation rougher concentrate ............................ 172 Figure 10 - 49: Black Shale impact of organic carbon content on gold recovery ..................................... 173 Figure 10 - 50: Block Diagram of Recommended Ixtaca Flowsheet ......................................................... 176 Page 13 Figure 11 - 1 Figure 11 - 2 Plan View Showing the Mineralized Volcanic Ash solid and all drill holes ..................... 181 Plan View Showing the Main HG zone in red, the North Limb HG zone in green and the North East HG zone in magenta. ...................................................................................................... 182 Figure 11 - 3 Figure 11 - 4 Figure 11 - 5 Figure 11 - 6 Figure 11 - 7 Figure 13 - 1 Figure 13 - 2 Figure 13 - 3 Plan View Showing Main LG in yellow, North Limb LG in blue and NE LG in grey .......... 183 Plan View of Mineralized Volcanic Ash showing the different quadrants for estimation . 187 Isometric View Looking NW Showing Mineralized Blocks . ............................................. 189 Ixtaca 2202 Level Plan Showing Estimated Gold in Blocks ............................................. 198 Ixtaca 2100 Level Plan Showing Estimated Gold in Blocks ............................................. 199 Ixtaca Pit Shell Resource Contents by Case .................................................................... 207 Discounted Cashflow by Price Case ................................................................................ 208 Plan view of selected LG shell (Case 15 ) ......................................................................... 209 Figure 13 - 4 Phase 1............................................................................................................................ ... .... 211 Figure 13 - 5 Phase 2............................................................................................................................ ... .... 211 Figure 13 - 6 Phase 3............................................................................................................................ ... .... 212 Figure 13 - 7 Phase 4............................................................................................................................ ... .... 212 Figure 13 - 8 Phase 5............................................................................................................................ ... .... 213 Figure 13 - 9 Phase 6............................................................................................................................ ... .... 213 Figure 13 - 10 Phase 7............................................................................................................................ ... .. 214 Figure 13 - 11 Figure 13 - 12 Figure 13 - 13 Extent of South RSF Unsuitable Material Removal......................................................... 216 South RSF Underdrainage Collection System. ................................................................ 217 RSF Locations .................................................................................................................. 218 Figure 13 - 14 Crusher Feed Summary by Rock Type ................................................................................. 221 Figure 13 - 15 Crusher Feed Gold and Silver Grades by Year ..................................................................... 221 Figure 13 - 16 Material Movement by Year................................................................................................ 222 Figure 13 - 17 End of Pre - Production Period .............................................................................................. 223 Figure 13 - 18 End of Year 1........................................................................................................................ 224 Figure 13 - 19 End of Year 5........................................................................................................................ 225 Figure 13 - 20 End of Year 11 (Life of Mine) ............................................................................................... 226 Figure 13 - 21 Org Chart........................................................................................................................ ... ... 231 Figure 14 - 1 Figure 14 - 2 Figure 14 - 3 Figure 14 - 4 Figure 14 - 5 Summarized flowsheet for Ixtaca – Block Flow Diagram................................................ 233 Crushing And Ore Sort Layout......................................................................................... 238 Stockpile Layout and Section .......................................................................................... 239 Processing Plant Layout .................................................................................................. 240 Grinding and Gravity Concentration Section 1 - 1............................................................ 241
Ixtaca - S - K 1300 Technical Report Summary Figure 15 - 1 Figure 15 - 2 Figure 15 - 3 Figure 15 - 4 Page 14 Ixtaca Project Roads ....................................................................................................... 248 Water Balance Flow Schematic ..................................................................................... 250 Overall Site Water Management Plan – Year 10. ........................................................... 251 West Tailings and Rock Storage Facility General Arrangement - LOM........................... 254 Figure 15 - 5: West T/RSF LOM Layout ....................................................................................................... 255 Figure 15 - 6 – West Tailings and Rock Storage Facility Foundation Preparation ...................................... 257 Figure 15 - 7 Figure 15 - 8 Figure 15 - 9 Figure 17 - 1 Figure 17 - 2 West Tailings and Rock Storage Facility Northern Portion Cross Section - LOM ............ 258 West Tailings and Rock Storage Facility Southern Portion Cross Section - LOM ............ 258 Typical Underdrain Configuration ................................................................................... 259 Surface and Ground Water Quality Sampling Sites. Source: Knight Piesold, March 2017 266 Locations of Ground Water Quality Sampling Sites (from KP, 2017b) ......................... 272 Figure 23 - 1 Section View of Au>=$0.5 below the FS pit - looking South - East......................................... 308
Ixtaca - S - K 1300 Technical Report Summary 1. Summary 2. Introduction This Technical Report Summary (“TRS”) on the Ixtaca project is a review and summary of the previous technical reports carried out up to and including the date of the most recent major study prepared entitled “The Ixtaca Gold - Silver Project Puebla State, Mexico NI 43 - 101 Technical Report on the Feasibility Study” dated January 24 th 2019 and updated October 3 , 2019 (the “Study”, or “FS”) . The 2019 study was filed as a Feasibility Study following Canadian NI 43 - 101 standards, 2014 CIM Definition Standards and 2019 CIM Best Practices Guidelines . However, since SK - 1300 standards are different than those in Canada, such as a narrower range for cost estimates and contingencies, the 2019 report may not have met SK - 1300 requirements for a Feasibility Study . The Company has informed the author that no significant technical work has been conducted subsequent to the Study and that all exploration, legal, permitting and other project updates subsequent to the Study are provided in the Company’s public disclosure record . This TRS of the Ixtaca Gold - Silver Project (the “Project”) has been prepared for Almaden Minerals Ltd . (“Almaden” or “the Company”) by Moose Mountain Technical Services (“MMTS”) . The Ixtaca Project is 100 % owned by Almaden, subject to a 2 % NSR owned by Almadex Minerals Ltd . (“Almadex”), and encompasses the Ixtaca Zone Deposit (Ixtaca Gold - Silver Deposit) that includes the Ixtaca Main, North, and Chemalaco Zones of the Tuligtic Property . All currency amounts are referred to in U.S. dollars (USD) unless otherwise indicated. The Study uses: The Rock Creek Mill with average throughput of 7,650 tonnes per day; A throughput ramp - up to 15,300 tonnes per day of mill feed in Year 5; Base case metal prices of $US 1275/oz gold and $US 17/oz silver (75:1 silver - to - gold ratio). Study highlights : Average annual production of 108,500 ounces gold and 7.06 million ounces silver (203,000 gold equivalent ounces, or 15.2 million silver equivalent ounces) over first 6 years; After - tax IRR of 42% and after - tax payback period of 1.9 years; After - tax NPV of $310 million at a 5% discount rate; Initial Capital of $174 million; Conventional open pit mining with a Proven and Probable Mineral Reserve of 1 . 39 million ounces of gold and 85 . 2 million ounces of silver (See Table 1 - 3 ); Pre - concentration uses ore sorting to produce a total of 48 million tonnes of mill feed averaging 0.77 g/t gold and 47.9 g/t silver (1.41 g/t gold equivalent over life of mine; 2.03 g/t gold equivalent over first 6 years); Page 15
Ixtaca - S - K 1300 Technical Report Summary Average LOM annual production of 90 , 800 ounces gold and 6 . 14 million ounces silver ( 173 , 000 gold equivalent ounces, or 12 . 9 million silver equivalent ounces) ; Operating cost $ 716 per gold equivalent ounce, or $ 9 . 55 per silver equivalent ounce ; All - in Sustaining Costs (“AISC”), including operating costs, sustaining capital, expansion capital, private and public royalties, refining and transport of $ 850 per gold equivalent ounce, or $ 11 . 30 per silver equivalent ounce . Elimination of tailings dam by using filtered tailings significantly reduces the project footprint and water usage . 2. Property Description and Location The Tuligtic Property (the “Property”) is held 100 percent ( % ) by Compania Minera Gorrión S . A . de C . V . (“Minera Gorrión”), a wholly owned subsidiary of Almaden Minerals Ltd . (together referred to as “Almaden”) . The Property originally consisted of approximately 14 , 000 hectares, but during 2015 Almaden filed an application to reduce the aggregate claim size to those areas still considered prospective . The Tuligtic Property currently comprises seven mineral claims totalling 7 , 220 hectares (ha) located within Puebla State, 80 kilometres (km) north of Puebla City, and 130 km east of Mexico City . Almadex Minerals Ltd . holds a 2 % Net Smelter Return Royalty (NSR) on the Property . The Company has informed the author that material changes to the claim size and legal and permitting status of the Property since the date of the Study are provided in the Company’s public disclosure record since that time . 3. Accessibility, Climate, Local Resources, Infrastructure, Physiography The Tuligtic Property is road accessible and is located within Puebla State, 80 kilometres (km) north of Puebla City, and 130 km east of Mexico City . The Ixtaca Deposit within the Tuligtic Property is located 8 km northwest of the town of San Francisco Ixtacamaxtitlán, the county seat of the municipality of Ixtacamaxtitlán, Puebla State . The topography on the Tuligtic Property is generally moderate to steep hills with incised stream drainages . Elevation ranges from 2 , 300 metres (m) above sea level in the south to 2 , 800 m in the north . Vegetation is dominantly cactus and pines and the general area is somewhat cultivated with subsistence vegetables, bean and corn crops . The region has a temperate climate with average temperatures ranging from 16 Σ C in June to 12 Σ C in December . The area experiences an average of 600 to 720 mm of precipitation annually with the majority falling during the rainy season, between June and September . Electricity is available on the Property from the national electricity grid that services nearby towns such as Santa Maria and Zacatepec . At the time of the Study, Almaden had secured through purchase agreements with numerous independent owners approximately 1 , 139 hectares required for the proposed production plan . This was completed through friendly land purchase agreements with locals, considering fair market value . There are no communities that require relocation as part of the Project development . Mineral Claim owners have the right to obtain the temporary occupancy, or creation of land easements required to carry out exploration and mining operations, under the Federal Mining Law . Page 16
Ixtaca - S - K 1300 Technical Report Summary 4. History Throughout the Property there is evidence that surficial clay deposits have once been mined prior to Almaden’s acquisition of the project . Almaden acquired the Cerro Grande claims of the Tuligtic Property by staking in 2001 following the identification of surficial clay deposits that have been interpreted to represent high - level epithermal alteration . Subsequent geologic mapping, rock, stream silt, soil sampling, and induced polarization (IP) geophysical surveys identified porphyry copper and epithermal gold targets within an approximately 5 x 5 km area of intensely altered rock . In July 2010 , Almaden initiated a diamond drilling program to test epithermal alteration within the Tuligtic Property, resulting in the discovery of the Ixtaca Zone . The first hole, TU - 10 - 001 intersected 302 . 42 metres (m) of 1 . 01 g/t Au and 48 g/t Ag and multiple high grade intervals including 44 . 35 m of 2 . 77 g/t Au and 117 . 7 g/t Ag . 5. Geological Setting and Mineralization The Tuligtic Property covers a roughly 5 by 5 kilometre area of high level epithermal alteration characterised by intense kaolinite - alunite alteration and silicification in volcanic rocks . This alteration is interpreted to represent the upper portion of a well preserved epithermal system . The epithermal system is hosted by both volcanic rocks and older carbonate units . Minor disseminated and vein mineralisation is hosted by the volcanic rocks (referred to as tuff, ash and volcanics) . The bulk of the deposit is hosted by the carbonate units as vein swarms . Within the Tuligtic Property, variably cherty and bedded light grey to dark coloured limestone (referred to as limestone) of the Late Jurassic to Early Cretaceous Upper Tamaulipas formation is underlain by transitional calcareous clastic rocks including minor brown grainstones, and thinly bedded grey, black and green coloured shaley units (referred to as shale or black shale) . The brown grainstone marks the transition between limestone and shale . During the Laramide orogeny, this entire carbonate package was intensely deformed into a series of thrust - related east verging anticlines . The shale units appear to occupy the cores of the anticlines while the limestone units occupy the cores of major synclines at the Ixtaca Zone . The carbonate units are crosscut by intensely altered intermediate composition dykes . The deformed Mesozoic sedimentary sequence is discordantly overlain by epithermal altered Cenozoic bedded crystal tuff of the upper Coyoltepec subunit (referred to as volcanic, ash and tuff) . The Ixtaca deposit is a low sulphidation epithermal vein system . Most of the gold silver mineralisation occurs as zones of high grade vein and veinlets (vein swarms) in the carbonate basement units . A small portion of the gold silver mineralisation occurs above the unconformity as disseminated mineralisation in the altered volcanic rocks . The mineralisation is not oxidised and is hosted by classic banded and colloform low - sulphidation style carbonate - quartz veining . Spatially widespread polished section and SEM mineralogic studies of mineralised epithermal veins demonstrate that the gold is dominantly hosted by electrum (an alloy of gold and silver) and the gold - silver sulphide uytenbogaardtite (Ag 3 AuS 2 ) . Apart from electrum and uytenbogaardite, the dominant silver minerals are silver rich polybasite, pyrargerite, proustite and naumannite . The ore minerals are accompanied by minor pyrite, galena (no silver detected in the SEM work on the galena) and sphalerite . The mineral assemblage is very similar to other precious metal low sulphidation vein systems worldwide with low base metal contents . To date two main vein orientations have been identified in the Ixtaca deposit : 060 degrees trending sheeted veins hosted by limestone; Page 17
Ixtaca - S - K 1300 Technical Report Summary 330 degrees trending veins hosted by shale ; The bulk of the resource and over 80 % of the recoverable metal in the FS is hosted by the limestone in the Main Ixtaca and Ixtaca North zones as swarms of sheeted and anastomosing high grade banded epithermal veins . There is no disseminated mineralisation within the host rock to the vein swarms, which is barren and unaltered limestone . To the northeast of the limestone hosted mineralisation, the Chemalaco zone, a 330 striking and west dipping vein zone hosted by shale, also forms part of the deeper resource . The Main Ixtaca and Ixtaca North vein swarms are spatially associated with two altered and mineralised sub parallel ENE ( 060 degrees) trending, sub - vertical to steeply north dipping dyke zones . The Main Ixtaca dyke zone is approximately 100 m wide and consists of a series of 2 m to over 20 m true width dykes . The Ixtaca North dyke zone is narrower and comprises a steeply north - dipping zone of two or three discrete dykes ranging from 5 to 20 m in width . Individual veins within the Main Ixtaca and Ixtaca North vein zones cannot be separately modelled . Wireframes were created that constrain the higher grade, more densely veined areas, however as the vein swarms are anastomosing and sheeted in nature, these wireframes include significant barren limestone material enclosed by veins within the vein swarm . The Main and North zones have been defined over 650 m and tested over 1000 m strike length with high - grade mineralization intersected to depths up to 350 m vertically from surface . The strike length of the Chemalaco Zone has been extended to 450 m with high - grade mineralization intersected to a vertical depth of 550 m, or approximately 700 m down - dip . In 2016 Almaden conducted a drill program to test for additional veins to the north of the Ixtaca North Zone . This program resulted in better definition of the Ixtaca North zone and successfully demonstrated that limestone mineralisation remains open to the north and at depth . The Chemalaco Zone dips moderately - steeply at approximately 22 degrees to the WSW . An additional sub - parallel zone has been defined underneath the Chemalaco Zone dipping 25 to 50 degrees to the WSW, intersected to a vertical depth of 250 m, approximately 400 m down - dip over a 250 m strike length . The Chemalaco zone remains open to depth and along strike to the northwest . Additional parallel veins further to the east have been identified in core and the zone remains open in this direction as well . 1 . 6 Exploration Between 2001 and 2013 , Almaden’s exploration at the Tuligtic Property included geologic mapping and prospecting, alteration mineralogical characterization, rock and soil geochemical sampling, ground magnetics, IP and resistivity, Controlled Source Audio - frequency Magnetotelluric (CSAMT), and Controlled Source Induced Polarization (CSIP) geophysical surveys resulting in the identification of additional anomalous zones including the Ixtaca, Ixtaca East, Caleva, Azul, Sol zones, Tano, and SE Alteration zones . Since 2010 , a total of 590 diamond drillholes have been drilled at the Tuligtic Property, totalling 192 , 121 m (not including geotechnical holes) . During this timeframe the Company focussed on Ixtaca Zone Deposit resource and development work which has meant that many of the epithermal targets have not yet been tested by drilling . Page 18
Ixtaca - S - K 1300 Technical Report Summary 7. Drilling The 230 holes drilled between July, 2010 and November 13 , 2012 totalled 83 , 346 m and identified the Main Ixtaca, Ixtaca North and Chemalaco zones . Diamond drilling at 25 to 50 m section spacing defined the Main Ixtaca and Ixtaca North as NE - oriented sub - vertical zones and a strike length of approximately 650 m . High - grade mineralization was intersected to depths of 200 to 300 m vertically from surface . The Chemalaco Zone was identified as dipping moderately - steeply over a strike length of 350 m along a series of five ENE ( 070 degrees) oriented sections spaced at intervals of 50 to 100 m . High grade mineralization having a true - width ranging from less than 30 and up to 60 m was intersected beneath approximately 30 m of tuff to a vertical depth of 550 m, or approximately 600 m down - dip . During 2013 and subsequent to the November 13 , 2012 cut - off of the maiden mineral Resource Estimate, Almaden drilled 198 holes totalling 55 , 467 m . A total of 79 holes were drilled at the Main Ixtaca Zone, 40 holes at the Ixtaca North Zone and 79 holes at the Chemalaco Zone . Drilling during 2013 focused on expanding the deposit and upgrading resources previously categorized as Inferred to higher confidence Measured and Indicated categories . Drilling during 2014 and 2015 , subsequent to the 2014 Resource Estimate, Almaden had completed 52 additional drill holes totalling 17 , 128 m ( 49 within the Ixtaca Deposit and 3 exploration drill holes outside the Ixtaca Deposit . Of the holes drilled within the Ixtaca Deposit during 2014 through 2016 , 4 were metallurgical holes that twinned existing holes . The remainder were exploration holes testing mineralized zones at depth . Drilling during 2014 through 2016 comprised 86 additional drill holes totalling 28 , 131 m (including 3 exploration drill holes at the (Casa) Azul Zone, and 1 at the Tano Zone) . Of the holes drilled within the Ixtaca Deposit during 2014 , 2015 , and 2016 , 4 were metallurgical holes that twinned existing holes and 27 were geotechnical holes . During 2016 a total of 33 holes totalling 10 , 514 m further delineated and expanded the Ixtaca North Zone mineralization as well as identifying new veins to the north and at depth . The remainder were exploration holes testing mineralized zones at depth below the PEA pit described in this report . Past drilling at the Casa Azul zone intersected porphyritic intrusive and limestone - skarn mineralization returning locally elevated zinc, copper and silver values . Drilling during 2017 through 2018 comprised 76 additional drill holes totalling 25 , 176 m . Of the holes drilled within the Ixtaca Deposit during 2017 and 2018 , 4 were metallurgical holes that twinned existing holes and 11 were geotechnical holes . During 2017 and 2018 a total of 21 additional holes were drilled in the Main zone, 18 in the Ixtaca North zone, and 5 additional holes in the Chemalaco Zone . The remainder were exploration holes drilled at surface in the surrounding areas . 8. Sample Preparation, Analyses and Security All strongly altered or epithermal - mineralized intervals of core have been sampled . Almaden employs a maximum sample length of 2 to 3 m in unmineralized lithologies, and a maximum sample length of 1 m in mineralized lithologies . During the years 2010 and 2011 Almaden employed a minimum sample length of 20 cm . The minimum sample length was increased to 50 cm from 2012 onwards to ensure the availability of sufficient material for replicate analysis . Drill core is half - sawn using industry standard diamond core saws . After cutting, half the core is placed in a new plastic sample bag and half are placed back in the core box . Sample numbers are written on the outside of the sample bags and a numbered tag placed inside Page 19
Ixtaca - S - K 1300 Technical Report Summary the bag . Sample bags are sealed using a plastic cable tie . Sample numbers are checked against the numbers on the core box and the sample book . ALS Minerals (ALS) sends its own trucks to the Project to take custody of the samples at the Santa Maria core facility and transports them to its sample preparation facility in Guadalajara or Zacatecas, Mexico . Prepared sample pulps are then forwarded by ALS personnel to the ALS North Vancouver, British Columbia laboratory for analysis . Drill core samples have been subject to gold determination via a 50 gram (g) AA finish FA fusion with a lower detection limit of 0 . 005 ppm Au ( 5 ppb) and upper limit of 10 ppm Au (ALS method Au - AA 24 ) . Over limit gold values (> 10 ppm Au) are subject to gravimetric analysis (ALS method Au - GRA 22 ) . Silver, base metal and pathfinder elements for drill core samples are analyzed by 33 - element ICP - AES, with a 4 - acid digestion, a lower detection limit of 0 . 5 ppm Ag and upper detection limit of 100 ppm Ag (ALS method ME - ICP 61 ) . Over limit silver values (> 100 ppm Ag) are subject to 4 - acid digestion ICP - AES analysis with an upper limit of 1 , 500 ppm Ag (ALS method ME - OG 62 ) . Ultra - high grade silver values (> 1 , 500 ppm Ag) are subject to gravimetric analysis with an upper detection limit of 10 , 000 ppm Ag (Ag - GRA 22 ) . Drill core samples are subject to Almaden’s internal QA/QC program that includes the insertion of analytical standard, blank and duplicate samples into the sample stream . A total of fifteen QA/QC samples are present in every 100 samples sent to the laboratory . QA/QC sample results are reviewed following receipt of each analytical batch . QA/QC samples falling outside established limits are flagged and subject to review and possibly re - analysis, along with the ten preceding and succeeding samples . 1 . 9 Data Verification An independent consultant was retained to audit the Tuligtic Property exploration database, and to review the exploration program and QA/QC protocols at site . The consultant first visited the Tuligtic Property from October 17 to October 20 , 2011 . Additional visits to the Tuligtic Property were carried out on September 23 , 2012 , November 20 , 2013 , and September 12 , 2019 . During each of the property visits the consultant completed a traverse of the Ixtaca Zone, observed the progress of ongoing diamond drilling operations, and recorded the location of select drill collars . Almaden’s complete drill core library was made available and the consultant reviewed mineralized intercepts from a series of holes across the Ixtaca Zone . The consultant collected quartered drill core samples as ‘replicate’ samples from select reported mineralized intercepts . Based on the results of the traverses, drill core review, and ‘replicate’ sampling the consultant has no reason to doubt the reported exploration results . The analytical data is considered to be representative of the drill samples and suitable for inclusion in the Resource Estimate . In addition to the in - house Quality Assurance Quality Control (QAQC) measures employed by Almaden, the consultant completed an independent review of Almaden’s drillhole and QAQC databases . The review included an audit of approximately 8 % of drill core analyses used in the mineral resource estimate . A total of 10 , 885 database gold and silver analyses were verified against original analytical certificates . Similarly, 10 % of the original drill collar coordinates and down hole orientation survey files were checked against those recorded in the database ; and select drill sites were verified in the field by the consultant . The QAQC audit included independent review of blank, field duplicate and certified standard analyses . All QAQC values falling outside the limits of expected variability were flagged and followed through to ensure completion of Page 20
Ixtaca - S - K 1300 Technical Report Summary appropriate reanalyses . No discrepancies were noted within the drillhole assay database, and all QAQC failures were dealt with and handled with appropriate reanalyses . 1.10 Metallurgy Metallurgical test work and mineralogy has been undertaken on each of the Ixtaca Zone metallurgical domains between 2012 and 2018 at a number of laboratories . There are 3 distinct metallurgical domains hosting precious metal mineralization at Ixtaca : Limestone ore contains most of the economic mineralization and contributes 75% of metal production in the FS (90% of metal production in the payback period). Volcanic ore contributes 12% of metal production in the FS. Black Shale ore contributes 13% of metal production in the FS. The testwork has consistently demonstrated that economic mineralization responds well to processing by pre - concentration with XRT ore sorting, gravity concentration, intensive leaching of gravity concentrate, flotation, flotation concentrate regrind, leaching with 24 hours Carbon - in - Leach (CIL) to complete gold leaching and 72 hours of agitated leach to complete silver leaching . The majority of economic mineralization is fine grained, requiring a primary grind P 80 of 75 μm for liberation, and regrind prior to leaching . Test work has demonstrated repeatable good overall recoveries for gold and silver in the primary Limestone ore domain . Silver over all recoveries from the volcanic and black shale domains is good . Gold recoveries in volcanic and black shale are poor due to refractory mineralization in the volcanic and preg - robbing organic carbon in the black shale . Ongoing test work indicates that gold recovery improvements in the black shale can be achieved with organic carbon rejection by carbon pre - flotation or flotation cleaning using an organic carbon depressant . Good carbon rejection and subsequent leach recovery was also achieved by ultra fine gravity concentration of black shale concentrates . 1 . 11 Resource Estimate On January 31 , 2013 the Company announced a maiden resource on the Ixtaca Zone, which was followed by a resource update on January 22 , 2014 and another on May 17 , 2017 . Since that time an additional 104 holes have been completed, and this data is also included in the Mineral Resource Estimate, and summarised in Table 1 - 1 . The data available for the resource estimation consisted of 649 drill holes assayed for gold and silver . Wireframes constraining mineralised domains were constructed based on geologic boundaries defined by mineralisation intensity and host rock type . Higher grade zones occur where there is a greater density of epithermal veining . These higher grade domains have good continuity and are cohesive in nature . Of the total drill holes, 558 intersected the mineralised solids and were used to make the resource estimate . Capping was completed to reduce the effect of outliers within each domain . Uniform down hole 3 meter composites were produced for each domain and used to produce semivariograms for each variable . Grades were interpolated into blocks 10 x 10 x 6 meters in dimension by ordinary kriging . Specific Page 21
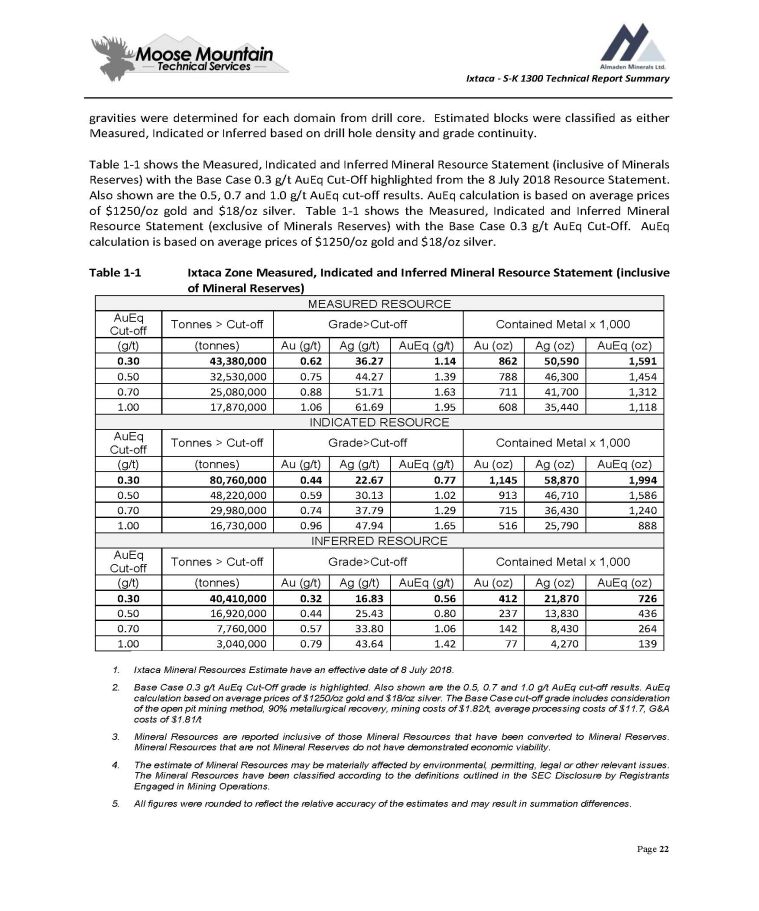
Ixtaca - S - K 1300 Technical Report Summary gravities were determined for each domain from drill core . Estimated blocks were classified as either Measured, Indicated or Inferred based on drill hole density and grade continuity . Table 1 - 1 shows the Measured, Indicated and Inferred Mineral Resource Statement with the Base Case 0 . 3 g/t AuEq Cut - Off highlighted from the 8 July 2018 Resource Statement . Also shown are the 0 . 5 , 0 . 7 and 1 . 0 g/t AuEq cut - off results . AuEq calculation is based on average prices of $ 1250 /oz gold and $ 18 /oz silver . Table 1 - 1 shows the Measured, Indicated and Inferred Mineral Resource Statement with the Base Case 0 . 3 g/t AuEq Cut - Off . AuEq calculation is based on average prices of $ 1250 /oz gold and $ 18 /oz silver . Page 22 Table 1 - 1 Ixtaca Zone Measured, Indicated and Inferred Mineral Resource Statement (inclusive of Mineral Reserves) MEASURED RESOURCE Contained Metal x 1,000 Grade>Cut - off Tonnes > Cut - off AuEq Cut - off AuEq (oz) Ag (oz) Au (oz) AuEq (g/t) Ag (g/t) Au (g/t) (tonnes) (g/t) 1,591 50,590 862 1.14 36.27 0.62 43,380,000 0.30 1,454 46,300 788 1.39 44.27 0.75 32,530,000 0.50 1,312 41,700 711 1.63 51.71 0.88 25,080,000 0.70 1,118 35,440 608 1.95 61.69 1.06 17,870,000 1.00 INDICATED RESOURCE Contained Metal x 1,000 Grade>Cut - off Tonnes > Cut - off AuEq Cut - off AuEq (oz) Ag (oz) Au (oz) AuEq (g/t) Ag (g/t) Au (g/t) (tonnes) (g/t) 1,994 58,870 1,145 0.77 22.67 0.44 80,760,000 0.30 1,586 46,710 913 1.02 30.13 0.59 48,220,000 0.50 1,240 36,430 715 1.29 37.79 0.74 29,980,000 0.70 888 25,790 516 1.65 47.94 0.96 16,730,000 1.00 INFERRED RESOURCE Contained Metal x 1,000 Grade>Cut - off Tonnes > Cut - off AuEq Cut - off AuEq (oz) Ag (oz) Au (oz) AuEq (g/t) Ag (g/t) Au (g/t) (tonnes) (g/t) 726 21,870 412 0.56 16.83 0.32 40,410,000 0.30 436 13,830 237 0.80 25.43 0.44 16,920,000 0.50 264 8,430 142 1.06 33.80 0.57 7,760,000 0.70 139 4,270 77 1.42 43.64 0.79 3,040,000 1.00 1. Ixtaca Mineral Resources Estimate have an effective date of 8 July 2018. 2. Base Case 0 . 3 g/t AuEq Cut - Off grade is highlighted . Also shown are the 0 . 5 , 0 . 7 and 1 . 0 g/t AuEq cut - off results . AuEq calculation based on average prices of $ 1250 /oz gold and $ 18 /oz silver . The Base Case cut - off grade includes consideration of the open pit mining method, 90 % metallurgical recovery, mining costs of $ 1 . 82 /t, average processing costs of $ 11 . 7 , G&A costs of $ 1 . 81 /t 3. Mineral Resources are reported inclusive of those Mineral Resources that have been converted to Mineral Reserves . Mineral Resources that are not Mineral Reserves do not have demonstrated economic viability . 4. The estimate of Mineral Resources may be materially affected by environmental, permitting, legal or other relevant issues . The Mineral Resources have been classified according to the definitions outlined in the SEC Disclosure by Registrants Engaged in Mining Operations . 5. All figures were rounded to reflect the relative accuracy of the estimates and may result in summation differences.
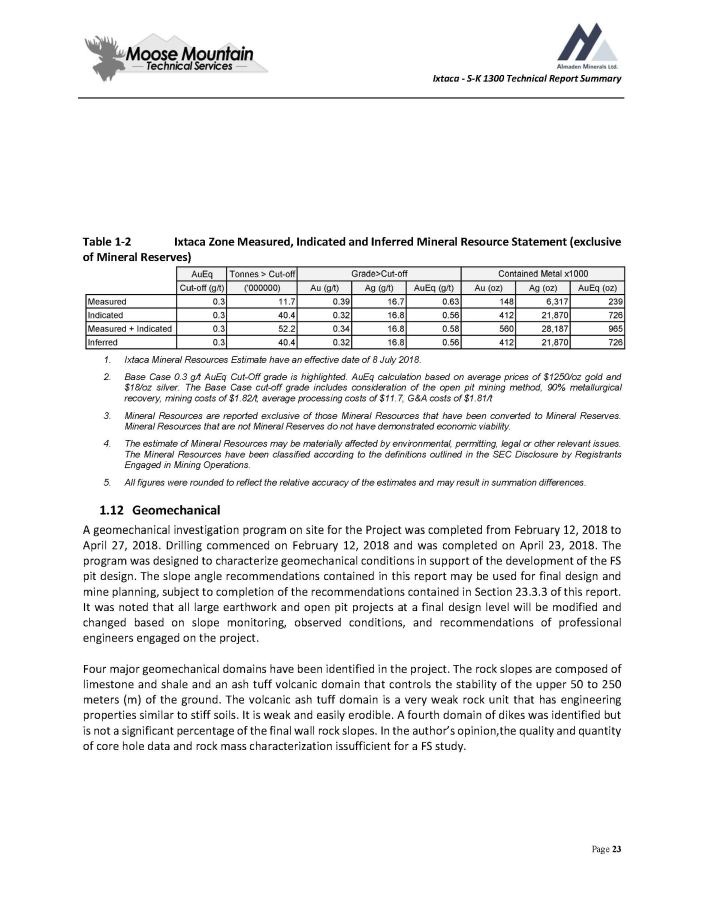
Ixtaca - S - K 1300 Technical Report Summary Table 1 - 2 Ixtaca Zone Measured, Indicated and Inferred Mineral Resource Statement (exclusive of Mineral Reserves) 1. Ixtaca Mineral Resources Estimate have an effective date of 8 July 2018. 2. Base Case 0.3 g/t AuEq Cut - Off grade is highlighted. AuEq calculation based on average prices of $1250/oz gold and $18/oz silver. The Base Case cut - off grade includes consideration of the open pit mining method, 90% metallurgical recovery, mining costs of $1.82/t, average processing costs of $11.7, G&A costs of $1.81/t 3. Mineral Resources are reported exclusive of those Mineral Resources that have been converted to Mineral Reserves . Mineral Resources that are not Mineral Reserves do not have demonstrated economic viability . 4. The estimate of Mineral Resources may be materially affected by environmental, permitting, legal or other relevant issues . The Mineral Resources have been classified according to the definitions outlined in the SEC Disclosure by Registrants Engaged in Mining Operations . 5. All figures were rounded to reflect the relative accuracy of the estimates and may result in summation differences. 1 . 12 Geomechanical A geomechanical investigation program on site for the Project was completed from February 12 , 2018 to April 27 , 2018 . Drilling commenced on February 12 , 2018 and was completed on April 23 , 2018 . The program was designed to characterize geomechanical conditions in support of the development of the FS pit design . The slope angle recommendations contained in this report may be used for final design and mine planning, subject to completion of the recommendations contained in Section 23 . 3 . 3 of this report . It was noted that all large earthwork and open pit projects at a final design level will be modified and changed based on slope monitoring, observed conditions, and recommendations of professional engineers engaged on the project . Four major geomechanical domains have been identified in the project . The rock slopes are composed of limestone and shale and an ash tuff volcanic domain that controls the stability of the upper 50 to 250 meters (m) of the ground . The volcanic ash tuff domain is a very weak rock unit that has engineering properties similar to stiff soils . It is weak and easily erodible . A fourth domain of dikes was identified but is not a significant percentage of the final wall rock slopes . In the author’s opinion,the quality and quantity of core hole data and rock mass characterization issufficient for a FS study . Page 23
Ixtaca - S - K 1300 Technical Report Summary 1. Ash Tuff and Upper Volcanics Rock quality designation (RQD) values of the volcanic domain are in the 0 to 20 range . Even though larger piece lengths were observed the rock hardness was less than R 2 (weak rock with strengths less than 5 MPa) not meeting the RQD criteria . The rock mass rating (RMR 76 ) ranges from 30 to 50 , which indicates a weak and poor to fair quality rock mass . When the ash tuff cuts are exposed they will be subjected to the deformation, erosion, and failure mechanisms because of their low strength . Even though the ash tuff slope cuts have been designed to meet the minimum slope acceptance criteria at a factor of safety of 1 . 3 , some local slope failure mechanisms might occur that are not addressed by global or inter - ramp stability analysis . These failure mechanisms include gullying, piping, and erosion . These mechanisms will be exacerbated by precipitation onto exposed slopes that have not been vegetated or covered by erosion control . Berm and bench surfaces should be graded at 2 Σ to 3 Σ to assist drainage off benches . 2. Rock Units (Limestone, Shale, Dikes) The rock units consist of limestone, shale, and dikes . Structural features (discontinuities) encountered during this field investigation consisted of joints, lithological contacts, veins, dikes, foliation, faults, shear zones, and fractures in these three domains . The limestone domain is characterized as moderately strong rock with UCS values ranging from 10 to 40 megapascals (MPa) . RQD values in the limestone range from 60 to 100 . The limestone is moderately jointed and has a rock mass rating ranging from 50 to 70 indicating a good rock mass . The shale domain is a weak rock mass with UCS values ranging from 5 to 20 MPa . The shale unit is a highly foliated and weak rock mass and has a varying foliation dipping between 40 Σ to 50 Σ at a dip direction of 250 Σ . RQD values in the shale range from 50 to 100 and the rock mass rating ranges from 40 to 65 , which indicates a fair to good quality rock mass . The bulk of the final wall will be controlled by the rock mass properties of the shale domain . The intrusive dikes have not been differentiated in the geotechnical model as they will be governed by the strength of the shale or limestone rock mass . The dikes are characterized as strong with UCS values ranging from 50 to 70 MPa and have a RMR 76 of 55 to 80 indicating the dikes are a strong and good rock mass where present . 1 . 13 Proposed Development Plan A mining design, production schedule, and cost model has been developed for the Ixtaca Zone of the Tuligtic Property . This current work focuses on the near surface high grade limestone hosted portions of the Ixtaca Zone deposit . The mine schedule includes an open pit mining operation with a process plant to produce gold and silver doré . The plant will operate initially at an average plant throughput of 7 , 650 tonnes per day (tpd) and expanding to 15 , 300 tpd by Year 5 . The process plant includes conventional crushing, ore sorting, grinding, gravity, flotation, and concentrate leaching using CIL . Mining will use a contractor owned and operated fleet . Page 24
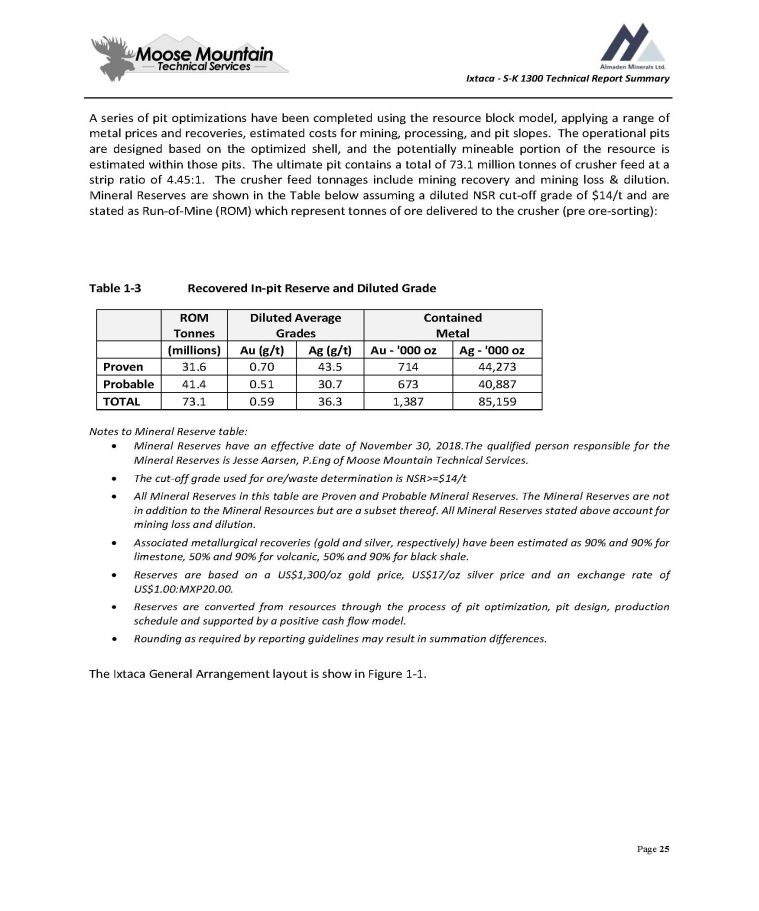
Ixtaca - S - K 1300 Technical Report Summary A series of pit optimizations have been completed using the resource block model, applying a range of metal prices and recoveries, estimated costs for mining, processing, and pit slopes . The operational pits are designed based on the optimized shell, and the potentially mineable portion of the resource is estimated within those pits . The ultimate pit contains a total of 73 . 1 million tonnes of crusher feed at a strip ratio of 4 . 45 : 1 . The crusher feed tonnages include mining recovery and mining loss & dilution . Mineral Reserves are shown in the Table below assuming a diluted NSR cut - off grade of $ 14 /t and are stated as Run - of - Mine (ROM) which represent tonnes of ore delivered to the crusher (pre ore - sorting) : Page 25 Table 1 - 3 Recovered In - pit Reserve and Diluted Grade Contained Metal Diluted Average Grades ROM Tonnes Ag - '000 oz Au - '000 oz Ag (g/t) Au (g/t) (millions) 44,273 714 43.5 0.70 31.6 Proven 40,887 673 30.7 0.51 41.4 Probable 85,159 1,387 36.3 0.59 73.1 TOTAL Notes to Mineral Reserve table : Mineral Reserves have an effective date of November 30 , 2018 . The qualified person responsible for the Mineral Reserves is Jesse Aarsen, P . Eng of Moose Mountain Technical Services . The cut - off grade used for ore/waste determination is NSR>= $ 14 /t All Mineral Reserves in this table are Proven and Probable Mineral Reserves . The Mineral Reserves are not in addition to the Mineral Resources but are a subset thereof . All Mineral Reserves stated above account for mining loss and dilution . Associated metallurgical recoveries (gold and silver, respectively) have been estimated as 90 % and 90 % for limestone, 50 % and 90 % for volcanic, 50 % and 90 % for black shale . Reserves are based on a US $ 1 , 300 /oz gold price, US $ 17 /oz silver price and an exchange rate of US $ 1 . 00 : MXP 20 . 00 . Reserves are converted from resources through the process of pit optimization, pit design, production schedule and supported by a positive cash flow model . Rounding as required by reporting guidelines may result in summation differences . The Ixtaca General Arrangement layout is show in Figure 1 - 1 .
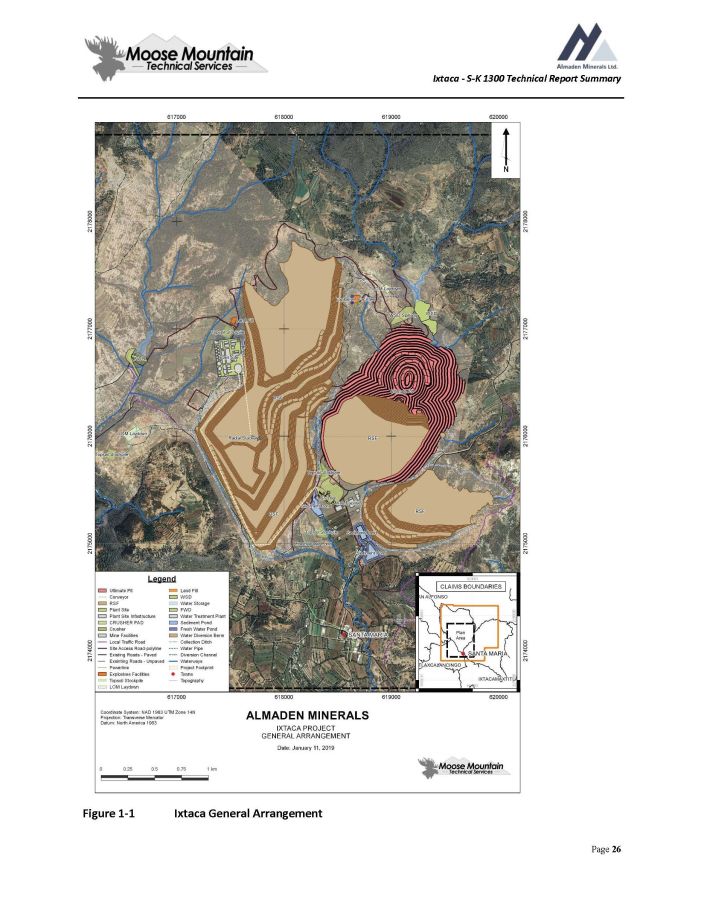
Ixtaca - S - K 1300 Technical Report Summary Figure 1 - 1 Ixtaca General Arrangement Page 26
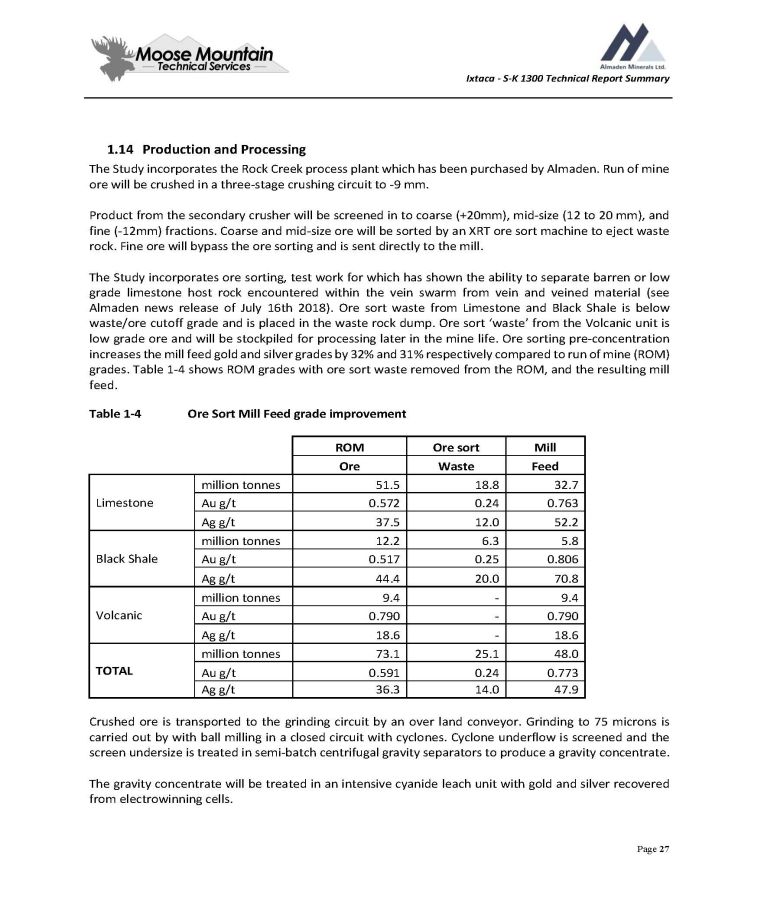
Ixtaca - S - K 1300 Technical Report Summary 1.14 Production and Processing The Study incorporates the Rock Creek process plant which has been purchased by Almaden . Run of mine ore will be crushed in a three - stage crushing circuit to - 9 mm . Product from the secondary crusher will be screened in to coarse (+ 20 mm), mid - size ( 12 to 20 mm), and fine ( - 12 mm) fractions . Coarse and mid - size ore will be sorted by an XRT ore sort machine to eject waste rock . Fine ore will bypass the ore sorting and is sent directly to the mill . The Study incorporates ore sorting, test work for which has shown the ability to separate barren or low grade limestone host rock encountered within the vein swarm from vein and veined material (see Almaden news release of July 16 th 2018 ) . Ore sort waste from Limestone and Black Shale is below waste/ore cutoff grade and is placed in the waste rock dump . Ore sort ‘waste’ from the Volcanic unit is low grade ore and will be stockpiled for processing later in the mine life . Ore sorting pre - concentration increases the mill feed gold and silver grades by 32 % and 31 % respectively compared to run of mine (ROM) grades . Table 1 - 4 shows ROM grades with ore sort waste removed from the ROM, and the resulting mill feed . Table 1 - 4 Ore Sort Mill Feed grade improvement Page 27 Mill Ore sort ROM Feed Waste Ore 32.7 18.8 51.5 million tonnes Limestone 0.763 0.24 0.572 Au g/t 52.2 12.0 37.5 Ag g/t 5.8 6.3 12.2 million tonnes Black Shale 0.806 0.25 0.517 Au g/t 70.8 20.0 44.4 Ag g/t 9.4 - 9.4 million tonnes Volcanic 0.790 - 0.790 Au g/t 18.6 - 18.6 Ag g/t 48.0 25.1 73.1 million tonnes TOTAL 0.773 0.24 0.591 Au g/t 47.9 14.0 36.3 Ag g/t Crushed ore is transported to the grinding circuit by an over land conveyor . Grinding to 75 microns is carried out by with ball milling in a closed circuit with cyclones . Cyclone underflow is screened and the screen undersize is treated in semi - batch centrifugal gravity separators to produce a gravity concentrate . The gravity concentrate will be treated in an intensive cyanide leach unit with gold and silver recovered from electrowinning cells .
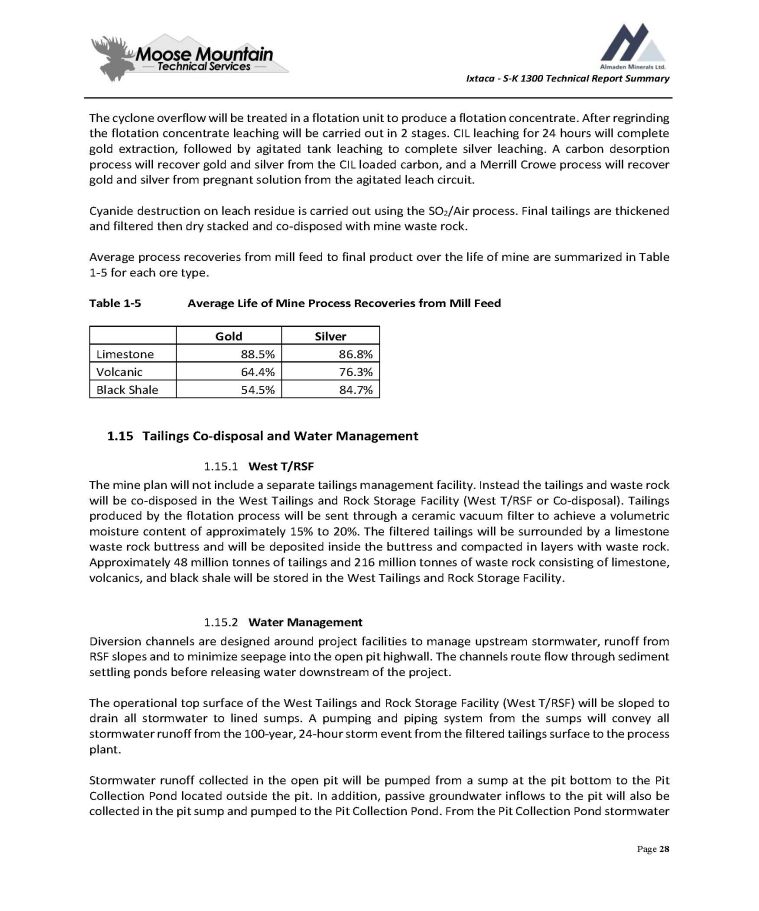
Ixtaca - S - K 1300 Technical Report Summary The cyclone overflow will be treated in a flotation unit to produce a flotation concentrate . After regrinding the flotation concentrate leaching will be carried out in 2 stages . CIL leaching for 24 hours will complete gold extraction, followed by agitated tank leaching to complete silver leaching . A carbon desorption process will recover gold and silver from the CIL loaded carbon, and a Merrill Crowe process will recover gold and silver from pregnant solution from the agitated leach circuit . Cyanide destruction on leach residue is carried out using the SO 2 /Air process . Final tailings are thickened and filtered then dry stacked and co - disposed with mine waste rock . Average process recoveries from mill feed to final product over the life of mine are summarized in Table 1 - 5 for each ore type . Table 1 - 5 Average Life of Mine Process Recoveries from Mill Feed Page 28 Silver Gold 86.8% 88.5% Limestone 76.3% 64.4% Volcanic 84.7% 54.5% Black Shale 15. Tailings Co - disposal and Water Management 1. West T/RSF The mine plan will not include a separate tailings management facility . Instead the tailings and waste rock will be co - disposed in the West Tailings and Rock Storage Facility (West T/RSF or Co - disposal) . Tailings produced by the flotation process will be sent through a ceramic vacuum filter to achieve a volumetric moisture content of approximately 15 % to 20 % . The filtered tailings will be surrounded by a limestone waste rock buttress and will be deposited inside the buttress and compacted in layers with waste rock . Approximately 48 million tonnes of tailings and 216 million tonnes of waste rock consisting of limestone, volcanics, and black shale will be stored in the West Tailings and Rock Storage Facility . 2. Water Management Diversion channels are designed around project facilities to manage upstream stormwater, runoff from RSF slopes and to minimize seepage into the open pit highwall . The channels route flow through sediment settling ponds before releasing water downstream of the project . The operational top surface of the West Tailings and Rock Storage Facility (West T/RSF) will be sloped to drain all stormwater to lined sumps . A pumping and piping system from the sumps will convey all stormwater runoff from the 100 - year, 24 - hour storm event from the filtered tailings surface to the process plant . Stormwater runoff collected in the open pit will be pumped from a sump at the pit bottom to the Pit Collection Pond located outside the pit . In addition, passive groundwater inflows to the pit will also be collected in the pit sump and pumped to the Pit Collection Pond . From the Pit Collection Pond stormwater
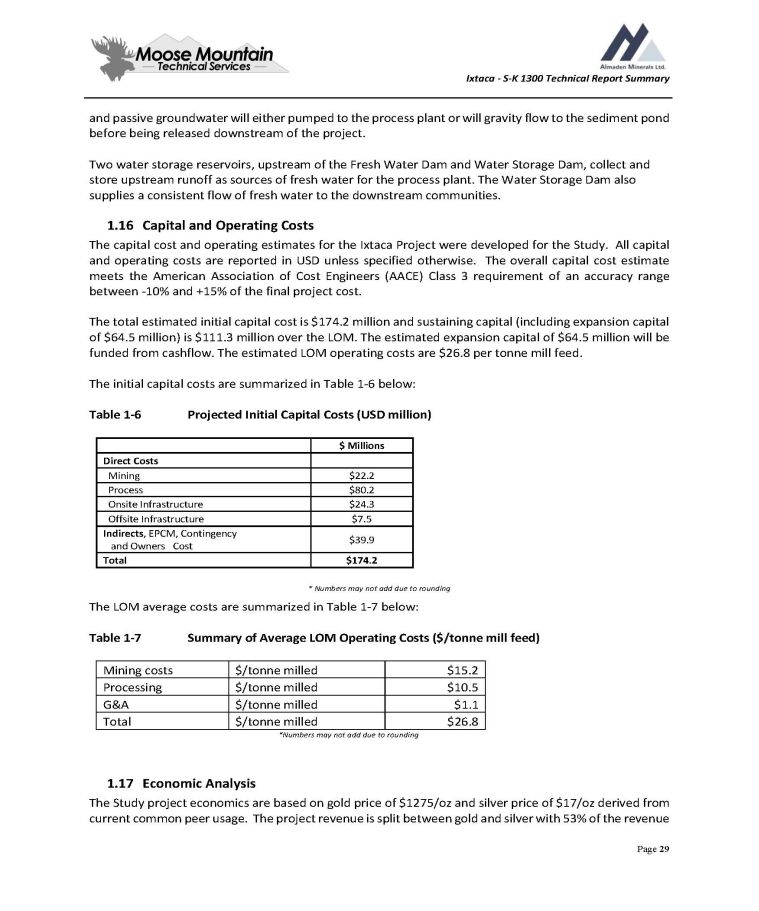
Ixtaca - S - K 1300 Technical Report Summary and passive groundwater will either pumped to the process plant or will gravity flow to the sediment pond before being released downstream of the project. Two water storage reservoirs, upstream of the Fresh Water Dam and Water Storage Dam, collect and store upstream runoff as sources of fresh water for the process plant. The Water Storage Dam also supplies a consistent flow of fresh water to the downstream communities. 1 . 16 Capital and Operating Costs The capital cost and operating estimates for the Ixtaca Project were developed for the Study . All capital and operating costs are reported in USD unless specified otherwise . The overall capital cost estimate meets the American Association of Cost Engineers (AACE) Class 3 requirement of an accuracy range between - 10 % and + 15 % of the final project cost . The total estimated initial capital cost is $ 174 . 2 million and sustaining capital (including expansion capital of $ 64 . 5 million) is $ 111 . 3 million over the LOM . The estimated expansion capital of $ 64 . 5 million will be funded from cashflow . The estimated LOM operating costs are $ 26 . 8 per tonne mill feed . The initial capital costs are summarized in Table 1 - 6 below : Table 1 - 6 Projected Initial Capital Costs (USD million) Page 29 $ Millions Direct Costs $22.2 Mining $80.2 Process $24.3 Onsite Infrastructure $7.5 Offsite Infrastructure $39.9 Indirects , EPCM, Contingency and Owners Cost $174.2 Total * Numbers may not add due to rounding The LOM average costs are summarized in Table 1 - 7 below: Table 1 - 7 Summary of Average LOM Operating Costs ($/tonne mill feed) $15.2 $/tonne milled Mining costs $10.5 $/tonne milled Processing $1.1 $/tonne milled G&A $26.8 $/tonne milled Total *Numbers may not add due to rounding 1.17 Economic Analysis The Study project economics are based on gold price of $1275/oz and silver price of $17/oz derived from current common peer usage. The project revenue is split between gold and silver with 53% of the revenue
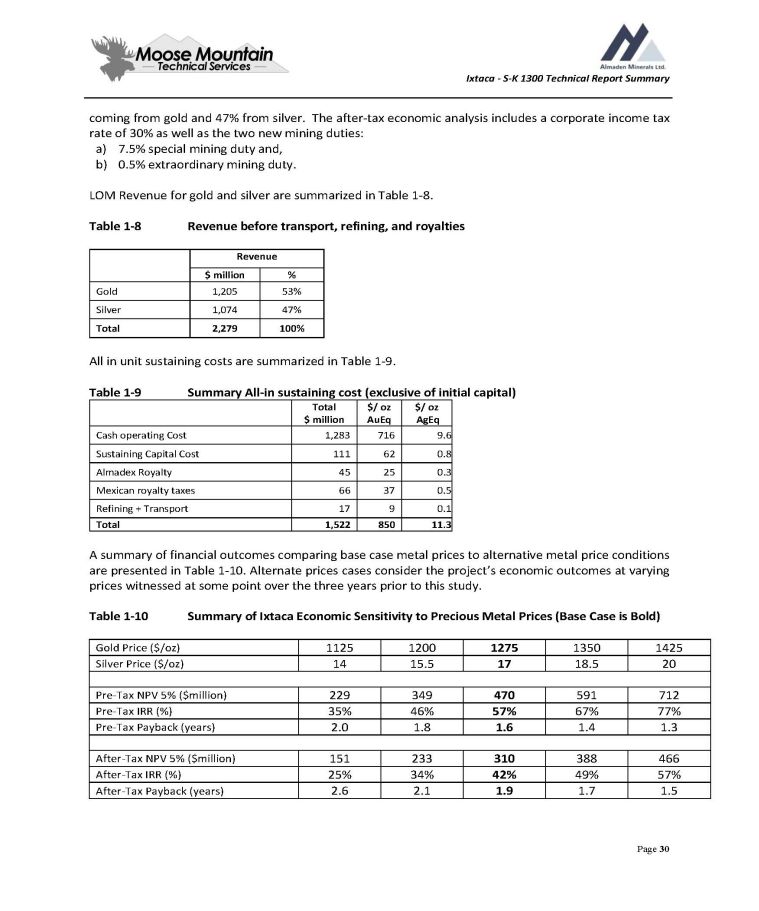
Ixtaca - S - K 1300 Technical Report Summary coming from gold and 47% from silver. The after - tax economic analysis includes a corporate income tax rate of 30% as well as the two new mining duties: a) 7.5% special mining duty and, b) 0.5% extraordinary mining duty. LOM Revenue for gold and silver are summarized in Table 1 - 8. Table 1 - 8 Revenue before transport, refining, and royalties Page 30 Revenue % $ million 53% 1,205 Gold 47% 1,074 Silver 100% 2,279 Total All in unit sustaining costs are summarized in Table 1 - 9. Table 1 - 9 Summary All - in sustaining cost (exclusive of initial capital) $/ oz AgEq $/ oz AuEq Total $ million 9.6 716 1,283 Cash operating Cost 0.8 62 111 Sustaining Capital Cost 0.3 25 45 Almadex Royalty 0.5 37 66 Mexican royalty taxes 0.1 9 17 Refining + Transport 11.3 850 1,522 Total A summary of financial outcomes comparing base case metal prices to alternative metal price conditions are presented in Table 1 - 10 . Alternate prices cases consider the project’s economic outcomes at varying prices witnessed at some point over the three years prior to this study . Table 1 - 10 Summary of Ixtaca Economic Sensitivity to Precious Metal Prices (Base Case is Bold) 1425 1350 1275 1200 1125 Gold Price ($/oz) 20 18.5 17 15.5 14 Silver Price ($/oz) 712 591 470 349 229 Pre - Tax NPV 5% ($million) 77% 67% 57% 46% 35% Pre - Tax IRR (%) 1.3 1.4 1.6 1.8 2.0 Pre - Tax Payback (years) 466 388 310 233 151 After - Tax NPV 5% ($million) 57% 49% 42% 34% 25% After - Tax IRR (%) 1.5 1.7 1.9 2.1 2.6 After - Tax Payback (years)
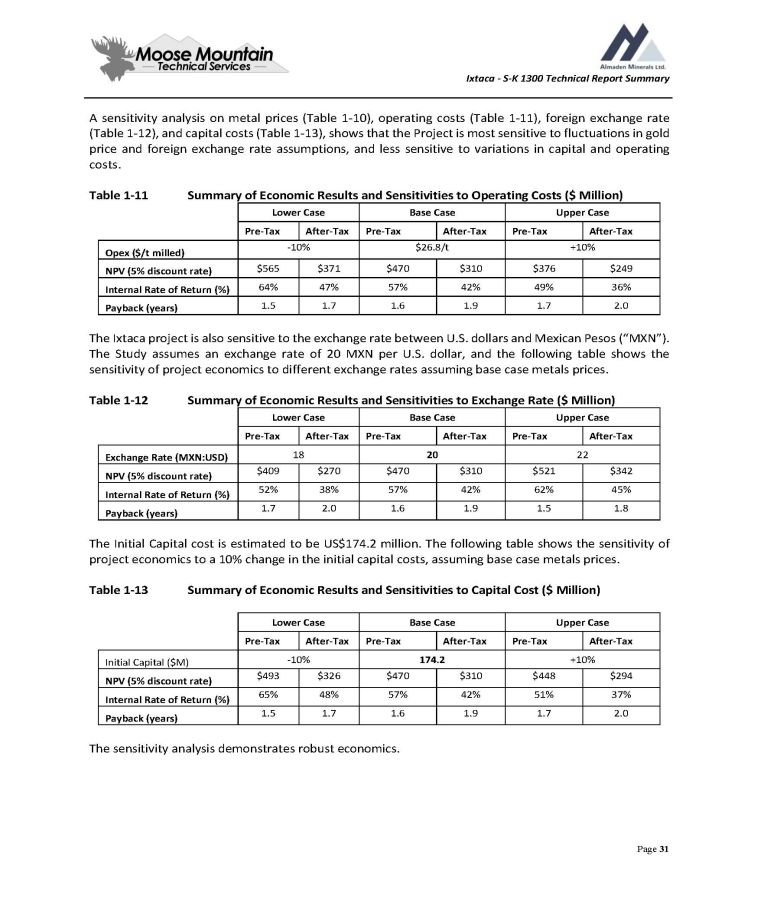
Ixtaca - S - K 1300 Technical Report Summary A sensitivity analysis on metal prices ( Table 1 - 10 ), operating costs ( Table 1 - 11 ), foreign exchange rate ( Table 1 - 12 ), and capital costs ( Table 1 - 13 ), shows that the Project is most sensitive to fluctuations in gold price and foreign exchange rate assumptions, and less sensitive to variations in capital and operating costs . Table 1 - 11 Summary of Economic Results and Sensitivities to Operating Costs ( $ Million) Page 31 Upper Case Base Case Lower Case After - Tax Pre - Tax After - Tax Pre - Tax After - Tax Pre - Tax +10% $26.8/t - 10% Opex ($/t milled) $249 $376 $310 $470 $371 $565 NPV (5% discount rate) 36% 49% 42% 57% 47% 64% Internal Rate of Return (%) 2.0 1.7 1.9 1.6 1.7 1.5 Payback (years) The Ixtaca project is also sensitive to the exchange rate between U . S . dollars and Mexican Pesos (“MXN”) . The Study assumes an exchange rate of 20 MXN per U . S . dollar, and the following table shows the sensitivity of project economics to different exchange rates assuming base case metals prices . Table 1 - 12 Summary of Economic Results and Sensitivities to Exchange Rate ( $ Million) Upper Case Base Case Lower Case After - Tax Pre - Tax After - Tax Pre - Tax After - Tax Pre - Tax 22 20 18 Exchange Rate (MXN:USD) $342 $521 $310 $470 $270 $409 NPV (5% discount rate) 45% 62% 42% 57% 38% 52% Internal Rate of Return (%) 1.8 1.5 1.9 1.6 2.0 1.7 Payback (years) The Initial Capital cost is estimated to be US$174.2 million. The following table shows the sensitivity of project economics to a 10% change in the initial capital costs, assuming base case metals prices. Table 1 - 13 Summary of Economic Results and Sensitivities to Capital Cost ($ Million) Upper Case Base Case Lower Case After - Tax Pre - Tax After - Tax Pre - Tax After - Tax Pre - Tax +10% 174.2 - 10% Initial Capital ($M) $294 $448 $310 $470 $326 $493 NPV (5% discount rate) 37% 51% 42% 57% 48% 65% Internal Rate of Return (%) 2.0 1.7 1.9 1.6 1.7 1.5 Payback (years) The sensitivity analysis demonstrates robust economics.

Ixtaca - S - K 1300 Technical Report Summary 1 . 18 Environmental and Social Considerations Almaden has undertaken significant Environmental and Community/Social programs . These will continue as the Project progresses into advanced studies . The Environmental Impact Assessment (MIA) has been submitted to the regulators . Currently there are no known issues that can materially impact the ability to extract the mineral resources at the Ixtaca Project . Previous and ongoing environmental studies include meteorology, water quantity and quality, and flora and fauna . Extensive geochemical studies have evaluated the potential for acid rock drainage and metal leaching from the waste rock and tailings using globally accepted standardised methods of laboratory testing and in compliance with Mexican regulations . Most of the waste rock at Ixtaca is limestone, and the studies of both waste rock and tailings have consistently shown that there is more than enough neutralising potential present in the waste rock to neutralise any acid generated . Testing to date also indicates low potential for metal leaching . The mine will not require the resettlement of any communities . Successful engagement with the local communities proximate to the Project has been a cornerstone of the operation to date and continues to be a key focus for Almaden through Project development . Open, transparent communication with stakeholders has been fundamental to Almaden’s approach since staking the original Tuligtic claims in 2001 . Over the past several years, Almaden has interacted with over 20 , 000 people from over 53 communities and 8 different states in the following ways : Coordinated nine large community meetings, with total attendance at these meetings approaching 4 , 100 people ; Taken a total of approximately 480 people, drawn from local communities, to visit 24 mines ; Arranged 46 sessions of “Dialogos Transversales”, wherein community members are invited to attend discussions with experts on a diverse range of issues relating to the mining industry such as an overview of Mexican Mining Law, Human Rights and Mining, mineral processing, explosives, water in mining, risk management, and mine infrastructure amongst other things ; Opened a central community office in the town of Santa Maria Zotoltepec, which is continually open to community members and includes an anonymous suggestion box ; Invested in a “mobile mining module” which allows company representatives to establish a temporary presence in communities more distant from the project, and allows for those interested to learn more about the project ; Employed as many local people as possible, reaching up to 70 people drawn from five local communities . Almaden operates the drills used at the project, and hence can draw and train a local workforce as opposed to bringing in external contractors ; Initiated a program of scholarships for top performing local students, with 130 scholarships granted to date to individuals from 23 different communities ( 79 women and 51 men) ; Established several clubs, including reading, dancing, football, music, and theatre clubs, to contribute to the vitality of local communities ; Page 32

Ixtaca - S - K 1300 Technical Report Summary Focused on education, enabling over 4 , 300 people to be positively impacted by our investments, such as rehabilitation of school - related infrastructure, donation of electronic equipment, and scholarships for top - performing students . In 2017 , Almaden engaged a third - party consultant to lead a community consultation and impact assessment at the Ixtaca project . In Mexico, only the energy industry requires completion of such an assessment (known in Mexico as a Trámite Evaluación de Impacto Social, or “EVIS”) as part of the permitting process . The purpose of these studies is to identify the people in the area of influence of a project (“Focus Area”), and assess the potential positive and negative consequences of project development to assist in the development of mitigation measures and the formation of social investment plans . To Almaden’s knowledge, this is the first time a formal EVIS has been completed in the minerals industry in Mexico, and as such reflects the Company’s commitment to best national and international standards in Ixtaca project development . The EVIS and subsequent work on the development of a Social Investment Plan were conducted according to Mexican and international standards such as the Guiding Principles on Business and Human Rights, the Equator Principles, and the OECD Guidelines for Multinational Enterprises and Due Diligence Guidance for Meaningful Stakeholder Engagement in the Extractive Sector . Fieldwork for the EVIS was conducted by an interdisciplinary group of nine anthropologists, ethnologists and sociologists graduated from various universities, who lived in community homes within the Ixtaca Focus Area during the study to allow for ethnographic immersion and an appreciation for the local customs and way of life . This third - party consultation sought voluntary participation from broad, diverse population groups, with specific attention to approximately one thousand persons in the Focus Area . This extensive consultation resulted in changes to some elements of the mine design, including the planned construction of a permanent water reservoir to serve the local area long after mine closure, and the shift to drystack filtered waste management . Positive impacts to the socio - economy of the region are expected to continue as the Project is developed into a mine and becomes a source of more jobs . Almaden plans to continue its open communication with the communities to provide for realistic expectations of any proposed mining operation and the social impacts of such a development . The Company has informed the author that updates to the environmental and social considerations of the Ixtaca Property since the date of the Study are provided in the Company’s public disclosure record since that time . 1.19 Project Execution Plan A summary of key milestones for the project execution plan at the time of the Study include : Permit submission by Q1 2019 Permit Approvals by Q4 2019 Ixtaca construction starts in Q4 2019 Rock Creek plant transported to Ixtaca site end of Q1 2020 Plant startup in Q2 2021 Page 33

Ixtaca - S - K 1300 Technical Report Summary The Company has informed the author that updates to the project execution plan since the date of the Study are provided in the Company’s public disclosure record since that time. 1.20 Conclusions and Recommendations The Ixtaca deposit is well suited for a potential mining operation. The Study’s 11 - year mine plan has robust economics and it is recommended that the project proceed to permitting and detailed design. A significant opportunity to produce by - products from the limestone waste and tailings is described in Section 23. Page 34
Ixtaca - S - K 1300 Technical Report Summary 2.0 Introduction This Technical Report (“TRS”) on the Ixtaca project is a review and summary of the previous technical work carried out up to the date of the most recent major study prepared entitled “The Ixtaca Gold - Silver Project Puebla State, Mexico NI 43 - 101 Technical Report on the Feasibility Study” dated January 24 th 2019 and updated October 3 , 2019 (the “Study”, or “FS”) . The 2019 study was filed as a Feasibility Study following Canadian NI 43 - 101 standards, 2014 CIM Definition Standards and 2019 CIM Best Practices Guidelines . However, since SK - 1300 standards are different than those in Canada, such as a narrower range for cost estimates and contingencies, the 2019 report may not have met SK - 1300 requirements for a Feasibility Study . The Company has informed the author that no significant technical work has been conducted subsequent to the Study and that all exploration, legal, permitting and other project updates subsequent to the Study are provided in the Company’s public disclosure record . Almaden Minerals Ltd . requested Moose Mountain Technical Services (“MMTS”) prepare a TRS (the “Report”, or “TRS”) on the results of the Ixtaca Gold - Silver Project in Mexico . The Ixtaca Gold - Silver Deposit (or “Ixtaca Project”) of the Tuligtic Property, is 100 percent ( % ) held by Compania Minera Gorrión S . A . de C . V . (Minera Gorrión), a wholly owned subsidiary of Almaden Minerals Ltd . (together referred to as “Almaden”), subject to a 2 % NSR in favour of Almadex Minerals Ltd . Jesse Aarsen P . Eng . , Principal – Mine Engineering, MMTS served as the Qualified Person (QPs) as defined in S - K 1300 , SEC Disclosure by Registrant Engaged in Mining Operations . QP site visits Page 35 Table 2 - 1 QPs, and Site Visits Scope Of Personal Inspection Site Visit Dates Qualified Person Reviewed open pit, waste rock dump, general site conditions. 30 April to 01 May 2013 Jesse Aarsen Reviewed drill core. Hosted potential contract miner site review 27 to 28 August 2014 for cost estimation purposes. 15 to 16 March 2016 12 to 16 December 2016 16 to 18 May 2018 The author, in writing this report use sources of information as listed in the references section . Government reports have been prepared by qualified persons holding post - secondary geology, or related university degree(s), and are therefore deemed to be accurate . These reports, which are used as background information, are referenced in this Report in the “Geological Setting and Mineralization” Section 7 . 0 below . All currency amounts are referred to in United States dollars (USD) where indicated . All units in this Report are metric and Universal Transverse Mercator (UTM) . Coordinates in this report and accompanying illustrations are referenced to North American Datum (NAD) 1983 , Zone 14 . 3.0 Property Description and Location The information in this section was drawn from the most recent major study prepared entitled “The Ixtaca Gold - Silver Project Puebla State, Mexico NI 43 - 101 Technical Report on the Feasibility Study” dated
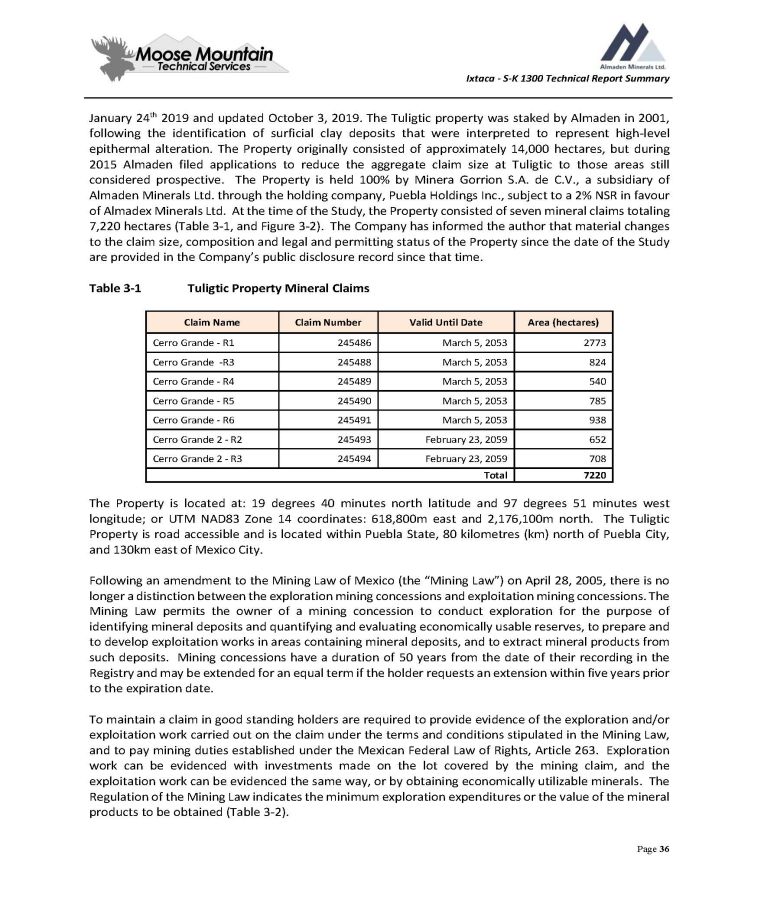
Ixtaca - S - K 1300 Technical Report Summary January 24 th 2019 and updated October 3 , 2019 . The Tuligtic property was staked by Almaden in 2001 , following the identification of surficial clay deposits that were interpreted to represent high - level epithermal alteration . The Property originally consisted of approximately 14 , 000 hectares, but during 2015 Almaden filed applications to reduce the aggregate claim size at Tuligtic to those areas still considered prospective . The Property is held 100 % by Minera Gorrion S . A . de C . V . , a subsidiary of Almaden Minerals Ltd . through the holding company, Puebla Holdings Inc . , subject to a 2 % NSR in favour of Almadex Minerals Ltd . At the time of the Study, the Property consisted of seven mineral claims totaling 7 , 220 hectares ( Table 3 - 1 , and Figure 3 - 2 ) . The Company has informed the author that material changes to the claim size, composition and legal and permitting status of the Property since the date of the Study are provided in the Company’s public disclosure record since that time . Table 3 - 1 Tuligtic Property Mineral Claims Page 36 Area (hectares) Valid Until Date Claim Number Claim Name 2773 March 5, 2053 245486 Cerro Grande - R1 824 March 5, 2053 245488 Cerro Grande - R3 540 March 5, 2053 245489 Cerro Grande - R4 785 March 5, 2053 245490 Cerro Grande - R5 938 March 5, 2053 245491 Cerro Grande - R6 652 February 23, 2059 245493 Cerro Grande 2 - R2 708 February 23, 2059 245494 Cerro Grande 2 - R3 7220 Total The Property is located at : 19 degrees 40 minutes north latitude and 97 degrees 51 minutes west longitude ; or UTM NAD 83 Zone 14 coordinates : 618 , 800 m east and 2 , 176 , 100 m north . The Tuligtic Property is road accessible and is located within Puebla State, 80 kilometres (km) north of Puebla City, and 130 km east of Mexico City . Following an amendment to the Mining Law of Mexico (the “Mining Law”) on April 28 , 2005 , there is no longer a distinction between the exploration mining concessions and exploitation mining concessions . The Mining Law permits the owner of a mining concession to conduct exploration for the purpose of identifying mineral deposits and quantifying and evaluating economically usable reserves, to prepare and to develop exploitation works in areas containing mineral deposits, and to extract mineral products from such deposits . Mining concessions have a duration of 50 years from the date of their recording in the Registry and may be extended for an equal term if the holder requests an extension within five years prior to the expiration date . To maintain a claim in good standing holders are required to provide evidence of the exploration and/or exploitation work carried out on the claim under the terms and conditions stipulated in the Mining Law, and to pay mining duties established under the Mexican Federal Law of Rights, Article 263 . Exploration work can be evidenced with investments made on the lot covered by the mining claim, and the exploitation work can be evidenced the same way, or by obtaining economically utilizable minerals . The Regulation of the Mining Law indicates the minimum exploration expenditures or the value of the mineral products to be obtained ( Table 3 - 2 ) .
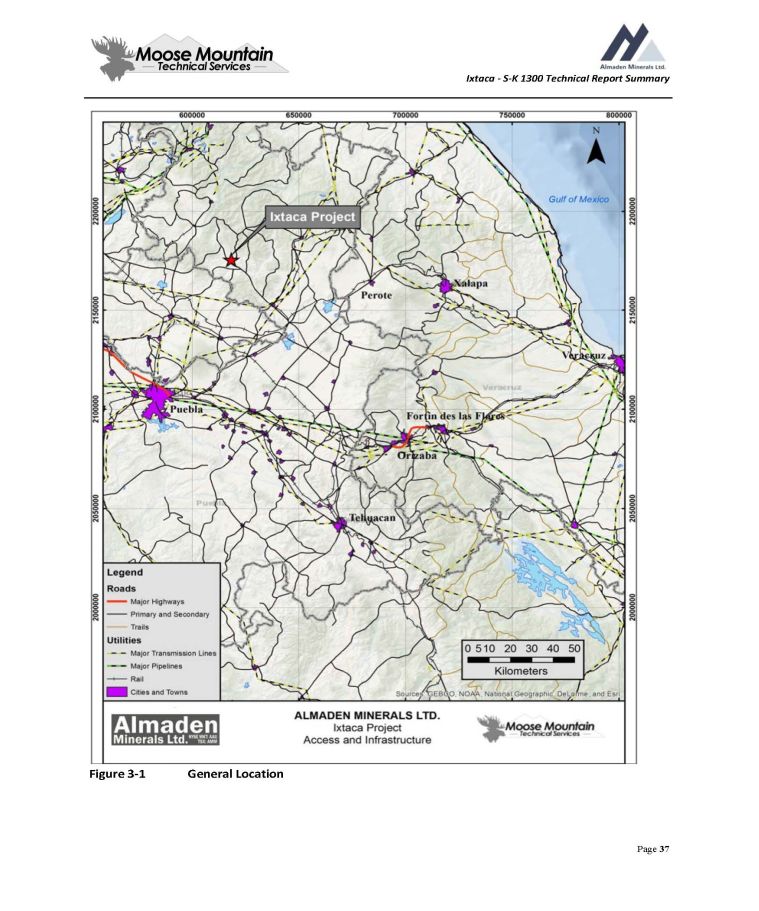
Ixtaca - S - K 1300 Technical Report Summary Figure 3 - 1 General Location Page 37
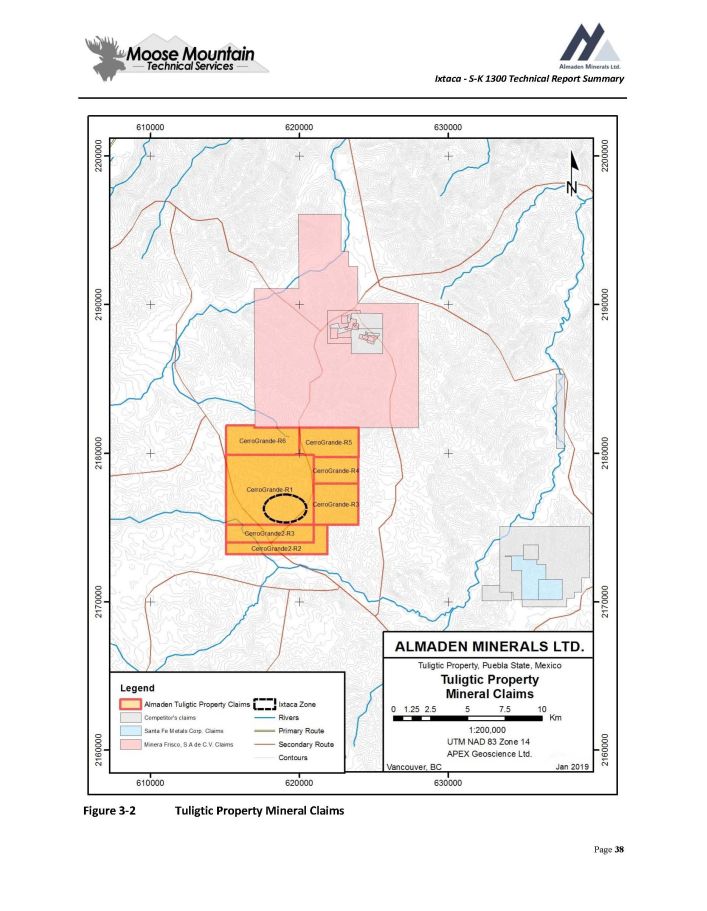
Ixtaca - S - K 1300 Technical Report Summary Figure 3 - 2 Tuligtic Property Mineral Claims Page 38
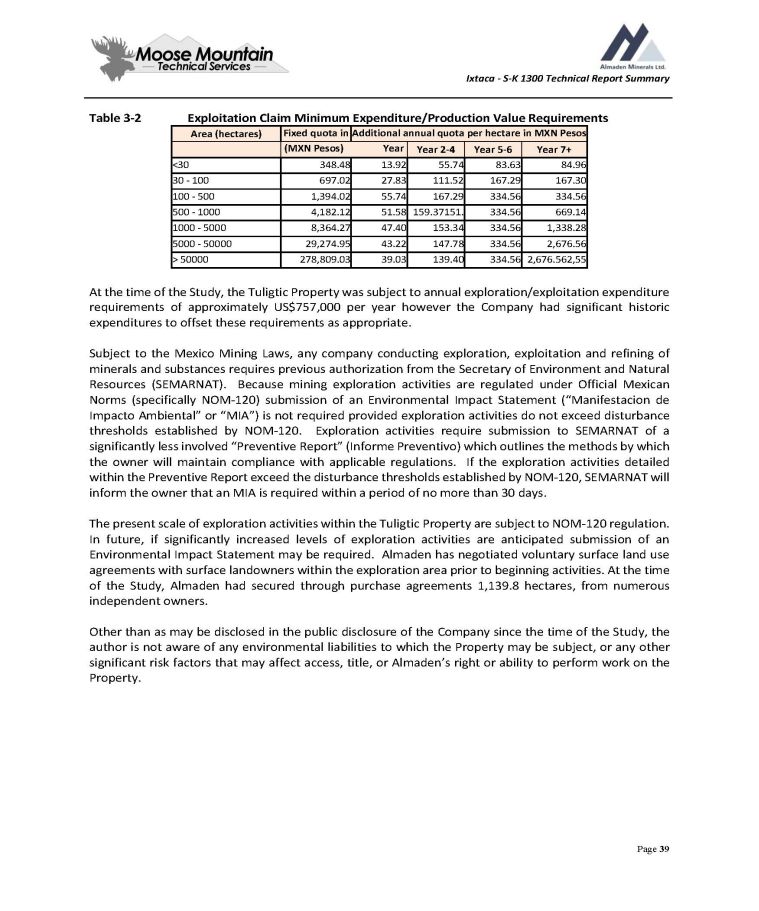
Ixtaca - S - K 1300 Technical Report Summary Table 3 - 2 Page 39 Exploitation Claim Minimum Expenditure/Production Value Requirements Additional annual quota per hectare in MXN Pesos Fixed quota in Area (hectares) Year 7+ Year 5 - 6 Year 2 - 4 (MXN Pesos) Year 84.96 83.63 55.74 13.92 348.48 <30 167.30 167.29 111.52 27.83 697.02 30 - 100 334.56 334.56 167.29 55.74 1,394.02 100 - 500 669.14 334.56 159.37151. 51.58 4,182.12 500 - 1000 1,338.28 334.56 153.34 47.40 8,364.27 1000 - 5000 2,676.56 334.56 147.78 43.22 29,274.95 5000 - 50000 2,676.562,55 334.56 139.40 39.03 278,809.03 > 50000 At the time of the Study, the Tuligtic Property was subject to annual exploration/exploitation expenditure requirements of approximately US $ 757 , 000 per year however the Company had significant historic expenditures to offset these requirements as appropriate . Subject to the Mexico Mining Laws, any company conducting exploration, exploitation and refining of minerals and substances requires previous authorization from the Secretary of Environment and Natural Resources (SEMARNAT) . Because mining exploration activities are regulated under Official Mexican Norms (specifically NOM - 120 ) submission of an Environmental Impact Statement (“Manifestacion de Impacto Ambiental” or “MIA”) is not required provided exploration activities do not exceed disturbance thresholds established by NOM - 120 . Exploration activities require submission to SEMARNAT of a significantly less involved “Preventive Report” (Informe Preventivo) which outlines the methods by which the owner will maintain compliance with applicable regulations . If the exploration activities detailed within the Preventive Report exceed the disturbance thresholds established by NOM - 120 , SEMARNAT will inform the owner that an MIA is required within a period of no more than 30 days . The present scale of exploration activities within the Tuligtic Property are subject to NOM - 120 regulation . In future, if significantly increased levels of exploration activities are anticipated submission of an Environmental Impact Statement may be required . Almaden has negotiated voluntary surface land use agreements with surface landowners within the exploration area prior to beginning activities . At the time of the Study, Almaden had secured through purchase agreements 1 , 139 . 8 hectares, from numerous independent owners . Other than as may be disclosed in the public disclosure of the Company since the time of the Study, the author is not aware of any environmental liabilities to which the Property may be subject, or any other significant risk factors that may affect access, title, or Almaden’s right or ability to perform work on the Property .
Ixtaca - S - K 1300 Technical Report Summary 4.0 Accessibility, Climate, Local Resources, Infrastructure and Physiography The information in this section was drawn from the most recent major study prepared entitled “The Ixtaca Gold - Silver Project Puebla State, Mexico NI 43 - 101 Technical Report on the Feasibility Study” dated January 24 th 2019 and updated October 3 , 2019 . The Ixtaca deposit, the epithermal gold - silver target within the Tuligtic Property, is located 8 km northwest of the town of San Francisco Ixtacamaxtitlán, the county seat of the municipality of Ixtacamaxtitlán, Puebla State . The Project is accessible by driving 40 km east along Highway 119 from Apizaco ; an industrial centre located approximately 50 km north of Puebla City, and then north approximately 20 km along a paved road to the town of Santa Maria . The trip from Apizaco to site can be driven in approximately 1 . 5 hours . There is also access to the Property using gravel roads from the northeast via Tezhuitan and Cuyoaco, from the south via Libres and from the northwest via Chignahuapan . The Xicohtencatl Industrial complex lies 30 km southwest by paved road from the Tuligtic Property, and houses agricultural, chemical, biomedical and industrial manufacturing facilities and is serviced by rail . Puebla, the fourth largest city in Mexico has a population in excess of four million people, and includes one of the largest Volkswagen automotive plants outside Germany . The topography on the Tuligtic Property is generally moderate to steep hills with incised stream drainages . Elevation ranges from 2 , 300 metres (m) above sea level in the south to 2 , 800 m in the north . Vegetation is dominantly cactus and pines and the general area is somewhat cultivated with subsistence vegetables, bean and corn crops . The region has a temperate climate with mean monthly temperatures ranging from 16 Σ C in June to 12 Σ C in January . The area experiences approximately 714 mm of precipitation annually with the majority falling during the rainy season, between June and September . Annual evapotranspiration is estimated to be 774 mm . Exploration can be conducted year round within the Property ; however, road building and drilling operations may be impacted by weather to some degree during the rainy season . Electricity is available on the Property from the national electricity grid that services nearby towns such as Santa Maria and Zacatepec . The majority of the personnel working on the project are locals from nearby small towns . The surface ownership over the mine development area is privately owned and the property acquired by the company to date has been by voluntary agreements . Land acquired by the company is not yet sufficient to cover the areas required for the mining operations as summarized in Figures 1 - 1 and Figure 15 - 3 . Page 40
Ixtaca - S - K 1300 Technical Report Summary 5.0 History The information in this section was drawn from the most recent major study prepared entitled “The Ixtaca Gold - Silver Project Puebla State, Mexico NI 43 - 101 Technical Report on the Feasibility Study” dated January 24 th 2019 and updated October 3 , 2019 . Throughout the Property there is evidence that surficial clay deposits have once been mined . This clay alteration attracted Almaden to the area and has been interpreted to represent high - level epithermal alteration . To the authors’ knowledge no modern exploration has been conducted on the Project prior to Almaden’s acquisition of claims during 2001 and there is no record of previous mining ; as such, this is a maiden discovery . On May 9 , 2002 , Almaden entered into a joint venture agreement with BHP Billiton World Exploration Inc . (BHP) to undertake exploration in eastern Mexico . Initial helicopter - borne reconnaissance programs were completed in May 2003 and March 2004 on select targets within the joint venture area of interest . The work resulted in the acquisition of five ( 5 ) separate properties, in addition to the previously acquired Cerro Grande claim of the present day Tuligtic Property . Following a review of the initial exploration data, effective January 20 , 2005 , BHP relinquished its interest in the six properties to Almaden (Almaden, 2005 ) . The joint venture was terminated in 2006 (Almaden, 2006 ) . During January 2003 , Almaden completed a program of geologic mapping, rock, stream silt sampling and induced polarization (IP) geophysical surveys at the Tuligtic Property (then known as the “Santa Maria Prospect”) . The exploration identified both a porphyry copper and an epithermal gold target within an approximately 5 x 5 km area of intensely altered rock . At the porphyry copper target, stockwork quartz - pyrite veins associated with minor copper mineralization overprint earlier potassic alteration within a multi - phase intrusive body . A single north - south oriented IP survey line identified a greater than 2 km long elevated chargeability response coincident with the exposed altered and mineralized intrusive system . Volcanic rocks exposed 1 km to the south of the mineralized intrusive display replacement silicification and sinter indicative of the upper parts of an epithermal system (the “Ixtaca Zone”) . Quartz - calcite veins returning anomalous values in gold and silver and textural evidence of boiling have been identified within limestone roughly 100 m below the sinter . The sinter and overlying volcanic rocks are anomalous in mercury, arsenic, and antimony (Almaden, 2004 ) . Additional IP surveys and soil sampling were conducted in January and February 2005 , further defining the porphyry copper target as an area of high chargeability and elevated copper, molybdenum, silver and gold in soil . A total of eight ( 8 ) east - west oriented lines, 3 km in length, spaced at intervals of 200 m have been completed over mineralized intrusive rocks intermittently exposed within gullies cutting through the overlying unmineralized ash deposits (Almaden, 2006 ) . The Tuligtic Property was optioned to Pinnacle Mines Ltd . in 2006 and the option agreement was terminated in 2007 without completing significant exploration (Almaden, 2007 ) . The Property was subsequently optioned to Antofagasta Minerals S . A . (Antofagasta) on March 23 , 2009 . During 2009 and 2010 Antofagasta, under Almaden operation, carried out IP geophysical surveys and a diamond drill program targeting the copper porphyry prospect ( Figure 6 - 3 , Figure 7 - 2 ) . Three additional IP survey lines were completed, and in conjunction with the previous nine ( 9 ) IP lines, a 2 x 2 . 5 km chargeability high anomaly, open to the west and south, was defined (Almaden, 2011 ) . The 2009 drilling consisted of 2 , 973 m within seven ( 7 ) holes that largely intersected skarn type mineralization . Page 41
Ixtaca - S - K 1300 Technical Report Summary Highlights of the drill program include : 38m of 0.13% Copper (Cu) from 164 to 202m and 0.11% Cu from 416 to 462m within hole DDH - 01; 20m of 0.17% Cu from 94 to 114m and 26m of 0.14% Cu from 316 to 342m in hole DDH - 02; 58m of 0.17% Cu from 366 to 424m in hole DDH - 03 (including 14m of 0.27% Cu from 410 to 424m); 2m of 0.63% Cu from 18 to 20m in hole DDH - 04; and 20m of 0.11% Cu from 276 to 296m and 8m of 0.13% Cu in hole DDH - 05. Molybdenum values are anomalous ranging up to 801 parts - per - million (ppm) ( 0 . 08 % ) . Elevated gold values were also encountered including 2 m of 1 . 34 grams - per - tonne (g/t) from 178 to 180 m in DDH - 01 . On February 16 , 2010 , Almaden announced that Antofagasta terminated its option to earn an interest in the Property (Almaden, 2009 ) . In July 2010 , Almaden initiated a preliminary diamond drilling program to test epithermal alteration within the Tuligtic Property, resulting in the discovery of the Ixtaca Zone . The target was based on exploration data gathered by Almaden since 2001 including high gold and silver in soil and a chargeability and resistivity high anomaly (derived from an IP geophysical survey conducted by Almaden) topographically beneath Cerro Caolin, a prominent clay and silica altered hill . This alteration, barren in gold and silver, was interpreted by Almaden to represent the top of an epithermal system which required drill testing to depth . The first hole, TU - 10 - 001 intersected 302 . 42 metres of 1 . 01 g/t gold and 48 g/t silver and multiple high grade intervals including 44 . 35 metres of 2 . 77 g/t gold and 117 . 7 g/t silver . Page 42
Ixtaca - S - K 1300 Technical Report Summary 1. Geological Setting and Mineralization The information in this section was drawn from the most recent major study prepared entitled “The Ixtaca Gold - Silver Project Puebla State, Mexico NI 43 - 101 Technical Report on the Feasibility Study” dated January 24 th 2019 and updated October 3 , 2019 . 1. Regional Geology The Ixtaca Project is situated within the Trans Mexican Volcanic Belt (TMVB), a Tertiary to recent intrusive volcanic arc extending approximately east - west across Mexico from coast to coast and ranging in width from 10 to 300 km ( Figure 6 - 1 ) . The TMVB is the most recent episode of a long lasting magmatic activity which, since the Jurassic, produced a series of partially overlapping arcs as a result of the eastward subduction of the Farallon plate beneath western Mexico (Ferrari, 2011 ) . The basement rocks of the eastern half of the TMVB are Precambrian terranes, including biotite orthogneiss and granulite affected by granitic intrusions, grouped into the Oaxaquia microcontinent (Ferrari et al . , 2011 ; Fuentes - Peralta and Calderon, 2008 ) . These are overlain by the Paleozoic Mixteco terrane, consisting of a metamorphic sequence known as the Acatlan complex and a fan delta sedimentary sequence known as the Matzitzi formation . Another sedimentary complex is found on top of the Mixteco terrane, represented by various paleogeographic elements such as the Mesozoic basins of Tlaxiaco, Zongolica, Zapotitlan, and Tampico - Misantla (Fuentes - Peralta and Calderon, 2008 ) . The subducting plates associated with the TMVB are relatively young, with the Rivera plate dated at 10 Ma (million years) and the Cocos plate at 11 to 17 Ma . The timing and nature of volcanism in the TMVB has been described by Garcia - Palomo et al . ( 2002 ) . The oldest volcanic rocks in the central - eastern part of the TMVB were erupted approximately 13 . 5 Ma ago, followed by a nearly 10 Ma hiatus . Volcanic activity in the area resumed around 3 . 0 - 1 . 5 Ma . The composition of volcanic rocks ranges from basalt to rhyolite and exhibits calc - alkaline affinity . Extensive silicic volcanism in this area has been related to partial melting of the lower crust, hydrated by infiltration of slab - derived fluids during flat subduction (Ferrari et al . , 2011 ) . The Sierra Madre Occidental (SMO) style of volcanism is silicic and explosive as opposed to intermediate and effusive volcanism characteristic of the TMVB . Volcanic centres in the region have been controlled by NE - SW trending normal faults, associated with horst - and - graben structures, resulting from a stress field with a least principal stress (σ 3 ) oriented to the NW . The regional trend of the arc rocks is WNW ; though more northerly trending transforms faults, forming at a high angle to the TMVB, provide a structural control on the volcanic units (Coller, 2011 ) . Compressional strike - slip and extensional faults also developed as a result of compressional and extensional periods during subduction . The NE - SW San Antonio fault system, which is still active during Late Pliocene, before the reactivation of the Taxco - Queretaro fault system, is characterized by extensional left - lateral oblique - slip kinematics (Coller, 2011 ) . Bellotti et al . ( 2006 ) show that NNW trending regional faults have been right lateral in the Miocene, whereas the NNE to N - S trending faults observed at Ixtaca by Coller ( 2011 ) are related to the regional horst - and - graben development and likely to be purely extensional with possibly a component of right lateral movement, or transtensional . Page 43
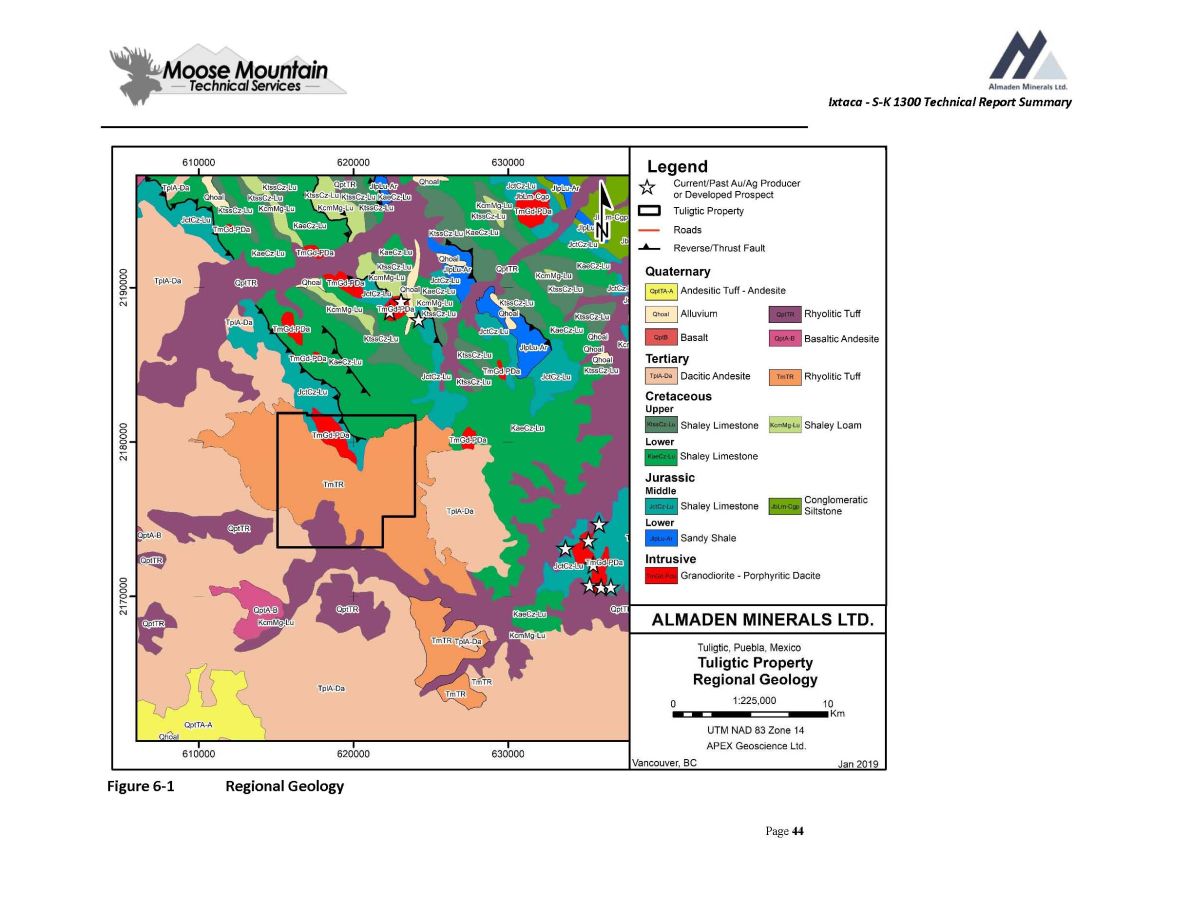
Ixtaca - S - K 1300 Technical Report Summary Figure 6 - 1 Regional Geology Page 44
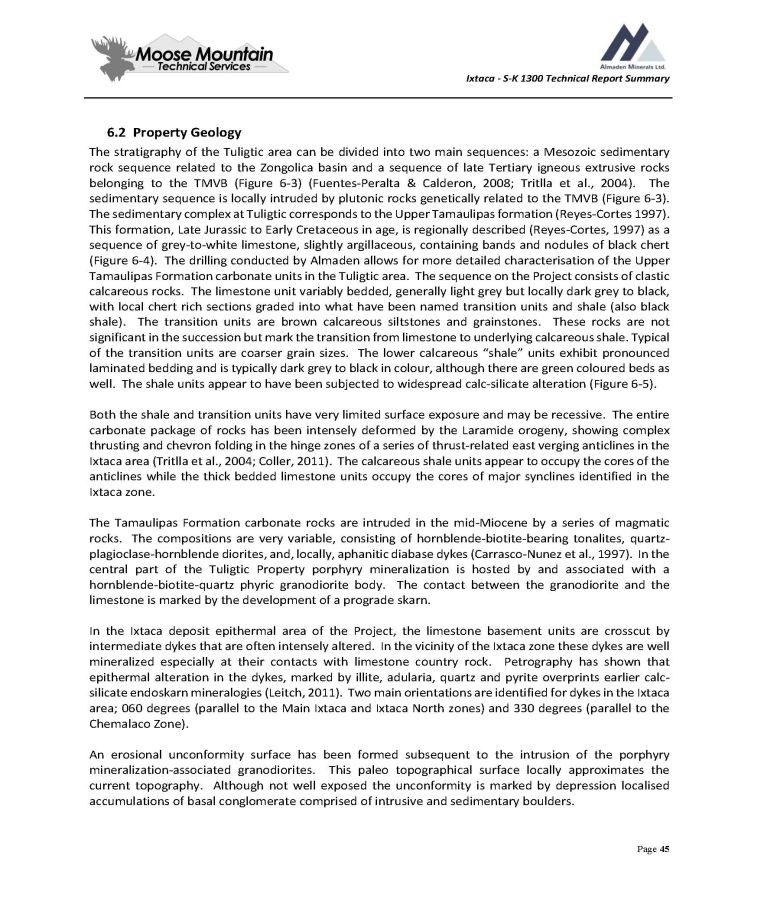
Ixtaca - S - K 1300 Technical Report Summary 6 . 2 Property Geology The stratigraphy of the Tuligtic area can be divided into two main sequences : a Mesozoic sedimentary rock sequence related to the Zongolica basin and a sequence of late Tertiary igneous extrusive rocks belonging to the TMVB ( Figure 6 - 3 ) (Fuentes - Peralta & Calderon, 2008 ; Tritlla et al . , 2004 ) . The sedimentary sequence is locally intruded by plutonic rocks genetically related to the TMVB ( Figure 6 - 3 ) . The sedimentary complex at Tuligtic corresponds to the Upper Tamaulipas formation (Reyes - Cortes 1997 ) . This formation, Late Jurassic to Early Cretaceous in age, is regionally described (Reyes - Cortes, 1997 ) as a sequence of grey - to - white limestone, slightly argillaceous, containing bands and nodules of black chert ( Figure 6 - 4 ) . The drilling conducted by Almaden allows for more detailed characterisation of the Upper Tamaulipas Formation carbonate units in the Tuligtic area . The sequence on the Project consists of clastic calcareous rocks . The limestone unit variably bedded, generally light grey but locally dark grey to black, with local chert rich sections graded into what have been named transition units and shale (also black shale) . The transition units are brown calcareous siltstones and grainstones . These rocks are not significant in the succession but mark the transition from limestone to underlying calcareous shale . Typical of the transition units are coarser grain sizes . The lower calcareous “shale” units exhibit pronounced laminated bedding and is typically dark grey to black in colour, although there are green coloured beds as well . The shale units appear to have been subjected to widespread calc - silicate alteration ( Figure 6 - 5 ) . Both the shale and transition units have very limited surface exposure and may be recessive . The entire carbonate package of rocks has been intensely deformed by the Laramide orogeny, showing complex thrusting and chevron folding in the hinge zones of a series of thrust - related east verging anticlines in the Ixtaca area (Tritlla et al . , 2004 ; Coller, 2011 ) . The calcareous shale units appear to occupy the cores of the anticlines while the thick bedded limestone units occupy the cores of major synclines identified in the Ixtaca zone . The Tamaulipas Formation carbonate rocks are intruded in the mid - Miocene by a series of magmatic rocks . The compositions are very variable, consisting of hornblende - biotite - bearing tonalites, quartz - plagioclase - hornblende diorites, and, locally, aphanitic diabase dykes (Carrasco - Nunez et al . , 1997 ) . In the central part of the Tuligtic Property porphyry mineralization is hosted by and associated with a hornblende - biotite - quartz phyric granodiorite body . The contact between the granodiorite and the limestone is marked by the development of a prograde skarn . In the Ixtaca deposit epithermal area of the Project, the limestone basement units are crosscut by intermediate dykes that are often intensely altered . In the vicinity of the Ixtaca zone these dykes are well mineralized especially at their contacts with limestone country rock . Petrography has shown that epithermal alteration in the dykes, marked by illite, adularia, quartz and pyrite overprints earlier calc - silicate endoskarn mineralogies (Leitch, 2011 ) . Two main orientations are identified for dykes in the Ixtaca area ; 060 degrees (parallel to the Main Ixtaca and Ixtaca North zones) and 330 degrees (parallel to the Chemalaco Zone) . An erosional unconformity surface has been formed subsequent to the intrusion of the porphyry mineralization - associated granodiorites . This paleo topographical surface locally approximates the current topography . Although not well exposed the unconformity is marked by depression localised accumulations of basal conglomerate comprised of intrusive and sedimentary boulders . Page 45
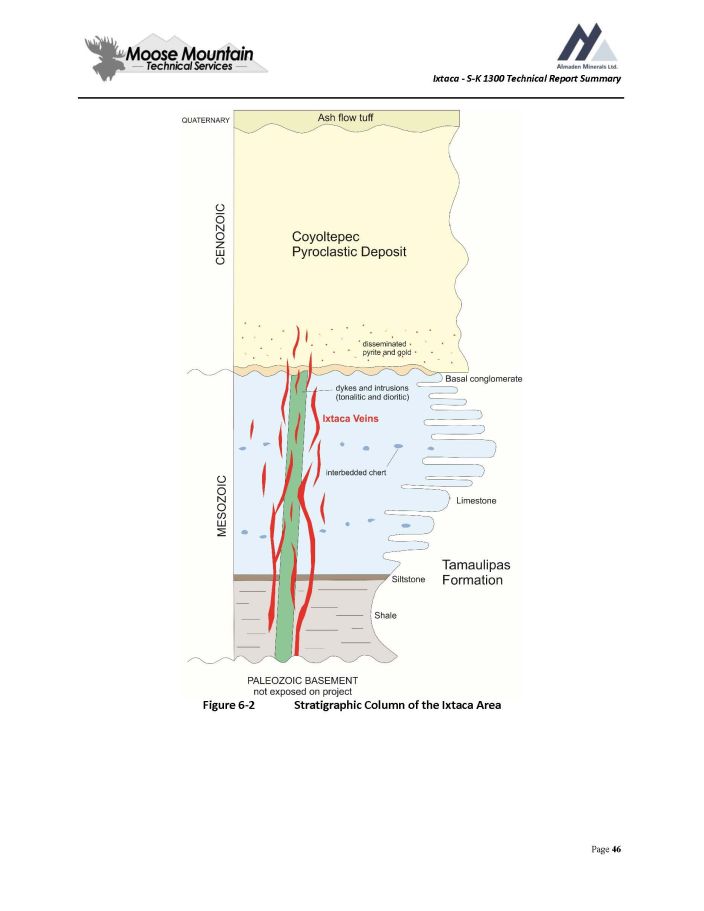
Ixtaca - S - K 1300 Technical Report Summary Figure 6 - 2 Stratigraphic Column of the Ixtaca Area Page 46
Ixtaca - S - K 1300 Technical Report Summary Figure 6 - 3 Geology of the Ixtaca Area Page 47

Ixtaca - S - K 1300 Technical Report Summary Figure 6 - 4 Chert Limestone This deformed Mesozoic sedimentary sequence is discordantly overlain by late Cenozoic extrusive rocks whose genetic and tectonic interrelations are yet to be fully explained . Two main volcaniclastic units are recognized in the area of Tuligtic : the Coyoltepec Pyroclastic deposit and the Xaltipan Ignimbrite (Carrasco - Nunez et al . , 1997 ) . Both units are covered by a thin (up to 1 m) quaternary ‘tegument’ (Morales - Ramirez 2002 ) of which only a few patches are left in the area of the Property, but it is still widespread in the surrounding areas . This tegument is unconsolidated and composed of a very recent ash fall tuff rich in heavy minerals (mainly magnetite, apatite, and pyroxene) . The extensively altered pre - mineral Coyoltepec pyroclastic deposit is divided by Carrasco - Nunez et al . ( 1997 ) into two subunits : the lower Coyoltepec subunit, which is not exposed in the area of the Project, consists of a stratified sequence of surge deposits and massive, moderately indurated pyroclastic flow deposits with minor amounts of pumice and altered lithic clasts . The upper Coyoltepec subunit, the main unit outcropping in the Tuligtic area, consists of a basal breccia or conglomerate overlain by bedded crystal tuff (volcanic) . The basal breccia is comprised of a lithic rhyolite tuff matrix composed of massive, indurated, coarse - gravel sized, lithic - rich pyroclastic flow deposits with pumice, andesitic fragments, free quartz, K - feldspar, plagioclase crystals, and minor amounts of limestone and shale clasts (Tritlla et al . , 2004 ) . The Coyoltepec volcanics (referred to as ash, volcanic and tuff) are altered and mineralized . Gold silver mineralization is marked by widespread disseminated pyrite and quartz - calcite veinlets . The Coyoltepec volcanics are locally oxidised and weathered near surface and along structures . Page 48
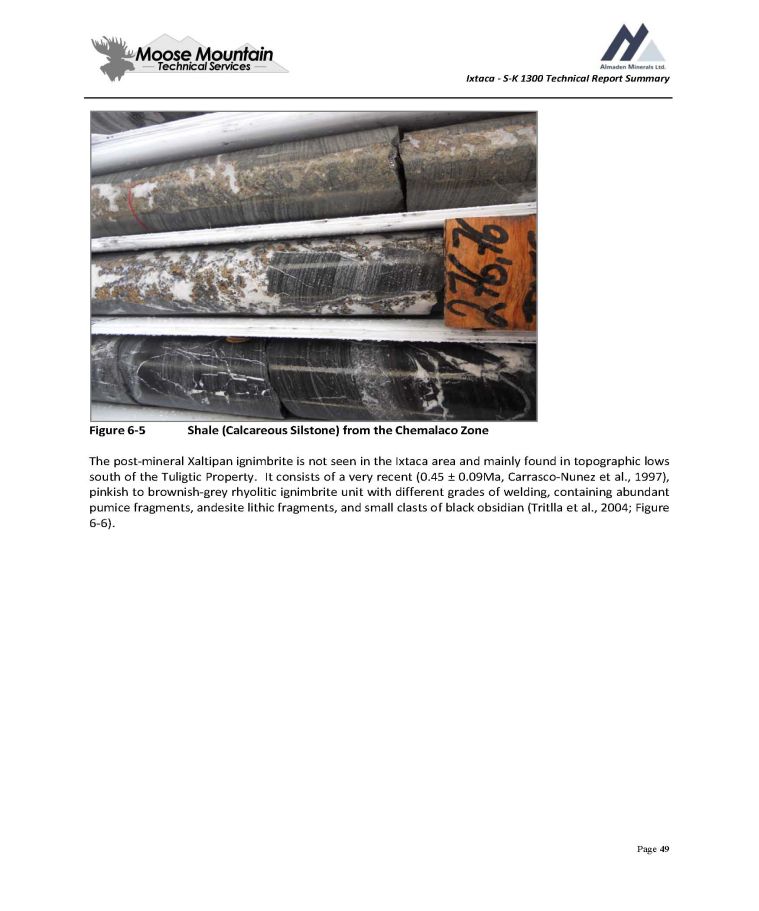
Ixtaca - S - K 1300 Technical Report Summary Figure 6 - 5 Shale (Calcareous Silstone) from the Chemalaco Zone The post - mineral Xaltipan ignimbrite is not seen in the Ixtaca area and mainly found in topographic lows south of the Tuligtic Property . It consists of a very recent ( 0 . 45 ц 0 . 09 Ma, Carrasco - Nunez et al . , 1997 ), pinkish to brownish - grey rhyolitic ignimbrite unit with different grades of welding, containing abundant pumice fragments, andesite lithic fragments, and small clasts of black obsidian (Tritlla et al . , 2004 ; Figure 6 - 6 ) . 109 Page 49
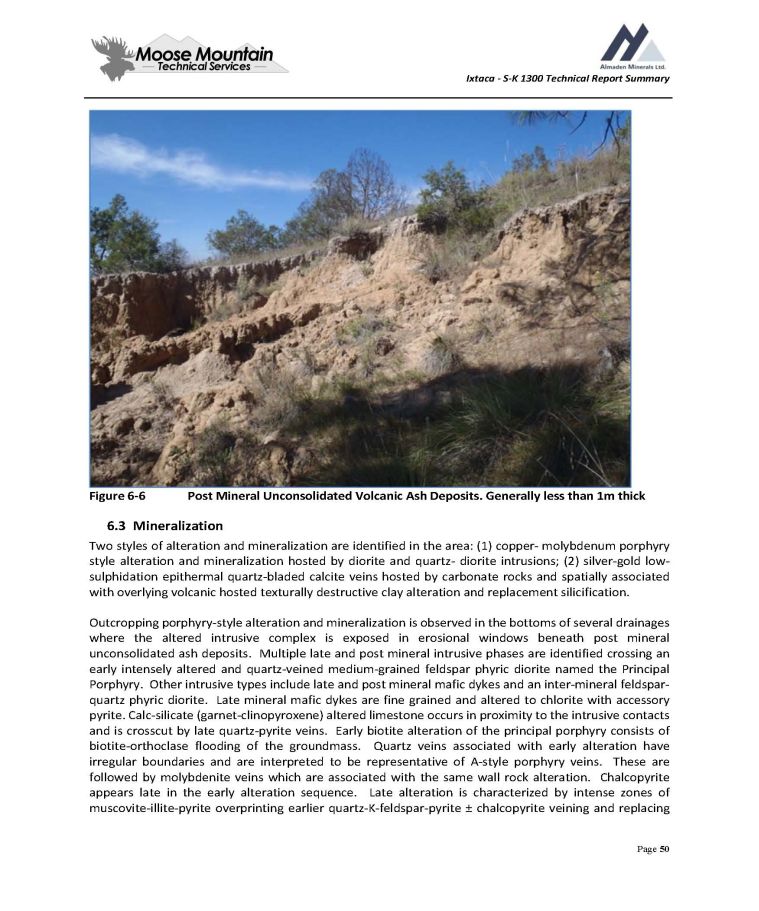
Ixtaca - S - K 1300 Technical Report Summary Figure 6 - 6 Post Mineral Unconsolidated Volcanic Ash Deposits . Generally less than 1 m thick 6 . 3 Mineralization Two styles of alteration and mineralization are identified in the area : ( 1 ) copper - molybdenum porphyry style alteration and mineralization hosted by diorite and quartz - diorite intrusions ; ( 2 ) silver - gold low - sulphidation epithermal quartz - bladed calcite veins hosted by carbonate rocks and spatially associated with overlying volcanic hosted texturally destructive clay alteration and replacement silicification . Outcropping porphyry - style alteration and mineralization is observed in the bottoms of several drainages where the altered intrusive complex is exposed in erosional windows beneath post mineral unconsolidated ash deposits . Multiple late and post mineral intrusive phases are identified crossing an early intensely altered and quartz - veined medium - grained feldspar phyric diorite named the Principal Porphyry . Other intrusive types include late and post mineral mafic dykes and an inter - mineral feldspar - quartz phyric diorite . Late mineral mafic dykes are fine grained and altered to chlorite with accessory pyrite . Calc - silicate (garnet - clinopyroxene) altered limestone occurs in proximity to the intrusive contacts and is crosscut by late quartz - pyrite veins . Early biotite alteration of the principal porphyry consists of biotite - orthoclase flooding of the groundmass . Quartz veins associated with early alteration have irregular boundaries and are interpreted to be representative of A - style porphyry veins . These are followed by molybdenite veins which are associated with the same wall rock alteration . Chalcopyrite appears late in the early alteration sequence . Late alteration is characterized by intense zones of muscovite - illite - pyrite overprinting earlier quartz - K - feldspar - pyrite ц chalcopyrite veining and replacing Page 50
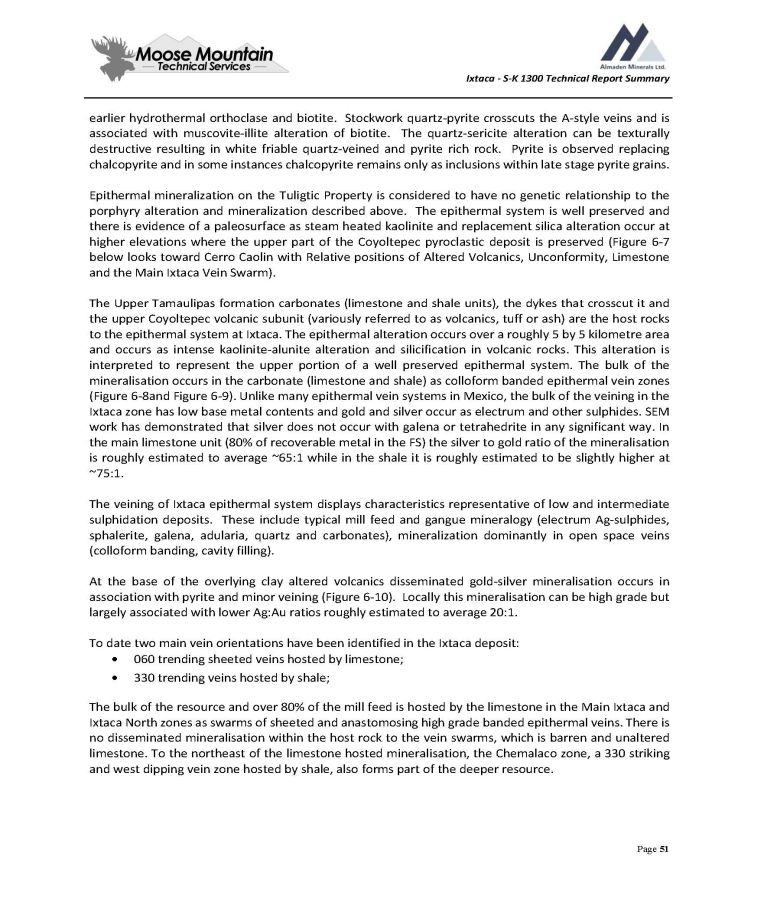
Ixtaca - S - K 1300 Technical Report Summary earlier hydrothermal orthoclase and biotite . Stockwork quartz - pyrite crosscuts the A - style veins and is associated with muscovite - illite alteration of biotite . The quartz - sericite alteration can be texturally destructive resulting in white friable quartz - veined and pyrite rich rock . Pyrite is observed replacing chalcopyrite and in some instances chalcopyrite remains only as inclusions within late stage pyrite grains . Epithermal mineralization on the Tuligtic Property is considered to have no genetic relationship to the porphyry alteration and mineralization described above . The epithermal system is well preserved and there is evidence of a paleosurface as steam heated kaolinite and replacement silica alteration occur at higher elevations where the upper part of the Coyoltepec pyroclastic deposit is preserved ( Figure 6 - 7 below looks toward Cerro Caolin with Relative positions of Altered Volcanics, Unconformity, Limestone and the Main Ixtaca Vein Swarm) . The Upper Tamaulipas formation carbonates (limestone and shale units), the dykes that crosscut it and the upper Coyoltepec volcanic subunit (variously referred to as volcanics, tuff or ash) are the host rocks to the epithermal system at Ixtaca . The epithermal alteration occurs over a roughly 5 by 5 kilometre area and occurs as intense kaolinite - alunite alteration and silicification in volcanic rocks . This alteration is interpreted to represent the upper portion of a well preserved epithermal system . The bulk of the mineralisation occurs in the carbonate (limestone and shale) as colloform banded epithermal vein zones ( Figure 6 - 8 and Figure 6 - 9 ) . Unlike many epithermal vein systems in Mexico, the bulk of the veining in the Ixtaca zone has low base metal contents and gold and silver occur as electrum and other sulphides . SEM work has demonstrated that silver does not occur with galena or tetrahedrite in any significant way . In the main limestone unit ( 80 % of recoverable metal in the FS) the silver to gold ratio of the mineralisation is roughly estimated to average ~ 65 : 1 while in the shale it is roughly estimated to be slightly higher at ~75:1. The veining of Ixtaca epithermal system displays characteristics representative of low and intermediate sulphidation deposits . These include typical mill feed and gangue mineralogy (electrum Ag - sulphides, sphalerite, galena, adularia, quartz and carbonates), mineralization dominantly in open space veins (colloform banding, cavity filling) . At the base of the overlying clay altered volcanics disseminated gold - silver mineralisation occurs in association with pyrite and minor veining ( Figure 6 - 10 ) . Locally this mineralisation can be high grade but largely associated with lower Ag : Au ratios roughly estimated to average 20 : 1 . To date two main vein orientations have been identified in the Ixtaca deposit: 060 trending sheeted veins hosted by limestone; 330 trending veins hosted by shale; The bulk of the resource and over 80 % of the mill feed is hosted by the limestone in the Main Ixtaca and Ixtaca North zones as swarms of sheeted and anastomosing high grade banded epithermal veins . There is no disseminated mineralisation within the host rock to the vein swarms, which is barren and unaltered limestone . To the northeast of the limestone hosted mineralisation, the Chemalaco zone, a 330 striking and west dipping vein zone hosted by shale, also forms part of the deeper resource . Page 51
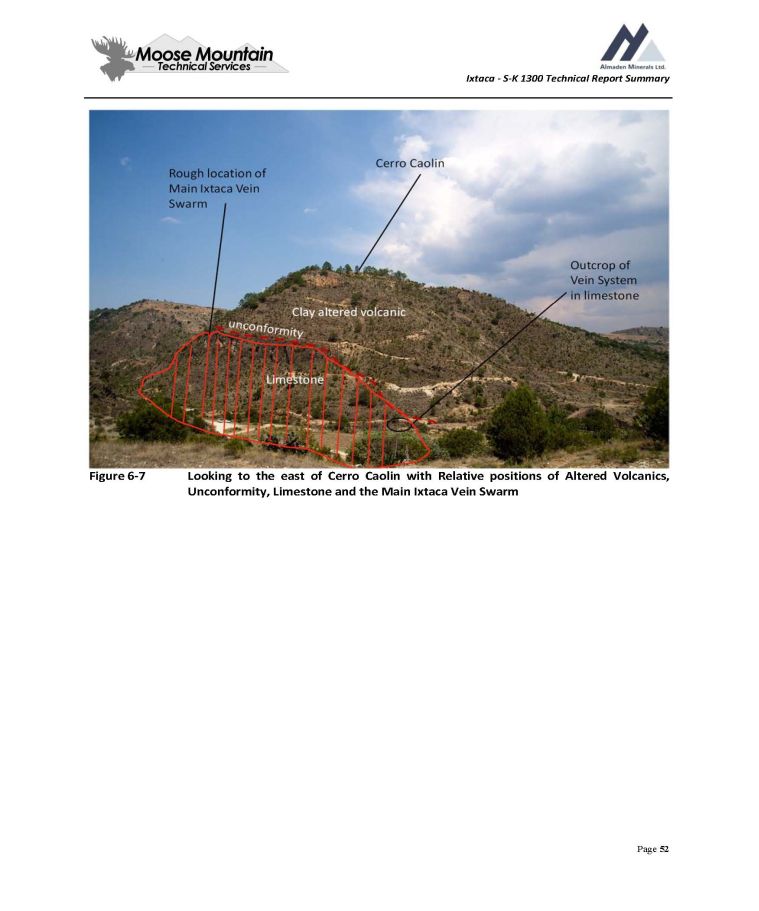
Ixtaca - S - K 1300 Technical Report Summary Figure 6 - 7 Looking to the east of Cerro Caolin with Relative positions of Altered Volcanics, Unconformity, Limestone and the Main Ixtaca Vein Swarm Outcrop of Vein System in limestone Clay altered volcanic Limestone Cerro Caolin Rough location of Main Ixtaca Vein Swarm Page 52
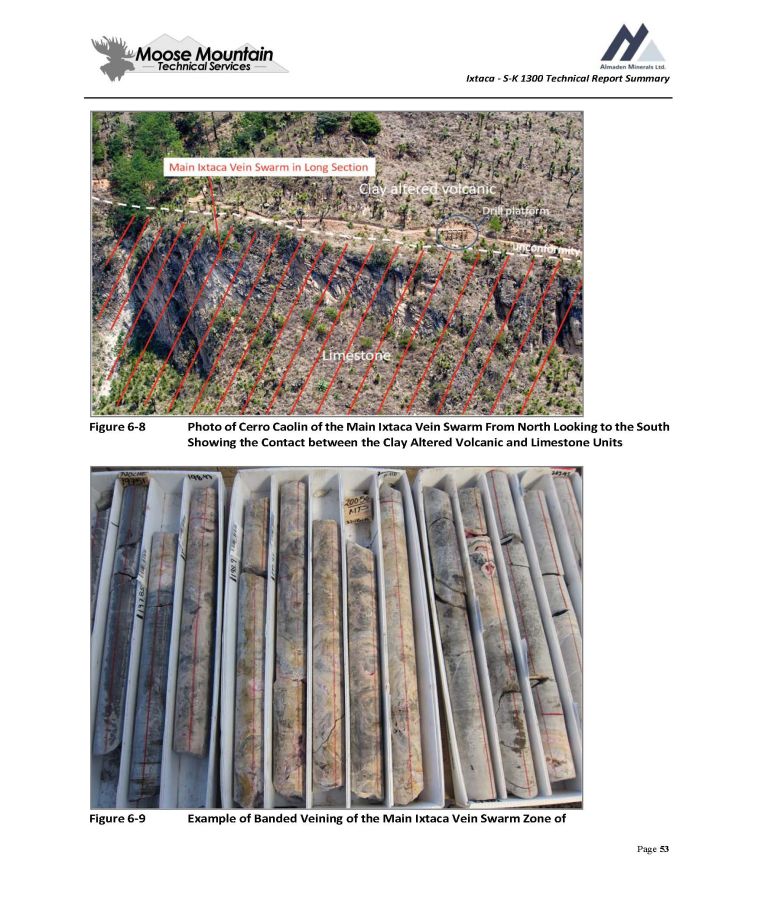
Ixtaca - S - K 1300 Technical Report Summary Figure 6 - 8 Photo of Cerro Caolin of the Main Ixtaca Vein Swarm From North Looking to the South Showing the Contact between the Clay Altered Volcanic and Limestone Units Figure 6 - 9 Example of Banded Veining of the Main Ixtaca Vein Swarm Zone of Clay altered volcanic Drill platform Limestone 59 Main Ixtaca Vein Swarm in Long Section Page 53

Ixtaca - S - K 1300 Technical Report Summary The Main Ixtaca and Ixtaca North vein swarms are spatially associated with two altered and mineralised sub parallel ENE ( 060 degrees) trending, sub - vertical to steeply north dipping dyke zones . The Main Ixtaca dyke zone is approximately 100 m wide and consists of a series of 2 m to over 20 m true width dykes . The Ixtaca North dyke zone is narrower and comprises a steeply north - dipping zone of two or three discrete dykes ranging from 5 to 20 m in width . Individual veins and veinlets within the Main Ixtaca and Ixtaca North vein swarm zones cannot be separately modelled . Wireframes were created that constrain the higher grade, more densely veined areas, however as the vein swarms are anastomosing and sheeted in nature, therefore these wireframes include significant barren limestone material enclosed by veins within the vein swarm (See Figure 6 - 11 ) . The Main and North zones have been defined over 650 m and tested over 1000 m strike length with high - grade mineralization intersected to depths up to 350 m vertically from surface . In 2016 Almaden conducted a drill program to test for additional veins to the north of the Ixtaca North Zone . This program resulted in better definition of the Ixtaca North zone and was successfully demonstrated that limestone mineralization remains open to the north and at depth . The Chemalaco Zone dips moderately - steeply at approximately 22 degrees to the WSW . The strike length of the Chemalaco Zone has been extended to 450 m with high - grade mineralization intersected to a vertical depth of 550 m, or approximately 700 m down - dip . An additional sub - parallel zone has been defined underneath the Chemalaco Zone dipping 25 to 50 degrees to the WSW, intersected to a vertical depth of 250 m, approximately 400 m down - dip over a 250 m strike length . The Chemalaco zone remains open to depth and along strike to the northwest . Additional parallel veins further to the east have been identified in core and the zone is remains open in this direction as well . In the Chemalaco zone, assays indicate that, while mineralisation appears similar in core, higher silver grades occur in the upper portion of the drilled area and higher gold grades occur at depth . The Main Ixtaca, Ixtaca North and Chemalaco vein zones are largely concealed by overlying altered volcanic rocks although the limestone and Main Ixtaca zone of veining does crop out on the west side of Cerro Caolin, the hill under which the Main Ixtaca Zone occurs . The volcanics above the Main Ixtaca Zone are intensely clay altered and locally silicified but barren of significant gold and silver at surface . The Cerro Caolin volcanic hosted clay alteration zone extends to the SE roughly one kilometer and represents a significant drill target . Page 54
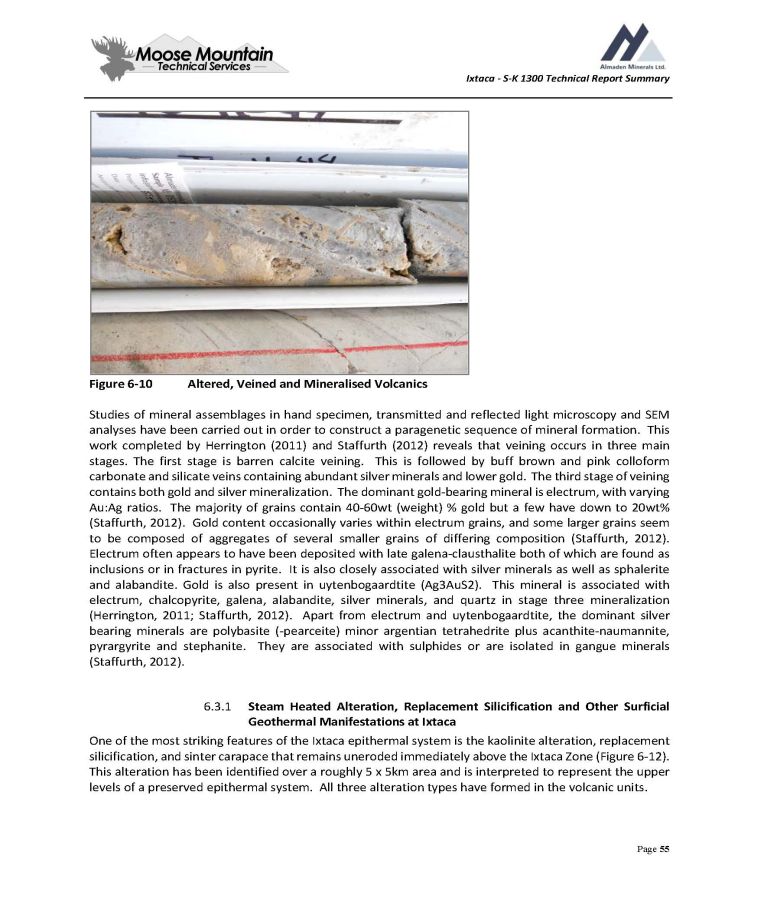
Ixtaca - S - K 1300 Technical Report Summary Figure 6 - 10 Altered, Veined and Mineralised Volcanics Studies of mineral assemblages in hand specimen, transmitted and reflected light microscopy and SEM analyses have been carried out in order to construct a paragenetic sequence of mineral formation . This work completed by Herrington ( 2011 ) and Staffurth ( 2012 ) reveals that veining occurs in three main stages . The first stage is barren calcite veining . This is followed by buff brown and pink colloform carbonate and silicate veins containing abundant silver minerals and lower gold . The third stage of veining contains both gold and silver mineralization . The dominant gold - bearing mineral is electrum, with varying Au : Ag ratios . The majority of grains contain 40 - 60 wt (weight) % gold but a few have down to 20 wt % (Staffurth, 2012 ) . Gold content occasionally varies within electrum grains, and some larger grains seem to be composed of aggregates of several smaller grains of differing composition (Staffurth, 2012 ) . Electrum often appears to have been deposited with late galena - clausthalite both of which are found as inclusions or in fractures in pyrite . It is also closely associated with silver minerals as well as sphalerite and alabandite . Gold is also present in uytenbogaardtite (Ag 3 AuS 2 ) . This mineral is associated with electrum, chalcopyrite, galena, alabandite, silver minerals, and quartz in stage three mineralization (Herrington, 2011 ; Staffurth, 2012 ) . Apart from electrum and uytenbogaardtite, the dominant silver bearing minerals are polybasite ( - pearceite) minor argentian tetrahedrite plus acanthite - naumannite, pyrargyrite and stephanite . They are associated with sulphides or are isolated in gangue minerals (Staffurth, 2012 ) . 6 . 3 . 1 Steam Heated Alteration, Replacement Silicification and Other Surficial Geothermal Manifestations at Ixtaca One of the most striking features of the Ixtaca epithermal system is the kaolinite alteration, replacement silicification, and sinter carapace that remains uneroded immediately above the Ixtaca Zone ( Figure 6 - 12 ) . This alteration has been identified over a roughly 5 x 5 km area and is interpreted to represent the upper levels of a preserved epithermal system . All three alteration types have formed in the volcanic units . Page 55
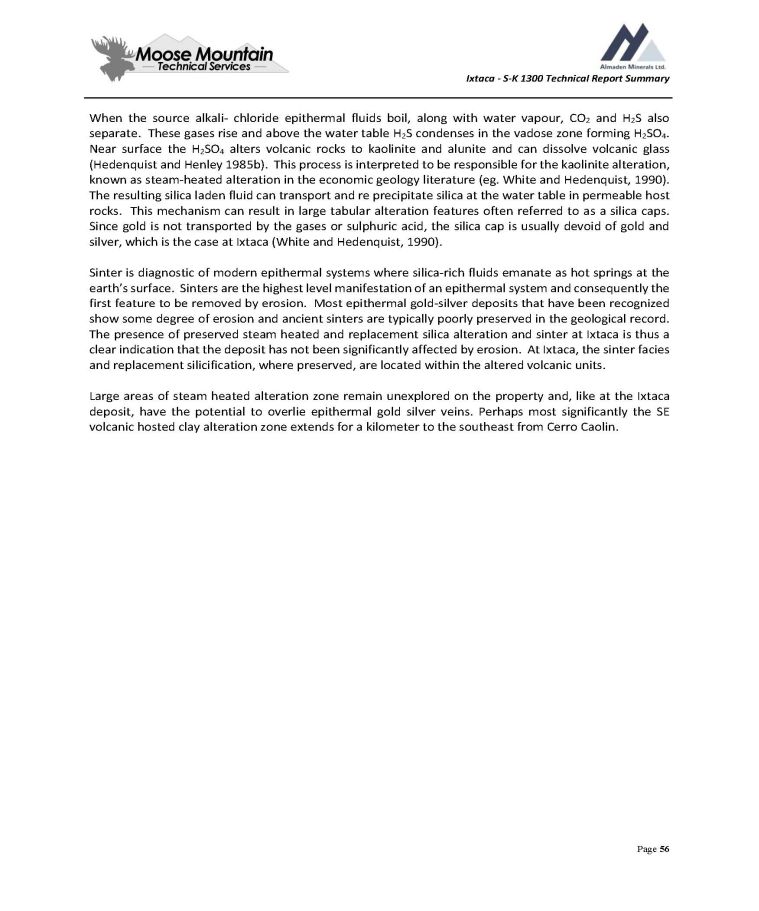
Ixtaca - S - K 1300 Technical Report Summary When the source alkali - chloride epithermal fluids boil, along with water vapour, CO 2 and H 2 S also separate . These gases rise and above the water table H 2 S condenses in the vadose zone forming H 2 SO 4 . Near surface the H 2 SO 4 alters volcanic rocks to kaolinite and alunite and can dissolve volcanic glass (Hedenquist and Henley 1985 b) . This process is interpreted to be responsible for the kaolinite alteration, known as steam - heated alteration in the economic geology literature (eg . White and Hedenquist, 1990 ) . The resulting silica laden fluid can transport and re precipitate silica at the water table in permeable host rocks . This mechanism can result in large tabular alteration features often referred to as a silica caps . Since gold is not transported by the gases or sulphuric acid, the silica cap is usually devoid of gold and silver, which is the case at Ixtaca (White and Hedenquist, 1990 ) . Sinter is diagnostic of modern epithermal systems where silica - rich fluids emanate as hot springs at the earth’s surface . Sinters are the highest level manifestation of an epithermal system and consequently the first feature to be removed by erosion . Most epithermal gold - silver deposits that have been recognized show some degree of erosion and ancient sinters are typically poorly preserved in the geological record . The presence of preserved steam heated and replacement silica alteration and sinter at Ixtaca is thus a clear indication that the deposit has not been significantly affected by erosion . At Ixtaca, the sinter facies and replacement silicification, where preserved, are located within the altered volcanic units . Large areas of steam heated alteration zone remain unexplored on the property and, like at the Ixtaca deposit, have the potential to overlie epithermal gold silver veins . Perhaps most significantly the SE volcanic hosted clay alteration zone extends for a kilometer to the southeast from Cerro Caolin . Page 56
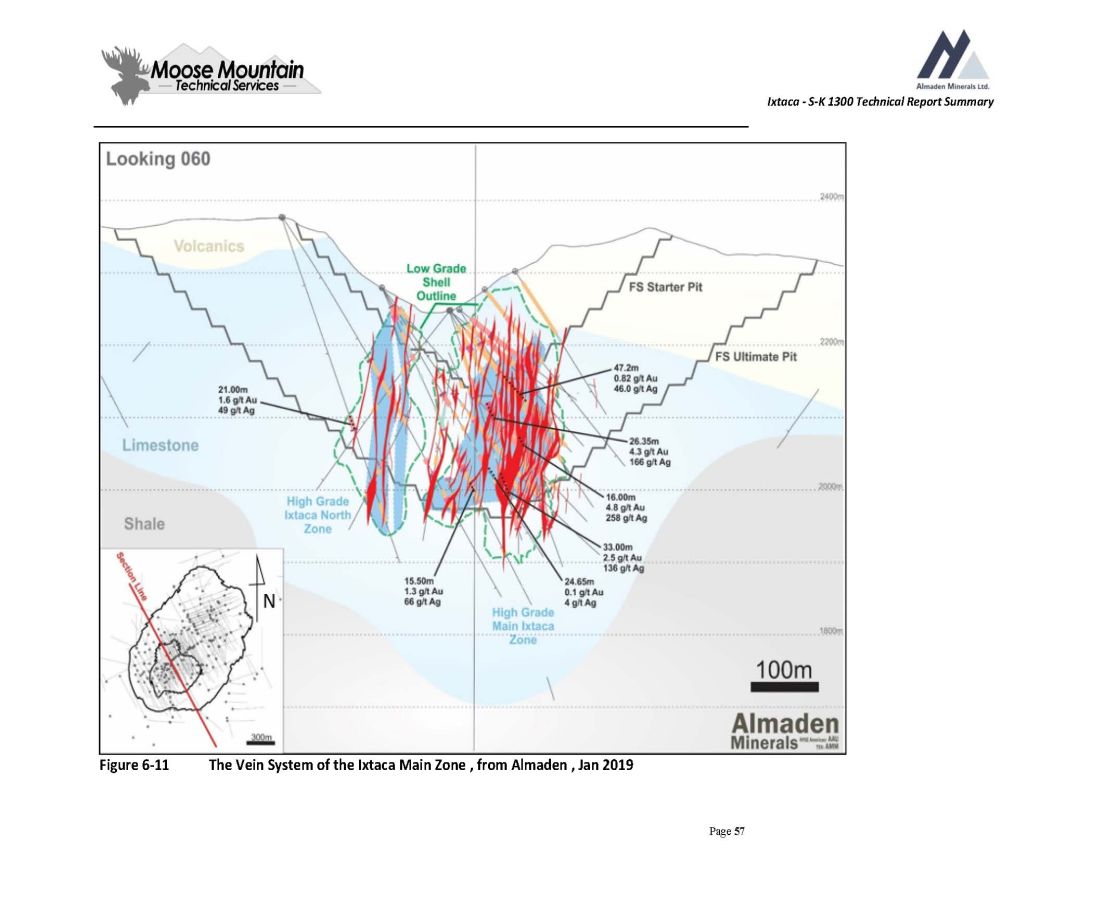
Ixtaca - S - K 1300 Technical Report Summary Figure 6 - 11 The Vein System of the Ixtaca Main Zone , from Almaden , Jan 2019 Page 57
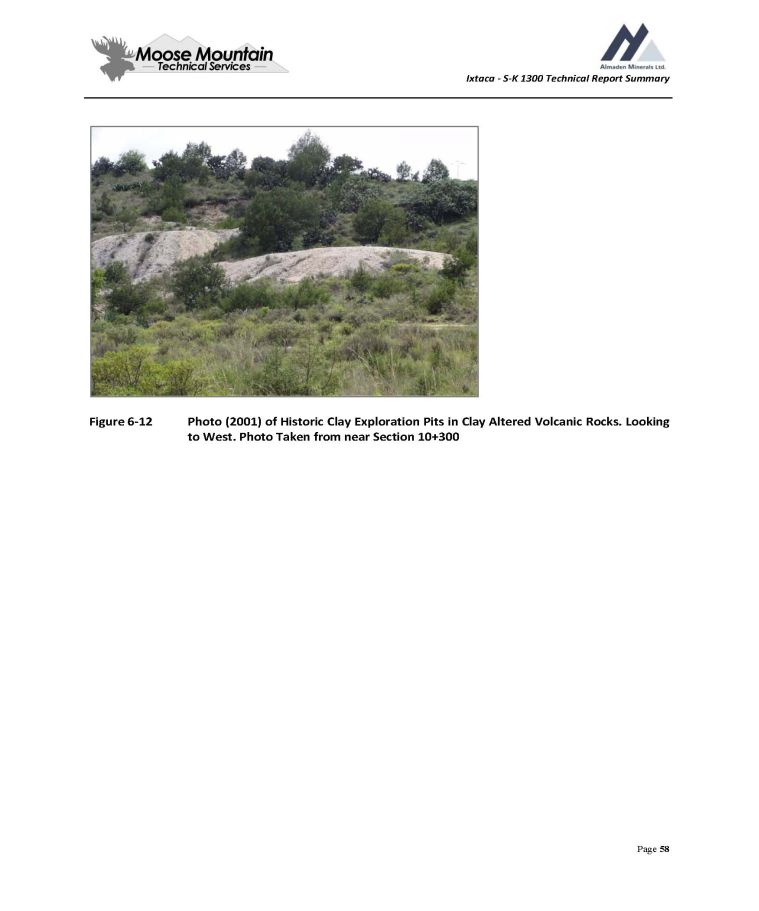
Ixtaca - S - K 1300 Technical Report Summary Figure 6 - 12 Photo (2001) of Historic Clay Exploration Pits in Clay Altered Volcanic Rocks. Looking to West. Photo Taken from near Section 10+300 Page 58
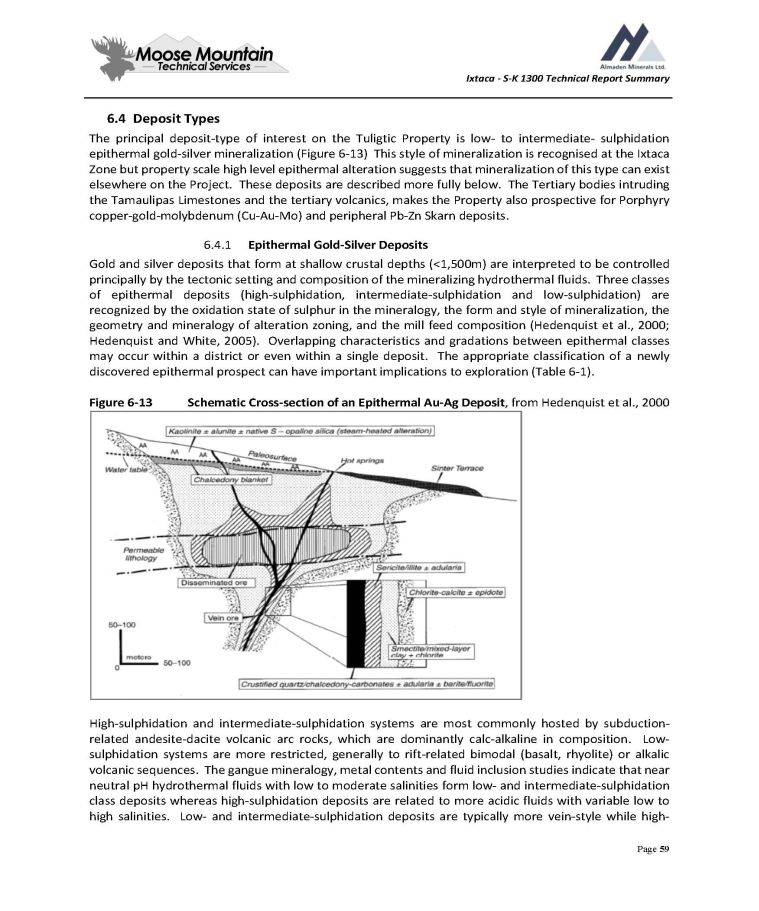
Ixtaca - S - K 1300 Technical Report Summary 4. Deposit Types The principal deposit - type of interest on the Tuligtic Property is low - to intermediate - sulphidation epithermal gold - silver mineralization ( Figure 6 - 13 ) This style of mineralization is recognised at the Ixtaca Zone but property scale high level epithermal alteration suggests that mineralization of this type can exist elsewhere on the Project . These deposits are described more fully below . The Tertiary bodies intruding the Tamaulipas Limestones and the tertiary volcanics, makes the Property also prospective for Porphyry copper - gold - molybdenum (Cu - Au - Mo) and peripheral Pb - Zn Skarn deposits . 1. Epithermal Gold - Silver Deposits Gold and silver deposits that form at shallow crustal depths (< 1 , 500 m) are interpreted to be controlled principally by the tectonic setting and composition of the mineralizing hydrothermal fluids . Three classes of epithermal deposits (high - sulphidation, intermediate - sulphidation and low - sulphidation) are recognized by the oxidation state of sulphur in the mineralogy, the form and style of mineralization, the geometry and mineralogy of alteration zoning, and the mill feed composition (Hedenquist et al . , 2000 ; Hedenquist and White, 2005 ) . Overlapping characteristics and gradations between epithermal classes may occur within a district or even within a single deposit . The appropriate classification of a newly discovered epithermal prospect can have important implications to exploration ( Table 6 - 1 ) . Figure 6 - 13 Schematic Cross - section of an Epithermal Au - Ag Deposit , from Hedenquist et al . , 2000 High - sulphidation and intermediate - sulphidation systems are most commonly hosted by subduction - related andesite - dacite volcanic arc rocks, which are dominantly calc - alkaline in composition . Low - sulphidation systems are more restricted, generally to rift - related bimodal (basalt, rhyolite) or alkalic volcanic sequences . The gangue mineralogy, metal contents and fluid inclusion studies indicate that near neutral pH hydrothermal fluids with low to moderate salinities form low - and intermediate - sulphidation class deposits whereas high - sulphidation deposits are related to more acidic fluids with variable low to high salinities . Low - and intermediate - sulphidation deposits are typically more vein - style while high - Page 59
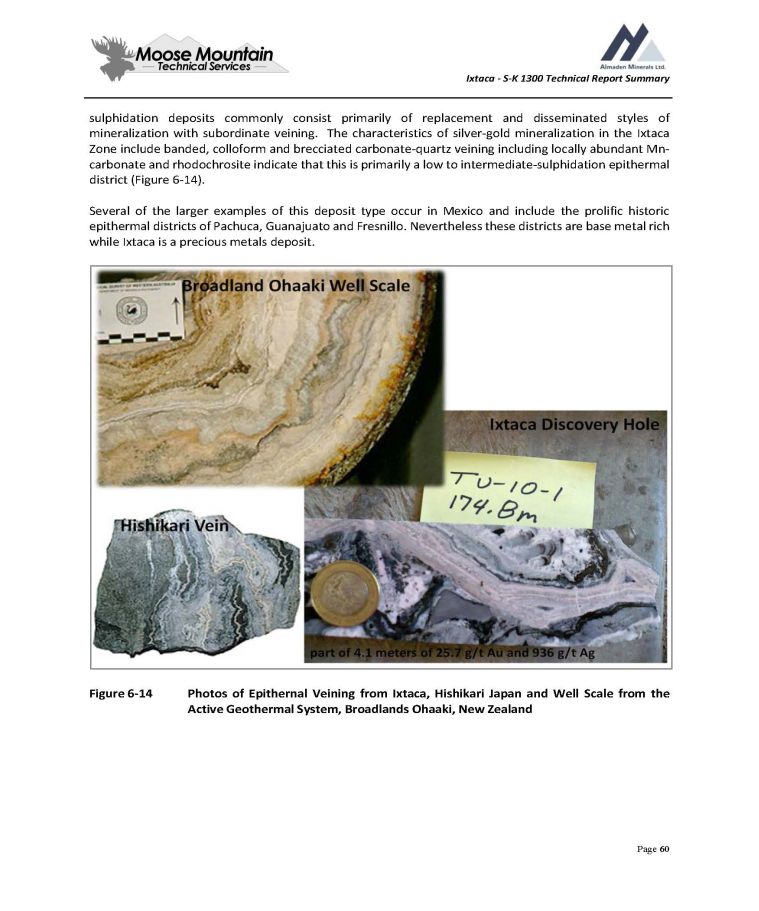
Ixtaca - S - K 1300 Technical Report Summary sulphidation deposits commonly consist primarily of replacement and disseminated styles of mineralization with subordinate veining . The characteristics of silver - gold mineralization in the Ixtaca Zone include banded, colloform and brecciated carbonate - quartz veining including locally abundant Mn - carbonate and rhodochrosite indicate that this is primarily a low to intermediate - sulphidation epithermal district ( Figure 6 - 14 ) . Several of the larger examples of this deposit type occur in Mexico and include the prolific historic epithermal districts of Pachuca, Guanajuato and Fresnillo . Nevertheless these districts are base metal rich while Ixtaca is a precious metals deposit . Figure 6 - 14 Photos of Epithernal Veining from Ixtaca, Hishikari Japan and Well Scale from the Active Geothermal System, Broadlands Ohaaki, New Zealand B B r r o o a a d d l l a a n n d d O O h h a a a a k k i i W W e e l l l l S S c c a a l l e e Ixtaca Discovery Hole Hishikari Vein part of 4.1 meters of 25.7 g/t Au and 936 g/t Ag Page 60
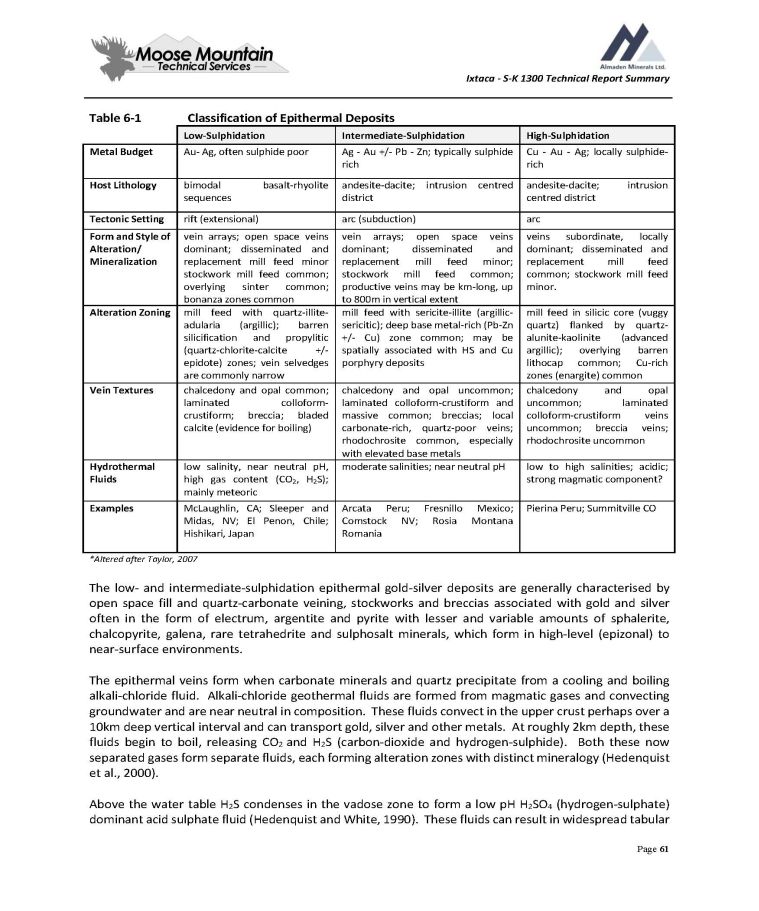
Ixtaca - S - K 1300 Technical Report Summary Table 6 - 1 Page 61 Classification of Epithermal Deposits High - Sulphidation Intermediate - Sulphidation Low - Sulphidation Cu - Au - Ag; locally sulphide - rich Ag - Au +/ - Pb - Zn; typically sulphide rich Au - Ag, often sulphide poor Metal Budget intrusion andesite - dacite; centred district andesite - dacite; intrusion centred district basalt - rhyolite bimodal sequences Host Lithology arc arc (subduction) rift (extensional) Tectonic Setting veins subordinate, locally dominant ; disseminated and replacement mill feed common ; stockwork mill feed minor . vein arrays ; open space veins dominant ; disseminated and replacement mill feed minor ; stockwork mill feed common ; productive veins may be km - long, up to 800 m in vertical extent vein arrays ; open space veins dominant ; disseminated and replacement mill feed minor stockwork mill feed common ; overlying sinter common ; bonanza zones common Form and Style of Alteration/ Mineralization mill feed in silicic core (vuggy quartz) flanked by quartz - alunite - kaolinite (advanced argillic) ; overlying barren lithocap common ; Cu - rich zones (enargite) common mill feed with sericite - illite (argillic - sericitic); deep base metal - rich (Pb - Zn +/ - Cu) zone common; may be spatially associated with HS and Cu porphyry deposits mill feed with quartz - illite - adularia (argillic) ; barren silicification and propylitic (quartz - chlorite - calcite +/ - epidote) zones ; vein selvedges are commonly narrow Alteration Zoning chalcedony and opal uncommon ; laminated colloform - crustiform veins uncommon ; breccia veins ; rhodochrosite uncommon chalcedony and opal uncommon ; laminated colloform - crustiform and massive common ; breccias ; local carbonate - rich, quartz - poor veins ; rhodochrosite common, especially with elevated base metals chalcedony and opal common ; laminated colloform - crustiform ; breccia ; bladed calcite (evidence for boiling) Vein Textures low to high salinities; acidic; strong magmatic component? moderate salinities; near neutral pH low salinity, near neutral pH, high gas content (CO 2 , H 2 S) ; mainly meteoric Hydrothermal Fluids Pierina Peru; Summitville CO Mexico; Montana Fresnillo Rosia Arcata Peru; Comstock NV; Romania McLaughlin, CA ; Sleeper and Midas, NV ; El Penon, Chile ; Hishikari, Japan Examples *Altered after Taylor, 2007 The low - and intermediate - sulphidation epithermal gold - silver deposits are generally characterised by open space fill and quartz - carbonate veining, stockworks and breccias associated with gold and silver often in the form of electrum, argentite and pyrite with lesser and variable amounts of sphalerite, chalcopyrite, galena, rare tetrahedrite and sulphosalt minerals, which form in high - level (epizonal) to near - surface environments . The epithermal veins form when carbonate minerals and quartz precipitate from a cooling and boiling alkali - chloride fluid . Alkali - chloride geothermal fluids are formed from magmatic gases and convecting groundwater and are near neutral in composition . These fluids convect in the upper crust perhaps over a 10 km deep vertical interval and can transport gold, silver and other metals . At roughly 2 km depth, these fluids begin to boil, releasing CO 2 and H 2 S (carbon - dioxide and hydrogen - sulphide) . Both these now separated gases form separate fluids, each forming alteration zones with distinct mineralogy (Hedenquist et al . , 2000 ) . Above the water table H 2 S condenses in the vadose zone to form a low pH H 2 SO 4 (hydrogen - sulphate) dominant acid sulphate fluid (Hedenquist and White, 1990 ) . These fluids can result in widespread tabular

Ixtaca - S - K 1300 Technical Report Summary steam - heated alteration zones dominated by fine grained and friable kaolinite and alunite . Steam - heated waters collect at the water table and create aquifer - controlled strataform blankets of dense silicification known as silica caps (Shoenet al . , 1974 ; Hedenquist et al . , 2000 ) . Since gold is not transported by the gases or sulphuric acid, the silica cap and overlying kaolinite alteration is usually devoid of gold and silver (Hedenquist et al . 2000 ) . Bicarbonate fluids are the result of the condensation of CO 2 in meteoric water . These fluids are also barren of gold and silver and generally form carbonate dominated alteration on the margins of the geothermal cell . As the source alkali chloride fluids boil and cool quartz and carbonate deposit in the fractures along which the fluids are ascending to form banded carbonate - quartz veins . Gold and silver present within the fluid also precipitate in response to the boiling of the fluid . Potassium - feldspar adularia is also a common mineral that deposits in the veins in response to boiling . As carbonate and quartz precipitates individual fractures can be sealed and the boiling fluid must then find another weak feature to continue rising . Gases which accumulate beneath the sealed fracture causes the pressure to increase until the seal is broken . This results in a substantial change in pressure, which propagates catastrophic boiling in turn causing gold, bladed calcite, and amorphous silica to precipitate rapidly . Once the fluids return to equilibrium the quartz crystals again precipitate under passive conditions and seal the vein again until the process recurs . This episodic sealing and fracturing results in the banded textures common in these vein systems . Mill feed zones are typically localized in structures, but may occur in permeable lithologies . Upward - flaring mill feed zones centred on structurally controlled hydrothermal conduits are typical . Large (bigger than 1 m wide and hundreds of metres in strike length) to small veins and stockworks are common with lesser disseminations and replacements . Vein systems can be laterally extensive but mill feed shoots have relatively restricted vertical extent . High - grade ores are commonly found in dilational zones in faults at flexures, splays and in stockworks . These deposits form in both subaerial, predominantly felsic, volcanic fields in extensional and strike - slip structural regimes and island arc or continental andesitic stratovolcanoes above active subduction zones . Near - surface hydrothermal systems, ranging from hot spring at surface to deeper, structurally and permeability focused fluid flow zones are the sites of mineralization . The mill feed fluids are relatively dilute and cool solutions that are mixtures of magmatic and meteoric fluids . Mineral deposition takes place as the solutions undergo cooling and degassing by fluid mixing, boiling and decompression . 6 . 4 . 2 The Ixtaca Zone Epithermal System The epithermal veining at the Ixtaca deposit occurs largely as vein swarms in the host carbonate rocks . Veins also occur in the overlying altered volcanics but the volcanic mineralisation is largely disseminated in nature . Fluid flow is interpreted to have been restricted to fractures in the basement carbonate units, forming veins . In the more permeable volcanic units above fluids appear to have dispersed forming lower grade mineralisation associated with disseminated pyrite ( Figure 6 - 13 ) . The bulk of the epithermal veining in the Ixtaca deposit occurs as subparallel branching veins and veinlets and local stockworks called vein swarms ( Figure 6 - 15 ) . This is common for epithermal vein systems that occur in brittle lithologies like the limestone host rock at Ixtaca . Similar vein swarms occur and have been Page 62
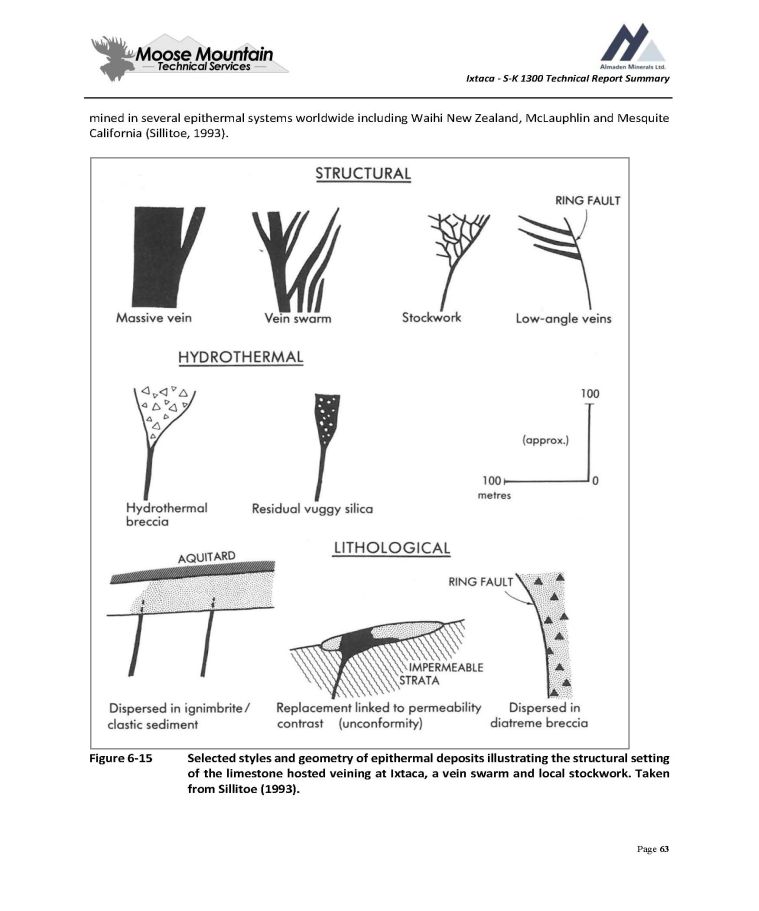
Ixtaca - S - K 1300 Technical Report Summary mined in several epithermal systems worldwide including Waihi New Zealand, McLauphlin and Mesquite California (Sillitoe, 1993). Figure 6 - 15 Selected styles and geometry of epithermal deposits illustrating the structural setting of the limestone hosted veining at Ixtaca, a vein swarm and local stockwork . Taken from Sillitoe ( 1993 ) . Page 63
Ixtaca - S - K 1300 Technical Report Summary 6 . 4 . 3 Porphyry Copper - Gold - Molybdenum and Lead - Zinc Skarn Deposits In Porphyry Cu - Au - Mo deposit types, stockworks of quartz veinlets, quartz veins, closely spaced fractures, and breccias containing pyrite and chalcopyrite with lesser molybdenite, bornite and magnetite occur in large zones of economically bulk - mineable mineralization in or adjoining porphyritic intrusions and related breccia bodies . Disseminated sulphide minerals are present, generally in subordinate amounts . The mineralization is spatially, temporally and genetically associated with hydrothermal alteration of the host rock intrusions and wall rocks . These deposit types are commonly found in orogenic belts at convergent plate boundaries, commonly linked to subduction - related magmatism . They also occur in association with emplacement of high - level stocks during extensional tectonism related to strike - slip faulting and back - arc spreading following continent margin accretion (Panteleyev, 1995 ) . Many Au skarns are related to plutons formed during oceanic plate subduction, and there is a worldwide spatial, temporal and genetic association between porphyry Cu provinces and calcic Au skarns . The Au skarns are divided into two types . Pyroxene - rich Au skarns tend to be hosted by siltstone - dominant packages and form in hydrothermal systems that are sulphur - rich and relatively reduced . Garnet - rich Au skarns tend to be hosted by carbonate - dominant packages and develop in more oxidizing and/or more sulphur - poor hydrothermal systems . The gold is commonly present as micron - sized inclusions in sulphides, or at sulphide grain boundaries . To the naked eye, mill feed is generally indistinguishable from waste rock . Due to the poor correlation between Au and Cu in some Au skarns, the economic potential of a prospect can be overlooked if Cu - sulphide - rich outcrops are preferentially sampled and other sulphide - bearing or sulphide - lean assemblages are ignored (Ray, 1998 ) . Page 64
Ixtaca - S - K 1300 Technical Report Summary 1. Exploration The information in this section was drawn from the most recent major study prepared entitled “The Ixtaca Gold - Silver Project Puebla State, Mexico NI 43 - 101 Technical Report on the Feasibility Study” dated January 24 th 2019 and updated October 3 , 2019 . Between 2004 and 2017 , Almaden’s exploration at the Tuligtic Property has included ASTER satellite hydroxyl alteration studies, surface lithology and alteration mapping, rock and soil geochemical sampling, ground magnetics, IP and resistivity, Controlled Source Audio - frequency Magnetotelluric (CSAMT), and Controlled Source Induced Polarization (CSIP) geophysical surveys . The work to date has resulted in the identification of eight anomalous areas : the Ixtaca, SE Clay Alteration, Tano, Ixtaca East, Caleva, Azul West, Azul and Sol zones ( Figure 6 - 3 and Figure 7 - 2 , Figure 7 - 3 ) . Detailed exploration results for the Tuligtic Property have been disclosed in a previous Technical Report for the Tuligtic Property by Raffle et al . ( 2013 ) and are summarized below . 1. Surface Exploration Work 1. Rock Geochemistry B Between 2004 and 2017 a total of 654 rock geochemical samples have been collected on the Property over a 6 x 6 km area ( Figure 7 - 2 ) . Rock sampling, guided by concurrent soil geochemical surveys, has been concentrated around the Ixtaca Zone and an area extending 4 km to the NNE over the copper porphyry target located between the Caleva and Azul zone soil geochemical anomalies ( Figure 6 - 3 , Figure 7 - 2 , Figure 7 - 3 ) . Rock grab samples collected by Almaden are from both representative and apparently mineralized lithologies in outcrop, talus and transported boulders within creeks throughout the Property . Rock samples ranging from 0 . 5 to 2 . 5 kilograms (kg) in weight and are placed in uniquely labelled poly samples bags and their locations are recorded using handheld GPS accurate to plus or minus 5 m accuracy . Of the 654 rock grab samples collected, a total of 53 samples returned assays of greater than 100 parts - per - billion (ppb) gold (Au), and up to 6 . 14 grams - per - tonne (g/t) Au . A total of 52 rock samples returned assays of greater than 10 g/t silver (Ag) and up to 600 g/t Ag . Gold and silver mineralization occurs within the Ixtaca Zone, and is associated with anomalous arsenic, mercury ( ц antimony) . To the northeast of the Ixtaca Zone zinc, copper and locally anomalous gold, silver and lead ( ц arsenic) values occur in association with calc - silicate skarn and altered intrusive rocks . Basement carbonate units, altered intrusive, and locally calc - silicate skarn mineralization occur as erosional windows beneath altered and locally mineralised volcanic . Surface mineralization at the Ixtaca Zone occurs as limestone boulders containing quartz vein fragments and high level epithermal alteration within overlying volcanic rocks as well several small outcrops of epithermal veined limestone . Epithermal alteration and mineralization is observed overprinting earlier skarn and porphyry style alteration and mineralization . Numerous small skarn - related showings exist at the north end Project . Near the Caleva soil anomaly, a small ( 200 x 100 m)skarn zone hosts sphalerite, galena and chalcopyrite quartz vein stockwork mineralization along the contact zone between limestone and altered and mineralized intrusive rocks to the east . Page 65
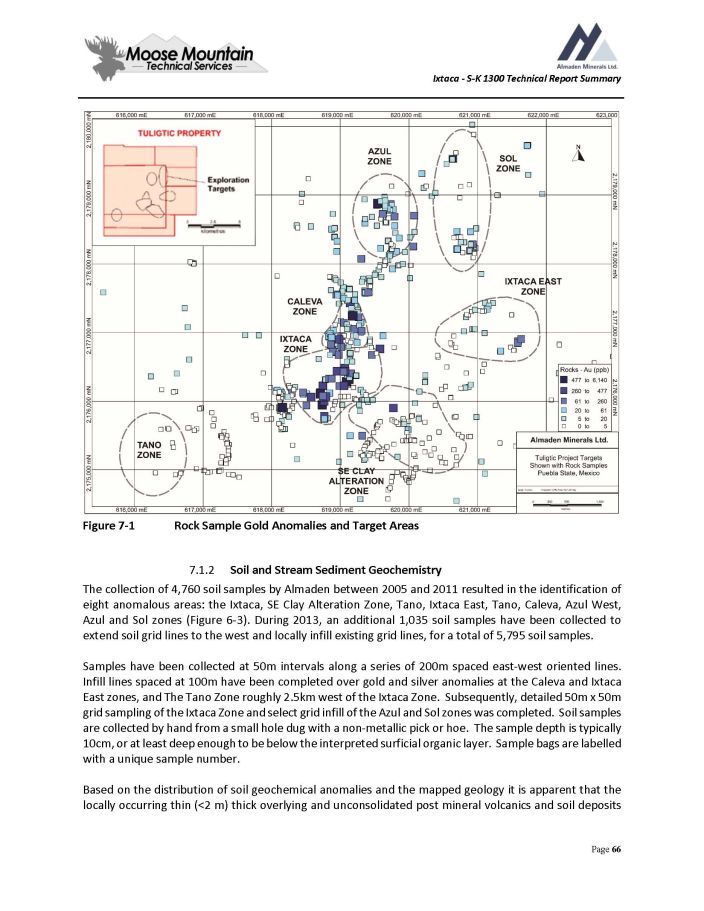
Ixtaca - S - K 1300 Technical Report Summary Figure 7 - 1 Rock Sample Gold Anomalies and Target Areas 7 . 1 . 2 Soil and Stream Sediment Geochemistry The collection of 4 , 760 soil samples by Almaden between 2005 and 2011 resulted in the identification of eight anomalous areas : the Ixtaca, SE Clay Alteration Zone, Tano, Ixtaca East, Tano, Caleva, Azul West, Azul and Sol zones ( Figure 6 - 3 ) . During 2013 , an additional 1 , 035 soil samples have been collected to extend soil grid lines to the west and locally infill existing grid lines, for a total of 5 , 795 soil samples . Samples have been collected at 50 m intervals along a series of 200 m spaced east - west oriented lines . Infill lines spaced at 100 m have been completed over gold and silver anomalies at the Caleva and Ixtaca East zones, and The Tano Zone roughly 2 . 5 km west of the Ixtaca Zone . Subsequently, detailed 50 m x 50 m grid sampling of the Ixtaca Zone and select grid infill of the Azul and Sol zones was completed . Soil samples are collected by hand from a small hole dug with a non - metallic pick or hoe . The sample depth is typically 10 cm, or at least deep enough to be below the interpreted surficial organic layer . Sample bags are labelled with a unique sample number . Based on the distribution of soil geochemical anomalies and the mapped geology it is apparent that the locally occurring thin (< 2 m) thick overlying and unconsolidated post mineral volcanics and soil deposits Page 66

Ixtaca - S - K 1300 Technical Report Summary obscure rock geochemical anomalies from the underlying epithermal system . Significant and anomalous precious metal in soils occur where this unit has been eroded away and volcanic and carbonate hosted mineralisation occurs at surface . Anomalous thresholds (greater than the 95 th percentile) for gold and silver are calculated to be 17 . 1 ppb Au and 0 . 59 ppm Ag, respectively . A total of 288 samples contain anomalous Au, including 141 samples with coincident Ag anomalies . The Ixtaca Zone drainage area produces the largest Au and Ag response within the Tuligtic Property ( Figure 7 - 2 , Figure 7 - 3 ) . Base metals do not correlate significantly with the Ixtaca Zone, and epithermal trace metal suite elements anomalies occur peripherally within altered volcanic rocks . Roughly 2 km to the southwest at approximately 240 degrees, along strike from the Ixtaca deposit is the Tano zone of high gold and silver in soil where there has been a limited number of exploration holes drilled (highest gold intercept of 1 . 00 meters of 27 . 50 g/t gold and 57 . 7 g/t silver in hole TU - 18 - 541 ) . In the intervening 2 kilometers between the Tano Zone and Ixtaca deposit soils were not significantly anomalous but this is an area covered in post mineral material . Similarly, along strike at 060 azimuth, roughly 2 km to the northeast the Ixtaca deposit, is the Ixtaca East zone of clay alteration and high gold in soil . Two drainages from this area returned high gold in silt, 700 and 900 ppb respectively . Base metals correlate well with Au - Ag at the Caleva, Azul, and Sol zones to such an extent they are best termed Cu - Zn (Au - Ag) anomalies . ( Figure 6 - 3 , Figure 7 - 2 . Figure 7 - 3 ) . Significant high level epithermal suite trace element soil anomalies occur from Cerro Caolin (immediately above the Main Ixtaca Zone) to over a kilometer to the southeast in an area of outcropping clay altered volcanic . This anomaly and clay alteration defines the SE Alteration zone . Page 67
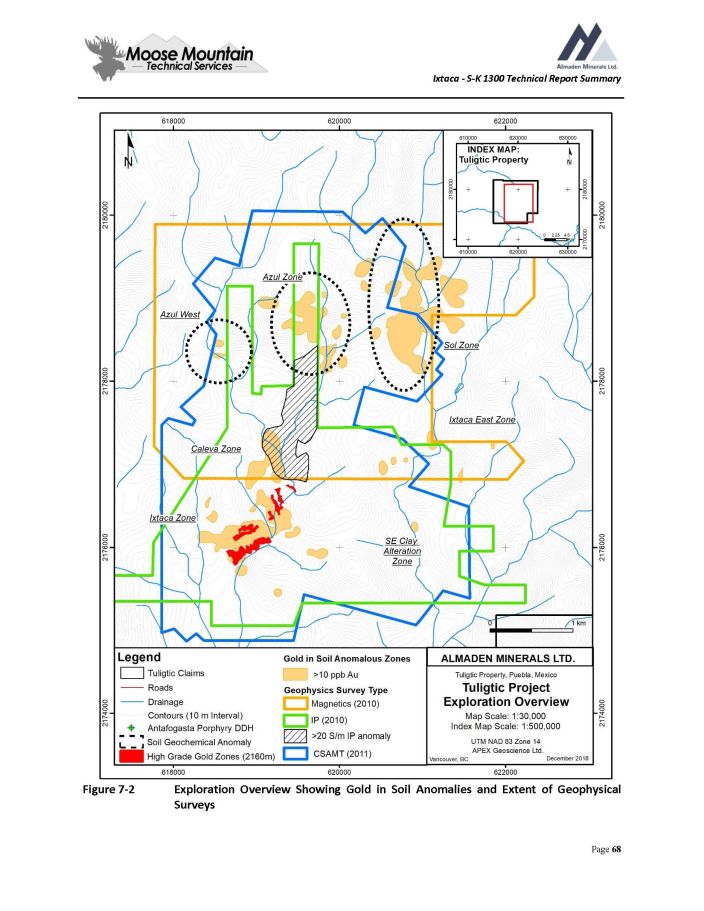
Ixtaca - S - K 1300 Technical Report Summary Figure 7 - 2 Exploration Overview Showing Gold in Soil Anomalies and Extent of Geophysical Surveys Page 68
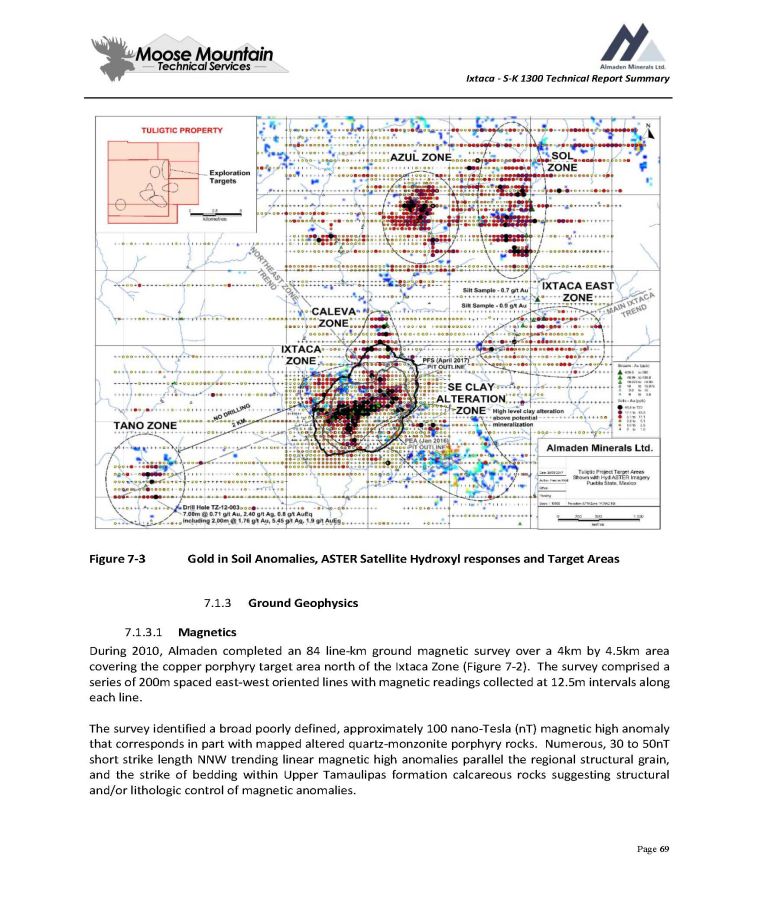
Ixtaca - S - K 1300 Technical Report Summary Figure 7 - 3 Gold in Soil Anomalies, ASTER Satellite Hydroxyl responses and Target Areas 7.1.3 Ground Geophysics 7 . 1 . 3 . 1 Magnetics During 2010 , Almaden completed an 84 line - km ground magnetic survey over a 4 km by 4 . 5 km area covering the copper porphyry target area north of the Ixtaca Zone ( Figure 7 - 2 ) . The survey comprised a series of 200 m spaced east - west oriented lines with magnetic readings collected at 12 . 5 m intervals along each line . The survey identified a broad poorly defined, approximately 100 nano - Tesla (nT) magnetic high anomaly that corresponds in part with mapped altered quartz - monzonite porphyry rocks . Numerous, 30 to 50 nT short strike length NNW trending linear magnetic high anomalies parallel the regional structural grain, and the strike of bedding within Upper Tamaulipas formation calcareous rocks suggesting structural and/or lithologic control of magnetic anomalies . Page 69
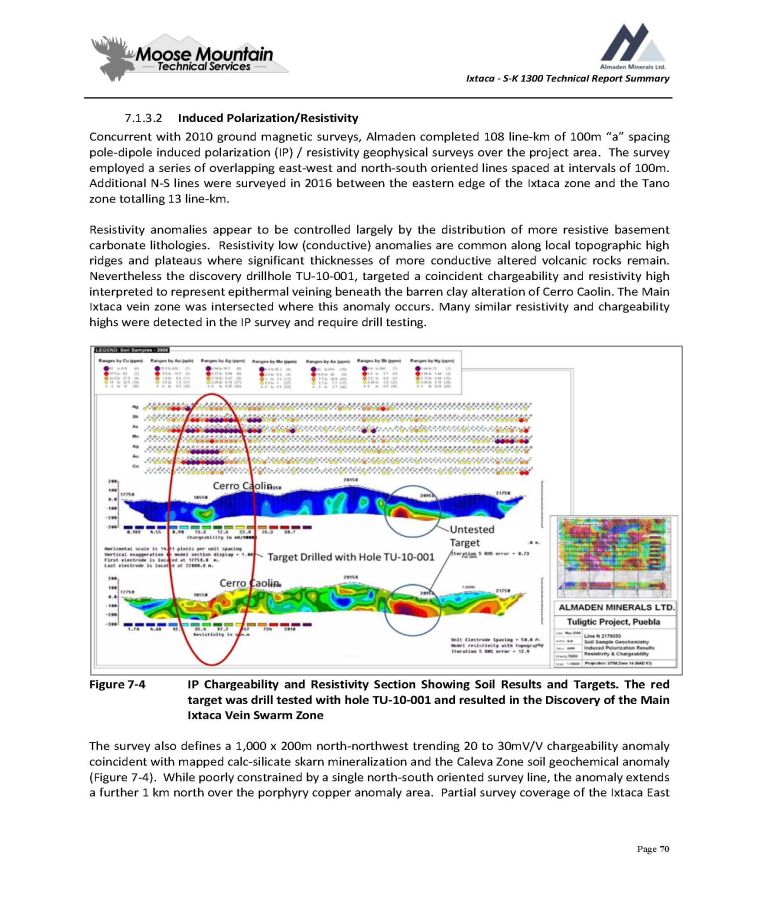
Ixtaca - S - K 1300 Technical Report Summary 7 . 1 . 3 . 2 Induced Polarization/Resistivity Concurrent with 2010 ground magnetic surveys, Almaden completed 108 line - km of 100 m “a” spacing pole - dipole induced polarization (IP) / resistivity geophysical surveys over the project area . The survey employed a series of overlapping east - west and north - south oriented lines spaced at intervals of 100 m . Additional N - S lines were surveyed in 2016 between the eastern edge of the Ixtaca zone and the Tano zone totalling 13 line - km . Resistivity anomalies appear to be controlled largely by the distribution of more resistive basement carbonate lithologies . Resistivity low (conductive) anomalies are common along local topographic high ridges and plateaus where significant thicknesses of more conductive altered volcanic rocks remain . Nevertheless the discovery drillhole TU - 10 - 001 , targeted a coincident chargeability and resistivity high interpreted to represent epithermal veining beneath the barren clay alteration of Cerro Caolin . The Main Ixtaca vein zone was intersected where this anomaly occurs . Many similar resistivity and chargeability highs were detected in the IP survey and require drill testing . Figure 7 - 4 IP Chargeability and Resistivity Section Showing Soil Results and Targets . The red target was drill tested with hole TU - 10 - 001 and resulted in the Discovery of the Main Ixtaca Vein Swarm Zone The survey also defines a 1 , 000 x 200 m north - northwest trending 20 to 30 mV/V chargeability anomaly coincident with mapped calc - silicate skarn mineralization and the Caleva Zone soil geochemical anomaly ( Figure 7 - 4 ) . While poorly constrained by a single north - south oriented survey line, the anomaly extends a further 1 km north over the porphyry copper anomaly area . Partial survey coverage of the Ixtaca East Page 70
Ixtaca - S - K 1300 Technical Report Summary Zone multi - element soil geochemical anomaly defines a 700 x 500 m elliptical 7 to 15 mV/V chargeability anomaly along its western margin . 7.1.3.3 CSAMT/CSIP During 2011 , Zonge International Inc . on behalf of Almaden completed a Controlled Source Audio - frequency Magnetotelluric (CSAMT) and Controlled Source Induce Polarization (CSIP) geophysical survey at the Tuligtic Property over a 6 by 4 km area ( Figure 7 - 2 ) . The survey totalled 48 . 5 line - km, including six lines oriented N - S (N 16 E azimuth, CSAMT and CSIP), and eight perpendicular E - W oriented lines (N 104 E azimuth, CSAMT only) . Survey line spacing varied from 170 to 550 m utilizing an array of six 25 m dipoles . 2 - D (N - S Line) smooth - model resistivity data defines a NW trending resistivity anomaly west of the Ixtaca Main Zone, and an E - W trending resistivity anomaly through the Ixtaca Zone . The NW trending anomaly passes through drill sections 10 + 200 E to 10 + 400 E, and may reflect limestone rocks on the west limb of an east - verging antiform . A similar NW trending conductive anomaly immediately to the east may represent calcareous shale rocks within the core of the antiform . The significance of the E - W trending anomaly is not known given the context of the current geologic model . 2 - D (E - W Line) smooth - model resistivity data shows a strong resistivity anomaly associated with the core of the Ixtaca Main Zone, and surface outcropping limestone . To the northeast, a resistivity anomaly coincident with the Chemalaco Zone may reflect complex structural geology patterns and the relatively resistive limestone and Chemalaco Dyke lithologies . A number of subvertical resistivity and conductivity anomalies are evident in the 1 - D and 2 - D inversions . These anomalies likely represent structures that could also host veins . Further review of this data is planned in order to better define drill targets based on this survey . 7 . 1 . 4 Exploration Potential The Ixtaca deposit occurs within a large zone of high level epithermal alteration hosted by volcanic rocks, the distribution of which is readily defined by ASTER satellite hydroxyl responses ( Figure 7 - 3 ) . The Ixtaca deposit was found in 2010 with hole TU - 10 - 001 , which was designed to test a coincident high gold and silver in soil anomaly along with a high chargeability/high resistivity induced polarisation response occurring underneath a portion of the high level epithermal volcanic hosted clay alteration zone (Cerro Caolin) . This hole intersected the core of the Main Ixtaca vein swarm . Subsequent drilling since 2010 focussed on developing and upgrading confidence of a resource immediately adjacent to this discovery, as well as holes required for engineering and hydrologic purposes . During this timeframe the Company focussed on this resource and development work which has meant that many of the epithermal targets have not yet been tested by drilling . Page 71
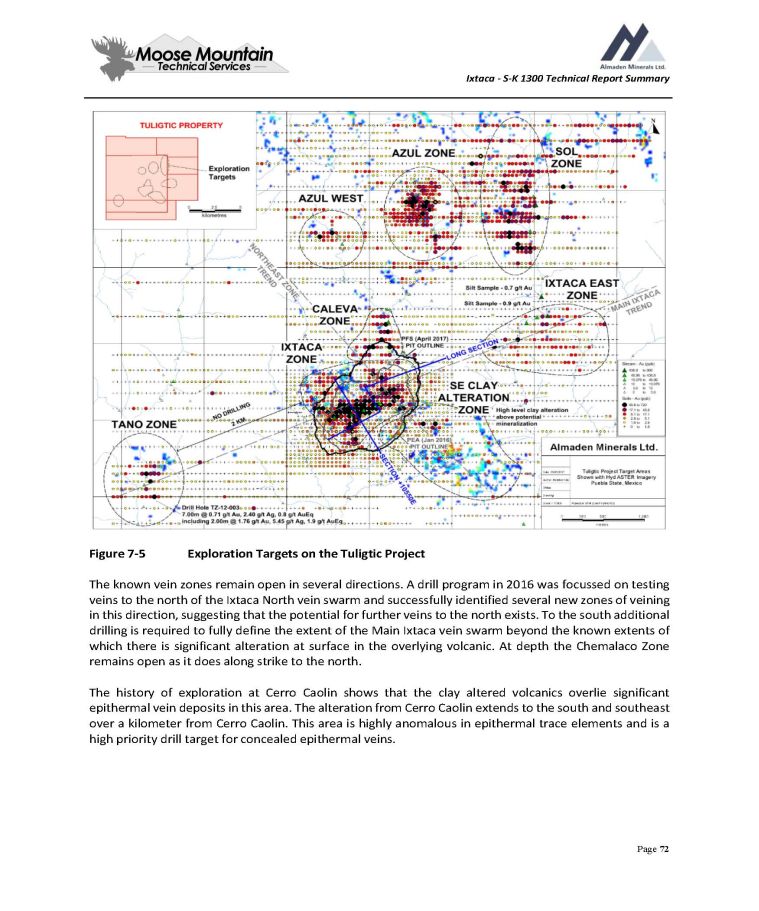
Ixtaca - S - K 1300 Technical Report Summary Figure 7 - 5 Exploration Targets on the Tuligtic Project The known vein zones remain open in several directions . A drill program in 2016 was focussed on testing veins to the north of the Ixtaca North vein swarm and successfully identified several new zones of veining in this direction, suggesting that the potential for further veins to the north exists . To the south additional drilling is required to fully define the extent of the Main Ixtaca vein swarm beyond the known extents of which there is significant alteration at surface in the overlying volcanic . At depth the Chemalaco Zone remains open as it does along strike to the north . The history of exploration at Cerro Caolin shows that the clay altered volcanics overlie significant epithermal vein deposits in this area . The alteration from Cerro Caolin extends to the south and southeast over a kilometer from Cerro Caolin . This area is highly anomalous in epithermal trace elements and is a high priority drill target for concealed epithermal veins . Page 72
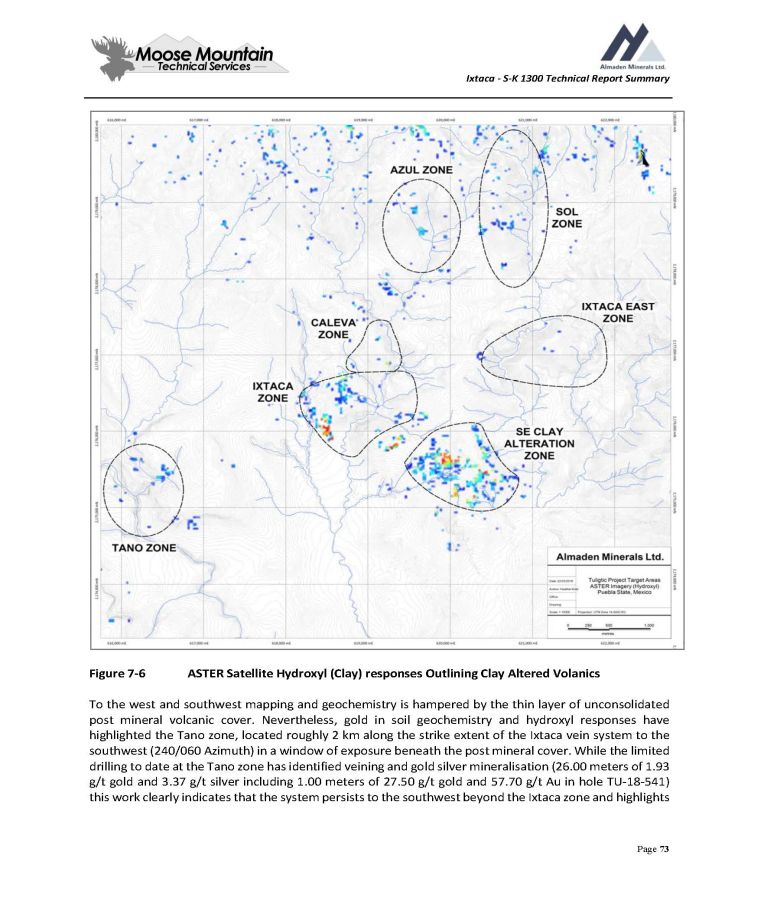
Ixtaca - S - K 1300 Technical Report Summary Figure 7 - 6 ASTER Satellite Hydroxyl (Clay) responses Outlining Clay Altered Volanics To the west and southwest mapping and geochemistry is hampered by the thin layer of unconsolidated post mineral volcanic cover . Nevertheless, gold in soil geochemistry and hydroxyl responses have highlighted the Tano zone, located roughly 2 km along the strike extent of the Ixtaca vein system to the southwest ( 240 / 060 Azimuth) in a window of exposure beneath the post mineral cover . While the limited drilling to date at the Tano zone has identified veining and gold silver mineralisation ( 26 . 00 meters of 1 . 93 g/t gold and 3 . 37 g/t silver including 1 . 00 meters of 27 . 50 g/t gold and 57 . 70 g/t Au in hole TU - 18 - 541 ) this work clearly indicates that the system persists to the southwest beyond the Ixtaca zone and highlights Page 73
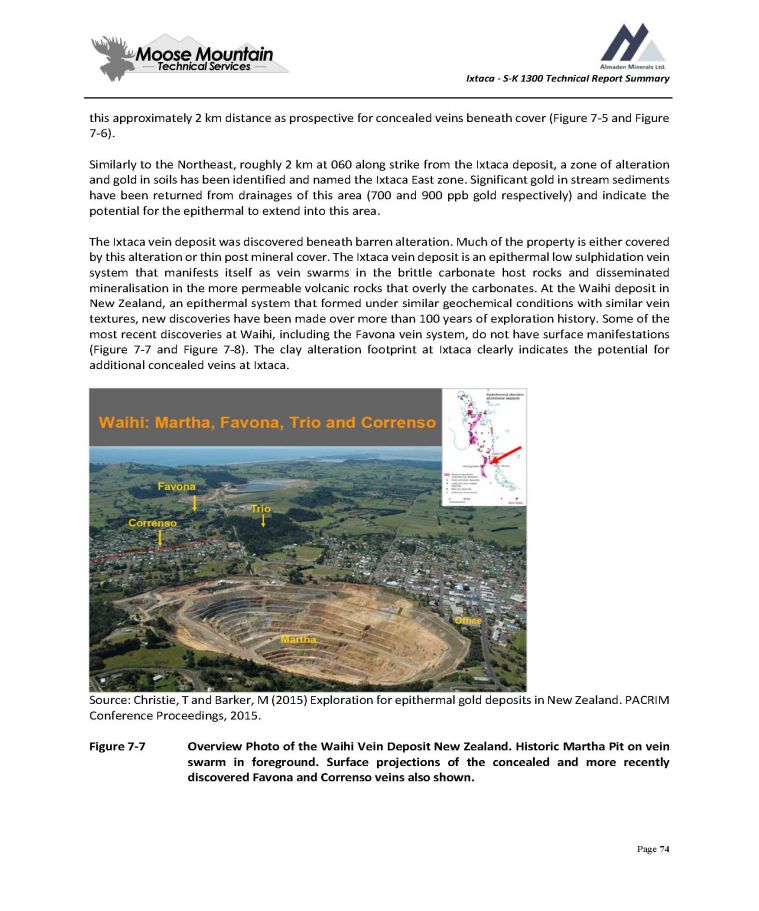
Ixtaca - S - K 1300 Technical Report Summary this approximately 2 km distance as prospective for concealed veins beneath cover ( Figure 7 - 5 and Figure 7 - 6 ) . Similarly to the Northeast, roughly 2 km at 060 along strike from the Ixtaca deposit, a zone of alteration and gold in soils has been identified and named the Ixtaca East zone . Significant gold in stream sediments have been returned from drainages of this area ( 700 and 900 ppb gold respectively) and indicate the potential for the epithermal to extend into this area . The Ixtaca vein deposit was discovered beneath barren alteration . Much of the property is either covered by this alteration or thin post mineral cover . The Ixtaca vein deposit is an epithermal low sulphidation vein system that manifests itself as vein swarms in the brittle carbonate host rocks and disseminated mineralisation in the more permeable volcanic rocks that overly the carbonates . At the Waihi deposit in New Zealand, an epithermal system that formed under similar geochemical conditions with similar vein textures, new discoveries have been made over more than 100 years of exploration history . Some of the most recent discoveries at Waihi, including the Favona vein system, do not have surface manifestations ( Figure 7 - 7 and Figure 7 - 8 ) . The clay alteration footprint at Ixtaca clearly indicates the potential for additional concealed veins at Ixtaca . Source: Christie, T and Barker, M (2015) Exploration for epithermal gold deposits in New Zealand. PACRIM Conference Proceedings, 2015. Figure 7 - 7 Overview Photo of the Waihi Vein Deposit New Zealand . Historic Martha Pit on vein swarm in foreground . Surface projections of the concealed and more recently discovered Favona and Correnso veins also shown . Page 74
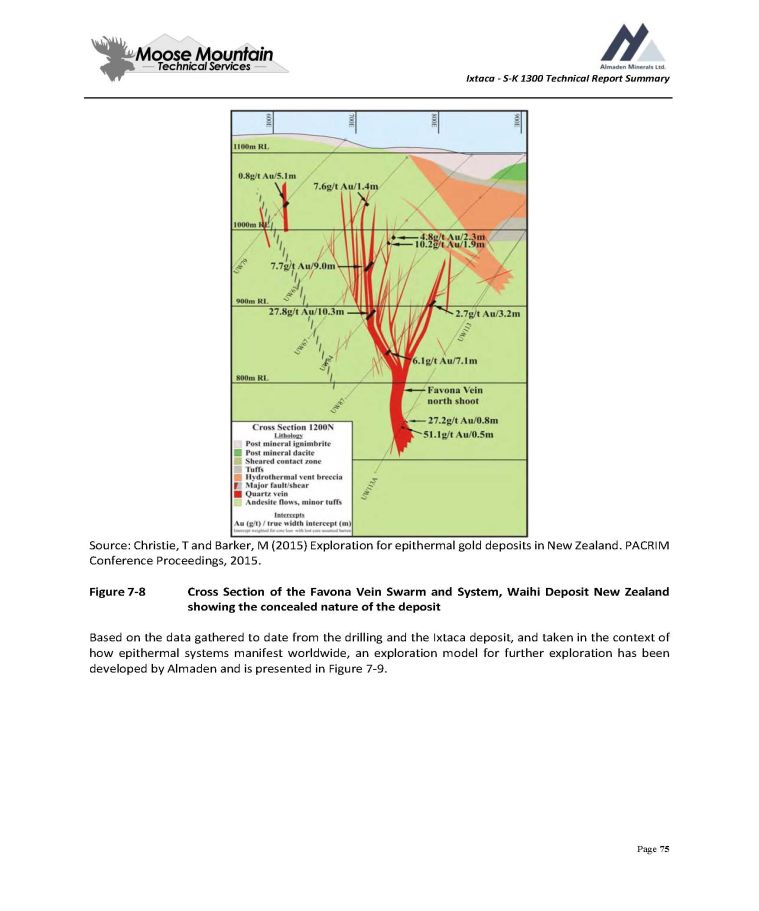
Ixtaca - S - K 1300 Technical Report Summary Source: Christie, T and Barker, M (2015) Exploration for epithermal gold deposits in New Zealand. PACRIM Conference Proceedings, 2015. Figure 7 - 8 Cross Section of the Favona Vein Swarm and System, Waihi Deposit New Zealand showing the concealed nature of the deposit Based on the data gathered to date from the drilling and the Ixtaca deposit, and taken in the context of how epithermal systems manifest worldwide, an exploration model for further exploration has been developed by Almaden and is presented in Figure 7 - 9 . Page 75
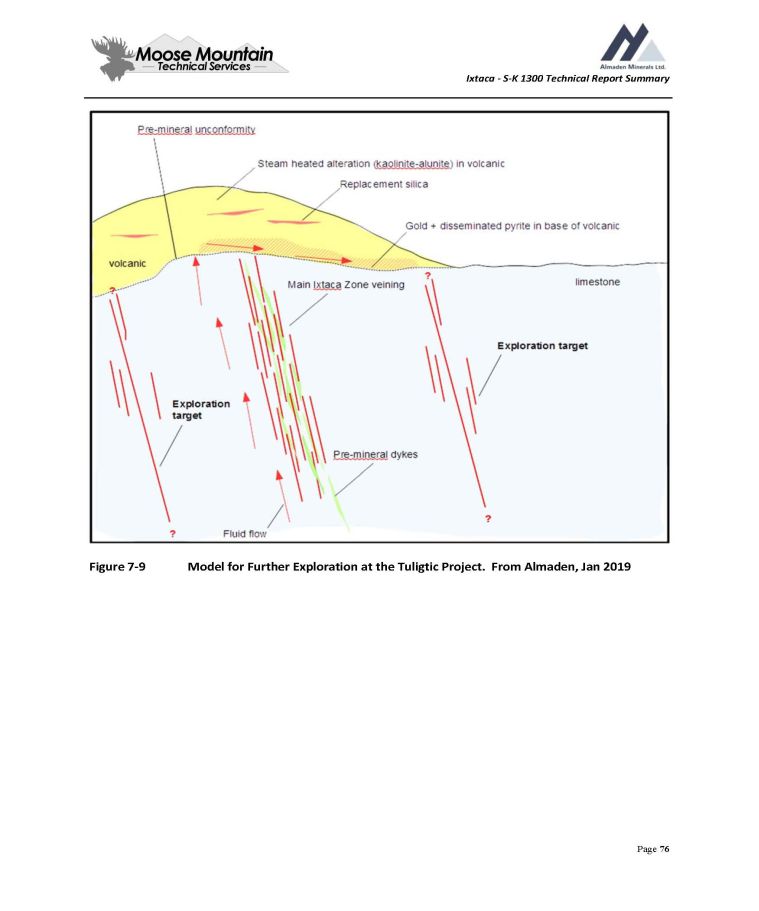
Ixtaca - S - K 1300 Technical Report Summary Figure 7 - 9 Model for Further Exploration at the Tuligtic Project. From Almaden, Jan 2019 Page 76
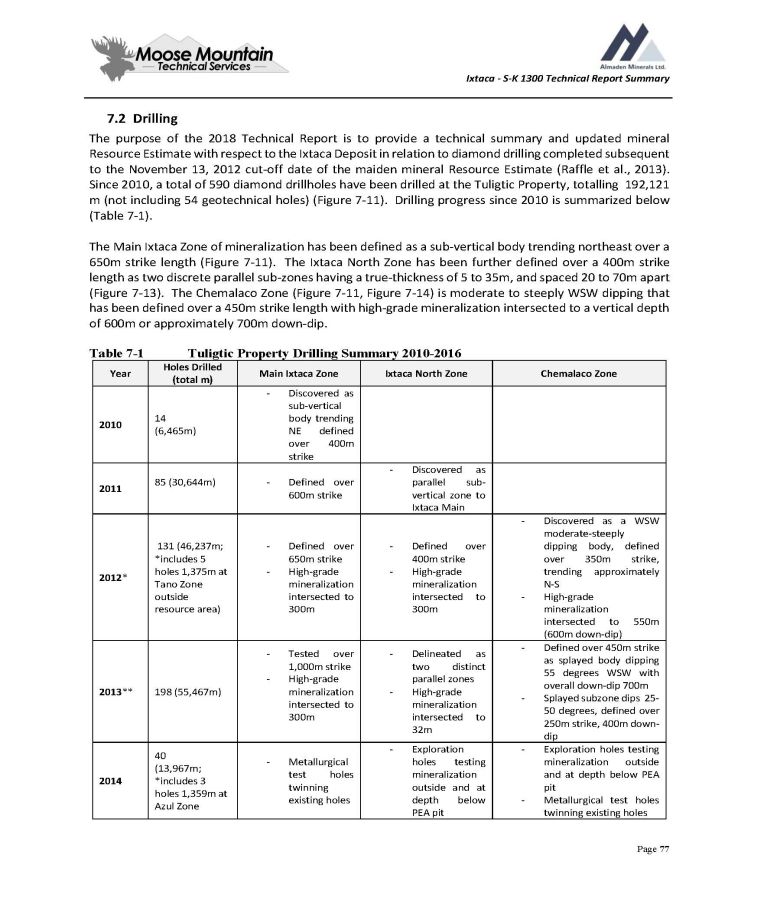
Ixtaca - S - K 1300 Technical Report Summary 7 . 2 Drilling The purpose of the 2018 Technical Report is to provide a technical summary and updated mineral Resource Estimate with respect to the Ixtaca Deposit in relation to diamond drilling completed subsequent to the November 13 , 2012 cut - off date of the maiden mineral Resource Estimate (Raffle et al . , 2013 ) . Since 2010 , a total of 590 diamond drillholes have been drilled at the Tuligtic Property, totalling 192 , 121 m (not including 54 geotechnical holes) ( Figure 7 - 11 ) . Drilling progress since 2010 is summarized below ( Table 7 - 1 ) . The Main Ixtaca Zone of mineralization has been defined as a sub - vertical body trending northeast over a 650 m strike length ( Figure 7 - 11 ) . The Ixtaca North Zone has been further defined over a 400 m strike length as two discrete parallel sub - zones having a true - thickness of 5 to 35 m, and spaced 20 to 70 m apart ( Figure 7 - 13 ) . The Chemalaco Zone ( Figure 7 - 11 , Figure 7 - 14 ) is moderate to steeply WSW dipping that has been defined over a 450 m strike length with high - grade mineralization intersected to a vertical depth of 600 m or approximately 700 m down - dip . Table 7 - 1 Tuligtic Property Drilling Summary 2010 - 2016 Page 77 Chemalaco Zone Ixtaca North Zone Main Ixtaca Zone Holes Drilled (total m) Year - Discovered as sub - vertical body trending NE defined over 400m strike 14 (6,465m) 2010 - Discovered as parallel sub - vertical zone to Ixtaca Main - Defined over 600m strike 85 (30,644m) 2011 - Discovered as a WSW moderate - steeply dipping body, defined over 350m strike, trending approximately N - S - High - grade mineralization intersected to 550m (600m down - dip) - Defined over 400m strike - High - grade mineralization intersected to 300m - Defined over 650m strike - High - grade mineralization intersected to 300m 131 (46,237m; *includes 5 holes 1,375m at Tano Zone outside resource area) 2012 * - Defined over 450 m strike as splayed body dipping 55 degrees WSW with overall down - dip 700 m - Splayed subzone dips 25 - 50 degrees, defined over 250 m strike, 400 m down - dip - Delineated as two distinct parallel zones - High - grade mineralization intersected to 32m - Tested over 1,000m strike - High - grade mineralization intersected to 300m 198 (55,467m) 2013 ** - Exploration holes testing mineralization outside and at depth below PEA pit - Metallurgical test holes twinning existing holes - Exploration holes testing mineralization outside and at depth below PEA pit - Metallurgical test holes twinning existing holes 40 (13,967m; *includes 3 holes 1,359m at Azul Zone 2014
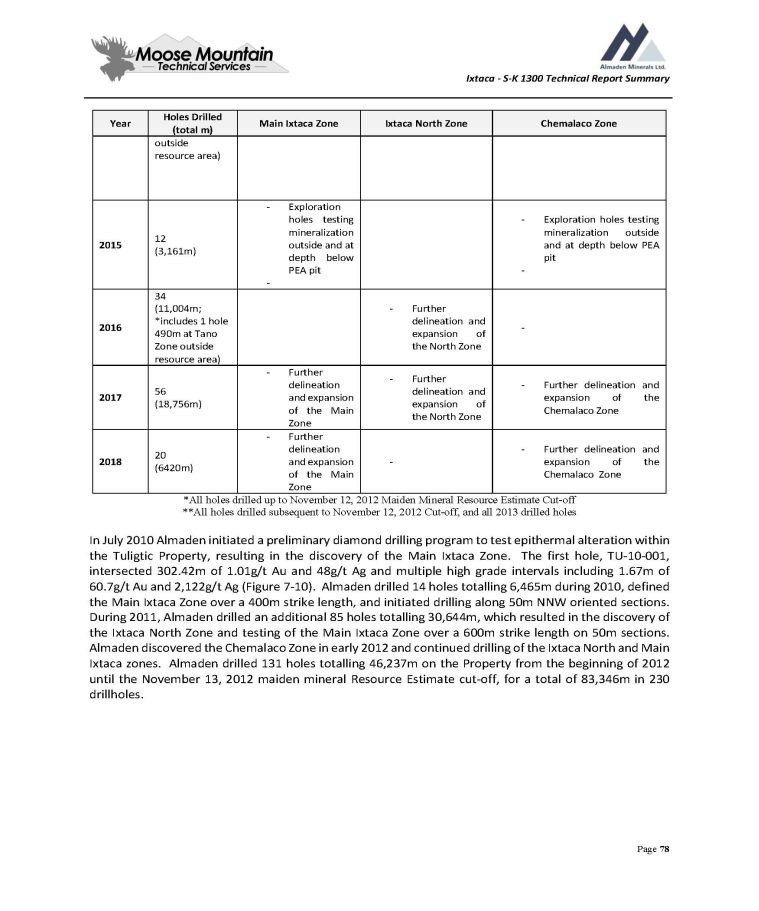
Ixtaca - S - K 1300 Technical Report Summary Chemalaco Zone Ixtaca North Zone Main Ixtaca Zone Holes Drilled (total m) Year outside resource area) - Exploration holes testing mineralization outside and at depth below PEA pit - - Exploration holes testing mineralization outside and at depth below PEA pit - 12 (3,161m) 2015 - - Further delineation and expansion of the North Zone 34 (11,004m; *includes 1 hole 490m at Tano Zone outside resource area) 2016 - Further delineation and expansion of the Chemalaco Zone - Further delineation and expansion of the North Zone - Further delineation and expansion of the Main Zone 56 (18,756m) 2017 - Further delineation and expansion of the Chemalaco Zone - - Further delineation and expansion of the Main Zone 20 (6420m) 2018 Page 78 *All holes drilled up to November 12, 2012 Maiden Mineral Resource Estimate Cut - off **All holes drilled subsequent to November 12, 2012 Cut - off, and all 2013 drilled holes In July 2010 Almaden initiated a preliminary diamond drilling program to test epithermal alteration within the Tuligtic Property, resulting in the discovery of the Main Ixtaca Zone . The first hole, TU - 10 - 001 , intersected 302 . 42 m of 1 . 01 g/t Au and 48 g/t Ag and multiple high grade intervals including 1 . 67 m of 60 . 7 g/t Au and 2 , 122 g/t Ag ( Figure 7 - 10 ) . Almaden drilled 14 holes totalling 6 , 465 m during 2010 , defined the Main Ixtaca Zone over a 400 m strike length, and initiated drilling along 50 m NNW oriented sections . During 2011 , Almaden drilled an additional 85 holes totalling 30 , 644 m, which resulted in the discovery of the Ixtaca North Zone and testing of the Main Ixtaca Zone over a 600 m strike length on 50 m sections . Almaden discovered the Chemalaco Zone in early 2012 and continued drilling of the Ixtaca North and Main Ixtaca zones . Almaden drilled 131 holes totalling 46 , 237 m on the Property from the beginning of 2012 until the November 13 , 2012 maiden mineral Resource Estimate cut - off, for a total of 83 , 346 m in 230 drillholes .
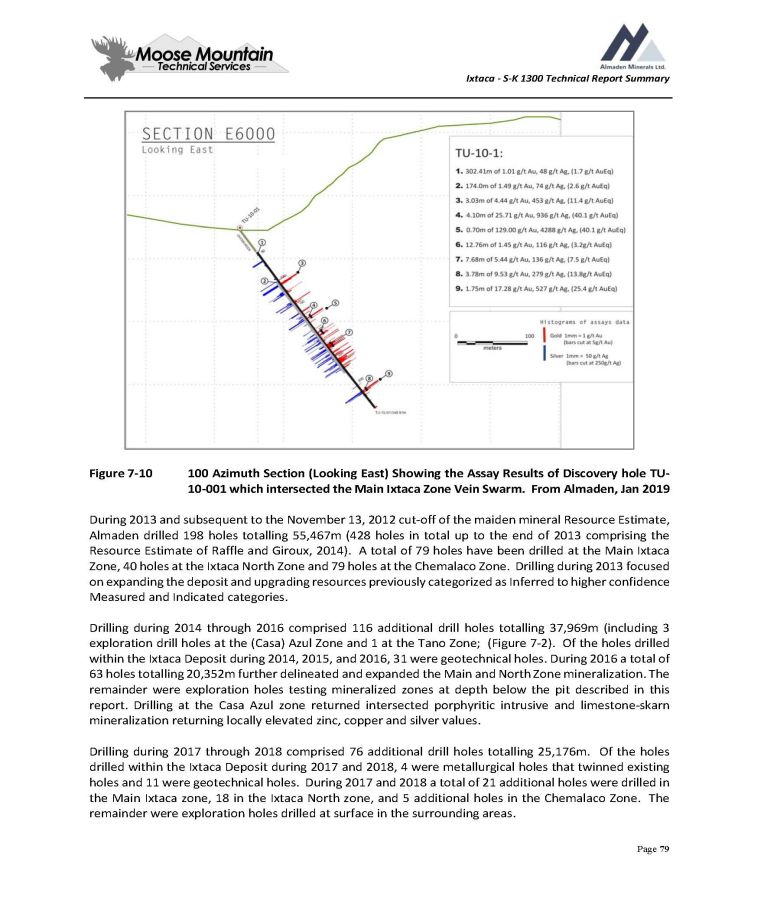
Ixtaca - S - K 1300 Technical Report Summary Figure 7 - 10 100 Azimuth Section (Looking East) Showing the Assay Results of Discovery hole TU - 10 - 001 which intersected the Main Ixtaca Zone Vein Swarm. From Almaden, Jan 2019 During 2013 and subsequent to the November 13 , 2012 cut - off of the maiden mineral Resource Estimate, Almaden drilled 198 holes totalling 55 , 467 m ( 428 holes in total up to the end of 2013 comprising the Resource Estimate of Raffle and Giroux, 2014 ) . A total of 79 holes have been drilled at the Main Ixtaca Zone, 40 holes at the Ixtaca North Zone and 79 holes at the Chemalaco Zone . Drilling during 2013 focused on expanding the deposit and upgrading resources previously categorized as Inferred to higher confidence Measured and Indicated categories . Drilling during 2014 through 2016 comprised 116 additional drill holes totalling 37 , 969 m (including 3 exploration drill holes at the (Casa) Azul Zone and 1 at the Tano Zone ; ( Figure 7 - 2 ) . Of the holes drilled within the Ixtaca Deposit during 2014 , 2015 , and 2016 , 31 were geotechnical holes . During 2016 a total of 63 holes totalling 20 , 352 m further delineated and expanded the Main and North Zone mineralization . The remainder were exploration holes testing mineralized zones at depth below the pit described in this report . Drilling at the Casa Azul zone returned intersected porphyritic intrusive and limestone - skarn mineralization returning locally elevated zinc, copper and silver values . Drilling during 2017 through 2018 comprised 76 additional drill holes totalling 25 , 176 m . Of the holes drilled within the Ixtaca Deposit during 2017 and 2018 , 4 were metallurgical holes that twinned existing holes and 11 were geotechnical holes . During 2017 and 2018 a total of 21 additional holes were drilled in the Main Ixtaca zone, 18 in the Ixtaca North zone, and 5 additional holes in the Chemalaco Zone . The remainder were exploration holes drilled at surface in the surrounding areas . Page 79
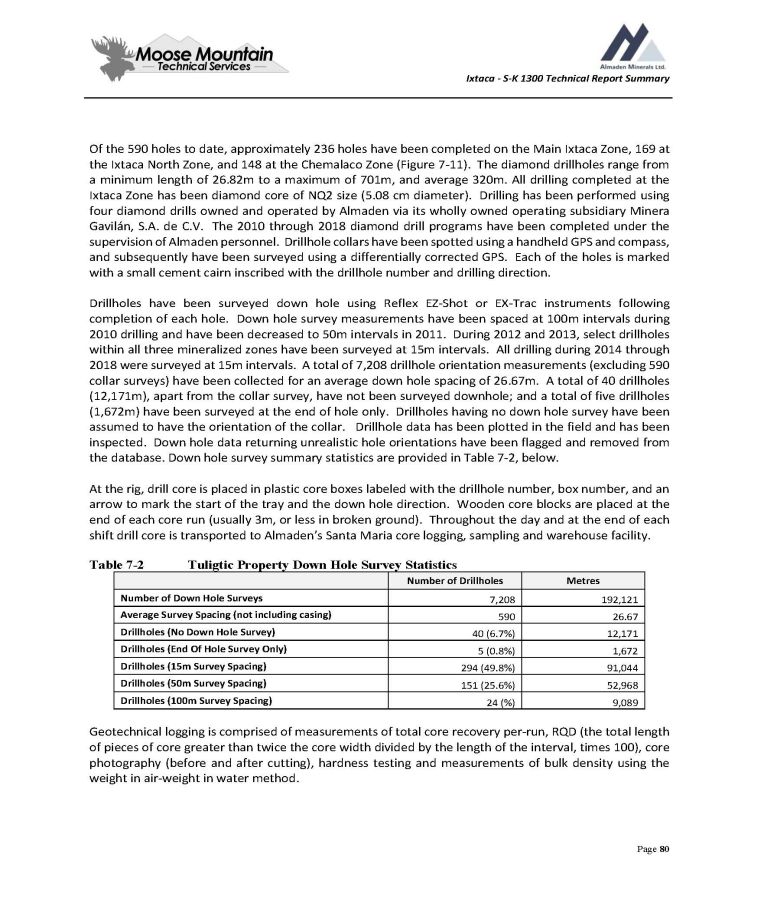
Ixtaca - S - K 1300 Technical Report Summary Of the 590 holes to date, approximately 236 holes have been completed on the Main Ixtaca Zone, 169 at the Ixtaca North Zone, and 148 at the Chemalaco Zone ( Figure 7 - 11 ) . The diamond drillholes range from a minimum length of 26 . 82 m to a maximum of 701 m, and average 320 m . All drilling completed at the Ixtaca Zone has been diamond core of NQ 2 size ( 5 . 08 cm diameter) . Drilling has been performed using four diamond drills owned and operated by Almaden via its wholly owned operating subsidiary Minera Gavilán, S . A . de C . V . The 2010 through 2018 diamond drill programs have been completed under the supervision of Almaden personnel . Drillhole collars have been spotted using a handheld GPS and compass, and subsequently have been surveyed using a differentially corrected GPS . Each of the holes is marked with a small cement cairn inscribed with the drillhole number and drilling direction . Drillholes have been surveyed down hole using Reflex EZ - Shot or EX - Trac instruments following completion of each hole . Down hole survey measurements have been spaced at 100 m intervals during 2010 drilling and have been decreased to 50 m intervals in 2011 . During 2012 and 2013 , select drillholes within all three mineralized zones have been surveyed at 15 m intervals . All drilling during 2014 through 2018 were surveyed at 15 m intervals . A total of 7 , 208 drillhole orientation measurements (excluding 590 collar surveys) have been collected for an average down hole spacing of 26 . 67 m . A total of 40 drillholes ( 12 , 171 m), apart from the collar survey, have not been surveyed downhole ; and a total of five drillholes ( 1 , 672 m) have been surveyed at the end of hole only . Drillholes having no down hole survey have been assumed to have the orientation of the collar . Drillhole data has been plotted in the field and has been inspected . Down hole data returning unrealistic hole orientations have been flagged and removed from the database . Down hole survey summary statistics are provided in Table 7 - 2 , below . At the rig, drill core is placed in plastic core boxes labeled with the drillhole number, box number, and an arrow to mark the start of the tray and the down hole direction . Wooden core blocks are placed at the end of each core run (usually 3 m, or less in broken ground) . Throughout the day and at the end of each shift drill core is transported to Almaden’s Santa Maria core logging, sampling and warehouse facility . Table 7 - 2 Tuligtic Property Down Hole Survey Statistics Page 80 Metres Number of Drillholes 192,121 7,208 Number of Down Hole Surveys 26.67 590 Average Survey Spacing (not including casing) 12,171 40 (6.7%) Drillholes (No Down Hole Survey) 1,672 5 (0.8%) Drillholes (End Of Hole Survey Only) 91,044 294 (49.8%) Drillholes (15m Survey Spacing) 52,968 151 (25.6%) Drillholes (50m Survey Spacing) 9,089 24 (%) Drillholes (100m Survey Spacing) Geotechnical logging is comprised of measurements of total core recovery per - run, RQD (the total length of pieces of core greater than twice the core width divided by the length of the interval, times 100 ), core photography (before and after cutting), hardness testing and measurements of bulk density using the weight in air - weight in water method .

Ixtaca - S - K 1300 Technical Report Summary Drill core is logged based on lithology, and the presence of epithermal alteration and mineralization . All strongly altered or epithermal - mineralized intervals of core are sampled . Almaden employs a maximum sample length of 2 to 3 m in unmineralized lithologies, and a maximum sample length of 1 m in mineralized lithologies . During the years 2010 and 2011 Almaden employed a minimum sample length of 20 cm . The minimum sample length was increased to 50 cm from 2012 onwards to ensure the availability of sufficient material for replicate analysis . Geological changes in the core such as major alteration or mineralization intensity (including large discrete veins), or lithology are used as sample breaks . The Upper Tamaulipas formation, the dykes that crosscut it and the upper Coyoltepec volcanic subunit are the main host rocks to the epithermal vein system at Ixtaca . In the Main and Ixtaca North zones veining strikes dominantly ENE - WNW ( 060 degrees) parallel to a major dyke trend and at a very high angle to the N to NNW bedding and fold structures within the limestones . The veins of the Chemalaco Zone are hosted by the shaley carbonate units (black shale) and strike to the NNW, dipping to the SSW . In the footwall to Chemalaco Zone a parallel dyke has been identified which is altered and mineralized . The Chemalaco Zone and the dyke are interpreted to strike parallel to bedding and to core an antiform comprised of shale . 7 . 2 . 1 Main Ixtaca and Ixtaca North Zones The Main Ixtaca and Ixtaca North zones have a strike length of approximately 650 m and have been drilled at 25 and 50 m section spacing . The vast majority of holes have been drilled at an azimuth of 150 or 330 degrees and at dips between 45 and 60 degrees from horizontal although several holes were drilled with a 100 Azimuth early in the program . Infill drilling at 25 m sections has also been completed over the majority of the Ixtaca North Zone and in the central area of the Main Ixtaca Zone . Diamond drilling has intersected high - grade mineralization within the Main Ixtaca and Ixtaca North vein zones to depths of 200 to 300 m vertically from surface . High - grade zones occur within a broader zone of mineralization extending laterally (NNW - SSE) over 1000 m and to a vertical depth of 600 m below surface ( Table 7 - 3 and Figure 7 - 12 ) . The epithermal vein system at the Main Ixtaca and Ixtaca North zones is roughly associated with two parallel ENE ( 060 degrees) trending, subvertical to steeply north dipping dyke zones . The dykes predate mineralization and trend at a high angle to the N to NNW bedding and fold structures within the limestone . At the Main Ixtaca Zone, a series of dykes ranging from less than 2 m to over 20 m true width occur within an approximately 100 m wide zone ( Figure 7 - 12 , Figure 7 - 13 ) . Wider dykes often correlate within individual drill sections, where they are inferred to pinch or splay . The broader dyke zone itself is relatable between sections, although individual dykes are typically not continuous between sections . The dyke zone hosting the Ixtaca North Zone is narrower, comprising a steeply north - dipping zone of two or three discrete dykes ranging from 5 to 20 m in width . Epithermal vein mineralization occurs both within the dykes and sedimentary host rocks, with the highest grades often occurring within or proximal to the dykes . Vein density decreases outward to the north and south from the dyke zones resulting in the formation of two high - grade vein swarms . The dykes are often intensely altered and are interpreted to control the distribution of the epithermal vein system at Ixtaca to the extent that they may have provided a conduit for ascending hydrothermal fluids, and an important rheological contrast resulting in vein formation within and along the margins individual dykes, and laterally within the adjacent limestone . On surface, the Main Ixtaca and Ixtaca North zones are separated by a steep sided ENE trending valley ( Figure 7 - 12 , Figure 7 - 13 ) . Page 81

Ixtaca - S - K 1300 Technical Report Summary The lateral (WSW - ENE) extent of the epithermal vein system is controlled by N to NNW bedding and fold structures in basement rocks of the limestone unit . Drilling indicates Main Ixtaca and Ixtaca North zone mineralization is bound within an ENE - verging asymmetric synform . The synform is cored by a structurally thickened sequence of limestone that grades laterally and at depth through calcareous siltstone and grainstone transition units, into dark grey to laminated calcareous shale at depth . Based on increased vein density, including the presence of broad alteration zones and networks of intersecting epithermal veins, the relatively brittle limestone is a preferential host to Main Ixtaca and Ixtaca North vein swarms . Page 82
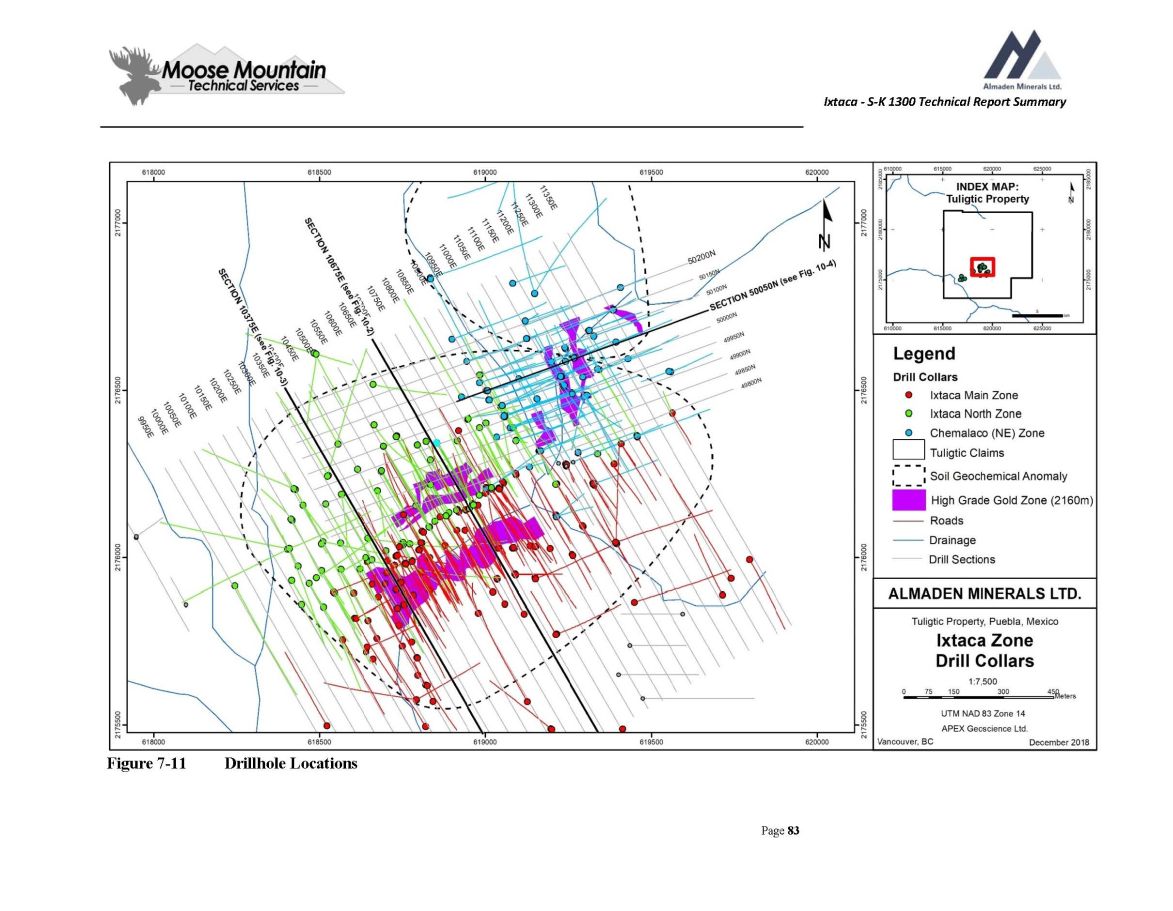
Ixtaca - S - K 1300 Technical Report Summary Figure 7 - 11 Drillhole Locations Page 83
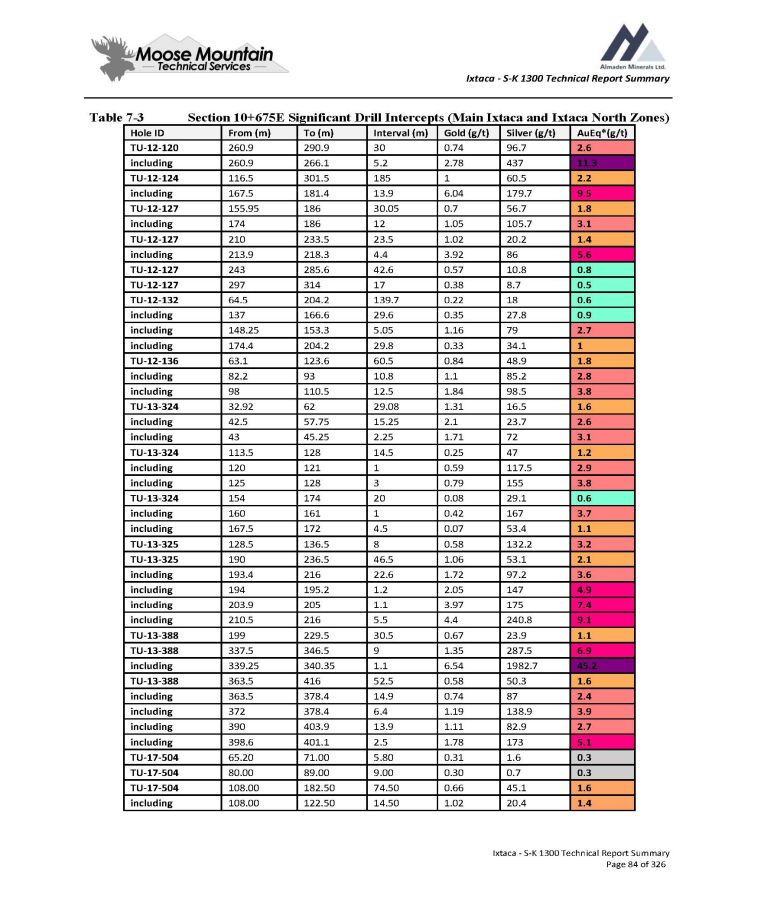
Ixtaca - S - K 1300 Technical Report Summary Table 7 - 3 Ixtaca - S - K 1300 Technical Report Summary Page 84 of 326 Section 10+675E Significant Drill Intercepts (Main Ixtaca and Ixtaca North Zones) AuEq*(g/t) Silver (g/t) Gold (g/t) Interval (m) To (m) From (m) Hole ID 2.6 96.7 0.74 30 290.9 260.9 TU - 12 - 120 11.3 437 2.78 5.2 266.1 260.9 including 2.2 60.5 1 185 301.5 116.5 TU - 12 - 124 9.5 179.7 6.04 13.9 181.4 167.5 including 1.8 56.7 0.7 30.05 186 155.95 TU - 12 - 127 3.1 105.7 1.05 12 186 174 including 1.4 20.2 1.02 23.5 233.5 210 TU - 12 - 127 5.6 86 3.92 4.4 218.3 213.9 including 0.8 10.8 0.57 42.6 285.6 243 TU - 12 - 127 0.5 8.7 0.38 17 314 297 TU - 12 - 127 0.6 18 0.22 139.7 204.2 64.5 TU - 12 - 132 0.9 27.8 0.35 29.6 166.6 137 including 2.7 79 1.16 5.05 153.3 148.25 including 1 34.1 0.33 29.8 204.2 174.4 including 1.8 48.9 0.84 60.5 123.6 63.1 TU - 12 - 136 2.8 85.2 1.1 10.8 93 82.2 including 3.8 98.5 1.84 12.5 110.5 98 including 1.6 16.5 1.31 29.08 62 32.92 TU - 13 - 324 2.6 23.7 2.1 15.25 57.75 42.5 including 3.1 72 1.71 2.25 45.25 43 including 1.2 47 0.25 14.5 128 113.5 TU - 13 - 324 2.9 117.5 0.59 1 121 120 including 3.8 155 0.79 3 128 125 including 0.6 29.1 0.08 20 174 154 TU - 13 - 324 3.7 167 0.42 1 161 160 including 1.1 53.4 0.07 4.5 172 167.5 including 3.2 132.2 0.58 8 136.5 128.5 TU - 13 - 325 2.1 53.1 1.06 46.5 236.5 190 TU - 13 - 325 3.6 97.2 1.72 22.6 216 193.4 including 4.9 147 2.05 1.2 195.2 194 including 7.4 175 3.97 1.1 205 203.9 including 9.1 240.8 4.4 5.5 216 210.5 including 1.1 23.9 0.67 30.5 229.5 199 TU - 13 - 388 6.9 287.5 1.35 9 346.5 337.5 TU - 13 - 388 45.2 1982.7 6.54 1.1 340.35 339.25 including 1.6 50.3 0.58 52.5 416 363.5 TU - 13 - 388 2.4 87 0.74 14.9 378.4 363.5 including 3.9 138.9 1.19 6.4 378.4 372 including 2.7 82.9 1.11 13.9 403.9 390 including 5.1 173 1.78 2.5 401.1 398.6 including 0.3 1.6 0.31 5.80 71.00 65.20 TU - 17 - 504 0.3 0.7 0.30 9.00 89.00 80.00 TU - 17 - 504 1.6 45.1 0.66 74.50 182.50 108.00 TU - 17 - 504 1.4 20.4 1.02 14.50 122.50 108.00 including
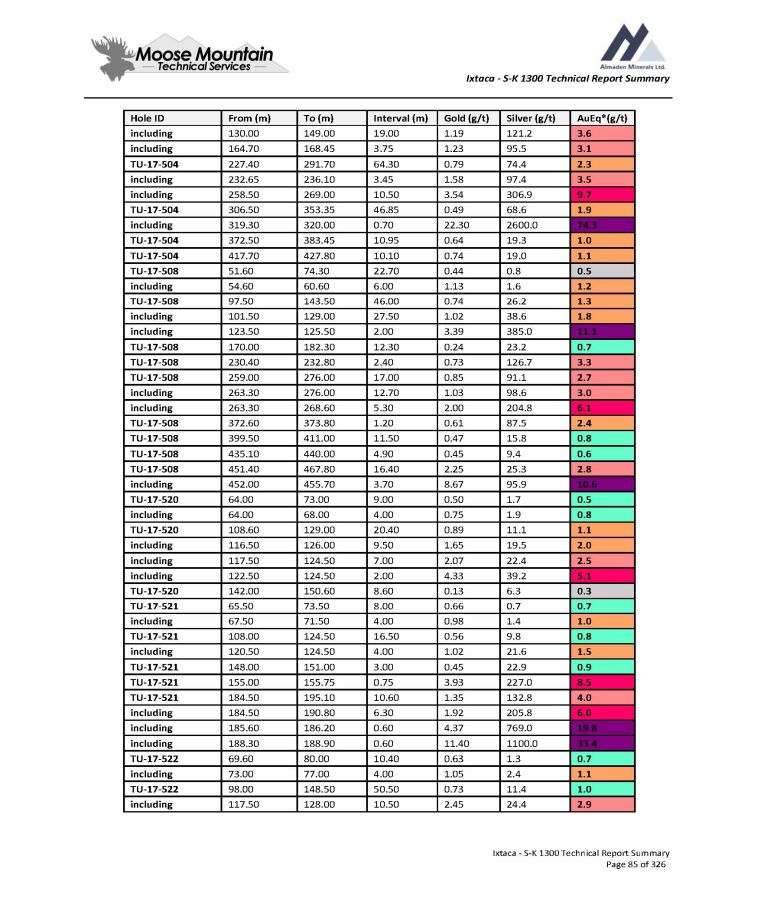
Ixtaca - S - K 1300 Technical Report Summary AuEq*(g/t) Silver (g/t) Gold (g/t) Interval (m) To (m) From (m) Hole ID 3.6 121.2 1.19 19.00 149.00 130.00 including 3.1 95.5 1.23 3.75 168.45 164.70 including 2.3 74.4 0.79 64.30 291.70 227.40 TU - 17 - 504 3.5 97.4 1.58 3.45 236.10 232.65 including 9.7 306.9 3.54 10.50 269.00 258.50 including 1.9 68.6 0.49 46.85 353.35 306.50 TU - 17 - 504 74.3 2600.0 22.30 0.70 320.00 319.30 including 1.0 19.3 0.64 10.95 383.45 372.50 TU - 17 - 504 1.1 19.0 0.74 10.10 427.80 417.70 TU - 17 - 504 0.5 0.8 0.44 22.70 74.30 51.60 TU - 17 - 508 1.2 1.6 1.13 6.00 60.60 54.60 including 1.3 26.2 0.74 46.00 143.50 97.50 TU - 17 - 508 1.8 38.6 1.02 27.50 129.00 101.50 including 11.1 385.0 3.39 2.00 125.50 123.50 including 0.7 23.2 0.24 12.30 182.30 170.00 TU - 17 - 508 3.3 126.7 0.73 2.40 232.80 230.40 TU - 17 - 508 2.7 91.1 0.85 17.00 276.00 259.00 TU - 17 - 508 3.0 98.6 1.03 12.70 276.00 263.30 including 6.1 204.8 2.00 5.30 268.60 263.30 including 2.4 87.5 0.61 1.20 373.80 372.60 TU - 17 - 508 0.8 15.8 0.47 11.50 411.00 399.50 TU - 17 - 508 0.6 9.4 0.45 4.90 440.00 435.10 TU - 17 - 508 2.8 25.3 2.25 16.40 467.80 451.40 TU - 17 - 508 10.6 95.9 8.67 3.70 455.70 452.00 including 0.5 1.7 0.50 9.00 73.00 64.00 TU - 17 - 520 0.8 1.9 0.75 4.00 68.00 64.00 including 1.1 11.1 0.89 20.40 129.00 108.60 TU - 17 - 520 2.0 19.5 1.65 9.50 126.00 116.50 including 2.5 22.4 2.07 7.00 124.50 117.50 including 5.1 39.2 4.33 2.00 124.50 122.50 including 0.3 6.3 0.13 8.60 150.60 142.00 TU - 17 - 520 0.7 0.7 0.66 8.00 73.50 65.50 TU - 17 - 521 1.0 1.4 0.98 4.00 71.50 67.50 including 0.8 9.8 0.56 16.50 124.50 108.00 TU - 17 - 521 1.5 21.6 1.02 4.00 124.50 120.50 including 0.9 22.9 0.45 3.00 151.00 148.00 TU - 17 - 521 8.5 227.0 3.93 0.75 155.75 155.00 TU - 17 - 521 4.0 132.8 1.35 10.60 195.10 184.50 TU - 17 - 521 6.0 205.8 1.92 6.30 190.80 184.50 including 19.8 769.0 4.37 0.60 186.20 185.60 including 33.4 1100.0 11.40 0.60 188.90 188.30 including 0.7 1.3 0.63 10.40 80.00 69.60 TU - 17 - 522 1.1 2.4 1.05 4.00 77.00 73.00 including 1.0 11.4 0.73 50.50 148.50 98.00 TU - 17 - 522 2.9 24.4 2.45 10.50 128.00 117.50 including Ixtaca - S - K 1300 Technical Report Summary Page 85 of 326
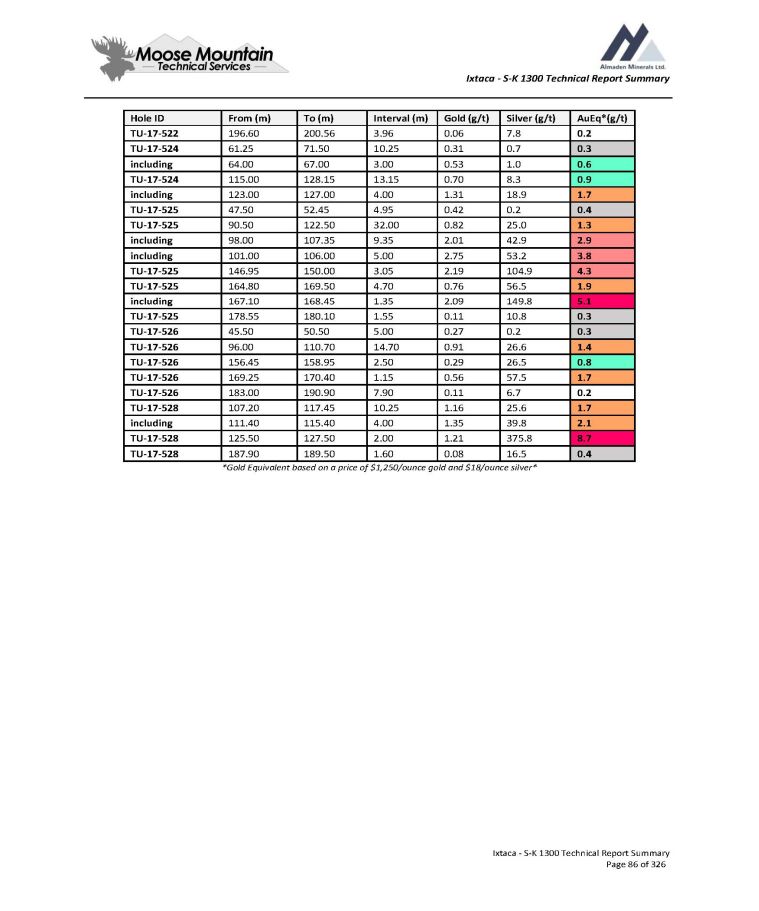
Ixtaca - S - K 1300 Technical Report Summary AuEq*(g/t) Silver (g/t) Gold (g/t) Interval (m) To (m) From (m) Hole ID 0.2 7.8 0.06 3.96 200.56 196.60 TU - 17 - 522 0.3 0.7 0.31 10.25 71.50 61.25 TU - 17 - 524 0.6 1.0 0.53 3.00 67.00 64.00 including 0.9 8.3 0.70 13.15 128.15 115.00 TU - 17 - 524 1.7 18.9 1.31 4.00 127.00 123.00 including 0.4 0.2 0.42 4.95 52.45 47.50 TU - 17 - 525 1.3 25.0 0.82 32.00 122.50 90.50 TU - 17 - 525 2.9 42.9 2.01 9.35 107.35 98.00 including 3.8 53.2 2.75 5.00 106.00 101.00 including 4.3 104.9 2.19 3.05 150.00 146.95 TU - 17 - 525 1.9 56.5 0.76 4.70 169.50 164.80 TU - 17 - 525 5.1 149.8 2.09 1.35 168.45 167.10 including 0.3 10.8 0.11 1.55 180.10 178.55 TU - 17 - 525 0.3 0.2 0.27 5.00 50.50 45.50 TU - 17 - 526 1.4 26.6 0.91 14.70 110.70 96.00 TU - 17 - 526 0.8 26.5 0.29 2.50 158.95 156.45 TU - 17 - 526 1.7 57.5 0.56 1.15 170.40 169.25 TU - 17 - 526 0.2 6.7 0.11 7.90 190.90 183.00 TU - 17 - 526 1.7 25.6 1.16 10.25 117.45 107.20 TU - 17 - 528 2.1 39.8 1.35 4.00 115.40 111.40 including 8.7 375.8 1.21 2.00 127.50 125.50 TU - 17 - 528 0.4 16.5 0.08 1.60 189.50 187.90 TU - 17 - 528 Ixtaca - S - K 1300 Technical Report Summary Page 86 of 326 *Gold Equivalent based on a price of $1,250/ounce gold and $18/ounce silver*
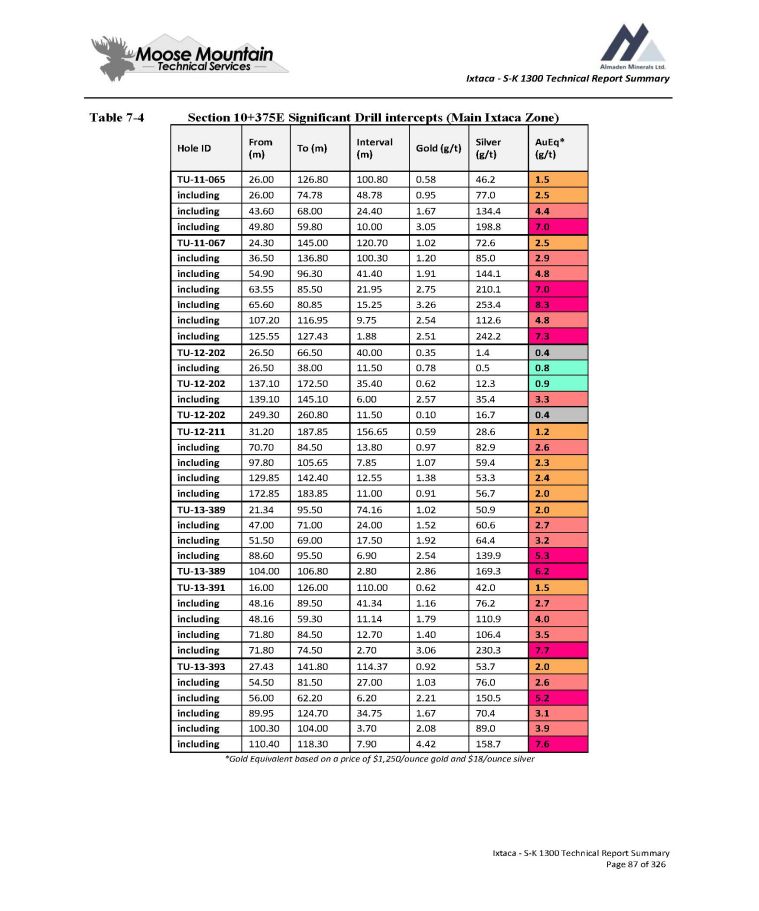
Ixtaca - S - K 1300 Technical Report Summary Table 7 - 4 Ixtaca - S - K 1300 Technical Report Summary Page 87 of 326 Section 10+375E Significant Drill intercepts (Main Ixtaca Zone) AuEq* (g/t) Silver (g/t) Gold (g/t) Interval (m) To (m) From (m) Hole ID 1.5 46.2 0.58 100.80 126.80 26.00 TU - 11 - 065 2.5 77.0 0.95 48.78 74.78 26.00 including 4.4 134.4 1.67 24.40 68.00 43.60 including 7.0 198.8 3.05 10.00 59.80 49.80 including 2.5 72.6 1.02 120.70 145.00 24.30 TU - 11 - 067 2.9 85.0 1.20 100.30 136.80 36.50 including 4.8 144.1 1.91 41.40 96.30 54.90 including 7.0 210.1 2.75 21.95 85.50 63.55 including 8.3 253.4 3.26 15.25 80.85 65.60 including 4.8 112.6 2.54 9.75 116.95 107.20 including 7.3 242.2 2.51 1.88 127.43 125.55 including 0.4 1.4 0.35 40.00 66.50 26.50 TU - 12 - 202 0.8 0.5 0.78 11.50 38.00 26.50 including 0.9 12.3 0.62 35.40 172.50 137.10 TU - 12 - 202 3.3 35.4 2.57 6.00 145.10 139.10 including 0.4 16.7 0.10 11.50 260.80 249.30 TU - 12 - 202 1.2 28.6 0.59 156.65 187.85 31.20 TU - 12 - 211 2.6 82.9 0.97 13.80 84.50 70.70 including 2.3 59.4 1.07 7.85 105.65 97.80 including 2.4 53.3 1.38 12.55 142.40 129.85 including 2.0 56.7 0.91 11.00 183.85 172.85 including 2.0 50.9 1.02 74.16 95.50 21.34 TU - 13 - 389 2.7 60.6 1.52 24.00 71.00 47.00 including 3.2 64.4 1.92 17.50 69.00 51.50 including 5.3 139.9 2.54 6.90 95.50 88.60 including 6.2 169.3 2.86 2.80 106.80 104.00 TU - 13 - 389 1.5 42.0 0.62 110.00 126.00 16.00 TU - 13 - 391 2.7 76.2 1.16 41.34 89.50 48.16 including 4.0 110.9 1.79 11.14 59.30 48.16 including 3.5 106.4 1.40 12.70 84.50 71.80 including 7.7 230.3 3.06 2.70 74.50 71.80 including 2.0 53.7 0.92 114.37 141.80 27.43 TU - 13 - 393 2.6 76.0 1.03 27.00 81.50 54.50 including 5.2 150.5 2.21 6.20 62.20 56.00 including 3.1 70.4 1.67 34.75 124.70 89.95 including 3.9 89.0 2.08 3.70 104.00 100.30 including 7.6 158.7 4.42 7.90 118.30 110.40 including *Gold Equivalent based on a price of $1,250/ounce gold and $18/ounce silver
Ixtaca - S - K 1300 Technical Report Summary Mineralized limestone, shale and the cross - cutting dykes are unconformably overlain by bedded crystal tuff, which is also mineralized . Mineralization within tuff rocks overlying the Ixtaca Zone occurs as broad zones of alteration and disseminated sulphides having relatively few veins . High - grade zones of mineralization are locally present within the tuff vertically above the Main Ixtaca and Ixtaca North vein systems and dykes . The high - grade zones transition laterally into low grade mineralization, which together form a broad tabular zone of mineralization at the base of the tuff unit . 7 . 2 . 2 Chemalaco Zone The Chemalaco Zone (also known as the Northeast Extension) of the Ixtaca deposit has an approximate strike length of 450 m oriented roughly north - south ( 340 azimuth) and has been drilled via a series of ENE ( 070 degrees) oriented sections spaced at intervals of 25 to 50 m, and near - surface oblique NNW - SSE oriented drillholes ( Figure 7 - 11 ) . The Chemalaco Zone dips moderately - steeply at 55 degrees WSW . High grade mineralization having a true - width ranging from less than 30 and up to 60 m has been intersected beneath approximately 30 m of tuff to a vertical depth of 550 m, or approximately 700 m down - dip . An additional sub - parallel zone has been defined underneath the Chemalaco having a true - width ranging from 5 to 40 m and dipping 25 to 50 degrees to the WSW, resulting in a splayed zone extending from near - surface to a vertical depth of 250 m . The sub - parallel zone has an approximate down - dip length up to 400 m over a 250 m strike length ( Table 7 - 5 ,Figure 7 - 14 ) . The Chemalaco Zone vein zone lies northeast of the Main Ixtaca Zone and occurs within the hinge zone of a shale cored antiform . Near surface, along the apex of the antiform, a zone of structurally thinned, brecciated, and mineralized limestone is unconformably overlain by mineralized tuff rocks (Figure 10 - 4 ) . At a vertical depth of 80 m below surface, high - grade shale - hosted mineralization dips moderately - steeply at 25 to 55 degrees WSW sub - parallel to the interpreted axial plane of the antiform . The footwall of the high - grade zone is marked by a distinct 20 to 30 m true - thickness felsic porphyry dyke (Chemalaco Dyke), which is also mineralized . The Chemalaco Dyke has been intersected in multiple drillholes ranging from 250 to 550 m vertically below surface, and its lower contact currently marks the base of Chemalaco Zone mineralization . The Chemalaco Zone remains open to depth and a long strike to the north . The system also remains open to the east as the limit of veining has not been defined across strike in this direction . Ixtaca - S - K 1300 Technical Report Summary Page 88 of 326
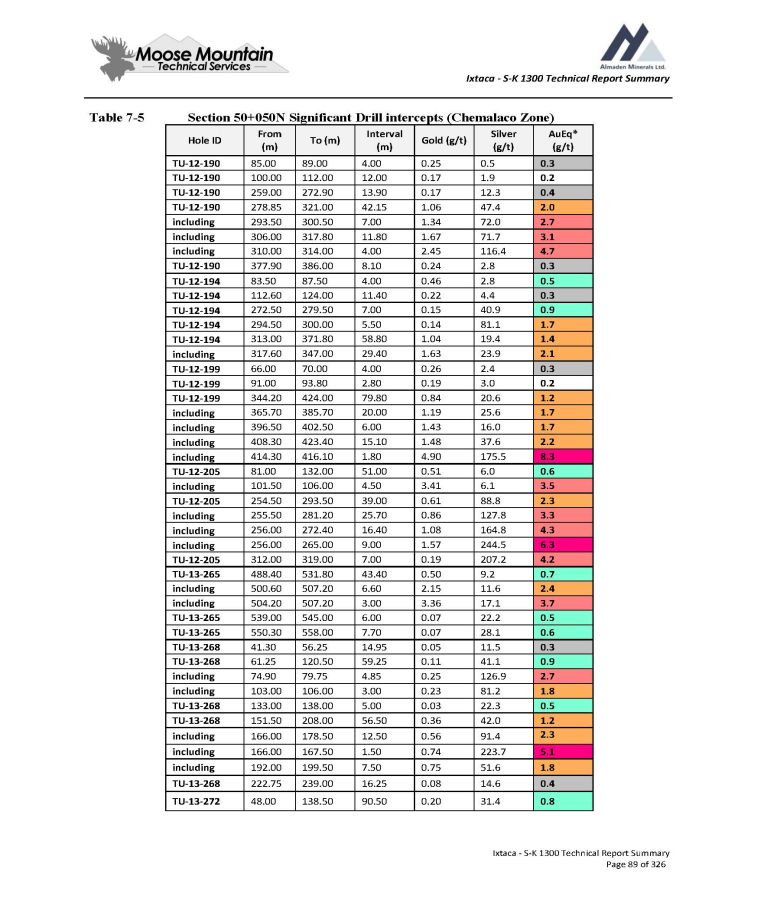
Ixtaca - S - K 1300 Technical Report Summary Table 7 - 5 Ixtaca - S - K 1300 Technical Report Summary Page 89 of 326 Section 50+050N Significant Drill intercepts (Chemalaco Zone) AuEq* (g/t) Silver (g/t) Gold (g/t) Interval (m) To (m) From (m) Hole ID 0.3 0.5 0.25 4.00 89.00 85.00 TU - 12 - 190 0.2 1.9 0.17 12.00 112.00 100.00 TU - 12 - 190 0.4 12.3 0.17 13.90 272.90 259.00 TU - 12 - 190 2.0 47.4 1.06 42.15 321.00 278.85 TU - 12 - 190 2.7 72.0 1.34 7.00 300.50 293.50 including 3.1 71.7 1.67 11.80 317.80 306.00 including 4.7 116.4 2.45 4.00 314.00 310.00 including 0.3 2.8 0.24 8.10 386.00 377.90 TU - 12 - 190 0.5 2.8 0.46 4.00 87.50 83.50 TU - 12 - 194 0.3 4.4 0.22 11.40 124.00 112.60 TU - 12 - 194 0.9 40.9 0.15 7.00 279.50 272.50 TU - 12 - 194 1.7 81.1 0.14 5.50 300.00 294.50 TU - 12 - 194 1.4 19.4 1.04 58.80 371.80 313.00 TU - 12 - 194 2.1 23.9 1.63 29.40 347.00 317.60 including 0.3 2.4 0.26 4.00 70.00 66.00 TU - 12 - 199 0.2 3.0 0.19 2.80 93.80 91.00 TU - 12 - 199 1.2 20.6 0.84 79.80 424.00 344.20 TU - 12 - 199 1.7 25.6 1.19 20.00 385.70 365.70 including 1.7 16.0 1.43 6.00 402.50 396.50 including 2.2 37.6 1.48 15.10 423.40 408.30 including 8.3 175.5 4.90 1.80 416.10 414.30 including 0.6 6.0 0.51 51.00 132.00 81.00 TU - 12 - 205 3.5 6.1 3.41 4.50 106.00 101.50 including 2.3 88.8 0.61 39.00 293.50 254.50 TU - 12 - 205 3.3 127.8 0.86 25.70 281.20 255.50 including 4.3 164.8 1.08 16.40 272.40 256.00 including 6.3 244.5 1.57 9.00 265.00 256.00 including 4.2 207.2 0.19 7.00 319.00 312.00 TU - 12 - 205 0.7 9.2 0.50 43.40 531.80 488.40 TU - 13 - 265 2.4 11.6 2.15 6.60 507.20 500.60 including 3.7 17.1 3.36 3.00 507.20 504.20 including 0.5 22.2 0.07 6.00 545.00 539.00 TU - 13 - 265 0.6 28.1 0.07 7.70 558.00 550.30 TU - 13 - 265 0.3 11.5 0.05 14.95 56.25 41.30 TU - 13 - 268 0.9 41.1 0.11 59.25 120.50 61.25 TU - 13 - 268 2.7 126.9 0.25 4.85 79.75 74.90 including 1.8 81.2 0.23 3.00 106.00 103.00 including 0.5 22.3 0.03 5.00 138.00 133.00 TU - 13 - 268 1.2 42.0 0.36 56.50 208.00 151.50 TU - 13 - 268 2.3 91.4 0.56 12.50 178.50 166.00 including 5.1 223.7 0.74 1.50 167.50 166.00 including 1.8 51.6 0.75 7.50 199.50 192.00 including 0.4 14.6 0.08 16.25 239.00 222.75 TU - 13 - 268 0.8 31.4 0.20 90.50 138.50 48.00 TU - 13 - 272
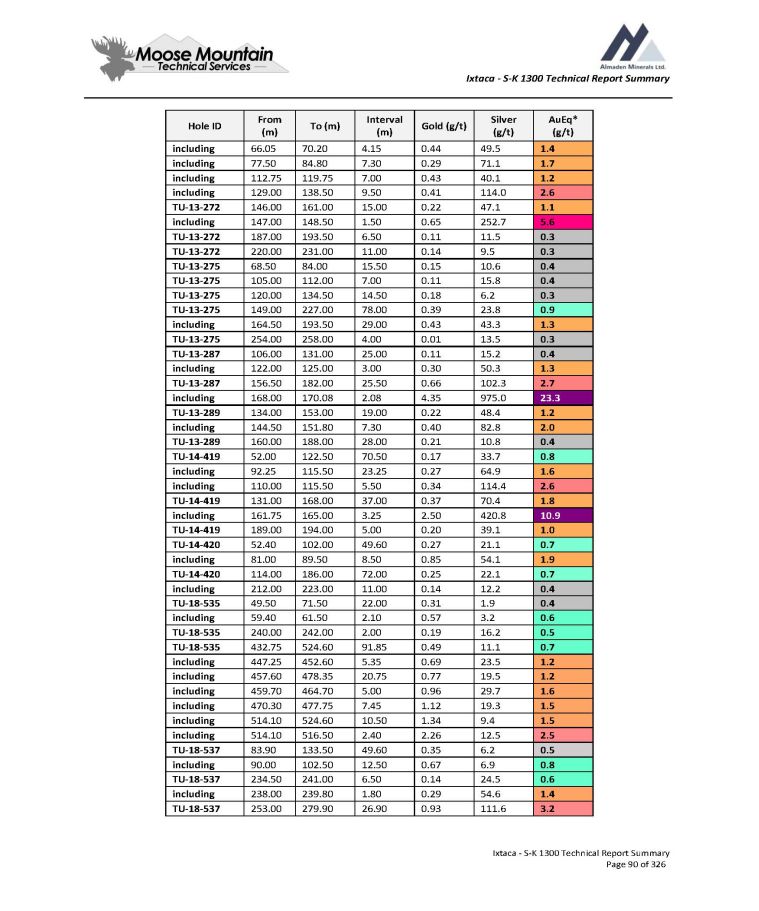
Ixtaca - S - K 1300 Technical Report Summary AuEq* (g/t) Silver (g/t) Gold (g/t) Interval (m) To (m) From (m) Hole ID 1.4 49.5 0.44 4.15 70.20 66.05 including 1.7 71.1 0.29 7.30 84.80 77.50 including 1.2 40.1 0.43 7.00 119.75 112.75 including 2.6 114.0 0.41 9.50 138.50 129.00 including 1.1 47.1 0.22 15.00 161.00 146.00 TU - 13 - 272 5.6 252.7 0.65 1.50 148.50 147.00 including 0.3 11.5 0.11 6.50 193.50 187.00 TU - 13 - 272 0.3 9.5 0.14 11.00 231.00 220.00 TU - 13 - 272 0.4 10.6 0.15 15.50 84.00 68.50 TU - 13 - 275 0.4 15.8 0.11 7.00 112.00 105.00 TU - 13 - 275 0.3 6.2 0.18 14.50 134.50 120.00 TU - 13 - 275 0.9 23.8 0.39 78.00 227.00 149.00 TU - 13 - 275 1.3 43.3 0.43 29.00 193.50 164.50 including 0.3 13.5 0.01 4.00 258.00 254.00 TU - 13 - 275 0.4 15.2 0.11 25.00 131.00 106.00 TU - 13 - 287 1.3 50.3 0.30 3.00 125.00 122.00 including 2.7 102.3 0.66 25.50 182.00 156.50 TU - 13 - 287 23.3 975.0 4.35 2.08 170.08 168.00 including 1.2 48.4 0.22 19.00 153.00 134.00 TU - 13 - 289 2.0 82.8 0.40 7.30 151.80 144.50 including 0.4 10.8 0.21 28.00 188.00 160.00 TU - 13 - 289 0.8 33.7 0.17 70.50 122.50 52.00 TU - 14 - 419 1.6 64.9 0.27 23.25 115.50 92.25 including 2.6 114.4 0.34 5.50 115.50 110.00 including 1.8 70.4 0.37 37.00 168.00 131.00 TU - 14 - 419 10.9 420.8 2.50 3.25 165.00 161.75 including 1.0 39.1 0.20 5.00 194.00 189.00 TU - 14 - 419 0.7 21.1 0.27 49.60 102.00 52.40 TU - 14 - 420 1.9 54.1 0.85 8.50 89.50 81.00 including 0.7 22.1 0.25 72.00 186.00 114.00 TU - 14 - 420 0.4 12.2 0.14 11.00 223.00 212.00 including 0.4 1.9 0.31 22.00 71.50 49.50 TU - 18 - 535 0.6 3.2 0.57 2.10 61.50 59.40 including 0.5 16.2 0.19 2.00 242.00 240.00 TU - 18 - 535 0.7 11.1 0.49 91.85 524.60 432.75 TU - 18 - 535 1.2 23.5 0.69 5.35 452.60 447.25 including 1.2 19.5 0.77 20.75 478.35 457.60 including 1.6 29.7 0.96 5.00 464.70 459.70 including 1.5 19.3 1.12 7.45 477.75 470.30 including 1.5 9.4 1.34 10.50 524.60 514.10 including 2.5 12.5 2.26 2.40 516.50 514.10 including 0.5 6.2 0.35 49.60 133.50 83.90 TU - 18 - 537 0.8 6.9 0.67 12.50 102.50 90.00 including 0.6 24.5 0.14 6.50 241.00 234.50 TU - 18 - 537 1.4 54.6 0.29 1.80 239.80 238.00 including 3.2 111.6 0.93 26.90 279.90 253.00 TU - 18 - 537 Ixtaca - S - K 1300 Technical Report Summary Page 90 of 326
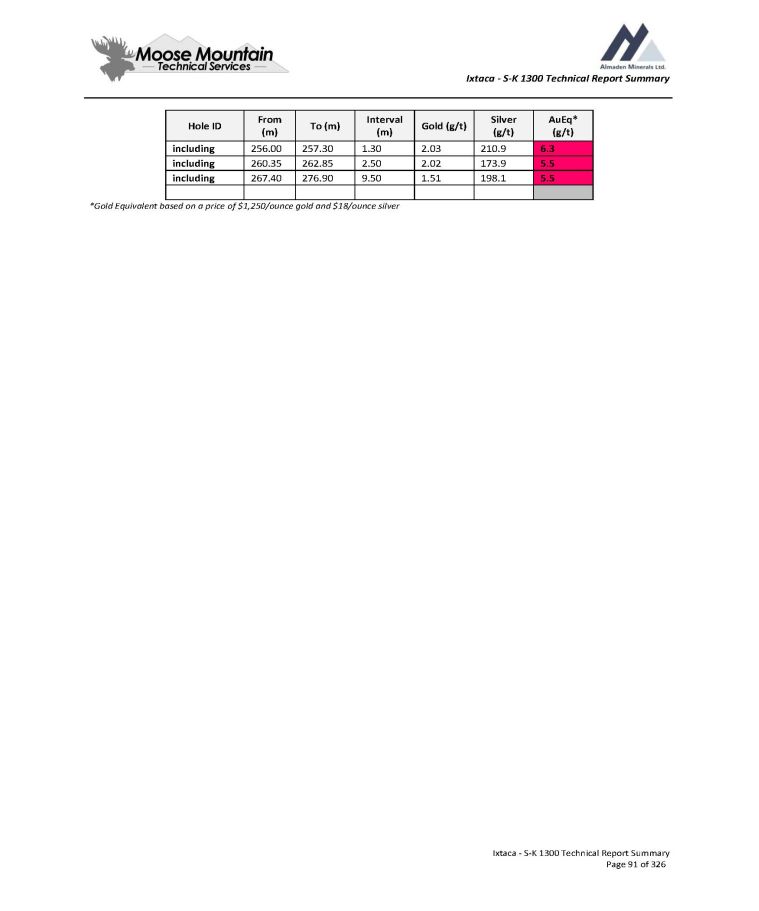
Ixtaca - S - K 1300 Technical Report Summary AuEq* (g/t) Silver (g/t) Gold (g/t) Interval (m) To (m) From (m) Hole ID 6.3 210.9 2.03 1.30 257.30 256.00 including 5.5 173.9 2.02 2.50 262.85 260.35 including 5.5 198.1 1.51 9.50 276.90 267.40 including Ixtaca - S - K 1300 Technical Report Summary Page 91 of 326 *Gold Equivalent based on a price of $1,250/ounce gold and $18/ounce silver
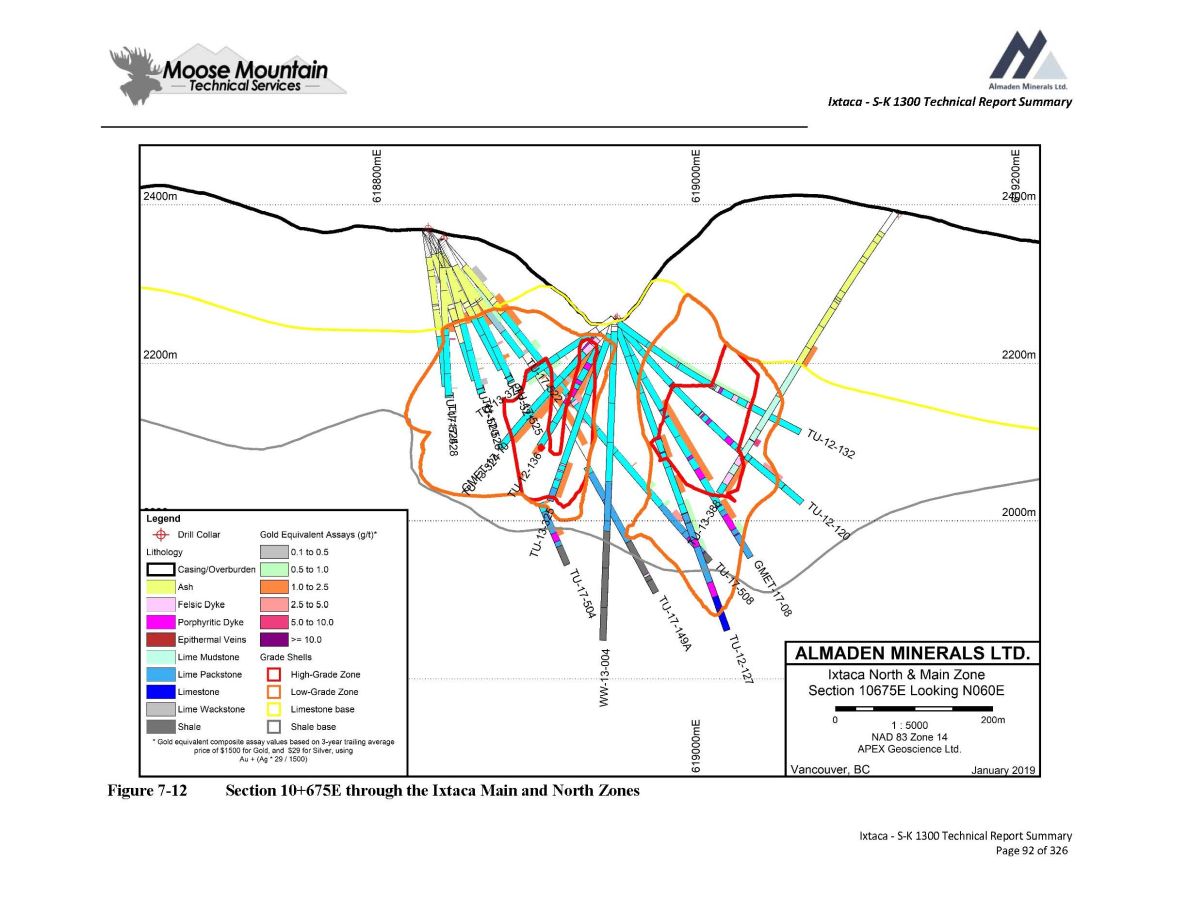
Ixtaca - S - K 1300 Technical Report Summary Figure 7 - 12 Section 10+675E through the Ixtaca Main and North Zones Ixtaca - S - K 1300 Technical Report Summary Page 92 of 326
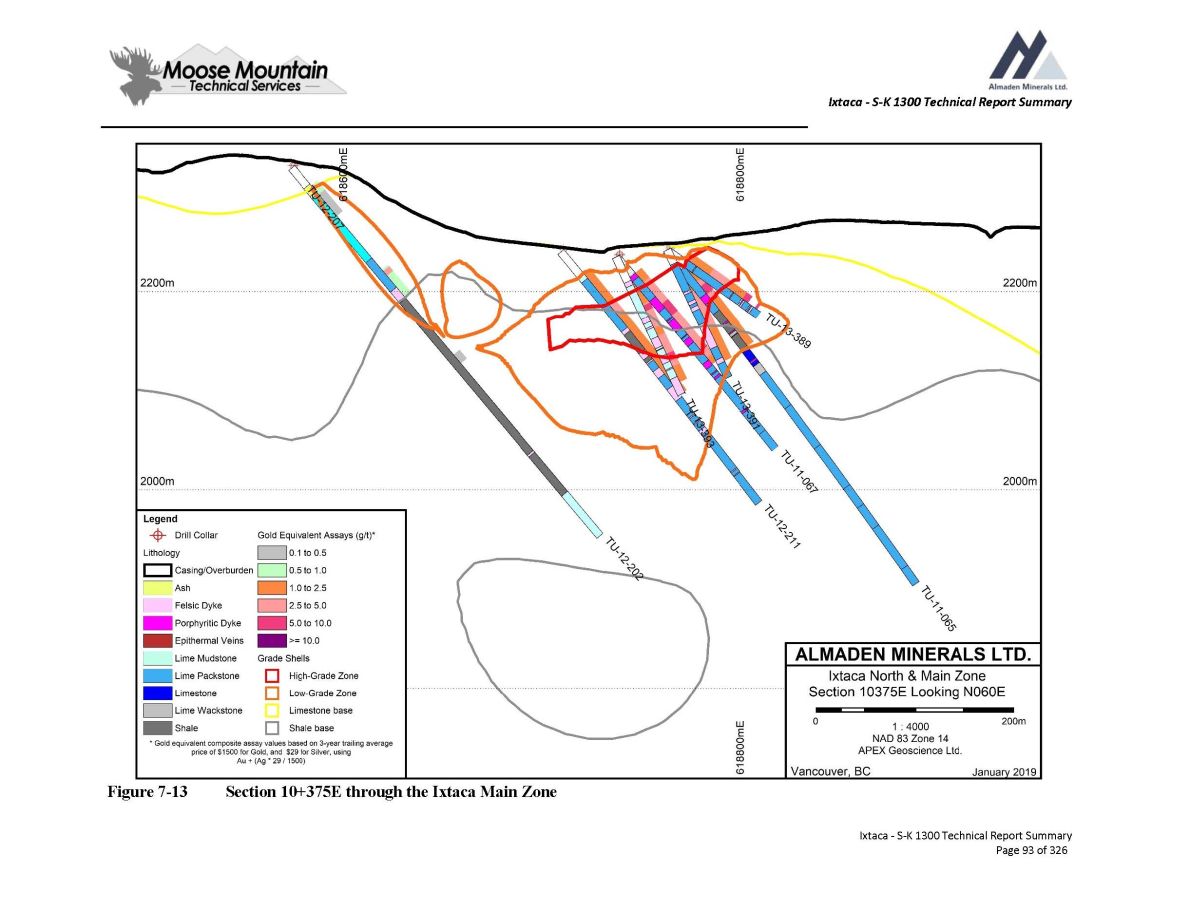
Ixtaca - S - K 1300 Technical Report Summary Figure 7 - 13 Section 10+375E through the Ixtaca Main Zone Ixtaca - S - K 1300 Technical Report Summary Page 93 of 326
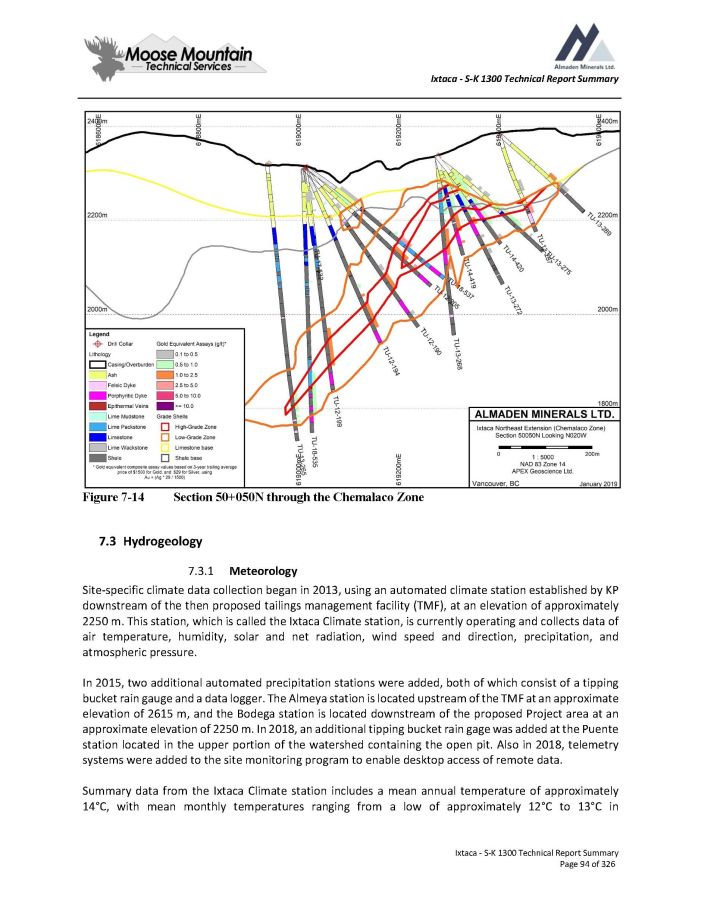
Ixtaca - S - K 1300 Technical Report Summary Figure 7 - 14 Section 50+050N through the Chemalaco Zone 3. Hydrogeology 1. Meteorology Site - specific climate data collection began in 2013 , using an automated climate station established by KP downstream of the then proposed tailings management facility (TMF), at an elevation of approximately 2250 m . This station, which is called the Ixtaca Climate station, is currently operating and collects data of air temperature, humidity, solar and net radiation, wind speed and direction, precipitation, and atmospheric pressure . In 2015 , two additional automated precipitation stations were added, both of which consist of a tipping bucket rain gauge and a data logger . The Almeya station is located upstream of the TMF at an approximate elevation of 2615 m, and the Bodega station is located downstream of the proposed Project area at an approximate elevation of 2250 m . In 2018 , an additional tipping bucket rain gage was added at the Puente station located in the upper portion of the watershed containing the open pit . Also in 2018 , telemetry systems were added to the site monitoring program to enable desktop access of remote data . Summary data from the Ixtaca Climate station includes a mean annual temperature of approximately 14 Σ C, with mean monthly temperatures ranging from a low of approximately 12 Σ C to 13 Σ C in Ixtaca - S - K 1300 Technical Report Summary Page 94 of 326
Ixtaca - S - K 1300 Technical Report Summary December/January to a high of approximately 16 Σ C to 17 Σ C in April/May/June . Other metrics from the station include (Knight Piésold, 2017 ) : Relative humidity measurements indicate that the climate is reasonably dry, particularly in the winter months, with an annual average of approximately 70%. Over an approximate three - year period, the maximum wind speed was 14.9 m/s, and monthly average wind speeds ranged from 2 m/s to 3 m/s. The predominant wind directions were north and north - west. Solar radiation is typically greatest in April and least in October, and ranges from approximately 5.9 kWh/m² to 3.4 kWh/m². The mean annual lake evaporation is estimated to be approximately 714 mm, with monthly mean values ranging from approximately 46 mm in December/January to 74 mm in May. The long - term mean annual precipitation is estimated to be 720 mm, and occurs entirely as rainfall. The wet season is from May to October, when 84% of annual rainfall is expected to occur, on average. The wettest month is typically June. Rainfall on site, particularly during the wet season, tends to arrive in short duration, high intensity bursts. Barometric pressure is relatively uniform year round at approximately 102.6 kPa. Additionally, climate data are available from Government of Mexico regional meteorological stations ; several of which are located within 35 km of the Project, each with over 25 years of daily data on precipitation, evaporation, and minimum and maximum temperatures . The Ixtaca Climate station data were compared to the regional stations and found to have similar data trends . 7 . 3 . 2 Surface Hydrology The local climate along with size, vegetation cover, and soil and rock types of each drainage basin all contribute to the runoff response of Project area watersheds . Typical of many areas in Mexico, the Project experiences rainfall primarily as short duration, high - intensity storm events during the wet season (May to October) . This type of precipitation distribution combined with the steep topography and poorly draining soils results in a rapid runoff response with correspondingly high peak flows of short duration . The distinct dry and wet climatic seasons in the region result in intermittent and episodic streamflows in the wet season and little to no flow during the dry season . The Project area streams are above the water table and constant baseflow is not observed ; however, interflow/ temporary baseflow is observed as flows decrease from low to little or no flow through the dry season . Five streamflow monitoring stations were installed at the Project in 2014 and were enhanced in 2017 following complications with high sediment loads and were further updated in late 2018 . Continuous streamflow records for streams in the Project area are currently being collected . Data collected to date include the following (Knight Piésold, 2017 ) : The mean annual runoff is estimated to range from 58 mm (1.8 l/s/km2) to 87 mm (2.8 l/s/km2). Streams in the area follow an episodic/ephemeral hydrologic regime, and the annual hydrographs mimic the patterns of annual precipitation, with the highest flows typically occurring during the wet Ixtaca - S - K 1300 Technical Report Summary Page 95 of 326
Ixtaca - S - K 1300 Technical Report Summary season of May to October and the lowest flows occurring during the dry season of November to April . The stage records for the Project site stream gauges exhibit the ‘flashy nature’ of streams in the area, with water levels rising and falling very rapidly in response to short duration high - intensity rainstorms . Return period peak discharge values at the Project were calculated to range between 2 m 3 /s for a 2 - year return period, up to 77 m 3 /s for a 500 - year return period . Flows typically fall to very low levels during the dry season, and some creeks go completely dry for short and extended periods each year . Low flows are typically higher at the Project area in northern upland sites than in southern lowland sites . 7.3.3 Surface Water Quality Surface water quality sampling sites were established to target background and pre - mining (baseline) water quality upstream and downstream of the project facilities . Thirteen surface water monitoring locations were sampled as conditions allowed from 2009 to 2016 (KP, 2017 a) and in 2018 by SRK (SRK, 2018 ) . The surface water quality monitoring locations are shown on Figure 20 - 1 . Sample collection has been intermittent depending on flow conditions . Upstream sites in the El Tecolote and Coxalenteme catchments had sufficient flow to sample surface water quality year - round but the monitoring sites in the lower reaches of these catchments were frequently reported as dry outside of the rainy season (KP, 2017 a) . Flow conditions were always sufficient to collect water quality samples from the monitoring locations farther downstream in the Rio Apulco and Rio Los Lobos and only occasionally reported as dry in the Rio Los Ameles . During the most recent sampling event in April 2018 , only four of the 13 surface water monitoring stations had adequate water for sampling (Apulco, Hotel, Puente, and Sector Riego) . After the April 2018 site visit it was recommended the removal of four monitoring stations (Tuligtic 1 , Tuligtic 2 , El Protrero, and RLA 100 E) . Water within the project area is generally classified as neutral to slightly basic, hard to very hard and well - buffered, with variable turbidity and total suspended solids (KP, 2017 a) . Turbidity and TSS exceed the relevant water quality standards at some sites . Metal concentrations were generally highest toward the end of the wet season, in September and October, and conclusions regarding concentrations at most sites during the drier season cannot be made as samples were not typically collected due to insufficient flow . When compared with the water quality standards of Ley Federal de Derechos (aquatic life), NOM - 127 - DW (drinking water standards), and NOM - 001 (discharge standards for irrigation and aquatic life), the baseline surface water quality exceeds numerous standards . The most frequent aquatic life guideline exceedances were reported for total suspended solids, ammonia, dissolved and total aluminum, dissolved and total barium, and total iron . Concentrations of these parameters exceeded the standard in most samples collected from most sites . Total lead and zinc also exceeded the standard in samples collected from most sites ; however, standard exceedances were less frequent (i . e . less than half of the total number of samples) . Parameters that exceeded the standard sporadically or at only one or two sites include total beryllium, chromium, copper, mercury, molybdenum, and silver, and dissolved iron, molybdenum, and zinc . Ixtaca - S - K 1300 Technical Report Summary Page 96 of 326

Ixtaca - S - K 1300 Technical Report Summary Parameters that exceeded irrigation standards in at least one sample collected from most sites include TSS, total aluminum, total iron, and total manganese . Fluoride, sulphate, and dissolved manganese concentrations also exceeded the standard in at least one sample ; however, exceedances were limited to one or two sites . Exceedances of the drinking water standard (NOM - 127 - DW) were frequently reported for pH, turbidity, ammonia, nitrite, dissolved and total aluminum and iron, and total barium, manganese, and sodium . Parameters that exceeded the drinking water standard less frequently include sulphate, dissolved manganese, and total cadmium and chromium . Elevated baseline concentrations of metals and other parameters are common in areas close to mineral deposits (e . g . , the El Tecolote and Coxalenteme catchments), or in large river systems that carry high total suspended solids (e . g . , the Río Apulco/Río Los Ameles) . The site locations are illustrated on Figure 7 - 15 . Ixtaca - S - K 1300 Technical Report Summary Page 97 of 326
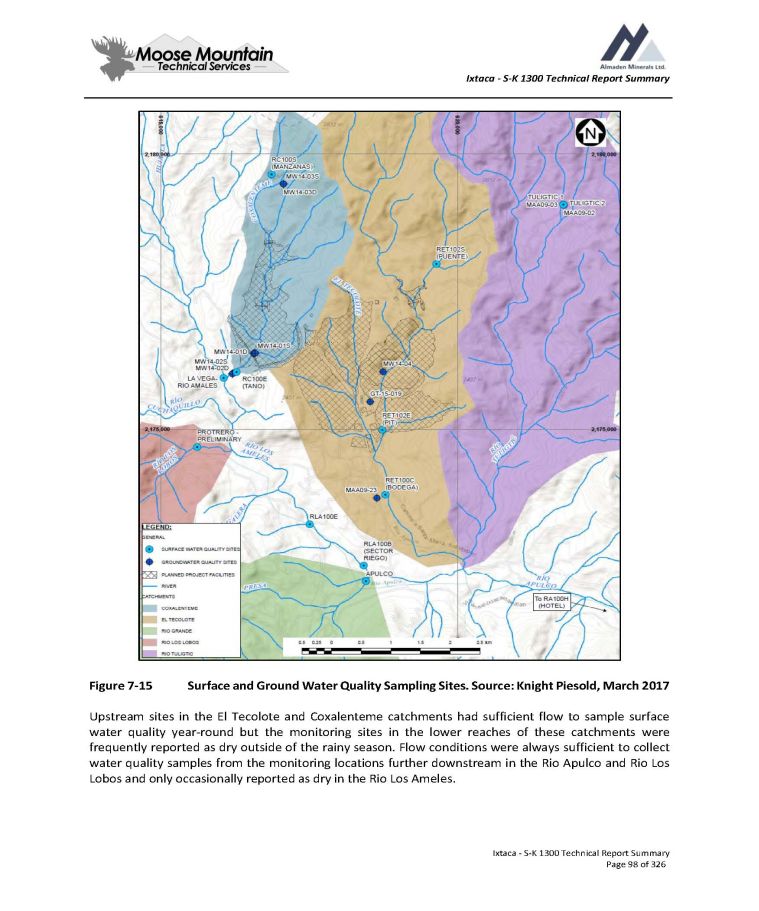
Ixtaca - S - K 1300 Technical Report Summary Figure 7 - 15 Surface and Ground Water Quality Sampling Sites . Source : Knight Piesold, March 2017 Upstream sites in the El Tecolote and Coxalenteme catchments had sufficient flow to sample surface water quality year - round but the monitoring sites in the lower reaches of these catchments were frequently reported as dry outside of the rainy season . Flow conditions were always sufficient to collect water quality samples from the monitoring locations further downstream in the Rio Apulco and Rio Los Lobos and only occasionally reported as dry in the Rio Los Ameles . Ixtaca - S - K 1300 Technical Report Summary Page 98 of 326
Ixtaca - S - K 1300 Technical Report Summary Ion concentrations generally decreased from upstream to downstream and were higher in the Coxalenteme and El Tecolote catchments than at sites outside of the project area . Water within the project area is generally classified as neutral to slightly basic, hard to very hard and well - buffered, with variable turbidity and total suspended solids (TSS) . Turbidity and TSS increased from upstream to downstream within the Coxalenteme and El Tecolote catchments and exceeded the relevant water quality standards at some sites . Total and dissolved concentrations of some metals (aluminum, copper, chromium iron, and lead) increased from upstream to downstream in the El Tecolote catchment and in the Coxalenteme catchment . Metal concentrations were generally highest toward the end of the wet season, in September and October . Analytical results were compared with the water quality standards included in the following : Ley Federal de Derechos (LFD) and Norma Oficial Mexicana (NOM ; NOM - 127 - DW (drinking water standards) and NOM - 001 (discharge standards for irrigation and aquatic life)) . The standards were selected based on the potential local uses, which include : Aquatic Life (NOM 001 Aq and LFD - Aq), Irrigation (NOM - 001 - Irrigation and LFD - Irrigation), and Drinking Water (NOM - 127 - DW) . 7.3.4 Groundwater Previous studies of the groundwater, including monitoring well constructions, hydraulic testing, water - quality testing, and environmental background and pre - mining (baseline)studies were conducted by Hidrogeologos Consultores ( 2013 ) and Knight Piésold ( 2014 , 2017 a, 2017 b, and 2017 c) . For the Ixtaca Technical Report Summary, a field data collection program for hydrogeologic characterization and developed a 3 D numerical model of groundwater flow beneath the Ixtaca Project area . Field activities consisted of packer isolated interval testing (packer testing) ; monitoring well construction, development, and testing of newly installed and existing wells ; and water level monitoring . A report (SRK, 2018 ) documents the field work and groundwater modeling . The study evaluates pre - mining, mining, and post - mining hydrogeological conditions and predicts dewatering requirements, and potential environmental impacts . The proposed Project facilities lie in two catchment areas, which are tributaries of the Río Los Ameles/Río Apulco river system : Coxalenteme and El Tecolote . Streams in the area follow an episodic/ephemeral hydrologic regime (Knight Piésold, 2017 b) . The annual hydrographs mimic the pattern of annual precipitation, with the highest flows typically occurring during the wet season of May to October and the lowest flows occurring during the dry season of November to April . Water use in the project area consists of domestic use of springs occurring in the catchment above the project area . Springs and seeps within the project area were mapped and characterized by AML personnel . Additional springs and seeps within the region mapped by outside sources were provided by AML . These data along with water levels within the project area were combined to evaluate and understand groundwater gradients, to evaluate potential variability in hydraulic conductivity, and to further refine the conceptual groundwater model . The 2018 field program consisted of drilling four core holes, packer testing, monitoring well installation, hydraulic testing of existing and newly installed wells, and water level monitoring . A summary of prior Ixtaca - S - K 1300 Technical Report Summary Page 99 of 326

Ixtaca - S - K 1300 Technical Report Summary testing, instrumentation, and well construction information for the Ixtaca Project was compiled from multiple volumes of historic reports, figures, and appendices . Based on the review, 58 existing water level monitoring, testing, and installation points were identified within the project boundary . Water level elevations range from 49 . 5 mbgs and 2 , 554 meters above measured sea level (mamsl) in the high country north of the project area to 30 . 5 mbgs and 2 , 540 mamsl in the low country south of the pit area . Generally, groundwater flow follows topography, with a steep downward gradient from north to south near the project . Two areas do not follow the general pattern, including an area underlain by undifferentiated ash units west of the proposed pit, and the lowland area south of the proposed pit . Both exhibit relatively flat - water tables . Hydraulic testing during the 2018 field program was done using packers to isolate test intervals in the newly drilled core holes before well construction . Additional testing was performed in accessible existing and newly - installed monitoring wells . Testing included slug tests, constant - rate injection tests, and constant - head injection tests . Lower permeability intervals were tested using stepped - pressure, or Lugeon methods . A total of 44 tests were performed during the 2018 field program ( 21 packer and 23 wells tested) . An additional 203 packer and well tests were performed during previous field campaigns between 2012 and 2017 . Short - term hydraulic testing revealed a wide range of hydraulic conductivity values within the various hydrogeologic units of the project area . After careful review of the historic data, it was decided not to use the information in developing the 3 D numerical groundwater model . However, in the future these data may be useful in mitigating uncertainties or in identifying areas requiring additional characterization . The conceptual model of groundwater flow at Ixtaca includes the following components : The long - term mean annual precipitation is estimated to be 720 mm and occurs entirely as rainfall . The wettest month is typically June . The mean annual evapotranspiration is estimated to be approximately 714 mm, with monthly mean values ranging from 46 mm in December to 74 mm in May . Groundwater recharges from precipitation and generally flows from topographically high areas (highland with elevation of about 3 , 000 mamsl in the north to topographically low areas in the south (the lowest elevation is 2 , 150 mamsl at the Rio Apulco River south of the proposed pit) . The recharge from precipitation in the highlands is estimated to be 72 mm/a or 10 % of precipitation . The recharge in the lowlands is estimated to be about 14 . 4 mm/a or 2 % of precipitation . These recharge rates, and their distribution based on topography were obtained during the process of model calibration to measured water levels . Rio Grande and Rio Apulco are primary rivers near the project and groundwater discharges into them and their tributaries . Flows in these rivers decrease significantly during dry months . Additional rivers in the region that are typically ephemeral include Rio Loa Ameles, Rio Los Lobos, and Rio Tuligitic . Hydrogeologic units in the project area include : o Volcaniclastics – The volcaniclastic unit shows localized sub - layers of fine ash, coarse ash, breccia, and lapilli tuff . Permeability of the volcaniclastics varies depending on the degree of consolidation and fracturing . Volcaniclastic materials associated with hydrothermal alteration are typically more competent and more prone to fracturing, which increases the permeability . o Limestone and Shale – The sedimentary units are typically of low permeability, but hydraulic conductivity increases locally along fold axes and near the intrusive contact . Ixtaca - S - K 1300 Technical Report Summary Page 100 of 326

Ixtaca - S - K 1300 Technical Report Summary o Intrusions/Dikes – The intrusive bodies are expected to have low permeability, except at the contacts with host rocks . Fracturing and permeability locally increases in the sedimentary host rocks near intrusions . o Structure – The limited testing conducted across faults during drilling did not identify structures with increased permeability or faults acting as major barriers to groundwater flow . o Additional to bedrock water - bearing zones, saturated overburden is present within the project area . The overburden is generally thin (less than 1 m) but reaches up to 7 m thick in river valleys . Zones of alluvium, colluvium, ash - tuff, and/or an agglomeration of all may be up to 100 m thick based on drilling information south of the proposed pit location . Measured hydraulic conductivity values vary over a wide range, from 0 . 00003 m/d to 9 m/d (by more than five orders of magnitude as described in Section 3 ) and do not allow definition of hydrogeological units based on lithological signature . Available testing data indicates that the measured hydraulic parameters show a trend of hydraulic conductivity decreasing with depth . Based on the analyses, three major hydrogeological units were defined : o Shallow bedrock (upper 50 m) with intermediate hydraulic conductivity; o Intermediate bedrock (depth from 50 to 300 m) with low hydraulic conductivity; and o Deep bedrock (depth below 300 m) with very low hydraulic conductivity. Water level elevations throughout the project area exhibit a steep hydraulic gradient, with levels ranging from 2 , 540 mamsl in the highlands north of the project to 2 , 154 mamsl just south of the pit over approximately 4 . 5 km . This generally indicates the presence of low hydraulic conductivity rocks . Flat water level gradients were observed in the ash west of the proposed pit at 2 , 350 mamsl and the area south of the proposed pit extending to the Rio Apulco at 2 , 150 mamsl . These flat groundwater gradients support the assumption that these areas exhibit elevated hydraulic conductivity . A numerical groundwater model for the Ixtaca Project was developed using the MODFLOW - SURFACT finite - difference code (Hydrogeologic, 1996 ; Harbaugh and McDonald, 1996 ) and the Groundwater Vistas v . 7 interface developed by Environmental Simulations, Inc . (Rumbaugh and Rumbaugh, 2017 ) . The groundwater model domain covers approximately 157 square kilometers (km 2 ) within the vicinity of the proposed open pit mine . The northern, western and eastern model boundaries primarily follow topographic divides and/or are parallel to regional groundwater flow and are thus assumed to be ‘no flow’ boundaries . The southern boundary is defined by the Apulco River . Twelve model zones were created considering the low and high hydraulic conductivity values established from historic aquifer testing data . Each model zone has specific values for horizontal (Kh) and vertical (Kz) hydraulic conductivity (K), specific storage (Ss) and specific yield (Sy) . Storage parameters are based on literature and on experience from projects with similar conditions . The creeks and springs in the model area are represented by ‘drain cells’ . The Apulco River is assumed to flow for most of the year . Within the model area it is therefore represented using model ‘river cells’ . The mine plan for the open pit was dated 6 August 2018 and consists of annual pit layouts that span an 11 - year period . They were processed into drain cells with the location and head representing the elevation of the pit for each time period . The model simulates transient filling of the pits using the LAK 2 package for MODFLOW - SURFACT (Council 1997 ) . Lake cells were assigned based on the ultimate pit - shell excavations and planned backfill, as provided by Ixtaca ( 2018 ) . Ixtaca - S - K 1300 Technical Report Summary Page 101 of 326

Ixtaca - S - K 1300 Technical Report Summary Head distribution in a steady state calibration depends on recharge, hydraulic conductivity values (K), sources, sinks and boundary conditions . In the case of the Ixtaca model, the valid K values from short - term tests are considered good qualitative indicators of the properties of the rocks . However, because of the limited number of valid tests and the concentrated coverage (within the proposed pit extents) of the 2018 tests, the numerical model does not rely on K values for calibration . Instead, water level elevations from the existing monitoring wells are used . The short - term tests are used qualitatively to adjust the numerical groundwater model where needed . The calibration objective was reached when an acceptable correlation was obtained between the observed and simulated water levels and hydraulic gradient . Twenty - six of the 34 target water levels over the model area were calibrated to within 3 m of observed, and 4 of the remaining 8 were within 4 m of observed . No long - term hydraulic test data suitable for transient calibration are available for the Ixtaca site . Consequently, a transient calibration was obtained using water level fluctuations in response to seasonal recharge . Recharge factors were calculated over a 3 - year period and the resultant fluctuations in groundwater levels compared to water level observations . In the author’s opinion, the groundwater model reproduces hydrogeological conditions prior to the mining and reasonably calibrated to the measured water levels, and the model can be used for predictive simulations . Predicted passive groundwater inflows to the proposed pit range between 19 L/s ( 1 , 618 m 3 /d) and 34 L/s ( 2 , 974 m 3 /d) . Changes in simulated average pit inflows over time will occur in response to the mine pit elevation, the extent of the mine pit area, and the drawing down of the local water table over time through release of groundwater storage . The maximum inflows are reached in year 2 ( 34 L/s when the open pit is rapidly excavated within the most permeable upper bedrock) and the final pit inflow in year 11 is 20 L/s . Actual pit groundwater inflows are likely to be sporadic, with higher inflows related to the intersection of preferential groundwater flow paths (such as fractures) during mining . Based on the predictive results, the groundwater inflow into the pit could be handled passively (by in - pit sumps) without any active dewatering by perimeter wells or pit wall horizontal holes . Additional inflow from direct precipitation to the pit (less evaporation) is estimated to be 29 L/s ( 2 , 517 m 3 /d) under average long - term conditions . Thus, direct precipitation to the pit will likely form the largest component of water to be pumped from the pit sumps during mining . It is assumed that up - gradient/ catchment runoff will be diverted around the pit during mining to the extent possible . Groundwater flow near the open pit is predicted to be radially inward from all directions . The predicted change in the long - term water table from pre - mining water levels reaches a maximum of 200 m within the pit . The 1 - m drawdown zone extends 1 km north of the pit, 2 km west of the pit, 1 . 5 km east of the pit and 3 km south of the site, thus just reaching the banks of the Apulco River . In response to the lowered groundwater levels around the pit during mining, groundwater baseflow to the creeks and springs in the catchment are predicted to decrease by 9 % (from 5 , 937 m 3 /d to 5 , 420 m 3 /d ; 69 L/s to 63 L/s) compared to pre - mining conditions . In addition, net groundwater baseflow to the Apulco River decreases from an average of 8 L/s ( 710 m 3 /d) to a net groundwater contribution of 0 L/s during the 11 years of mining . The model predicts that a pit lake will form after mining, and the pit lake will exhibit both spillover and flow - through characteristics . The pit lake will reach 90 % of full recovery within 90 to 100 years . After 113 years, the pit lake elevation reaches the maximum possible stage ( 2 , 230 mamsl) before surface spillover Ixtaca - S - K 1300 Technical Report Summary Page 102 of 326

Ixtaca - S - K 1300 Technical Report Summary commences at a rate of 15 L/s down - gradient (south) of the pit . Groundwater seepage will be only inwards for the first 40 years following the end of mining ; thereafter, there will also be groundwater outflows, with equilibrium conditions being 7 L/s inflow and 6 L/s outflow to groundwater . There are varying levels of uncertainty associated with model parameters, and sensitivity analysis was undertaken to evaluate the implications of these uncertainties . The sensitivity analysis results indicate that the model is most sensitive to increases in the specific yield . The results have a medium sensitivity to hydraulic conductivities . Doubling the hydraulic conductivity of the hydrogeological units increases the average dewatering rate by 21 % , with the range being between 25 L/s and 35 L/s ; Doubling the specific yield and specific storage increases the average dewatering rate by 42 % , with the range being between 27 L/s and 46 L/s . Sensitivity analysis indicates that the post - mining simulation results are most sensitive to precipitation parameters, where alterations by 25 % decrease/increase start of surface spillover by 25 years and flow rates increase/decrease by 7 L/s . 7 . 3 . 5 Groundwater Quality To provide background and pre - mining (baseline)groundwater data for the project, seven groundwater monitoring wells were installed in 2014 (KP, 2015 ) . About a year later geotechnical borehole GT - 15 - 019 was converted to a monitoring well . The groundwater quality monitoring program includes both upgradient and downgradient groundwater wells . Monitoring well locations are shown on Figure 7 - 15 . Ixtaca - S - K 1300 Technical Report Summary Page 103 of 326

Ixtaca - S - K 1300 Technical Report Summary Figure 7 - 16 Locations of Ground Water Quality Sampling Sites (from KP, 2017b) Three dominant groundwater types have been identified in the Project area (KP, 2017 b) : ( 1 ) calcium - sulphate, ( 2 ) calcium - bicarbonate, and ( 3 ) sodium - bicarbonate . A few locations have intermediate water types, specifically with respect to the dominance of carbonate or sulphate . Water types are not well correlated to specific lithological units but are likely influenced by their position within the watershed, localized geochemical enrichment, localized mineral enrichment, and residence time of the groundwater in the vicinity of each of the monitoring wells . Groundwater in the project area is generally characterized as neutral to slightly basic pH, alkaline with strong buffering capacity and varied hardness . When compared with the water quality standards of Ley Federal de Derechos (aquatic life), NOM - 127 - DW (drinking water standards), and NOM - 001 (discharge standards for irrigation and aquatic life), the baseline groundwater quality exceeds numerous standards . Samples collected from monitoring wells in the upper Rio Coxalenteme and the Rio El Tecolote areas exceed the NOM - 127 - SSA 1 - 1994 Drinking Water Standard for hardness . Concentrations above standard are also noted for total dissolved solids, fluoride, arsenic, iron, manganese, and molybdenum (KP, 2017 b) . Ixtaca - S - K 1300 Technical Report Summary Page 104 of 326
Ixtaca - S - K 1300 Technical Report Summary 4. Geomechanical A geomechanical investigation program was completed on site for the Project from February 12 , 2018 to April 27 , 2018 . Drilling commenced on February 12 , 2018 and was completed on April 23 , 2018 . The program was designed to characterize geomechanical conditions in support of the development of the FS pit design . The slope angle recommendations contained in this report may be used for final design and mine planning, subject to completion of the recommendations contained in Section 23 . 3 . 3 of this report . It has been noted that all large earthwork and open pit projects at a final design level will be modified and changed based on slope monitoring, observed conditions, and recommendations of professional engineers engaged on the project . Four major geomechanical domains have been identified in the project . The rock slopes are composed of limestone and shale and an ash tuff volcanic domain that controls the stability of the upper 50 to 250 meters (m) of the ground . The volcanic ash tuff domain is a very weak rock unit that has engineering properties similar to stiff soils . It is weak and easily erodible . A fourth domain of dikes was identified but is not a significant percentage of the final wall rock slopes . In the author’s opinion, the quality and quantity of core hole data and rock mass characterization is sufficient for a FS study . 1. Ash Tuff and Upper Volcanics Rock quality designation (RQD) values of the volcanic domain are in the 0 to 20 range . Even though larger piece lengths were observed the rock hardness was less than R 2 (weak rock with strengths less than 5 MPa) not meeting the RQD criteria . The rock mass rating (RMR 76 ) ranges from 30 to 50 , which indicates a weak and poor to fair quality rock mass . When the ash tuff cuts are exposed they will be subjected to the deformation, erosion, and failure mechanisms because of their low strength . Even though the ash tuff slope cuts have been designed to meet the minimum slope acceptance criteria at a factor of safety of 1 . 3 , some local slope failure mechanisms might occur that are not addressed by global or inter - ramp stability analysis . These failure mechanisms include gullying, piping, and erosion . These mechanisms will be exacerbated by precipitation onto exposed slopes that have not been vegetated or covered by erosion control . Berm and bench surfaces should be graded at 2 Σ to 3 Σ to assist drainage off benches . 2. Rock Units (Limestone, Shale, Dikes) The rock units consist of limestone, shale, and dikes . Structural features (discontinuities) encountered during this field investigation consisted of joints, lithological contacts, veins, dikes, foliation, faults, shear zones, and fractures in these three domains . The limestone domain is characterized as moderately strong rock with UCS values ranging from 10 to 40 megapascals (MPa) . RQD values in the limestone range from 60 to 100 . The limestone is moderately jointed and has a rock mass rating ranging from 50 to 70 indicating a good rock mass . The shale domain is a weak rock mass with UCS values ranging from 5 to 20 MPa . The shale unit is a highly foliated and weak rock mass and has a varying foliation dipping between 40 Σ to 50 Σ at a dip direction of Ixtaca - S - K 1300 Technical Report Summary Page 105 of 326

Ixtaca - S - K 1300 Technical Report Summary 250 Σ . RQD values in the shale range from 50 to 100 and the rock mass rating ranges from 40 to 65 , which indicates a fair to good quality rock mass . The bulk of the final wall will be controlled by the rock mass properties of the shale domain . The intrusive dikes have not been differentiated in the geotechnical model as they will be governed by the strength of the shale or limestone rock mass . The dikes are characterized as strong with UCS values ranging from 50 to 70 MPa and have a RMR 76 of 55 to 80 indicating the dikes are a strong and good rock mass where present . Ixtaca - S - K 1300 Technical Report Summary Page 106 of 326
Ixtaca - S - K 1300 Technical Report Summary 1. Sample Preparation, Analyses and Security The information in this section was drawn from the most recent major study prepared entitled “The Ixtaca Gold - Silver Project Puebla State, Mexico NI 43 - 101 Technical Report on the Feasibility Study” dated January 24 th 2019 and updated October 3 , 2019 . 1. Sample Preparation and Analyses 1. Rock Grab and Soil Geochemical Samples Rock grab and soil geochemical samples have been transported by Almaden field personnel to the Santa Maria core facility where they are placed in into sealed plastic twine (rice) sacks, sealed using single plastic cable ties . Custody of samples is handed over to ALS Minerals (ALS) at the Santa Maria core facility . ALS sends its own trucks to the Project to transport samples to its sample preparation facility in Guadalajara or Zacatecas, Mexico . Prepared sample pulps are then forwarded by ALS personnel to the ALS North Vancouver, British Columbia laboratory for analysis . ALS is an International Standards Organization (ISO) 9001 : 2008 and ISO 17025 - 2005 certified geochemical analysis and assaying laboratory . ALS is independent of Almaden and the authors . ALS reported nothing unusual with respect to the shipments, once received, so there isno reason to believe that the security of the samples has been compromised . At the ALS Zacatecas and Guadalajara sample preparation facilities, rock grab samples are dried prior to preparation and then crushed to 10 mesh ( 70 % minimum pass) using a jaw crusher . The samples are then split using a riffle splitter, and sample splits are further crushed to pass 200 mesh ( 85 % minimum pass) using a ring mill pulverizer (ALS PREP - 31 procedure) . Soil samples are dried and sieved to 80 mesh . Rock grab samples are subject to gold determination via a 50 gram (g) fire - assay (FA) fusion utilizing atomic absorption spectroscopy (AA) finish with a lower detection limit of 0 . 005 ppm Au ( 5 ppb) and upper limit of 10 ppm Au (ALS method Au - AA 24 ) . A 50 gram (g) prepared sample is fused with a mixture of lead oxide, sodium carbonate, borax, silica and other reagents as required, inquarted with 6 mg of gold - free silver and then cupelled to yield a precious metal bead . The bead is digested in 0 . 5 ml dilute nitric acid and 0 . 5 ml concentrated hydrochloric acid . The digested solution is cooled, diluted to a total volume of 4 ml with de - mineralized water, and analyzed by atomic absorption spectroscopy against matrix - matched standards . Soil samples are subject to gold determination via digestion of a 50 g prepared sample in a mixture of 3 parts hydrochloric acid and 1 part nitric acid (aqua regia ; ALS method Au - ST 44 ) . Dissolved gold is then determined by inductively coupled plasma mass spectrometry (ICP - MS) . Samples are analyzed by 48 - element (ICP - MS), with a 4 acid digestion (ALS method ME - MS 61 ) . Silver, base metal and pathfinder elements for rock samples are analyzed by 33 - element inductively coupled plasma atomic emission spectroscopy (ICP - AES), with a 4 - acid digestion (ALS method ME - ICP 61 ) . A 0 . 25 g prepared sample is digested with perchloric, nitric, hydrofluoric and hydrochloric acids . The residue is topped up with dilute hydrochloric acid and the resulting solution is analyzed by ICP - AES . For rock samples only, following this analysis, the results are reviewed for high concentrations of bismuth, mercury, molybdenum, silver and tungsten and diluted accordingly . Samples meeting this criterion are Ixtaca - S - K 1300 Technical Report Summary Page 107 of 326
Ixtaca - S - K 1300 Technical Report Summary then analyzed by inductively coupled plasma mass spectrometry (ICP - MS, ALS method ME - MS 61 ) . Results are corrected for spectral inter - element interferences . Four acid digestions are able to dissolve most minerals ; however, depending on the sample matrix, not all elements are quantitatively extracted . 8 . 1 . 2 Almaden Drill Core All strongly altered or epithermal - mineralized intervals of core have been sampled . Almaden employs a maximum sample length of 2 to 3 m in unmineralized lithologies, and a maximum sample length of 1 m in mineralized lithologies . During the years 2010 and 2011 Almaden employed a minimum sample length of 20 cm . The minimum sample length was increased to 50 cm from 2012 onwards to ensure the availability of sufficient material for replicate analysis . Sampling always begins at least five samples above the start of mineralization . Geological changes in the core such as major alteration or mineralization intensity (including large discrete veins), or lithology are used as sample breaks . Drill core is half - sawn using industry standard gasoline engine - powered diamond core saws, with fresh water cooled blades and “core cradles” to ensure a straight cut . For each sample, the core logging geologist marks a cut line down the centre of the core designed to produce two halves of equal proportions of mineralization . This is accomplished by marking the cut line down the long axis of ellipses described by the intersection of the veins with the core circumference . Areas of very soft rock (e . g . fault gouge), are cut with a machete using the side of the core channel to ensure a straight cut . Areas of very broken core (pieces < 1 cm) are sampled using spoons . In all cases, the right hand side of the core (looking down the hole) is sampled . After cutting, half the core is placed in a new plastic sample bag and half is placed back in the core box . Between each sample, the core saw and sampling areas are washed to ensure no contamination between samples . Field duplicate, blank and analytical standards are added into the sample sequence as they are being cut . Sample numbers are written on the outside of the sample bags twice and the numbered tag is placed inside the bag with the half core . Sample bags are sealed using single plastic cable - ties . Sample numbers are checked against the numbers on the core box and the sample book . Drill core samples collected by the Almaden are placed into plastic twine (rice) sacks, sealed using single plastic cable ties . ALS sends its own trucks to the Project to take custody of the samples at the Santa Maria core facility and transport them to its sample preparation facility in Guadalajara or Zacatecas, Mexico . Prepared sample pulps are then forwarded by ALS personnel to the ALS North Vancouver, British Columbia laboratory for analysis . The samples are dried prior to preparation and then crushed to 10 mesh ( 70 % minimum pass) using a jaw crusher . The samples are then split using a riffle splitter, and sample splits are further crushed to pass 200 mesh ( 85 % minimum pass) using a ring mill pulverizer (ALS PREP - 31 procedure) . Drill core samples are subject to gold determination via a 50 gram (g) AA finish FA fusion with a lower detection limit of 0 . 005 ppm Au ( 5 ppb) and upper limit of 10 ppm Au (ALS method Au - AA 24 ) . A 50 g prepared sample is fused with a flux mixture, inquarted with 6 mg of gold - free silver and then cupelled to yield a precious metal bead . The bead is digested in 0 . 5 ml dilute nitric acid and 0 . 5 ml concentrated hydrochloric acid . The digested solution is cooled, diluted to a total volume of 4 ml with de - mineralized water, and analyzed by atomic absorption spectroscopy against matrix - matched standards . Ixtaca - S - K 1300 Technical Report Summary Page 108 of 326
Ixtaca - S - K 1300 Technical Report Summary Over limit gold values (> 10 ppm Au) are subject to gravimetric analysis, whereby a 50 g prepared sample is fused with a mixture of lead oxide, sodium carbonate, borax, silica and other reagents in order to produce a lead button . The lead button containing the precious metals is cupelled to remove the lead . The remaining gold and silver bead is parted in dilute nitric acid, annealed and weighed as gold (ALS method Au - GRA 22 ) . Silver, base metal and pathfinder elements for drill core samples have been analyzed by 33 - element ICP - AES, with a 4 - acid digestion, a lower detection limit of 0 . 5 ppm Ag and upper detection limit of 100 ppm Ag (ALS method ME - ICP 61 ) . A 0 . 25 g prepared sample is digested with perchloric, nitric, hydrofluoric and hydrochloric acids . The residue is topped up with dilute hydrochloric acid and the resulting solution is analyzed by ICP - AES (ALS method ME - ICP 61 ) . Four acid digestions are able to dissolve most minerals ; however, depending on the sample matrix, not all elements are quantitatively extracted . Over limit silver values (> 100 ppm Ag) have been subject to 4 - acid digestion ICP - AES analysis with an upper limit of 1 , 500 ppm Ag (ALS method ME - OG 62 ) . A prepared sample is digested with nitric, perchloric, hydrofluoric, and hydrochloric acids, and then evaporated to incipient dryness . Hydrochloric acid and de - ionized water is added for further digestion, and the sample is heated for an additional allotted time . The sample is cooled and transferred to a 100 ml volumetric flask . The resulting solution is diluted to volume with de - ionized water, homogenized and the solution is analyzed by ICP - AES . Ultra - high grade silver values (> 1 , 500 ppm Ag) are subject to gravimetric analysis with an upper detection limit of 10 , 000 ppm Ag (Ag - GRA 22 ) . 8 . 1 . 3 Independent Consultant’s Drill Core The collected drill core samples were placed into sealed plastic bags and transported by the consultant to ALS North Vancouver, British Columbia laboratory for gold FA and ICP - MS analysis . The consultant did not have control over the samples at all times during transport ; however the consultant has no reason to believe that the security of the samples has been compromised . The samples are dried prior to preparation and then crushed to 10 mesh ( 70 % minimum pass) using a jaw crusher . The samples are then split using a riffle splitter, and sample splits are further crushed to pass 200 mesh ( 85 % minimum pass) using a ring mill pulverizer (ALS PREP - 31 procedure) . Drill core samples collected by the independent consultant, have been subject to gold determination via a 50 gram (g) AA finish FA fusion with a lower detection limit of 0 . 005 ppm Au ( 5 ppb) and upper limit of 10 ppm Au (ALS method Au - AA 24 ) . A 50 g prepared sample is fused with a flux mixture, inquarted with 6 mg of gold - free silver and then cupelled to yield a precious metal bead . The bead is digested in 0 . 5 mL dilute nitric acid and 0 . 5 mL concentrated hydrochloric acid . The digested solution is cooled, diluted to a total volume of 4 mL with de - mineralized water, and analyzed by atomic absorption spectroscopy against matrix - matched standards . Silver, base metal and pathfinder elements for rock and soil samples are analyzed by 33 - element inductively coupled plasma atomic emission spectroscopy (ICP - AES), with a 4 - acid digestion . A 0 . 25 g prepared sample is digested with perchloric, nitric, hydrofluoric and hydrochloric acids . The residue is topped up with dilute hydrochloric acid and the resulting solution is analyzed by ICP - AES . Four acid Ixtaca - S - K 1300 Technical Report Summary Page 109 of 326
Ixtaca - S - K 1300 Technical Report Summary digestions are able to dissolve most minerals ; however, depending on the sample matrix, not all elements are quantitatively extracted . Over limit silver values (> 100 ppm Ag) are subject to 4 - acid digestion, ICP - AES analysis with an upper limit of 1 , 500 ppm Ag (ALS method ME - OG 62 ) . A prepared sample is digested with nitric, perchloric, hydrofluoric, and hydrochloric acids, and then evaporated to incipient dryness . Hydrochloric acid and de - ionized water is added for further digestion, and the sample is heated for an additional allotted time . The sample is cooled and transferred to a 100 ml volumetric flask . The resulting solution is diluted to volume with de - ionized water, homogenized and the solution is analyzed by ICP - AES . 2. Quality Assurance / Quality Control Procedures For the Tuligtic rock grab sample and soil geochemical programs, Almaden relies on external quality assurance and quality control (QA/QC) measures employed by ALS . QA/QC measures at ALS include routine screen tests to verify crushing efficiency, sample preparation duplicates (every 50 samples), and analytical quality controls (blanks, standards, and duplicates) . QC samples are inserted with each analytical run, with the minimum number of QC samples dependant on the rack size specific to the chosen analytical method . Results for quality control samples that fall beyond the established limits are automatically red - flagged for serious failures and yellow - flagged for borderline results . Every batch of samples is subject to a dual approval and review process, both by the individual analyst and the Department Manager, before final approval and certification . The author has no reason to believe that there are any issues or problems with the preparation or analyzing procedures utilized by ALS . Drill core samples are subject to Almaden’s internal QA/QC program that includes the insertion of analytical standard, blank and duplicate samples into the sample stream . A total of 15 QA/QC samples are present in every 100 samples sent to the laboratory . QA/QC sample results are reviewed following receipt of each analytical batch . QA/QC samples falling outside established limits are flagged and subject to review and possibly re - analysis, along with the 10 preceding and succeeding samples (prior to August 7 , 2012 , a total of five samples preceding and five samples succeeding the reviewable QA/QC sample have been re - analyzed) . Where the re - analyses fall within acceptable QA/QC limits the values are added to the drill core assay database . Summary results of Almaden’s internal QA/QC procedures are presented below . In the independent consultant’s opinion, Almaden’s QA/QC procedures are reasonable for this type of deposit and the current level of exploration . A total of 16 , 351 QA/QC analytical standard, blank and duplicate samples have been submitted for analysis . Based on the results of the QA/QC sampling summarized below, the analytical data is considered to be accurate ; the analytical sampling is considered to be representative of the drill sample, and the analytical data to be free from contamination . The analytical data is suitable for inclusion into a mineral Resource Estimate . 1. Analytical Standards A total of 28 different analytical standards have been used on the Project . Since November 13 , 2012 and drillhole TU - 12 - 221 (the end of the Maiden Resource Estimate cut - off), 17 different analytical standards have been used and are the basis for the section herein . Please refer to the 2013 Almaden NI 43 - 101 (Raffle et al . 2013 ) report for a detailed discussion of the previously used standards . Ixtaca - S - K 1300 Technical Report Summary Page 110 of 326
Ixtaca - S - K 1300 Technical Report Summary Each standard has an accepted gold and silver concentration as well as known “between laboratory” standard deviations, or expected variability, associated with each standard . The standards include seven multi - element gold - silver standards with accepted values ranging from 0 . 472 to 4 . 23 g/t Au, and 4 . 2 to 152 . 0 g/t Ag . One analytical standard for every 20 samples ( 5 % ) is inserted into the sample stream at the ‘ 05 ’, ‘ 25 ’, ‘ 45 ’, ‘ 65 ’ and ‘ 85 ’ positions . QA/QC summary charts showing gold and silver values for each analytical standard in addition to the accepted value, the second, and third “between laboratory” standard deviation are shown in Figure 8 - 1 below . Between 2010 and 2013 Almaden employed two separate criteria by which standards have been assigned “pass” or “reviewable” status . Up to drillhole TU - 12 - 130 a reviewable standard had been defined as any standard occurring within a reported mineralized interval returning greater than three ( 3 ) standard deviations ( 3 SD) above the accepted value for gold or silver . Beginning with drillhole TU - 12 - 131 , a reviewable standard is now defined as any standard occurring anywhere in a drillhole returning > 3 SD above or below the accepted value for gold or silver . In addition, two standards analyzed consecutively returning values > 2 SD above or below the accepted value for the same element (gold or silver) are classified as reviewable . All standard samples returning gold or silver values outside the established criteria are reviewed . A decision to conduct reanalysis of samples surrounding the reviewable standard is based on whether the standard returned a value above or below the accepted value (low, or slightly high > 3 SD values are allowed after data review) or if it occurred within a reported interval (> 3 SD values are allowed outside of reported intervals) Prior to August 7 , 2012 , when a reviewable standard has been recognized the five preceding and five succeeding samples, in addition to the standard have been subject to review and possibly re - analysis . After August 7 , 2012 when a reviewable standard is recognized, the ten preceding and ten succeeding samples, in addition to the standard is subject to review and possibly re - analysis . The results of re - analysis are then compared to the original analysis . Provided that no significant systematic increase or decrease in gold and silver values is noted and the re - analyzed standard returned values within the expected limits, the QA/QC concern is considered resolved and the re - analyzed standard value and surrounding reanalyzed samples are added to the drillhole database . A total of 11 , 153 analytical standards have been inserted into the sample stream of 139 , 042 assays for gold and silver for the 590 drillholes . Of the 11 , 153 standards, a total of 2 , 356 have been subject to review criteria in place up to drillhole TU - 12 - 130 . Of the remaining 4 , 490 samples subject to the current review criteria (TU - 12 - 131 and later), 1 , 708 samples have been included in the maiden mineral Resource Estimate up to hole TU - 12 - 221 (Raffle et al . , 2013 ) . QA/QC results with respect to the remaining 3 , 219 standards are reported herein (TU - 12 - 222 and later) . Of the 3 , 876 QA/QC samples inserted into the sample stream since November 13 , 2012 , a total of 255 ( 6 . 6 % ) have been initially reviewable as a result of two consecutive standards returning > 2 SD from the accepted value, or a single standard returning > 3 SD from the accepted value for gold or silver . These standards have been re - analysed and all but 29 passed the repeat analysis ( Figure 8 - 1 ) . Of the remaining fourteen ( 14 ) re - analysis failures occurring within reported mineralized intervals, seven ( 7 ) returned < 3 SD below the accepted value for Au, four ( 4 ) > 3 SD above the accepted value for Ag, and two ( 2 ) > 3 SD above the accepted value for Au . One ( 1 ) additional standard failed as the result of being mislabelled and was Ixtaca - S - K 1300 Technical Report Summary Page 111 of 326
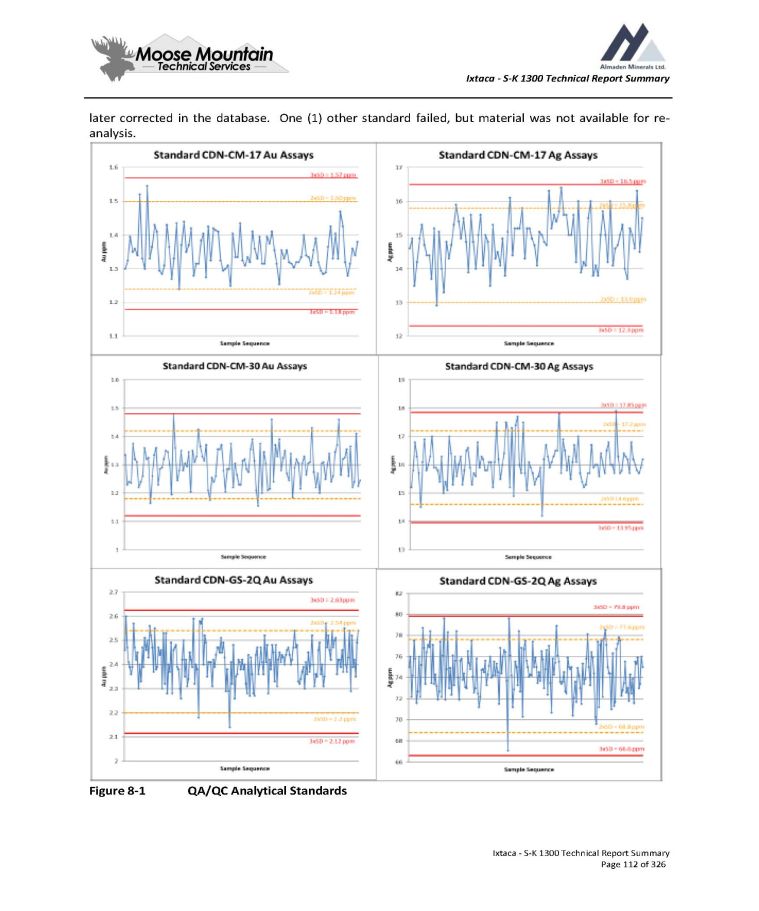
Ixtaca - S - K 1300 Technical Report Summary later corrected in the database. analysis. One (1) other standard failed, but material was not available for re - Figure 8 - 1 QA/QC Analytical Standards Ixtaca - S - K 1300 Technical Report Summary Page 112 of 326
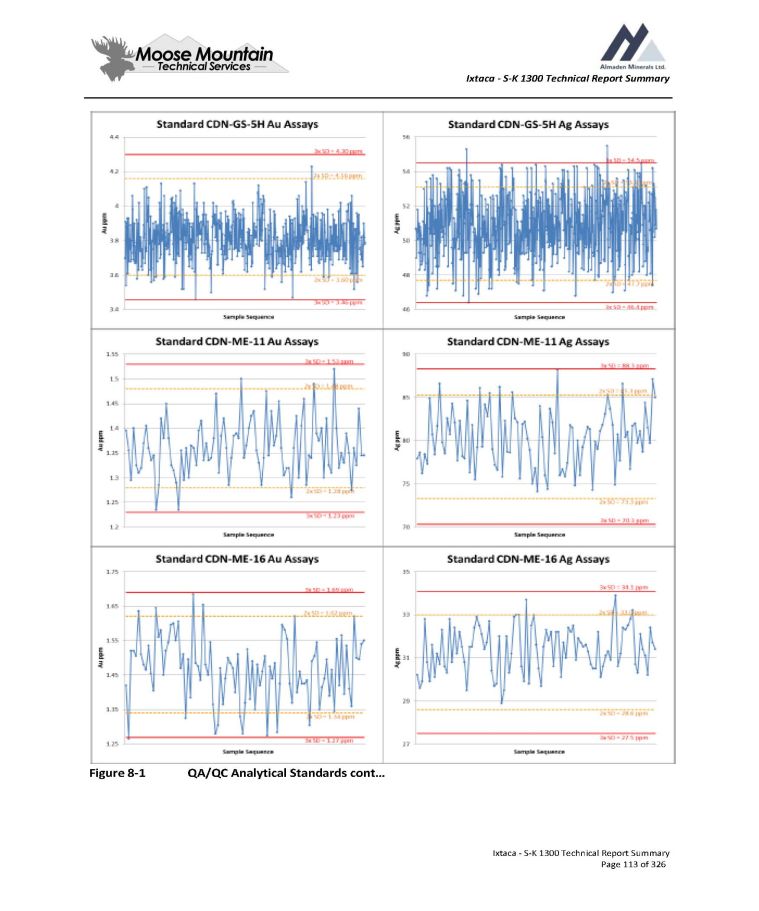
Ixtaca - S - K 1300 Technical Report Summary Figure 8 - 1 QA/QC Analytical Standards cont… Ixtaca - S - K 1300 Technical Report Summary Page 113 of 326
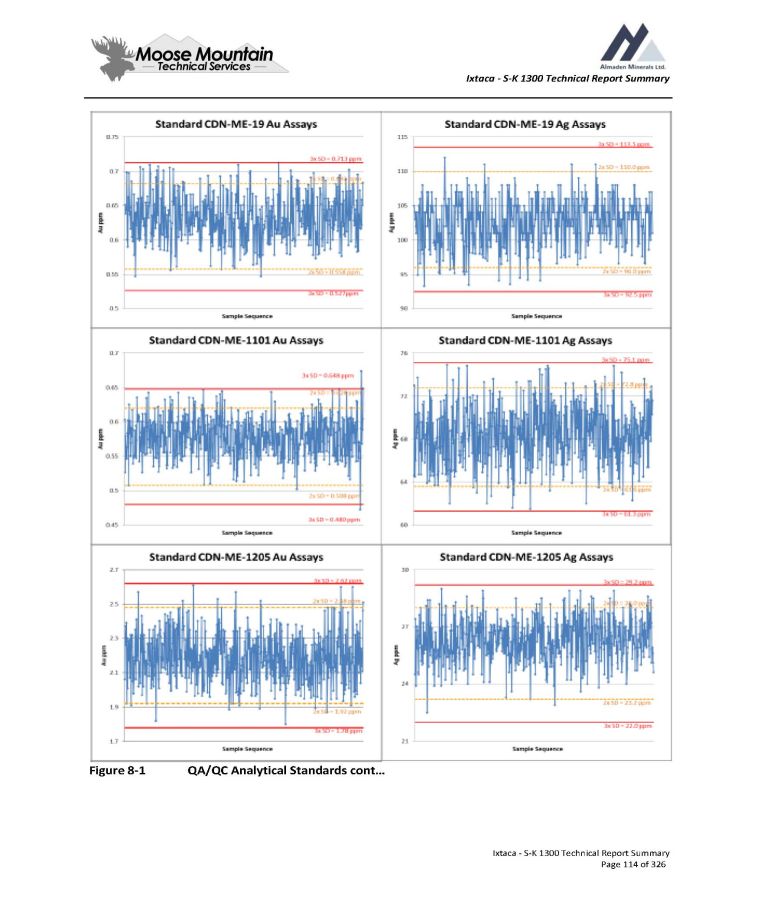
Ixtaca - S - K 1300 Technical Report Summary Figure 8 - 1 QA/QC Analytical Standards cont… Ixtaca - S - K 1300 Technical Report Summary Page 114 of 326
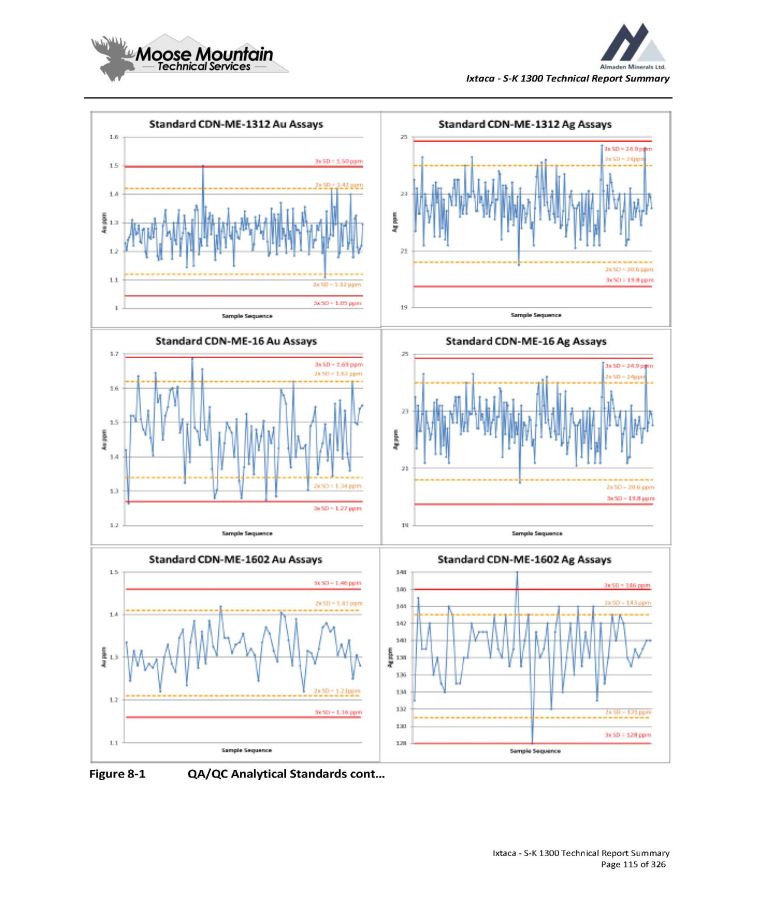
Ixtaca - S - K 1300 Technical Report Summary Figure 8 - 1 QA/QC Analytical Standards cont… Ixtaca - S - K 1300 Technical Report Summary Page 115 of 326
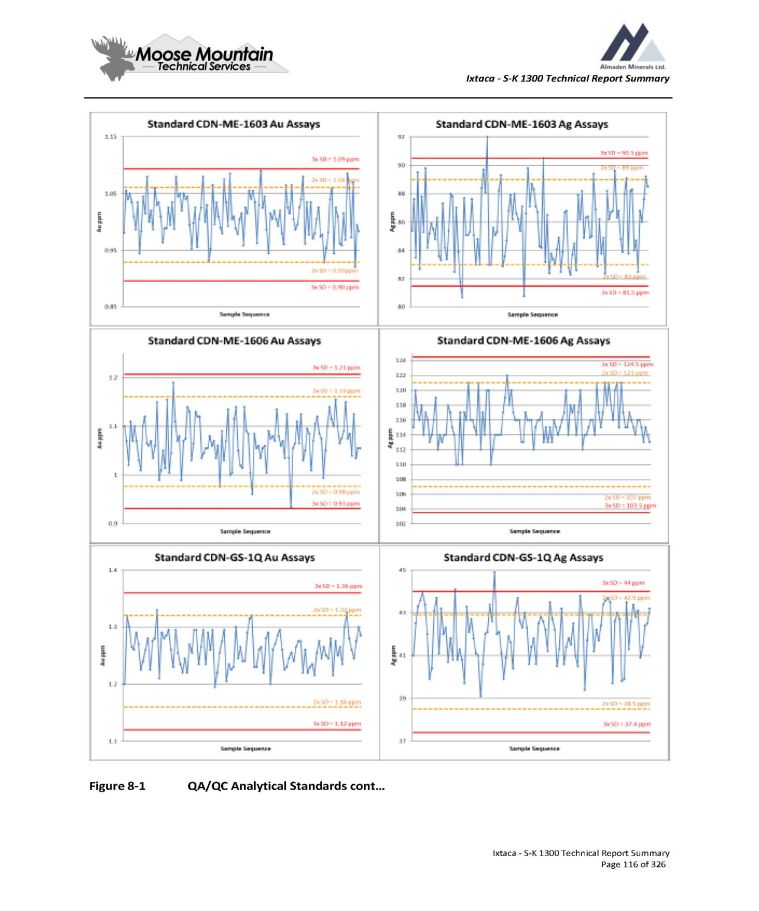
Ixtaca - S - K 1300 Technical Report Summary Figure 8 - 1 QA/QC Analytical Standards cont… Ixtaca - S - K 1300 Technical Report Summary Page 116 of 326
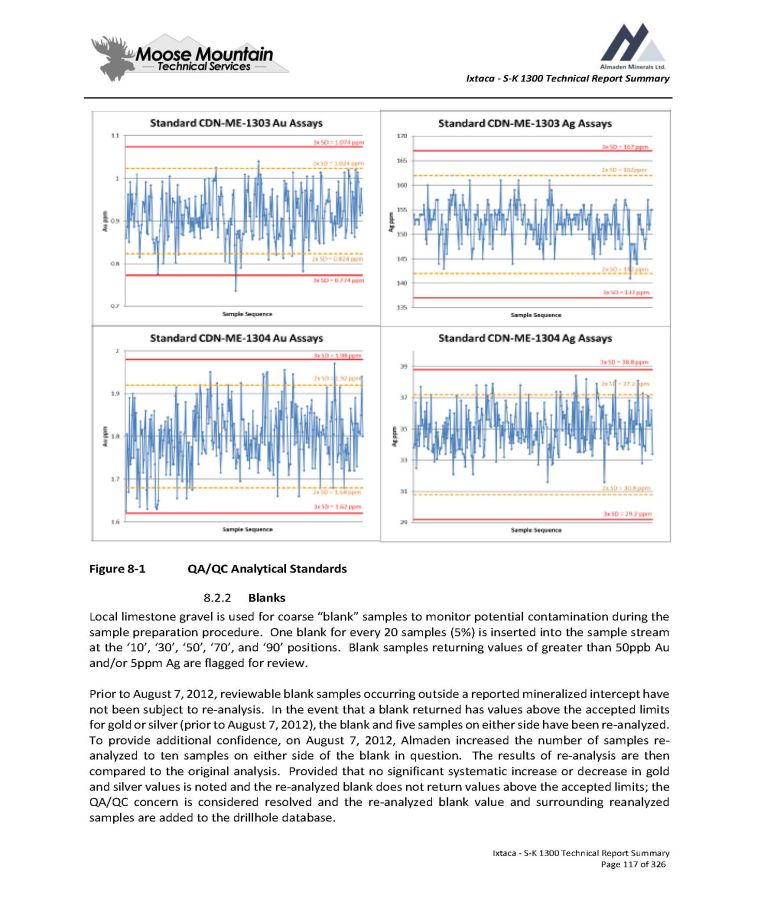
Ixtaca - S - K 1300 Technical Report Summary Figure 8 - 1 QA/QC Analytical Standards 8.2.2 Blanks Local limestone gravel is used for coarse “blank” samples to monitor potential contamination during the sample preparation procedure . One blank for every 20 samples ( 5 % ) is inserted into the sample stream at the ‘ 10 ’, ‘ 30 ’, ‘ 50 ’, ‘ 70 ’, and ‘ 90 ’ positions . Blank samples returning values of greater than 50 ppb Au and/or 5 ppm Ag are flagged for review . Prior to August 7 , 2012 , reviewable blank samples occurring outside a reported mineralized intercept have not been subject to re - analysis . In the event that a blank returned has values above the accepted limits for gold or silver (prior to August 7 , 2012 ), the blank and five samples on either side have been re - analyzed . To provide additional confidence, on August 7 , 2012 , Almaden increased the number of samples re - analyzed to ten samples on either side of the blank in question . The results of re - analysis are then compared to the original analysis . Provided that no significant systematic increase or decrease in gold and silver values is noted and the re - analyzed blank does not return values above the accepted limits ; the QA/QC concern is considered resolved and the re - analyzed blank value and surrounding reanalyzed samples are added to the drillhole database . Ixtaca - S - K 1300 Technical Report Summary Page 117 of 326
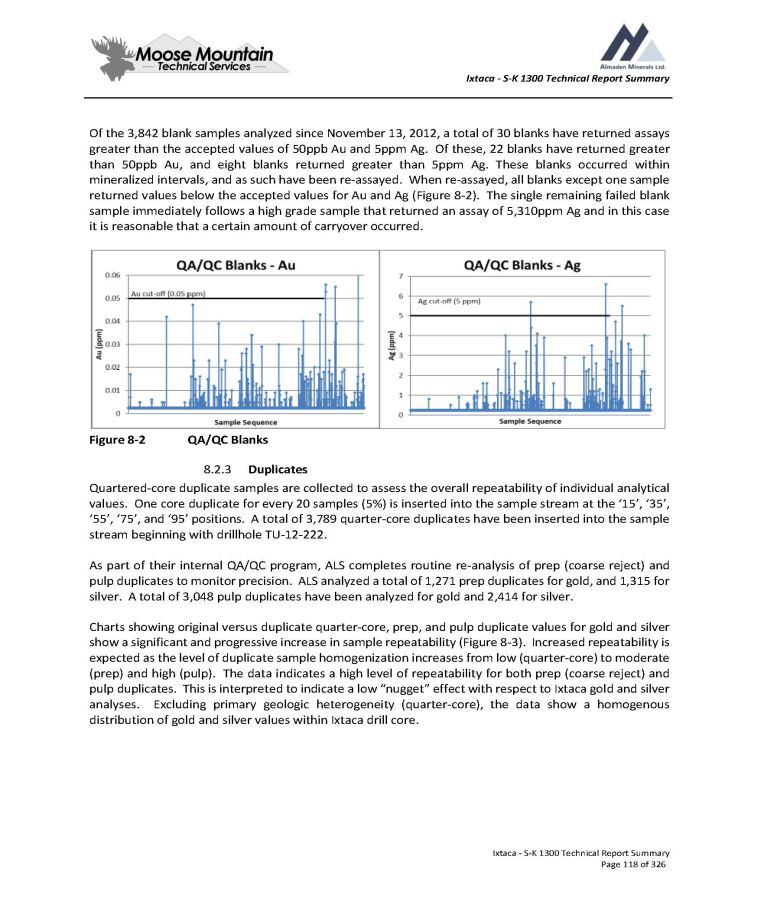
Ixtaca - S - K 1300 Technical Report Summary Of the 3 , 842 blank samples analyzed since November 13 , 2012 , a total of 30 blanks have returned assays greater than the accepted values of 50 ppb Au and 5 ppm Ag . Of these, 22 blanks have returned greater than 50 ppb Au, and eight blanks returned greater than 5 ppm Ag . These blanks occurred within mineralized intervals, and as such have been re - assayed . When re - assayed, all blanks except one sample returned values below the accepted values for Au and Ag ( Figure 8 - 2 ) . The single remaining failed blank sample immediately follows a high grade sample that returned an assay of 5 , 310 ppm Ag and in this case it is reasonable that a certain amount of carryover occurred . Figure 8 - 2 QA/QC Blanks 8.2.3 Duplicates Quartered - core duplicate samples are collected to assess the overall repeatability of individual analytical values . One core duplicate for every 20 samples ( 5 % ) is inserted into the sample stream at the ‘ 15 ’, ‘ 35 ’, ‘ 55 ’, ‘ 75 ’, and ‘ 95 ’ positions . A total of 3 , 789 quarter - core duplicates have been inserted into the sample stream beginning with drillhole TU - 12 - 222 . As part of their internal QA/QC program, ALS completes routine re - analysis of prep (coarse reject) and pulp duplicates to monitor precision . ALS analyzed a total of 1 , 271 prep duplicates for gold, and 1 , 315 for silver . A total of 3 , 048 pulp duplicates have been analyzed for gold and 2 , 414 for silver . Charts showing original versus duplicate quarter - core, prep, and pulp duplicate values for gold and silver show a significant and progressive increase in sample repeatability ( Figure 8 - 3 ) . Increased repeatability is expected as the level of duplicate sample homogenization increases from low (quarter - core) to moderate (prep) and high (pulp) . The data indicates a high level of repeatability for both prep (coarse reject) and pulp duplicates . This is interpreted to indicate a low “nugget” effect with respect to Ixtaca gold and silver analyses . Excluding primary geologic heterogeneity (quarter - core), the data show a homogenous distribution of gold and silver values within Ixtaca drill core . Ixtaca - S - K 1300 Technical Report Summary Page 118 of 326
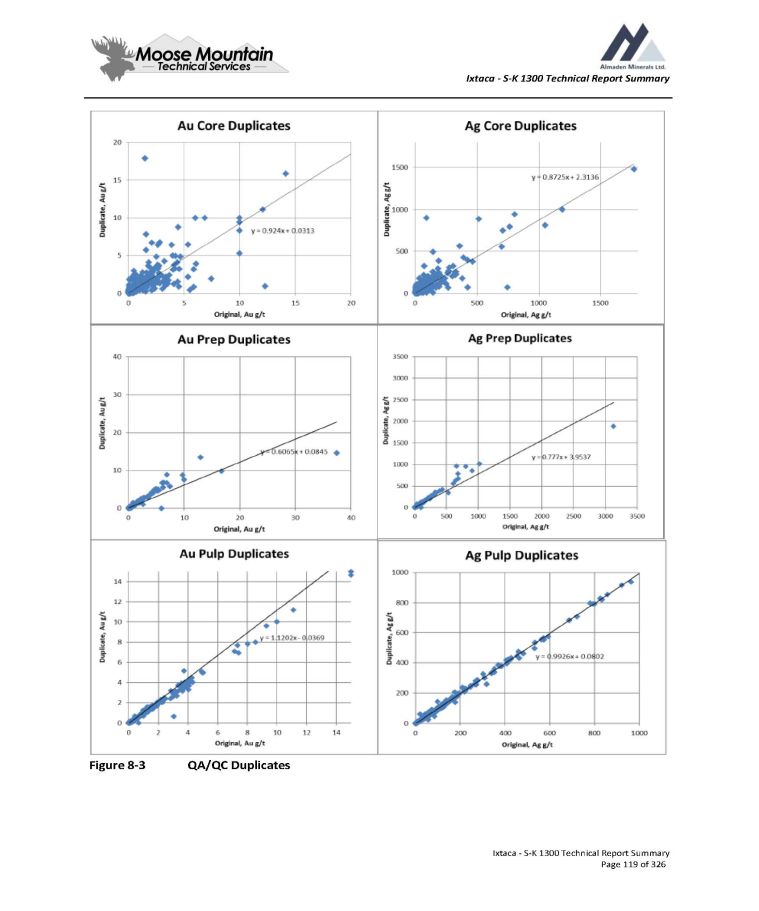
Ixtaca - S - K 1300 Technical Report Summary Figure 8 - 3 QA/QC Duplicates Ixtaca - S - K 1300 Technical Report Summary Page 119 of 326
Ixtaca - S - K 1300 Technical Report Summary 1. Data Verification The information in this section was drawn from the most recent major study prepared entitled “The Ixtaca Gold - Silver Project Puebla State, Mexico NI 43 - 101 Technical Report on the Feasibility Study” dated January 24 th 2019 and updated October 3 , 2019 . 1. Independent Audit of Almaden Drillhole Database Between August 23 and September 26 , 2012 and subsequently January 2 and January 21 , 2014 an independent audit of Almaden’s drillhole database was conducted . The audit included systematic checks of database values for drill collar coordinate, downhole survey, and drill core, analytical standard, duplicate, and blank sample assays against the original field survey files and laboratory certificates . In addition, APEX conducted a review of the Almaden QA/QC database, summary results of which is presented within Section 11 . 2 above . 1. Collar Coordinate and Downhole Survey Databases A total of 39 diamond drillhole collar locations were confirmed following site visits to the Tuligtic Property on October 18 , 2011 ; September 23 , 2012 ; November 20 , 2013 ; and September 12 , 2019 . In addition, Almaden has provided APEX with copies of all original down hole survey field records . Despite no collar discrepancies being recorded by the author in the field, a review of the drill database reveals a number of elevation discrepancies between the Almaden differential GPS measured collar coordinates and the high - resolution satellite ortho - photogrammetric derived Ixtaca Project DEM topographic base . Elevation differences between differential GPS and the DEM range from plus 9 metres to negative 7 m . Approximately 70 % of the drill hole elevations vary less than plus or minus 4 m from the DEM estimated elevation . The author observed instances within the drill collar database where a single hole drilled at the same drill pad location varied in elevation in comparison to others drilled during different years . These single holes also appear to vary more in comparison to the DEM estimated elevation, suggesting discrepancies may be derived from satellite configuration errors . As a result of the observed discrepancies, Almaden commissioned an independent company Skytactic who provided a report on September 8 , 2018 after surveying 32 collar locations across the deposit . Skytactic measured minor easting (average 7 cm) and northing (average 40 cm) differences between Almaden and Skytactic differential GPS determined collar locations . Elevation checks by Skytactic agreed more closely with DEM surface, and resulted in the removal of observed single hole variances . The Skytactic data further reinforce the interpretation that the observed single hole collar elevation “spikes” are due to satellite configuration errors . As a result of the Skytactic report, all drillhole collars were draped onto the high - resolution DEM by Almaden to establish a consistent elevation model across the entire deposit, which created some discrepancies between the original and current data . The drill locations used in the mineral Resource Estimate and are deemed to be accurate by the author . Ixtaca - S - K 1300 Technical Report Summary Page 120 of 326

Ixtaca - S - K 1300 Technical Report Summary 9 . 1 . 2 Drill Core Assay Database A total of 139 , 042 drill core samples exist within the drill database ( 590 drillholes in total) . The database audit consisted of checking 10 , 885 database gold and silver values against the original ALS analytical certificates . The audit specifically focused on assays within reported mineralized intercepts . No discrepancies have been identified between the original ALS analytical certificates and Almaden’s drillhole database values . Ixtaca - S - K 1300 Technical Report Summary Page 121 of 326
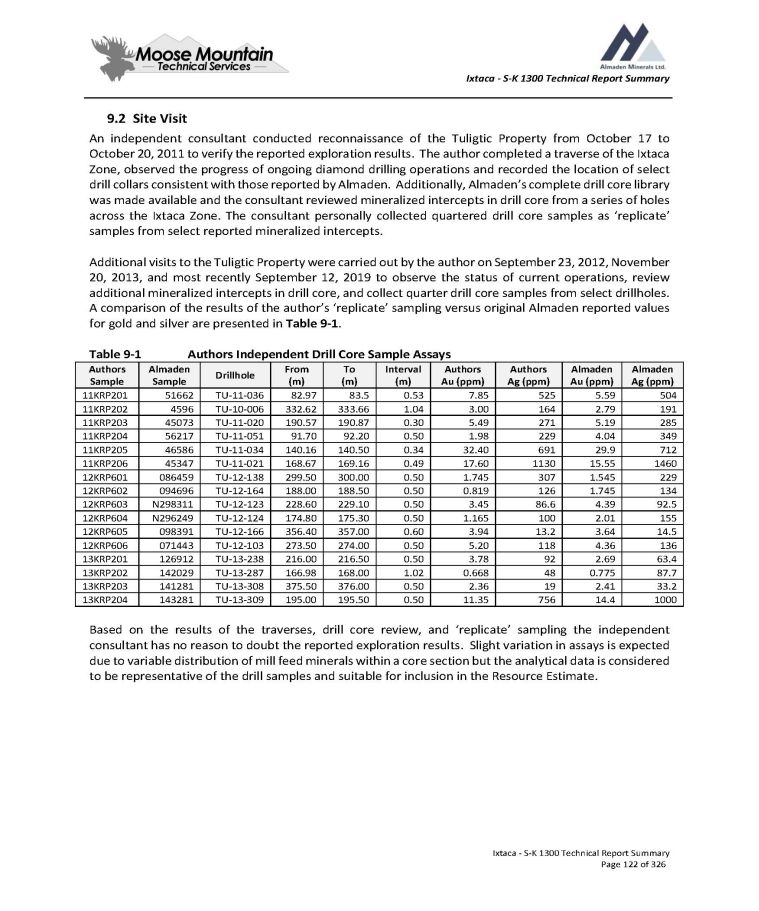
Ixtaca - S - K 1300 Technical Report Summary 9 . 2 Site Visit An independent consultant conducted reconnaissance of the Tuligtic Property from October 17 to October 20 , 2011 to verify the reported exploration results . The author completed a traverse of the Ixtaca Zone, observed the progress of ongoing diamond drilling operations and recorded the location of select drill collars consistent with those reported by Almaden . Additionally, Almaden’s complete drill core library was made available and the consultant reviewed mineralized intercepts in drill core from a series of holes across the Ixtaca Zone . The consultant personally collected quartered drill core samples as ‘replicate’ samples from select reported mineralized intercepts . Additional visits to the Tuligtic Property were carried out by the author on September 23 , 2012 , November 20 , 2013 , and most recently September 12 , 2019 to observe the status of current operations, review additional mineralized intercepts in drill core, and collect quarter drill core samples from select drillholes . A comparison of the results of the author’s ‘replicate’ sampling versus original Almaden reported values for gold and silver are presented in Table 9 - 1 . Table 9 - 1 Authors Independent Drill Core Sample Assays Ixtaca - S - K 1300 Technical Report Summary Page 122 of 326 Almaden Ag (ppm) Almaden Au (ppm) Authors Ag (ppm) Authors Au (ppm) Interval (m) To (m) From (m) Drillhole Almaden Sample Authors Sample 504 5.59 525 7.85 0.53 83.5 82.97 TU - 11 - 036 51662 11KRP201 191 2.79 164 3.00 1.04 333.66 332.62 TU - 10 - 006 4596 11KRP202 285 5.19 271 5.49 0.30 190.87 190.57 TU - 11 - 020 45073 11KRP203 349 4.04 229 1.98 0.50 92.20 91.70 TU - 11 - 051 56217 11KRP204 712 29.9 691 32.40 0.34 140.50 140.16 TU - 11 - 034 46586 11KRP205 1460 15.55 1130 17.60 0.49 169.16 168.67 TU - 11 - 021 45347 11KRP206 229 1.545 307 1.745 0.50 300.00 299.50 TU - 12 - 138 086459 12KRP601 134 1.745 126 0.819 0.50 188.50 188.00 TU - 12 - 164 094696 12KRP602 92.5 4.39 86.6 3.45 0.50 229.10 228.60 TU - 12 - 123 N298311 12KRP603 155 2.01 100 1.165 0.50 175.30 174.80 TU - 12 - 124 N296249 12KRP604 14.5 3.64 13.2 3.94 0.60 357.00 356.40 TU - 12 - 166 098391 12KRP605 136 4.36 118 5.20 0.50 274.00 273.50 TU - 12 - 103 071443 12KRP606 63.4 2.69 92 3.78 0.50 216.50 216.00 TU - 13 - 238 126912 13KRP201 87.7 0.775 48 0.668 1.02 168.00 166.98 TU - 13 - 287 142029 13KRP202 33.2 2.41 19 2.36 0.50 376.00 375.50 TU - 13 - 308 141281 13KRP203 1000 14.4 756 11.35 0.50 195.50 195.00 TU - 13 - 309 143281 13KRP204 Based on the results of the traverses, drill core review, and ‘replicate’ sampling the independent consultant has no reason to doubt the reported exploration results . Slight variation in assays is expected due to variable distribution of mill feed minerals within a core section but the analytical data is considered to be representative of the drill samples and suitable for inclusion in the Resource Estimate .
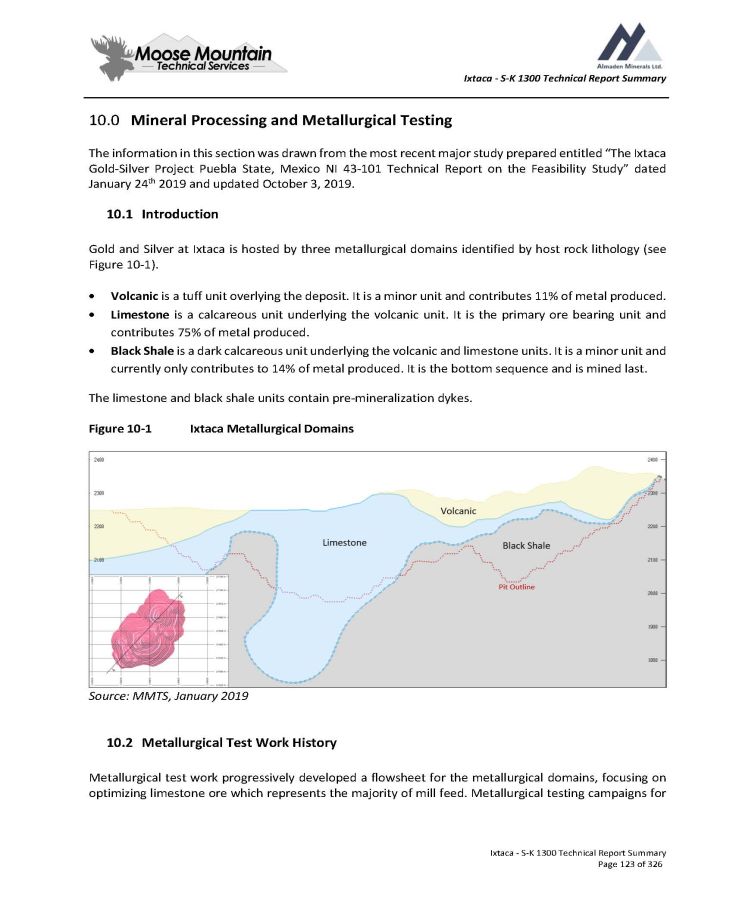
Ixtaca - S - K 1300 Technical Report Summary 10.0 Mineral Processing and Metallurgical Testing The information in this section was drawn from the most recent major study prepared entitled “The Ixtaca Gold - Silver Project Puebla State, Mexico NI 43 - 101 Technical Report on the Feasibility Study” dated January 24 th 2019 and updated October 3 , 2019 . 10.1 Introduction Gold and Silver at Ixtaca is hosted by three metallurgical domains identified by host rock lithology (see Figure 10 - 1 ) . Volcanic is a tuff unit overlying the deposit. It is a minor unit and contributes 11% of metal produced. Limestone is a calcareous unit underlying the volcanic unit. It is the primary ore bearing unit and contributes 75% of metal produced. Black Shale is a dark calcareous unit underlying the volcanic and limestone units. It is a minor unit and currently only contributes to 14% of metal produced. It is the bottom sequence and is mined last. The limestone and black shale units contain pre - mineralization dykes . Figure 10 - 1 Ixtaca Metallurgical Domains Source: MMTS, January 2019 10.2 Metallurgical Test Work History Metallurgical test work progressively developed a flowsheet for the metallurgical domains, focusing on optimizing limestone ore which represents the majority of mill feed. Metallurgical testing campaigns for Ixtaca - S - K 1300 Technical Report Summary Page 123 of 326
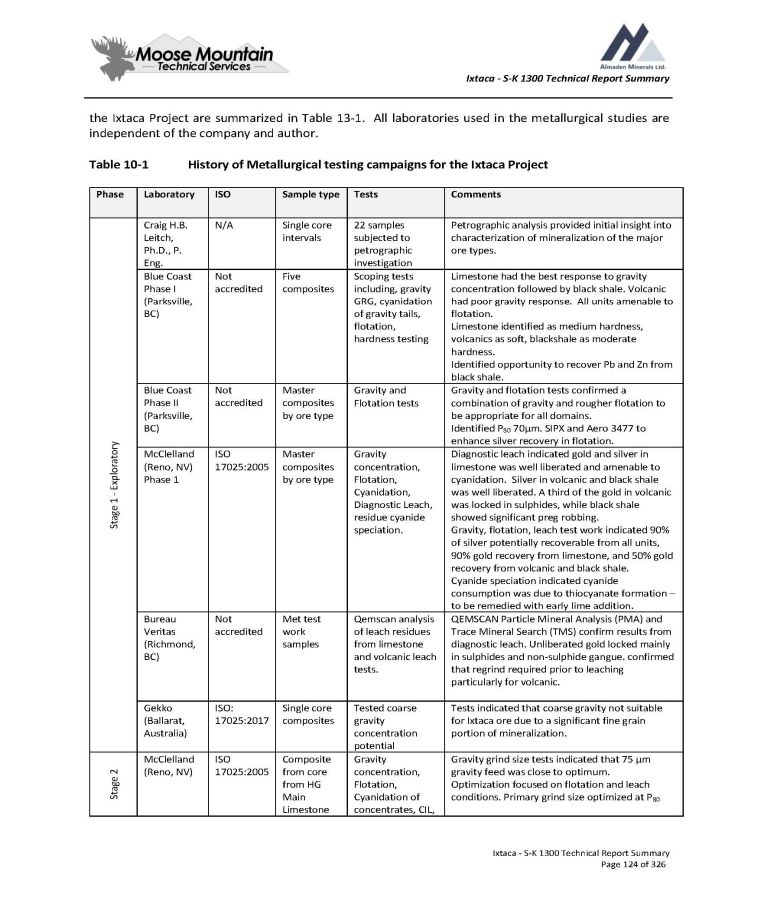
Ixtaca - S - K 1300 Technical Report Summary the Ixtaca Project are summarized in Table 13 - 1. All laboratories used in the metallurgical studies are independent of the company and author. Table 10 - 1 History of Metallurgical testing campaigns for the Ixtaca Project Ixtaca - S - K 1300 Technical Report Summary Page 124 of 326 Comments Tests Sample type ISO Laboratory Phase Petrographic analysis provided initial insight into characterization of mineralization of the major ore types. 22 samples subjected to petrographic investigation Single core intervals N/A Craig H.B. Leitch, Ph.D., P. Eng. Stage 1 - Exploratory Limestone had the best response to gravity concentration followed by black shale. Volcanic had poor gravity response. All units amenable to flotation. Limestone identified as medium hardness, volcanics as soft, blackshale as moderate hardness. Identified opportunity to recover Pb and Zn from black shale. Scoping tests including, gravity GRG, cyanidation of gravity tails, flotation, hardness testing Five composites Not accredited Blue Coast Phase I (Parksville, BC) Gravity and flotation tests confirmed a combination of gravity and rougher flotation to be appropriate for all domains. Identified P 80 70µm. SIPX and Aero 3477 to enhance silver recovery in flotation. Gravity and Flotation tests Master composites by ore type Not accredited Blue Coast Phase II (Parksville, BC) Diagnostic leach indicated gold and silver in limestone was well liberated and amenable to cyanidation. Silver in volcanic and black shale was well liberated. A third of the gold in volcanic was locked in sulphides, while black shale showed significant preg robbing. Gravity, flotation, leach test work indicated 90% of silver potentially recoverable from all units, 90% gold recovery from limestone, and 50% gold recovery from volcanic and black shale. Cyanide speciation indicated cyanide consumption was due to thiocyanate formation – to be remedied with early lime addition. Gravity concentration, Flotation, Cyanidation, Diagnostic Leach, residue cyanide speciation. Master composites by ore type ISO 17025:2005 McClelland (Reno, NV) Phase 1 QEMSCAN Particle Mineral Analysis (PMA) and Trace Mineral Search (TMS) confirm results from diagnostic leach. Unliberated gold locked mainly in sulphides and non - sulphide gangue. confirmed that regrind required prior to leaching particularly for volcanic. Qemscan analysis of leach residues from limestone and volcanic leach tests. Met test work samples Not accredited Bureau Veritas (Richmond, BC) Tests indicated that coarse gravity not suitable for Ixtaca ore due to a significant fine grain portion of mineralization. Tested coarse gravity concentration potential Single core composites ISO: 17025:2017 Gekko (Ballarat, Australia) Gravity grind size tests indicated that 75 µm gravity feed was close to optimum. Optimization focused on flotation and leach conditions. Primary grind size optimized at P 80 Gravity concentration, Flotation, Cyanidation of concentrates, CIL, Composite from core from HG Main Limestone ISO 17025:2005 McClelland (Reno, NV) Stage 2
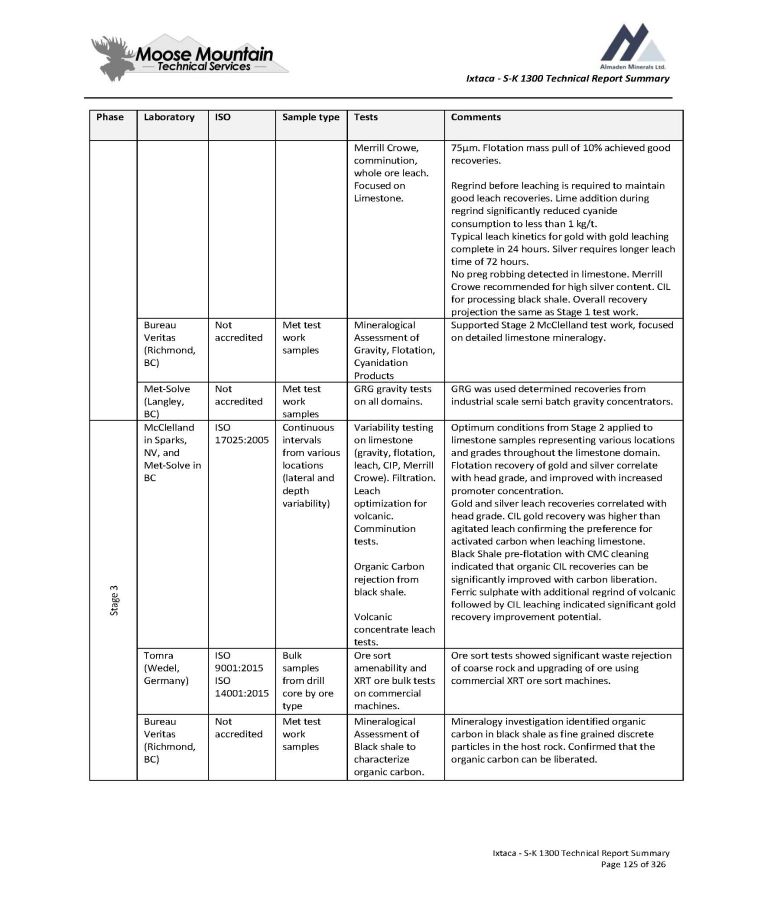
Ixtaca - S - K 1300 Technical Report Summary Comments Tests Sample type ISO Laboratory Phase 75µm. Flotation mass pull of 10% achieved good recoveries. Regrind before leaching is required to maintain good leach recoveries. Lime addition during regrind significantly reduced cyanide consumption to less than 1 kg/t. Typical leach kinetics for gold with gold leaching complete in 24 hours. Silver requires longer leach time of 72 hours. No preg robbing detected in limestone. Merrill Crowe recommended for high silver content. CIL for processing black shale. Overall recovery projection the same as Stage 1 test work. Merrill Crowe, comminution, whole ore leach. Focused on Limestone. Supported Stage 2 McClelland test work, focused on detailed limestone mineralogy. Mineralogical Assessment of Gravity, Flotation, Cyanidation Products Met test work samples Not accredited Bureau Veritas (Richmond, BC) GRG was used determined recoveries from industrial scale semi batch gravity concentrators. GRG gravity tests on all domains. Met test work samples Not accredited Met - Solve (Langley, BC) Optimum conditions from Stage 2 applied to limestone samples representing various locations and grades throughout the limestone domain. Flotation recovery of gold and silver correlate with head grade, and improved with increased promoter concentration. Gold and silver leach recoveries correlated with head grade. CIL gold recovery was higher than agitated leach confirming the preference for activated carbon when leaching limestone. Black Shale pre - flotation with CMC cleaning indicated that organic CIL recoveries can be significantly improved with carbon liberation. Ferric sulphate with additional regrind of volcanic followed by CIL leaching indicated significant gold recovery improvement potential. Variability testing on limestone (gravity, flotation, leach, CIP, Merrill Crowe). Filtration. Leach optimization for volcanic. Comminution tests. Organic Carbon rejection from black shale. Volcanic concentrate leach tests. Continuous intervals from various locations (lateral and depth variability) ISO 17025:2005 McClelland in Sparks, NV, and Met - Solve in BC Stage 3 Ore sort tests showed significant waste rejection of coarse rock and upgrading of ore using commercial XRT ore sort machines. Ore sort amenability and XRT ore bulk tests on commercial machines. Bulk samples from drill core by ore type ISO 9001:2015 ISO 14001:2015 Tomra (Wedel, Germany) Mineralogy investigation identified organic carbon in black shale as fine grained discrete particles in the host rock. Confirmed that the organic carbon can be liberated. Mineralogical Assessment of Black shale to characterize organic carbon. Met test work samples Not accredited Bureau Veritas (Richmond, BC) Ixtaca - S - K 1300 Technical Report Summary Page 125 of 326
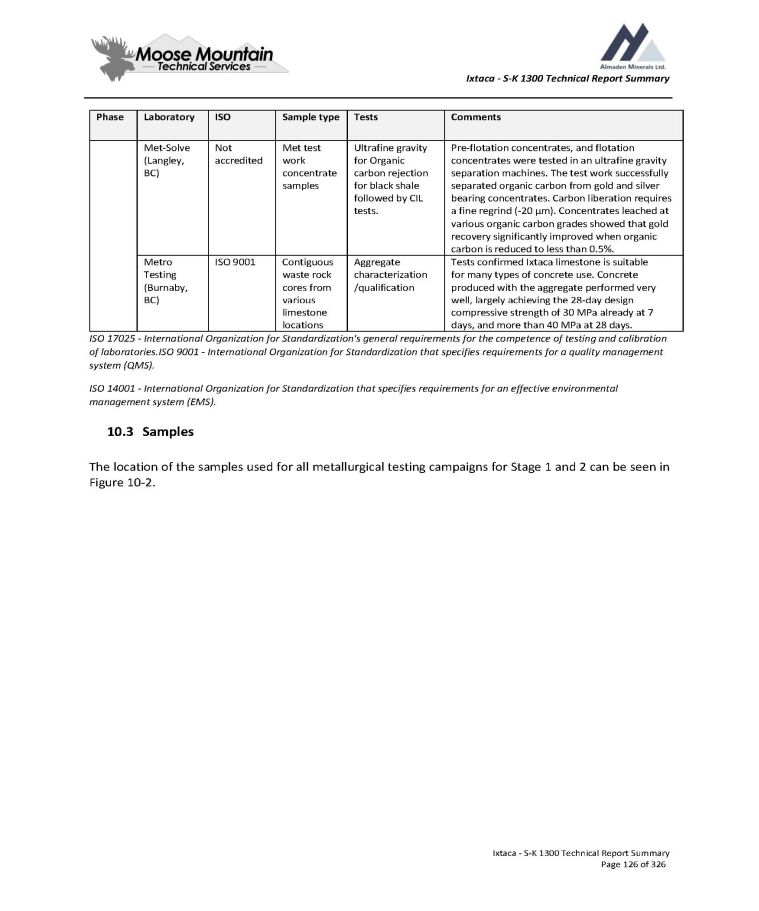
Ixtaca - S - K 1300 Technical Report Summary Comments Tests Sample type ISO Laboratory Phase Pre - flotation concentrates, and flotation concentrates were tested in an ultrafine gravity separation machines. The test work successfully separated organic carbon from gold and silver bearing concentrates. Carbon liberation requires a fine regrind ( - 20 µm). Concentrates leached at various organic carbon grades showed that gold recovery significantly improved when organic carbon is reduced to less than 0.5%. Ultrafine gravity for Organic carbon rejection for black shale followed by CIL tests. Met test work concentrate samples Not accredited Met - Solve (Langley, BC) Tests confirmed Ixtaca limestone is suitable for many types of concrete use. Concrete produced with the aggregate performed very well, largely achieving the 28 - day design compressive strength of 30 MPa already at 7 days, and more than 40 MPa at 28 days. Aggregate characterization /qualification Contiguous waste rock cores from various limestone locations ISO 9001 Metro Testing (Burnaby, BC) Ixtaca - S - K 1300 Technical Report Summary Page 126 of 326 ISO 17025 - International Organization for Standardization's general requirements for the competence of testing and calibration of laboratories.ISO 9001 - International Organization for Standardization that specifies requirements for a quality management system (QMS). ISO 14001 - International Organization for Standardization that specifies requirements for an effective environmental management system (EMS). 10.3 Samples The location of the samples used for all metallurgical testing campaigns for Stage 1 and 2 can be seen in Figure 10 - 2.
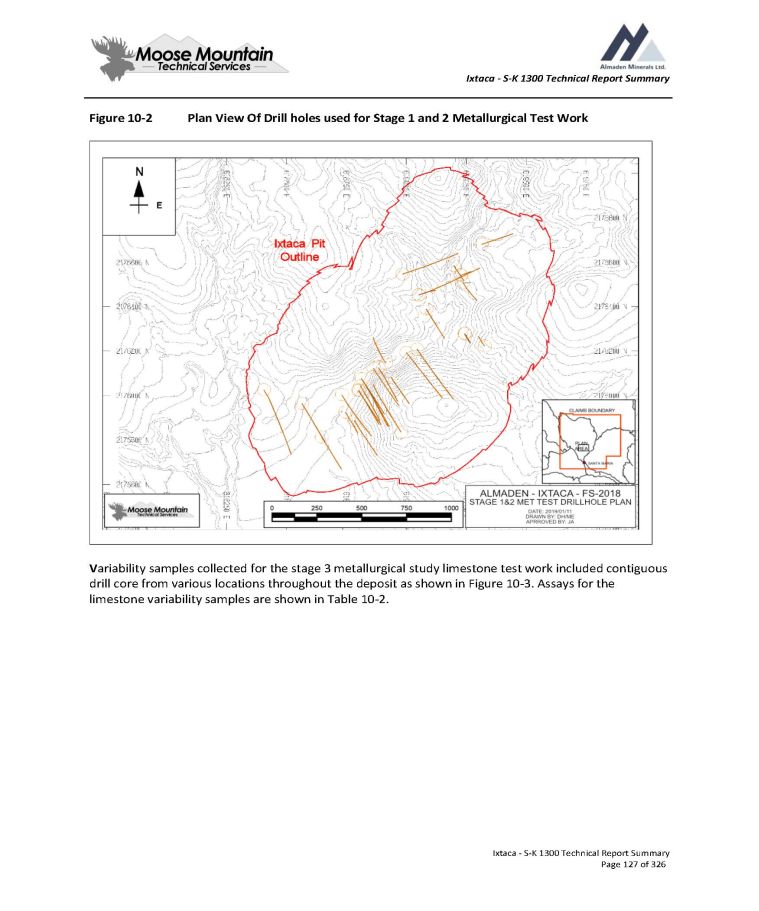
Ixtaca - S - K 1300 Technical Report Summary Figure 10 - 2 Plan View Of Drill holes used for Stage 1 and 2 Metallurgical Test Work V ariability samples collected for the stage 3 metallurgical study limestone test work included contiguous drill core from various locations throughout the deposit as shown in Figure 10 - 3. Assays for the limestone variability samples are shown in Table 10 - 2. Ixtaca - S - K 1300 Technical Report Summary Page 127 of 326
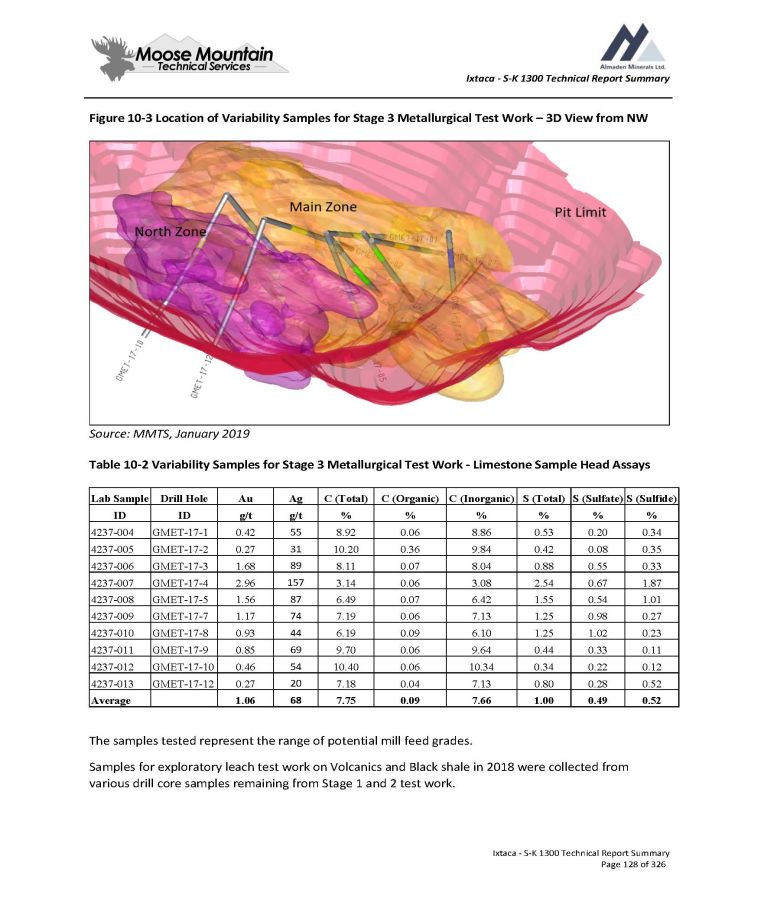
Ixtaca - S - K 1300 Technical Report Summary Figure 10 - 3 Location of Variability Samples for Stage 3 Metallurgical Test Work – 3D View from NW Source: MMTS, January 2019 Table 10 - 2 Variability Samples for Stage 3 Metallurgical Test Work - Limestone Sample Head Assays S (Sulfide) S (Sulfate) S (Total) C (Inorganic) C (Organic) C (Total) Ag Au Drill Hole Lab Sample % % % % % % g/t g/t ID ID 0.34 0.20 0.53 8.86 0.06 8.92 55 0.42 GMET - 17 - 1 4237 - 004 0.35 0.08 0.42 9.84 0.36 10.20 31 0.27 GMET - 17 - 2 4237 - 005 0.33 0.55 0.88 8.04 0.07 8.11 89 1.68 GMET - 17 - 3 4237 - 006 1.87 0.67 2.54 3.08 0.06 3.14 157 2.96 GMET - 17 - 4 4237 - 007 1.01 0.54 1.55 6.42 0.07 6.49 87 1.56 GMET - 17 - 5 4237 - 008 0.27 0.98 1.25 7.13 0.06 7.19 74 1.17 GMET - 17 - 7 4237 - 009 0.23 1.02 1.25 6.10 0.09 6.19 44 0.93 GMET - 17 - 8 4237 - 010 0.11 0.33 0.44 9.64 0.06 9.70 69 0.85 GMET - 17 - 9 4237 - 011 0.12 0.22 0.34 10.34 0.06 10.40 54 0.46 GMET - 17 - 10 4237 - 012 0.52 0.28 0.80 7.13 0.04 7.18 20 0.27 GMET - 17 - 12 4237 - 013 0.52 0.49 1.00 7.66 0.09 7.75 68 1.06 Average The samples tested represent the range of potential mill feed grades. Samples for exploratory leach test work on Volcanics and Black shale in 2018 were collected from various drill core samples remaining from Stage 1 and 2 test work. Ixtaca - S - K 1300 Technical Report Summary Page 128 of 326
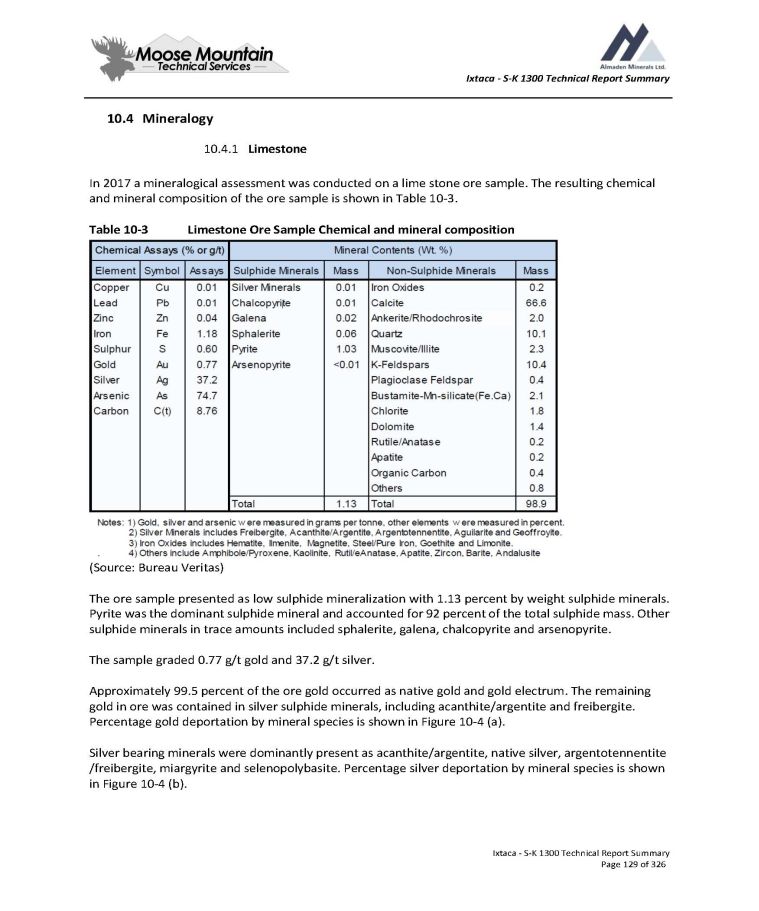
Ixtaca - S - K 1300 Technical Report Summary 4. Mineralogy 1. Limestone In 2017 a mineralogical assessment was conducted on a lime stone ore sample. The resulting chemical and mineral composition of the ore sample is shown in Table 10 - 3. Table 10 - 3 Limestone Ore Sample Chemical and mineral composition (Source: Bureau Veritas) The ore sample presented as low sulphide mineralization with 1 . 13 percent by weight sulphide minerals . Pyrite was the dominant sulphide mineral and accounted for 92 percent of the total sulphide mass . Other sulphide minerals in trace amounts included sphalerite, galena, chalcopyrite and arsenopyrite . The sample graded 0.77 g/t gold and 37.2 g/t silver. Approximately 99.5 percent of the ore gold occurred as native gold and gold electrum. The remaining gold in ore was contained in silver sulphide minerals, including acanthite/argentite and freibergite. Percentage gold deportation by mineral species is shown in Figure 10 - 4 (a). Silver bearing minerals were dominantly present as acanthite/argentite, native silver, argentotennentite /freibergite, miargyrite and selenopolybasite. Percentage silver deportation by mineral species is shown in Figure 10 - 4 (b). Ixtaca - S - K 1300 Technical Report Summary Page 129 of 326
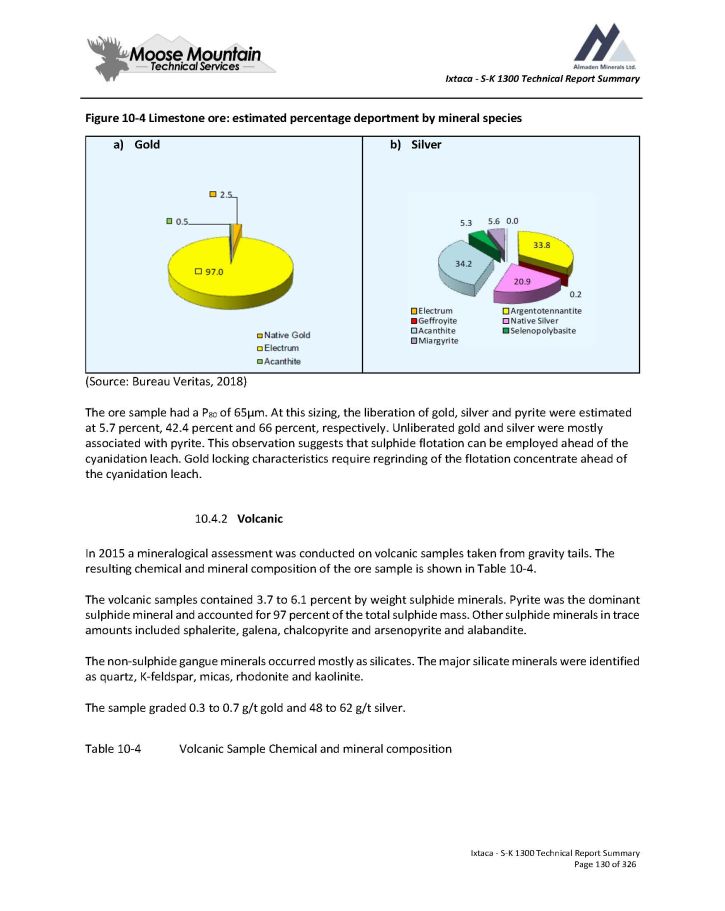
Ixtaca - S - K 1300 Technical Report Summary Figure 10 - 4 Limestone ore: estimated percentage deportment by mineral species b) Silver a) Gold (Source: Bureau Veritas, 2018) The ore sample had a P 80 of 65μm. At this sizing, the liberation of gold, silver and pyrite were estimated at 5.7 percent, 42.4 percent and 66 percent, respectively. Unliberated gold and silver were mostly associated with pyrite. This observation suggests that sulphide flotation can be employed ahead of the cyanidation leach. Gold locking characteristics require regrinding of the flotation concentrate ahead of the cyanidation leach. 10.4.2 Volcanic In 2015 a mineralogical assessment was conducted on volcanic samples taken from gravity tails. The resulting chemical and mineral composition of the ore sample is shown in Table 10 - 4. The volcanic samples contained 3 . 7 to 6 . 1 percent by weight sulphide minerals . Pyrite was the dominant sulphide mineral and accounted for 97 percent of the total sulphide mass . Other sulphide minerals in trace amounts included sphalerite, galena, chalcopyrite and arsenopyrite and alabandite . The non - sulphide gangue minerals occurred mostly as silicates . The major silicate minerals were identified as quartz, K - feldspar, micas, rhodonite and kaolinite . The sample graded 0 . 3 to 0 . 7 g/t gold and 48 to 62 g/t silver . Table 10 - 4 Volcanic Sample Chemical and mineral composition Ixtaca - S - K 1300 Technical Report Summary Page 130 of 326
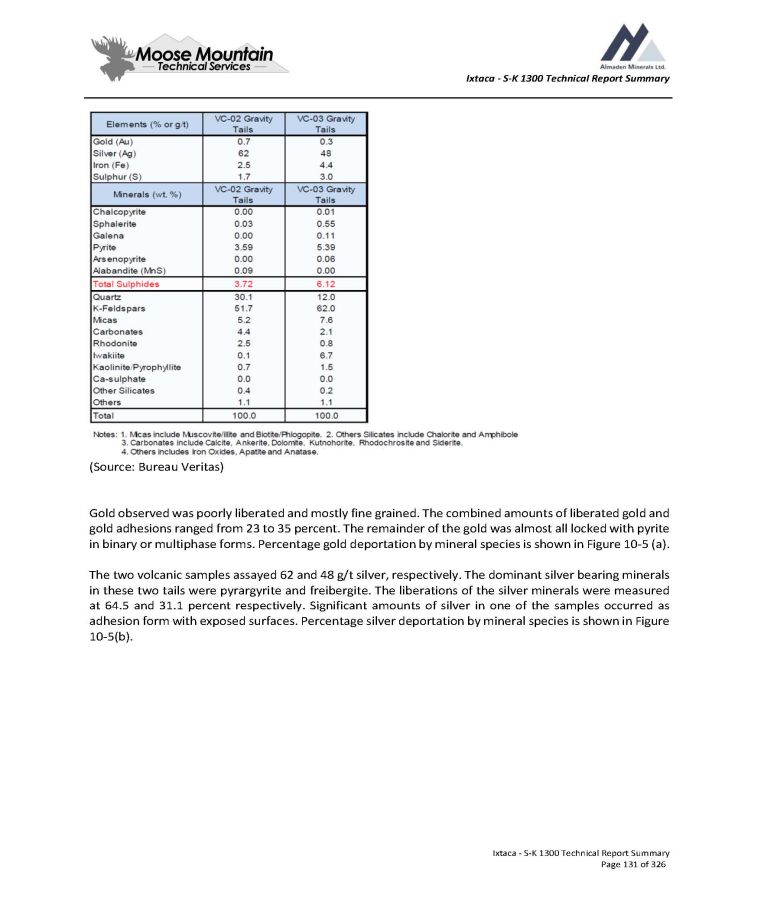
Ixtaca - S - K 1300 Technical Report Summary (Source : Bureau Veritas) Gold observed was poorly liberated and mostly fine grained . The combined amounts of liberated gold and gold adhesions ranged from 23 to 35 percent . The remainder of the gold was almost all locked with pyrite in binary or multiphase forms . Percentage gold deportation by mineral species is shown in Figure 10 - 5 (a) . The two volcanic samples assayed 62 and 48 g/t silver, respectively . The dominant silver bearing minerals in these two tails were pyrargyrite and freibergite . The liberations of the silver minerals were measured at 64 . 5 and 31 . 1 percent respectively . Significant amounts of silver in one of the samples occurred as adhesion form with exposed surfaces . Percentage silver deportation by mineral species is shown in Figure 10 - 5 (b) . Ixtaca - S - K 1300 Technical Report Summary Page 131 of 326
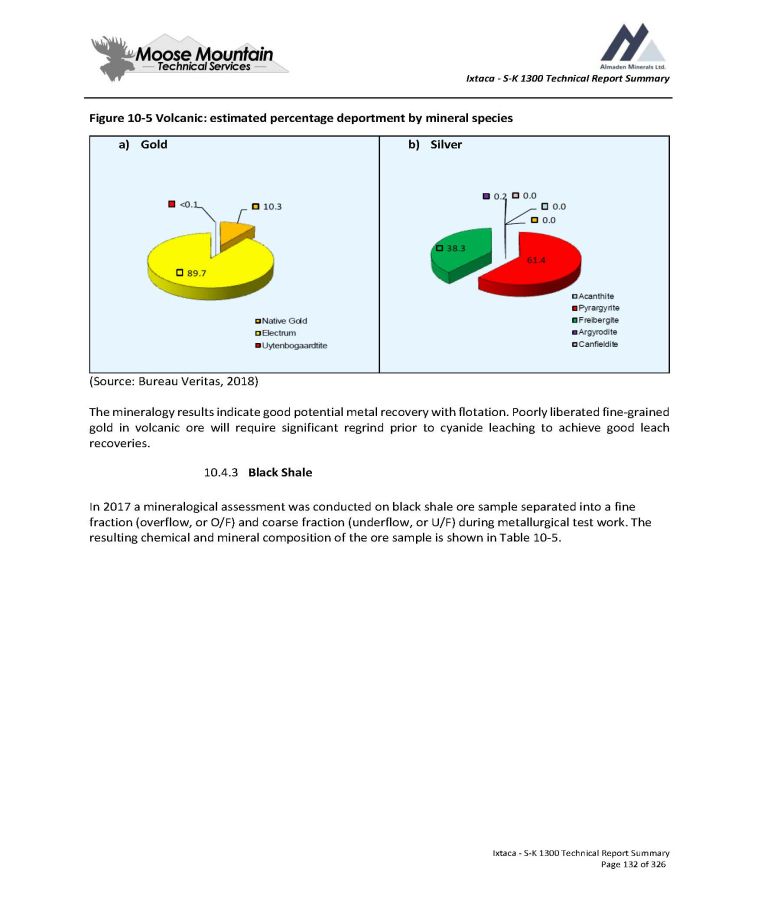
Ixtaca - S - K 1300 Technical Report Summary Figure 10 - 5 Volcanic: estimated percentage deportment by mineral species b) Silver a) Gold (Source : Bureau Veritas, 2018 ) The mineralogy results indicate good potential metal recovery with flotation . Poorly liberated fine - grained gold in volcanic ore will require significant regrind prior to cyanide leaching to achieve good leach recoveries . 10.4.3 Black Shale In 2017 a mineralogical assessment was conducted on black shale ore sample separated into a fine fraction (overflow, or O/F) and coarse fraction (underflow, or U/F) during metallurgical test work. The resulting chemical and mineral composition of the ore sample is shown in Table 10 - 5. Ixtaca - S - K 1300 Technical Report Summary Page 132 of 326
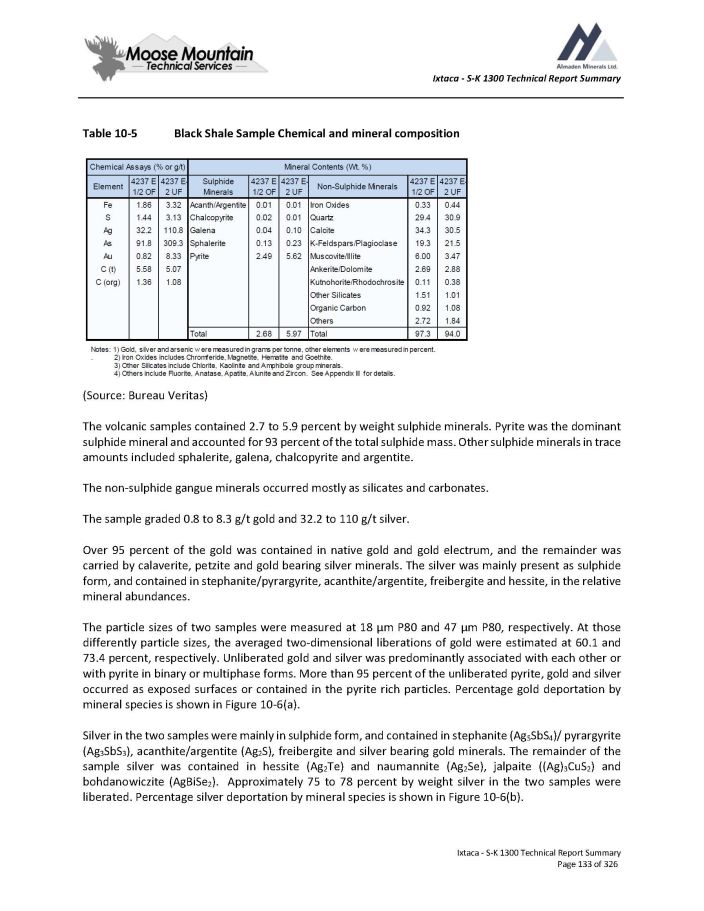
Ixtaca - S - K 1300 Technical Report Summary Table 10 - 5 Black Shale Sample Chemical and mineral composition (Source : Bureau Veritas) The volcanic samples contained 2 . 7 to 5 . 9 percent by weight sulphide minerals . Pyrite was the dominant sulphide mineral and accounted for 93 percent of the total sulphide mass . Other sulphide minerals in trace amounts included sphalerite, galena, chalcopyrite and argentite . The non - sulphide gangue minerals occurred mostly as silicates and carbonates. The sample graded 0.8 to 8.3 g/t gold and 32.2 to 110 g/t silver. Over 95 percent of the gold was contained in native gold and gold electrum, and the remainder was carried by calaverite, petzite and gold bearing silver minerals . The silver was mainly present as sulphide form, and contained in stephanite/pyrargyrite, acanthite/argentite, freibergite and hessite, in the relative mineral abundances . The particle sizes of two samples were measured at 18 μm P 80 and 47 μm P 80 , respectively . At those differently particle sizes, the averaged two - dimensional liberations of gold were estimated at 60 . 1 and 73 . 4 percent, respectively . Unliberated gold and silver was predominantly associated with each other or with pyrite in binary or multiphase forms . More than 95 percent of the unliberated pyrite, gold and silver occurred as exposed surfaces or contained in the pyrite rich particles . Percentage gold deportation by mineral species is shown in Figure 10 - 6 (a) . Silver in the two samples were mainly in sulphide form, and contained in stephanite (Ag 5 SbS 4 )/ pyrargyrite (Ag 3 SbS 3 ), acanthite/argentite (Ag 2 S), freibergite and silver bearing gold minerals . The remainder of the sample silver was contained in hessite (Ag 2 Te) and naumannite (Ag 2 Se), jalpaite ((Ag) 3 CuS 2 ) and bohdanowiczite (AgBiSe 2 ) . Approximately 75 to 78 percent by weight silver in the two samples were liberated . Percentage silver deportation by mineral species is shown in Figure 10 - 6 (b) . Ixtaca - S - K 1300 Technical Report Summary Page 133 of 326
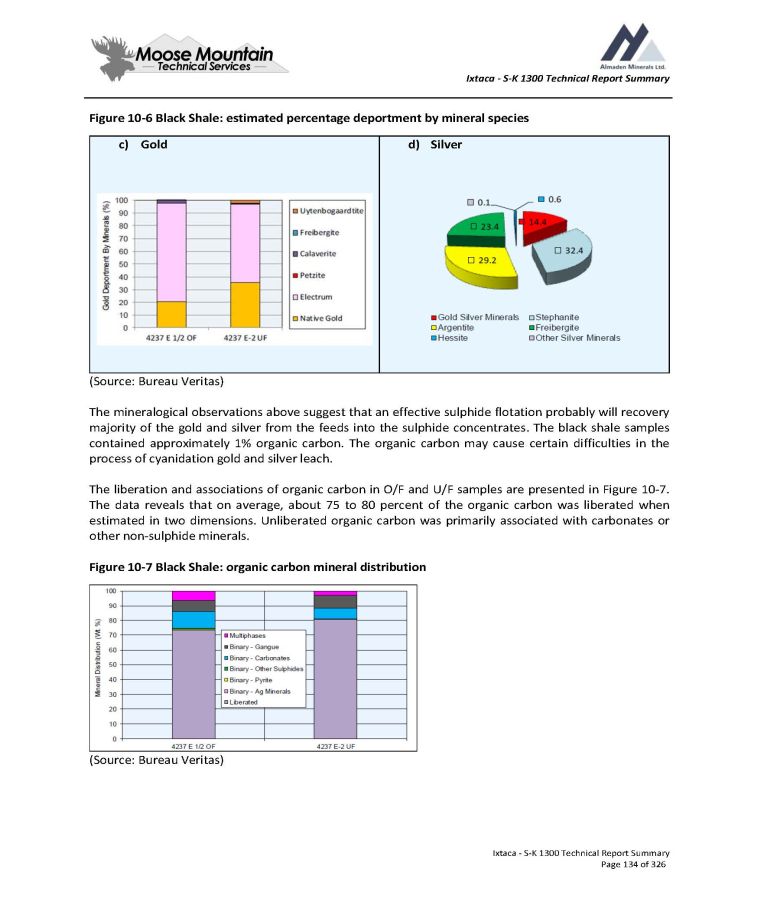
Ixtaca - S - K 1300 Technical Report Summary Figure 10 - 6 Black Shale: estimated percentage deportment by mineral species d) Silver c) Gold (Source : Bureau Veritas) The mineralogical observations above suggest that an effective sulphide flotation probably will recovery majority of the gold and silver from the feeds into the sulphide concentrates . The black shale samples contained approximately 1 % organic carbon . The organic carbon may cause certain difficulties in the process of cyanidation gold and silver leach . The liberation and associations of organic carbon in O/F and U/F samples are presented in Figure 10 - 7 . The data reveals that on average, about 75 to 80 percent of the organic carbon was liberated when estimated in two dimensions . Unliberated organic carbon was primarily associated with carbonates or other non - sulphide minerals . Figure 10 - 7 Black Shale : organic carbon mineral distribution (Source: Bureau Veritas) Ixtaca - S - K 1300 Technical Report Summary Page 134 of 326
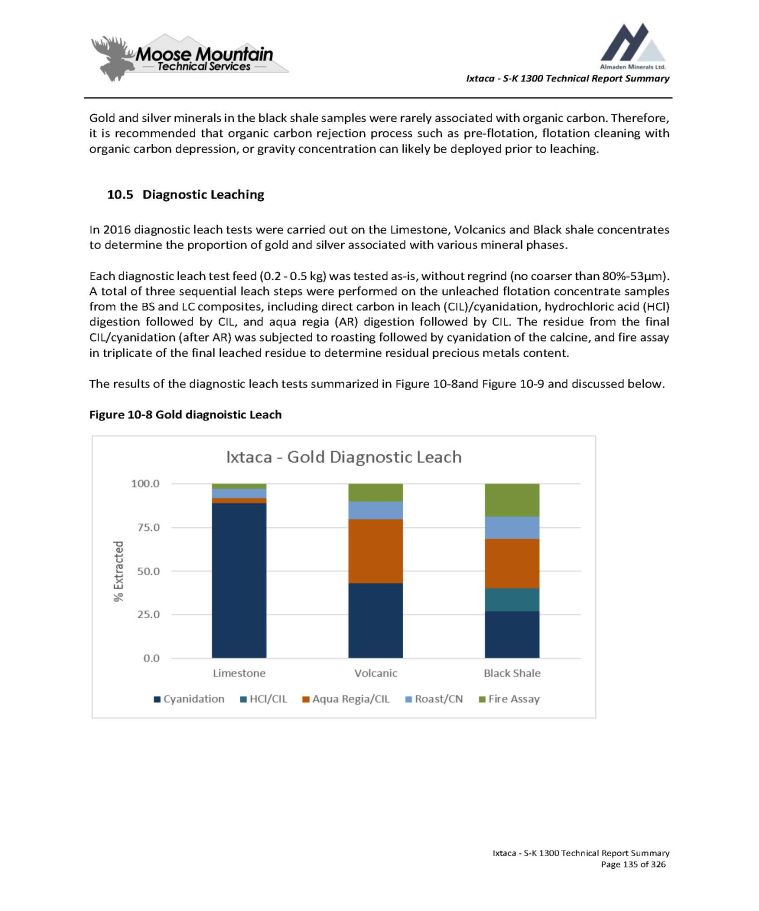
Ixtaca - S - K 1300 Technical Report Summary Gold and silver minerals in the black shale samples were rarely associated with organic carbon . Therefore, it is recommended that organic carbon rejection process such as pre - flotation, flotation cleaning with organic carbon depression, or gravity concentration can likely be deployed prior to leaching . 10.5 Diagnostic Leaching In 2016 diagnostic leach tests were carried out on the Limestone, Volcanics and Black shale concentrates to determine the proportion of gold and silver associated with various mineral phases . Each diagnostic leach test feed ( 0 . 2 - 0 . 5 kg) was tested as - is, without regrind (no coarser than 80 % - 53 μm) . A total of three sequential leach steps were performed on the unleached flotation concentrate samples from the BS and LC composites, including direct carbon in leach (CIL)/cyanidation, hydrochloric acid (HCl) digestion followed by CIL, and aqua regia (AR) digestion followed by CIL . The residue from the final CIL/cyanidation (after AR) was subjected to roasting followed by cyanidation of the calcine, and fire assay in triplicate of the final leached residue to determine residual precious metals content . The results of the diagnostic leach tests summarized in Figure 10 - 8 and Figure 10 - 9 and discussed below . Figure 10 - 8 Gold diagnoistic Leach Ixtaca - S - K 1300 Technical Report Summary Page 135 of 326
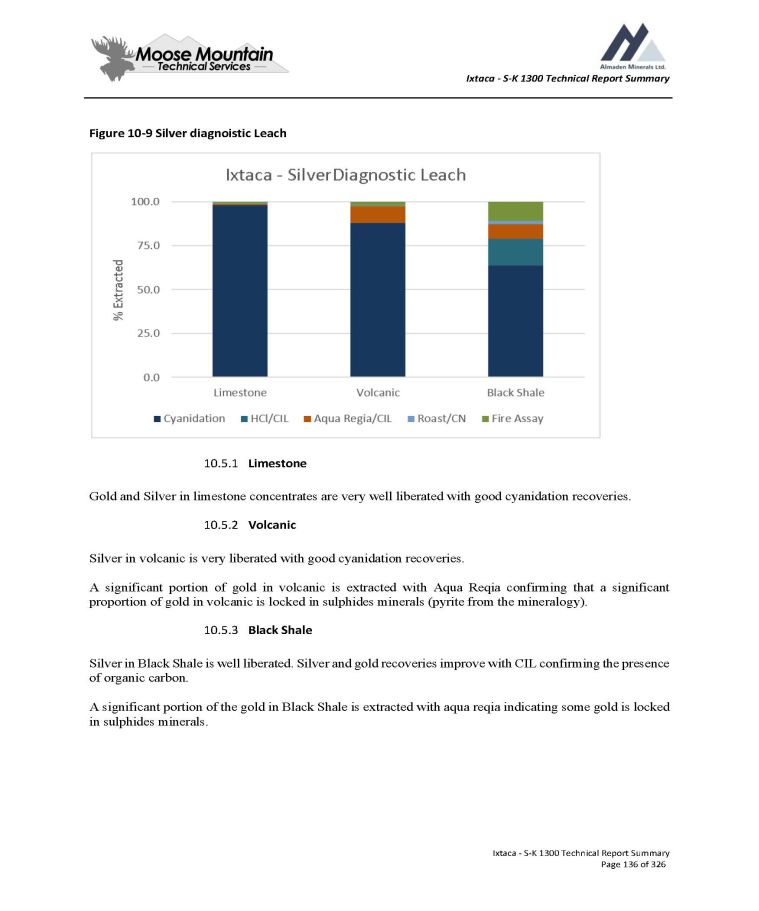
Ixtaca - S - K 1300 Technical Report Summary Figure 10 - 9 Silver diagnoistic Leach 1. Limestone Gold and Silver in limestone concentrates are very well liberated with good cyanidation recoveries. 2. Volcanic Silver in volcanic is very liberated with good cyanidation recoveries. A significant portion of gold in volcanic is extracted with Aqua Reqia confirming that a significant proportion of gold in volcanic is locked in sulphides minerals (pyrite from the mineralogy). 3. Black Shale Silver in Black Shale is well liberated. Silver and gold recoveries improve with CIL confirming the presence of organic carbon. A significant portion of the gold in Black Shale is extracted with aqua reqia indicating some gold is locked in sulphides minerals. Ixtaca - S - K 1300 Technical Report Summary Page 136 of 326
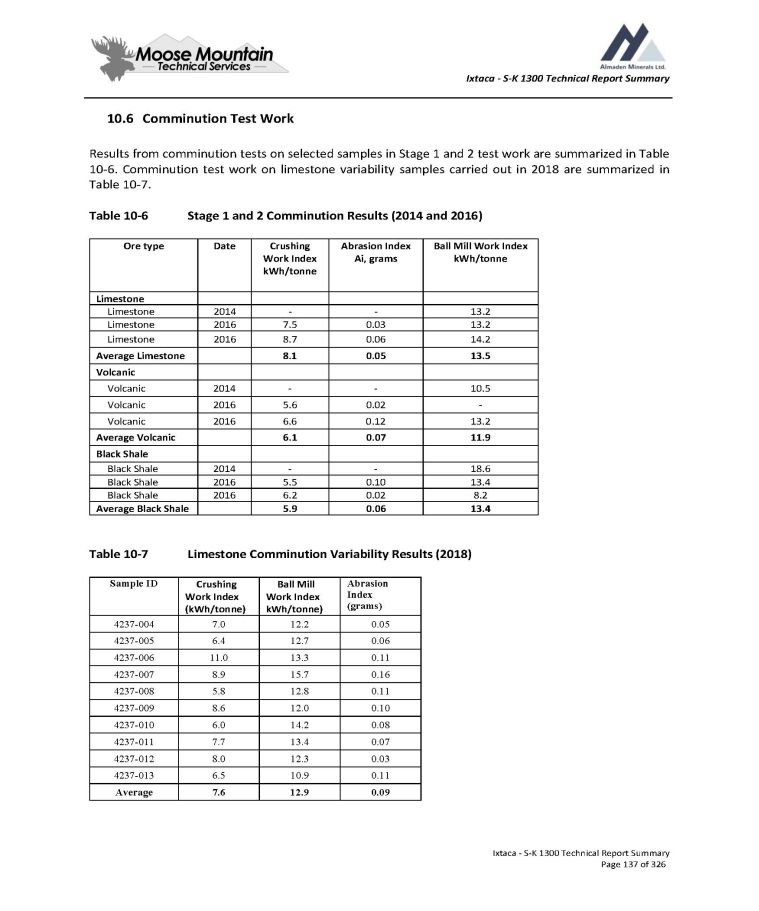
Ixtaca - S - K 1300 Technical Report Summary 10.6 Comminution Test Work Results from comminution tests on selected samples in Stage 1 and 2 test work are summarized in Table 10 - 6 . Comminution test work on limestone variability samples carried out in 2018 are summarized in Table 10 - 7 . Table 10 - 6 Stage 1 and 2 Comminution Results ( 2014 and 2016 ) Ixtaca - S - K 1300 Technical Report Summary Page 137 of 326 Ball Mill Work Index kWh/tonne Abrasion Index Ai, grams Crushing Work Index kWh/tonne Date Ore type Limestone 13.2 - - 2014 Limestone 13.2 0.03 7.5 2016 Limestone 14.2 0.06 8.7 2016 Limestone 13.5 0.05 8.1 Average Limestone Volcanic 10.5 - - 2014 Volcanic - 0.02 5.6 2016 Volcanic 13.2 0.12 6.6 2016 Volcanic 11.9 0.07 6.1 Average Volcanic Black Shale 18.6 - - 2014 Black Shale 13.4 0.10 5.5 2016 Black Shale 8.2 0.02 6.2 2016 Black Shale 13.4 0.06 5.9 Average Black Shale Table 10 - 7 Limestone Comminution Variability Results (2018) Abrasion Index (grams) Ball Mill Work Index kWh/tonne) Crushing Work Index (kWh/tonne) Sample ID 0.05 12.2 7.0 4237 - 004 0.06 12.7 6.4 4237 - 005 0.11 13.3 11.0 4237 - 006 0.16 15.7 8.9 4237 - 007 0.11 12.8 5.8 4237 - 008 0.10 12.0 8.6 4237 - 009 0.08 14.2 6.0 4237 - 010 0.07 13.4 7.7 4237 - 011 0.03 12.3 8.0 4237 - 012 0.11 10.9 6.5 4237 - 013 0.09 12.9 7.6 Average
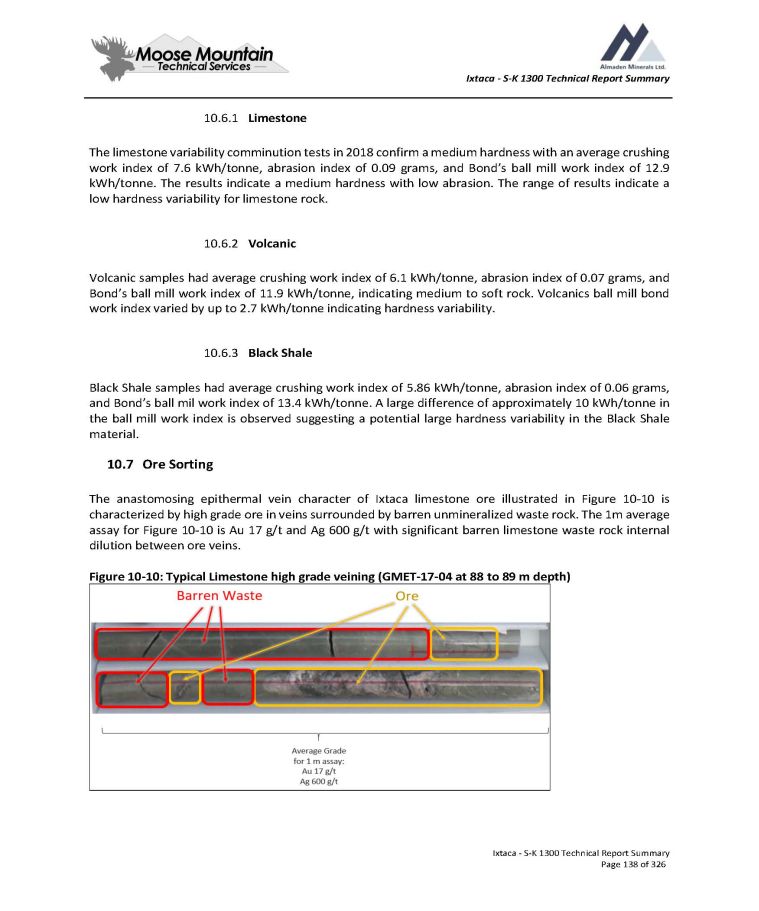
Ixtaca - S - K 1300 Technical Report Summary 1. Limestone The limestone variability comminution tests in 2018 confirm a medium hardness with an average crushing work index of 7 . 6 kWh/tonne, abrasion index of 0 . 09 grams, and Bond’s ball mill work index of 12 . 9 kWh/tonne . The results indicate a medium hardness with low abrasion . The range of results indicate a low hardness variability for limestone rock . 2. Volcanic Volcanic samples had average crushing work index of 6 . 1 kWh/tonne, abrasion index of 0 . 07 grams, and Bond’s ball mill work index of 11 . 9 kWh/tonne, indicating medium to soft rock . Volcanics ball mill bond work index varied by up to 2 . 7 kWh/tonne indicating hardness variability . 3. Black Shale Black Shale samples had average crushing work index of 5 . 86 kWh/tonne, abrasion index of 0 . 06 grams, and Bond’s ball mil work index of 13 . 4 kWh/tonne . A large difference of approximately 10 kWh/tonne in the ball mill work index is observed suggesting a potential large hardness variability in the Black Shale material . 10.7 Ore Sorting The anastomosing epithermal vein character of Ixtaca limestone ore illustrated in Figure 10 - 10 is characterized by high grade ore in veins surrounded by barren unmineralized waste rock . The 1 m average assay for Figure 10 - 10 is Au 17 g/t and Ag 600 g/t with significant barren limestone waste rock internal dilution between ore veins . Figure 10 - 10 : Typical Limestone high grade veining (GMET - 17 - 04 at 88 to 89 m depth) Ixtaca - S - K 1300 Technical Report Summary Page 138 of 326
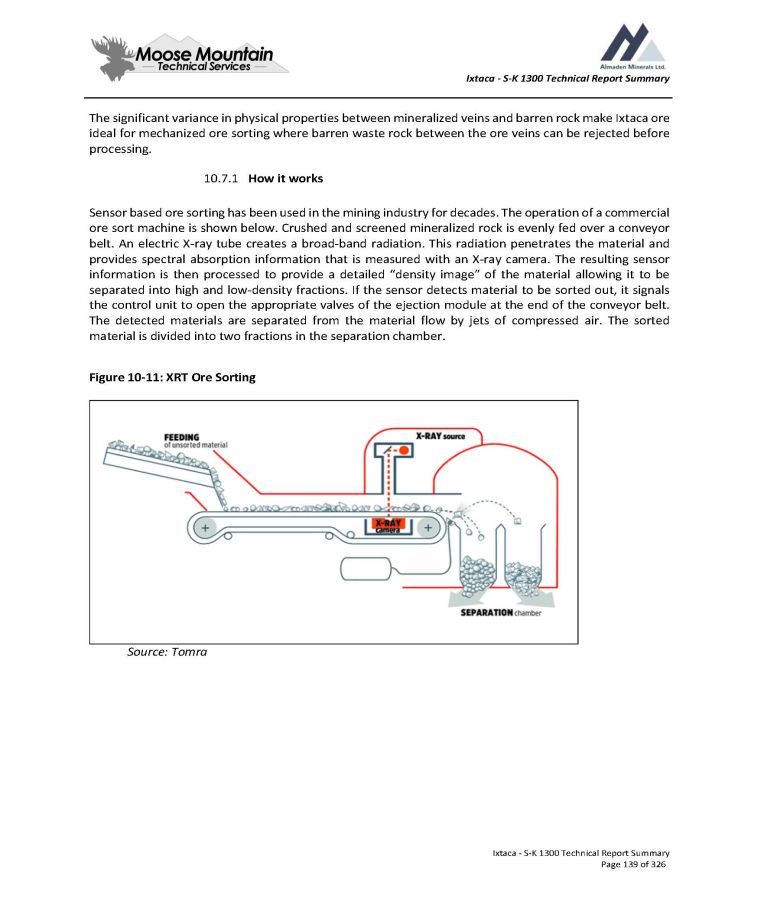
Ixtaca - S - K 1300 Technical Report Summary The significant variance in physical properties between mineralized veins and barren rock make Ixtaca ore ideal for mechanized ore sorting where barren waste rock between the ore veins can be rejected before processing . 10.7.1 How it works Sensor based ore sorting has been used in the mining industry for decades . The operation of a commercial ore sort machine is shown below . Crushed and screened mineralized rock is evenly fed over a conveyor belt . An electric X - ray tube creates a broad - band radiation . This radiation penetrates the material and provides spectral absorption information that is measured with an X - ray camera . The resulting sensor information is then processed to provide a detailed “density exh142” of the material allowing it to be separated into high and low - density fractions . If the sensor detects material to be sorted out, it signals the control unit to open the appropriate valves of the ejection module at the end of the conveyor belt . The detected materials are separated from the material flow by jets of compressed air . The sorted material is divided into two fractions in the separation chamber . Figure 10 - 11 : XRT Ore Sorting Source: Tomra Ixtaca - S - K 1300 Technical Report Summary Page 139 of 326
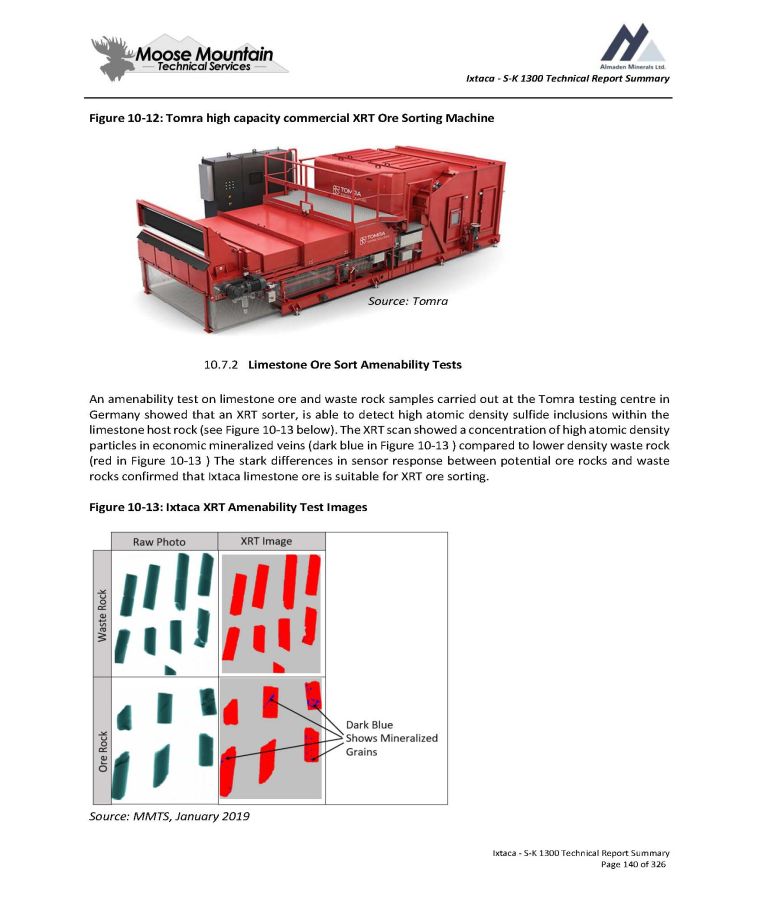
Ixtaca - S - K 1300 Technical Report Summary Figure 10 - 12: Tomra high capacity commercial XRT Ore Sorting Machine 10.7.2 Limestone Ore Sort Amenability Tests An amenability test on limestone ore and waste rock samples carried out at the Tomra testing centre in Germany showed that an XRT sorter, is able to detect high atomic density sulfide inclusions within the limestone host rock (see Figure 10 - 13 below) . The XRT scan showed a concentration of high atomic density particles in economic mineralized veins (dark blue in Figure 10 - 13 ) compared to lower density waste rock (red in Figure 10 - 13 ) The stark differences in sensor response between potential ore rocks and waste rocks confirmed that Ixtaca limestone ore is suitable for XRT ore sorting . Figure 10 - 13 : Ixtaca XRT Amenability Test exh142s Source: MMTS, January 2019 Source: Tomra Ixtaca - S - K 1300 Technical Report Summary Page 140 of 326

Ixtaca - S - K 1300 Technical Report Summary 10.7.3 Limestone Ore Sort Performance Tests Ore sorting performance tests were carried out on a commercial scale XRT machine at the Tomra testing centre in Germany . A 2 , 200 kg sample of limestone was collected from fresh drill core in the main zone . The samples were prepared for sorting by crushing and screening at a McClelland metallurgical laboratory in Reno and shipped to the Tomra ore sorting test center in Wedel, Germany . Tests were carried out using various Tomra XRT equipment parameters at various feed size fractions . All waste and ore products from the trials were weighed and analyzed independently by ALS Global in Romania . Limestone ore sort tests results summarized in Table 10 - 8 showed that ejecting waste rock instead of ore significantly improved sorting efficiency (Test 1.1 compared to 2.1); Ore sorting tests 2.1 to 6.1 successfully ejected waste rock for the coarse (+18mm) and mid size (12 - 16mm) fractions; Ore sorting had poor performance for fine rock ( - 12mm); Ixtaca - S - K 1300 Technical Report Summary Page 141 of 326
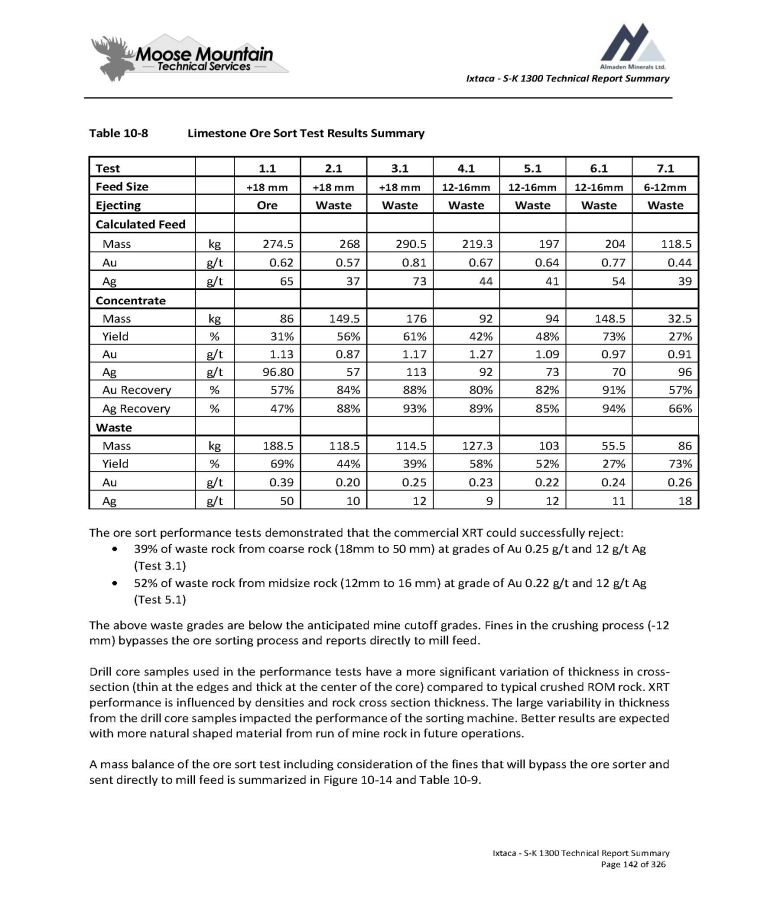
Ixtaca - S - K 1300 Technical Report Summary Table 10 - 8 Ixtaca - S - K 1300 Technical Report Summary Page 142 of 326 Limestone Ore Sort Test Results Summary 7.1 6.1 5.1 4.1 3.1 2.1 1.1 Test 6 - 12mm 12 - 16mm 12 - 16mm 12 - 16mm +18 mm +18 mm +18 mm Feed Size Waste Waste Waste Waste Waste Waste Ore Ejecting Calculated Feed 118.5 204 197 219.3 290.5 268 274.5 kg Mass 0.44 0.77 0.64 0.67 0.81 0.57 0.62 g/t Au 39 54 41 44 73 37 65 g/t Ag Concentrate 32.5 148.5 94 92 176 149.5 86 kg Mass 27% 73% 48% 42% 61% 56% 31% % Yield 0.91 0.97 1.09 1.27 1.17 0.87 1.13 g/t Au 96 70 73 92 113 57 96.80 g/t Ag 57% 91% 82% 80% 88% 84% 57% % Au Recovery 66% 94% 85% 89% 93% 88% 47% % Ag Recovery Waste 86 55.5 103 127.3 114.5 118.5 188.5 kg Mass 73% 27% 52% 58% 39% 44% 69% % Yield 0.26 0.24 0.22 0.23 0.25 0.20 0.39 g/t Au 18 11 12 9 12 10 50 g/t Ag The ore sort performance tests demonstrated that the commercial XRT could successfully reject: 39% of waste rock from coarse rock (18mm to 50 mm) at grades of Au 0.25 g/t and 12 g/t Ag (Test 3.1) 52% of waste rock from midsize rock (12mm to 16 mm) at grade of Au 0.22 g/t and 12 g/t Ag (Test 5.1) The above waste grades are below the anticipated mine cutoff grades . Fines in the crushing process ( - 12 mm) bypasses the ore sorting process and reports directly to mill feed . Drill core samples used in the performance tests have a more significant variation of thickness in cross - section (thin at the edges and thick at the center of the core) compared to typical crushed ROM rock . XRT performance is influenced by densities and rock cross section thickness . The large variability in thickness from the drill core samples impacted the performance of the sorting machine . Better results are expected with more natural shaped material from run of mine rock in future operations . A mass balance of the ore sort test including consideration of the fines that will bypass the ore sorter and sent directly to mill feed is summarized in Figure 10 - 14 and Table 10 - 9 .
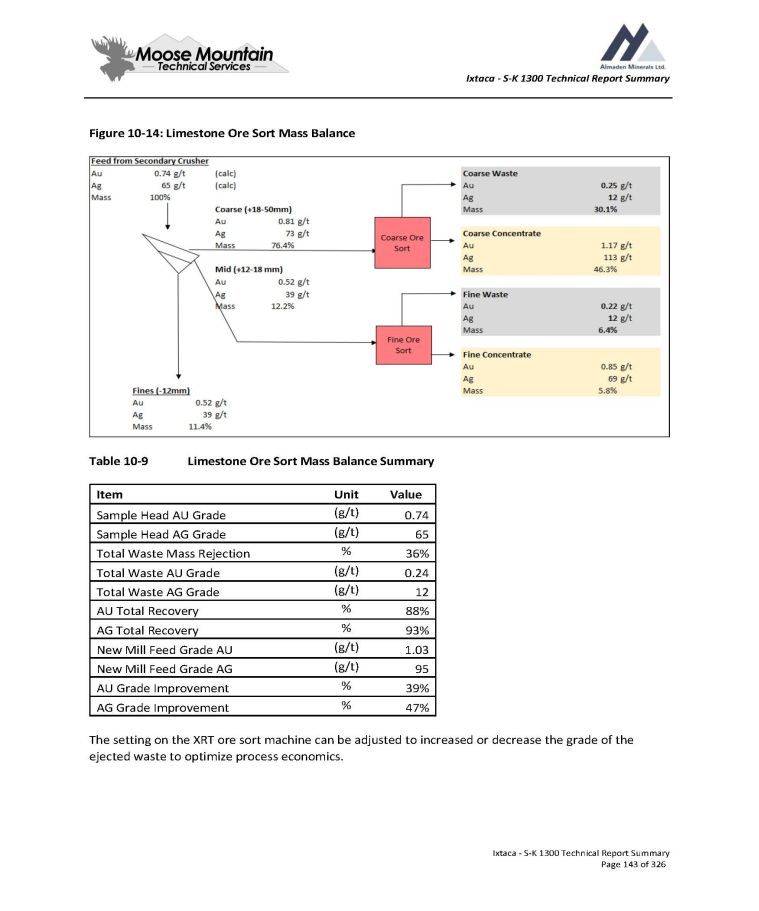
Ixtaca - S - K 1300 Technical Report Summary Figure 10 - 14: Limestone Ore Sort Mass Balance Table 10 - 9 Limestone Ore Sort Mass Balance Summary Value Unit Item 0.74 (g/t) Sample Head AU Grade 65 (g/t) Sample Head AG Grade 36% % Total Waste Mass Rejection 0.24 (g/t) Total Waste AU Grade 12 (g/t) Total Waste AG Grade 88% % AU Total Recovery 93% % AG Total Recovery 1.03 (g/t) New Mill Feed Grade AU 95 (g/t) New Mill Feed Grade AG 39% % AU Grade Improvement 47% % AG Grade Improvement The setting on the XRT ore sort machine can be adjusted to increased or decrease the grade of the ejected waste to optimize process economics. Ixtaca - S - K 1300 Technical Report Summary Page 143 of 326
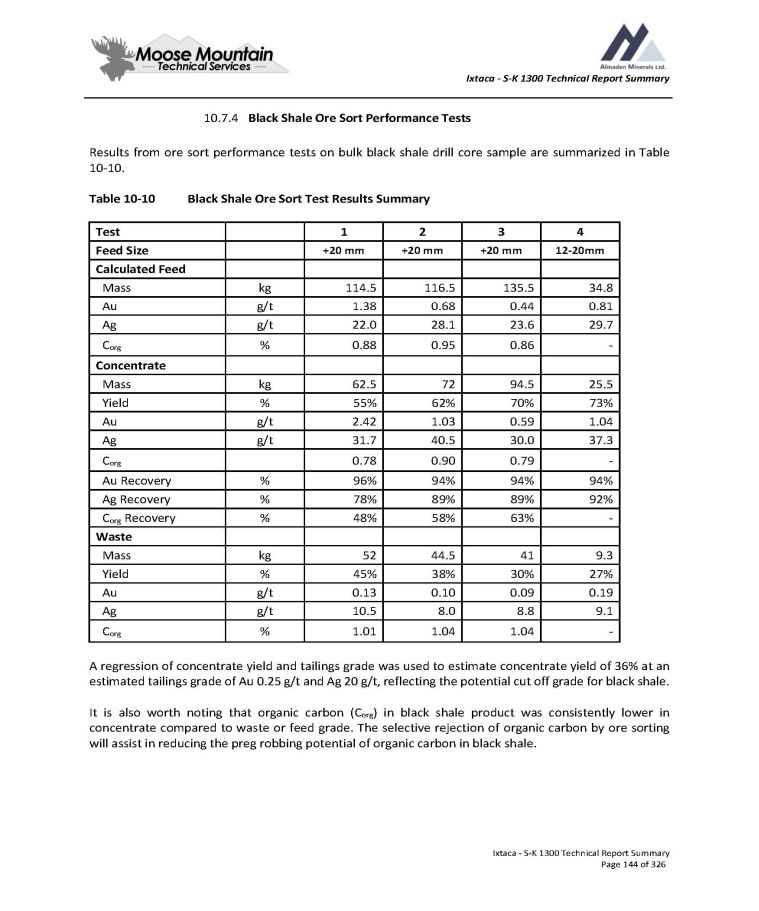
Ixtaca - S - K 1300 Technical Report Summary 10.7.4 Black Shale Ore Sort Performance Tests Results from ore sort performance tests on bulk black shale drill core sample are summarized in Table 10 - 10. Table 10 - 10 Black Shale Ore Sort Test Results Summary Ixtaca - S - K 1300 Technical Report Summary Page 144 of 326 4 3 2 1 Test 12 - 20mm +20 mm +20 mm +20 mm Feed Size Calculated Feed 34.8 135.5 116.5 114.5 kg Mass 0.81 0.44 0.68 1.38 g/t Au 29.7 23.6 28.1 22.0 g/t Ag - 0.86 0.95 0.88 % C org Concentrate 25.5 94.5 72 62.5 kg Mass 73% 70% 62% 55% % Yield 1.04 0.59 1.03 2.42 g/t Au 37.3 30.0 40.5 31.7 g/t Ag - 0.79 0.90 0.78 C org 94% 94% 94% 96% % Au Recovery 92% 89% 89% 78% % Ag Recovery - 63% 58% 48% % C org Recovery Waste 9.3 41 44.5 52 kg Mass 27% 30% 38% 45% % Yield 0.19 0.09 0.10 0.13 g/t Au 9.1 8.8 8.0 10.5 g/t Ag - 1.04 1.04 1.01 % C org A regression of concentrate yield and tailings grade was used to estimate concentrate yield of 36 % at an estimated tailings grade of Au 0 . 25 g/t and Ag 20 g/t, reflecting the potential cut off grade for black shale . It is also worth noting that organic carbon (C org ) in black shale product was consistently lower in concentrate compared to waste or feed grade . The selective rejection of organic carbon by ore sorting will assist in reducing the preg robbing potential of organic carbon in black shale .
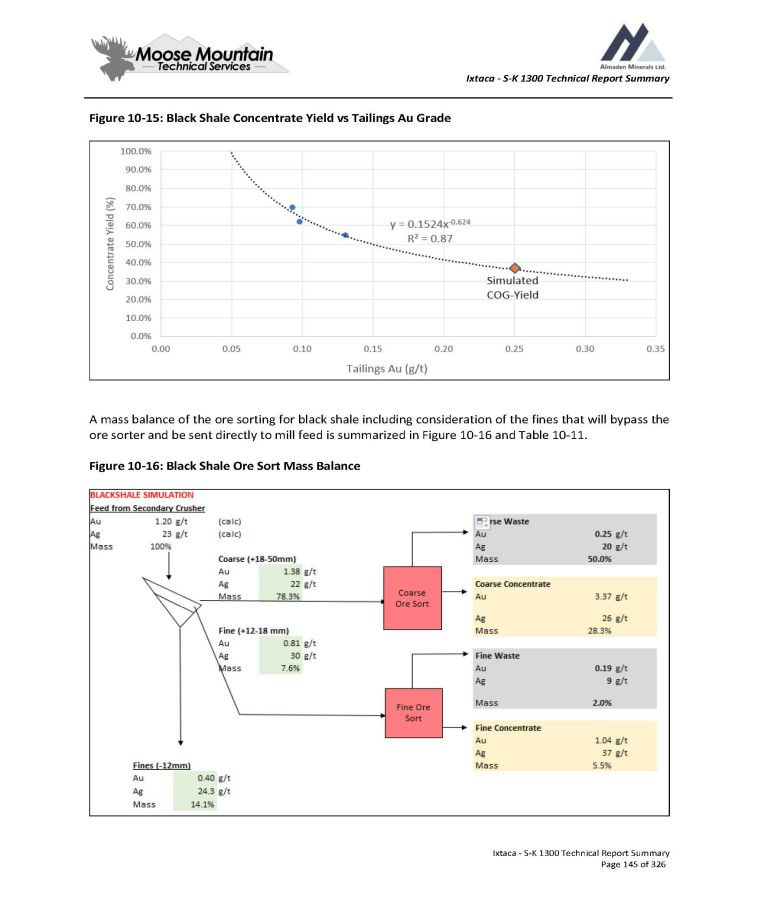
Ixtaca - S - K 1300 Technical Report Summary Figure 10 - 15: Black Shale Concentrate Yield vs Tailings Au Grade A mass balance of the ore sorting for black shale including consideration of the fines that will bypass the ore sorter and be sent directly to mill feed is summarized in Figure 10 - 16 and Table 10 - 11. Figure 10 - 16: Black Shale Ore Sort Mass Balance Ixtaca - S - K 1300 Technical Report Summary Page 145 of 326
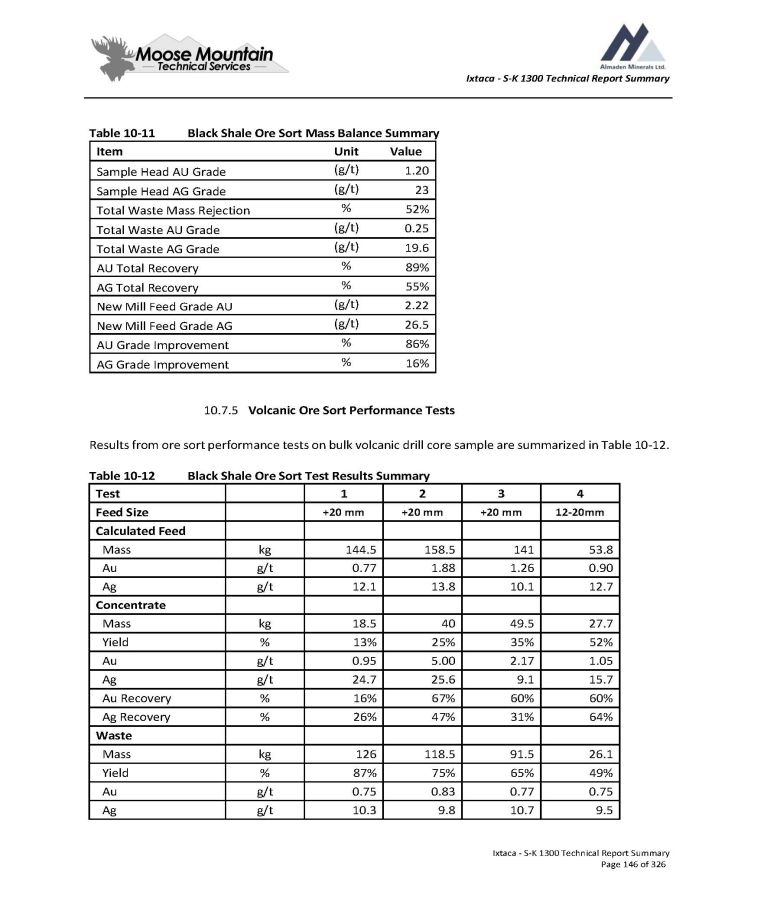
Ixtaca - S - K 1300 Technical Report Summary Table 10 - 11 Ixtaca - S - K 1300 Technical Report Summary Page 146 of 326 Black Shale Ore Sort Mass Balance Summary Value Unit Item 1.20 (g/t) Sample Head AU Grade 23 (g/t) Sample Head AG Grade 52% % Total Waste Mass Rejection 0.25 (g/t) Total Waste AU Grade 19.6 (g/t) Total Waste AG Grade 89% % AU Total Recovery 55% % AG Total Recovery 2.22 (g/t) New Mill Feed Grade AU 26.5 (g/t) New Mill Feed Grade AG 86% % AU Grade Improvement 16% % AG Grade Improvement 10.7.5 Volcanic Ore Sort Performance Tests Results from ore sort performance tests on bulk volcanic drill core sample are summarized in Table 10 - 12. Table 10 - 12 Black Shale Ore Sort Test Results Summary 4 3 2 1 Test 12 - 20mm +20 mm +20 mm +20 mm Feed Size Calculated Feed 53.8 141 158.5 144.5 kg Mass 0.90 1.26 1.88 0.77 g/t Au 12.7 10.1 13.8 12.1 g/t Ag Concentrate 27.7 49.5 40 18.5 kg Mass 52% 35% 25% 13% % Yield 1.05 2.17 5.00 0.95 g/t Au 15.7 9.1 25.6 24.7 g/t Ag 60% 60% 67% 16% % Au Recovery 64% 31% 47% 26% % Ag Recovery Waste 26.1 91.5 118.5 126 kg Mass 49% 65% 75% 87% % Yield 0.75 0.77 0.83 0.75 g/t Au 9.5 10.7 9.8 10.3 g/t Ag
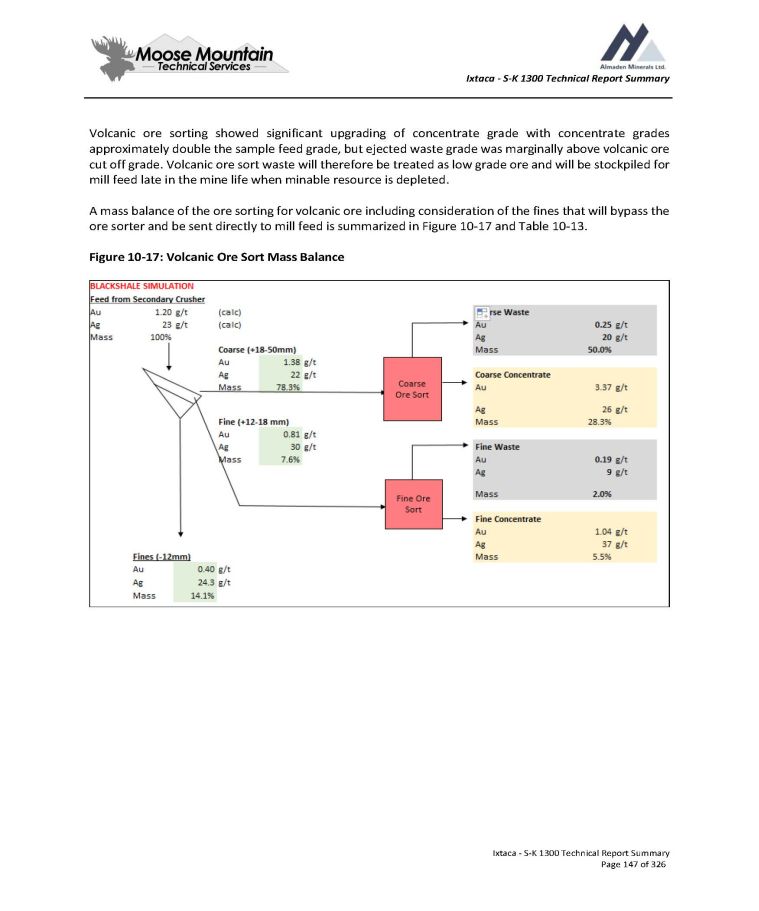
Ixtaca - S - K 1300 Technical Report Summary Volcanic ore sorting showed significant upgrading of concentrate grade with concentrate grades approximately double the sample feed grade, but ejected waste grade was marginally above volcanic ore cut off grade . Volcanic ore sort waste will therefore be treated as low grade ore and will be stockpiled for mill feed late in the mine life when minable resource is depleted . A mass balance of the ore sorting for volcanic ore including consideration of the fines that will bypass the ore sorter and be sent directly to mill feed is summarized in Figure 10 - 17 and Table 10 - 13 . Figure 10 - 17 : Volcanic Ore Sort Mass Balance Ixtaca - S - K 1300 Technical Report Summary Page 147 of 326
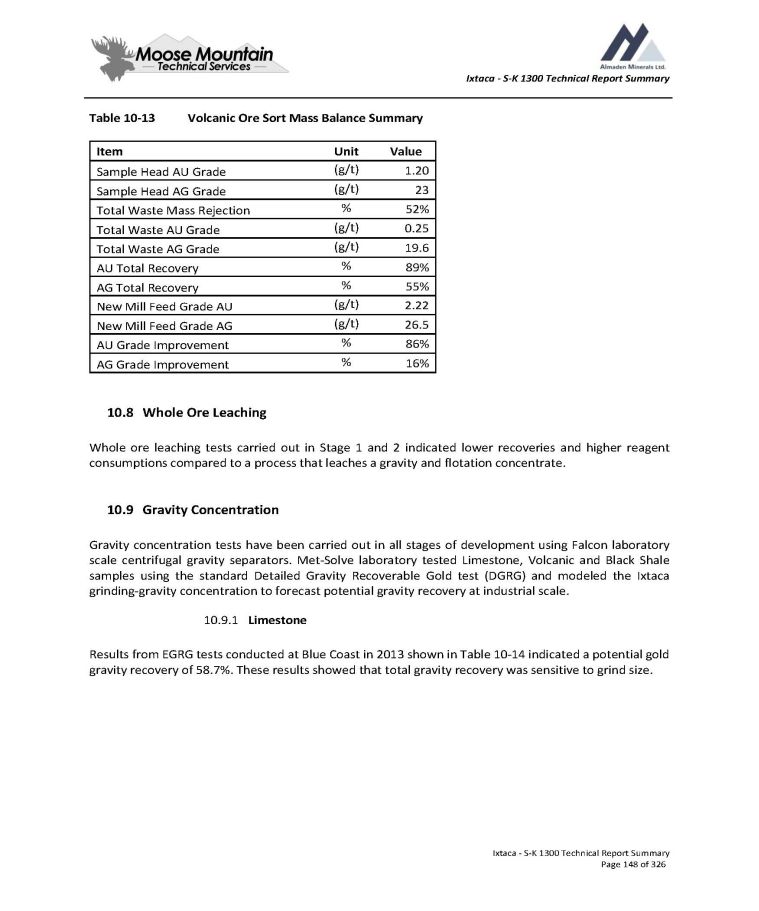
Ixtaca - S - K 1300 Technical Report Summary Table 10 - 13 Ixtaca - S - K 1300 Technical Report Summary Page 148 of 326 Volcanic Ore Sort Mass Balance Summary Value Unit Item 1.20 (g/t) Sample Head AU Grade 23 (g/t) Sample Head AG Grade 52% % Total Waste Mass Rejection 0.25 (g/t) Total Waste AU Grade 19.6 (g/t) Total Waste AG Grade 89% % AU Total Recovery 55% % AG Total Recovery 2.22 (g/t) New Mill Feed Grade AU 26.5 (g/t) New Mill Feed Grade AG 86% % AU Grade Improvement 16% % AG Grade Improvement 8. Whole Ore Leaching Whole ore leaching tests carried out in Stage 1 and 2 indicated lower recoveries and higher reagent consumptions compared to a process that leaches a gravity and flotation concentrate . 9. Gravity Concentration Gravity concentration tests have been carried out in all stages of development using Falcon laboratory scale centrifugal gravity separators . Met - Solve laboratory tested Limestone, Volcanic and Black Shale samples using the standard Detailed Gravity Recoverable Gold test (DGRG) and modeled the Ixtaca grinding - gravity concentration to forecast potential gravity recovery at industrial scale . 1. Limestone Results from EGRG tests conducted at Blue Coast in 2013 shown in Table 10 - 14 indicated a potential gold gravity recovery of 58 . 7 % . These results showed that total gravity recovery was sensitive to grind size .
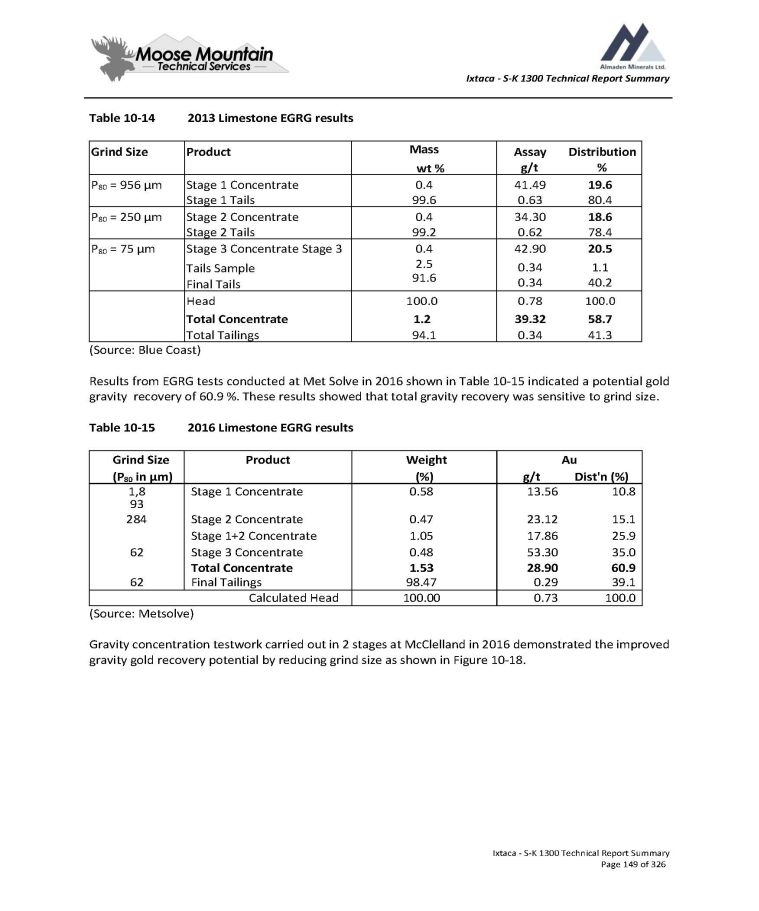
Ixtaca - S - K 1300 Technical Report Summary Table 10 - 14 Ixtaca - S - K 1300 Technical Report Summary Page 149 of 326 2013 Limestone EGRG results Distribution % Assay g/t Mass wt % Product Grind Size 19.6 80.4 41.49 0.63 0.4 99.6 Stage 1 Concentrate Stage 1 Tails P 80 = 956 µm 18.6 78.4 34.30 0.62 0.4 99.2 Stage 2 Concentrate Stage 2 Tails P 80 = 250 µm 20.5 1.1 40.2 42.90 0.34 0.34 0.4 2.5 Stage 3 Concentrate Stage 3 Tails Sample Final Tails P 80 = 75 µm 91.6 100.0 58.7 41.3 0.78 39.32 0.34 100.0 1.2 94.1 Head Total Concentrate Total Tailings (Source: Blue Coast) Results from EGRG tests conducted at Met Solve in 2016 shown in Table 10 - 15 indicated a potential gold gravity recovery of 60.9 %. These results showed that total gravity recovery was sensitive to grind size. Table 10 - 15 2016 Limestone EGRG results Au Dist'n (%) g/t Weight (%) Product Grind Size (P 80 in µm) 10.8 13.56 0.58 Stage 1 Concentrate 1,8 93 15.1 23.12 0.47 Stage 2 Concentrate 284 25.9 17.86 1.05 Stage 1+2 Concentrate 35.0 53.30 0.48 Stage 3 Concentrate 62 60.9 28.90 1.53 Total Concentrate 39.1 0.29 98.47 Final Tailings 62 100.0 0.73 100.00 Calculated Head (Source: Metsolve) Gravity concentration testwork carried out in 2 stages at McClelland in 2016 demonstrated the improved gravity gold recovery potential by reducing grind size as shown in Figure 10 - 18.
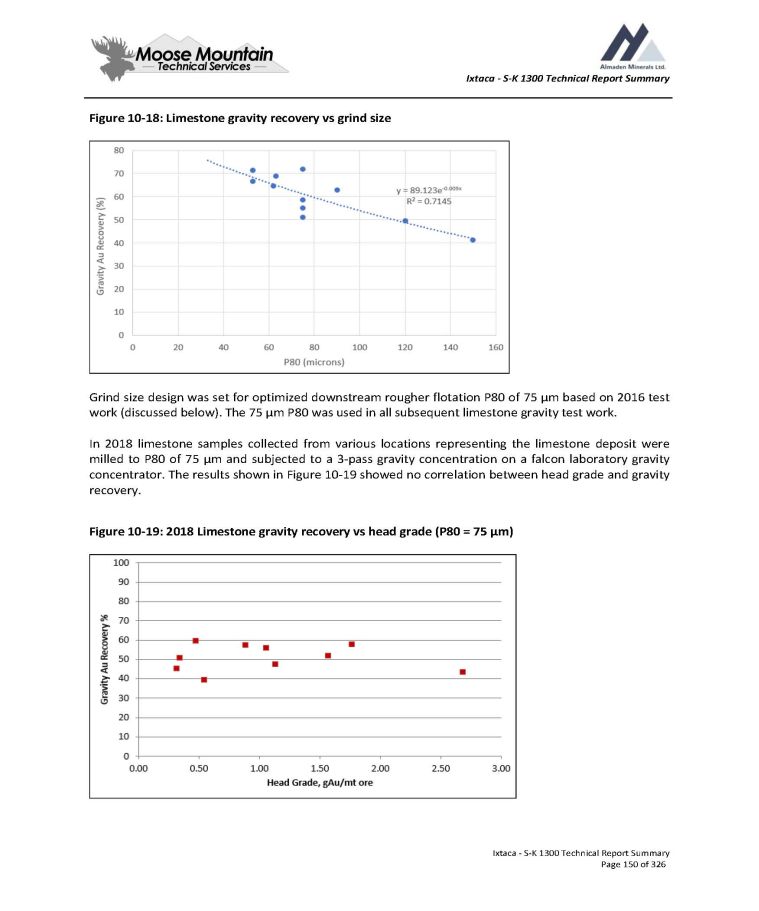
Ixtaca - S - K 1300 Technical Report Summary Figure 10 - 18: Limestone gravity recovery vs grind size Grind size design was set for optimized downstream rougher flotation P 80 of 75 µm based on 2016 test work (discussed below) . The 75 µm P 80 was used in all subsequent limestone gravity test work . In 2018 limestone samples collected from various locations representing the limestone deposit were milled to P 80 of 75 µm and subjected to a 3 - pass gravity concentration on a falcon laboratory gravity concentrator . The results shown in Figure 10 - 19 showed no correlation between head grade and gravity recovery . Figure 10 - 19 : 2018 Limestone gravity recovery vs head grade (P 80 = 75 µm) Ixtaca - S - K 1300 Technical Report Summary Page 150 of 326
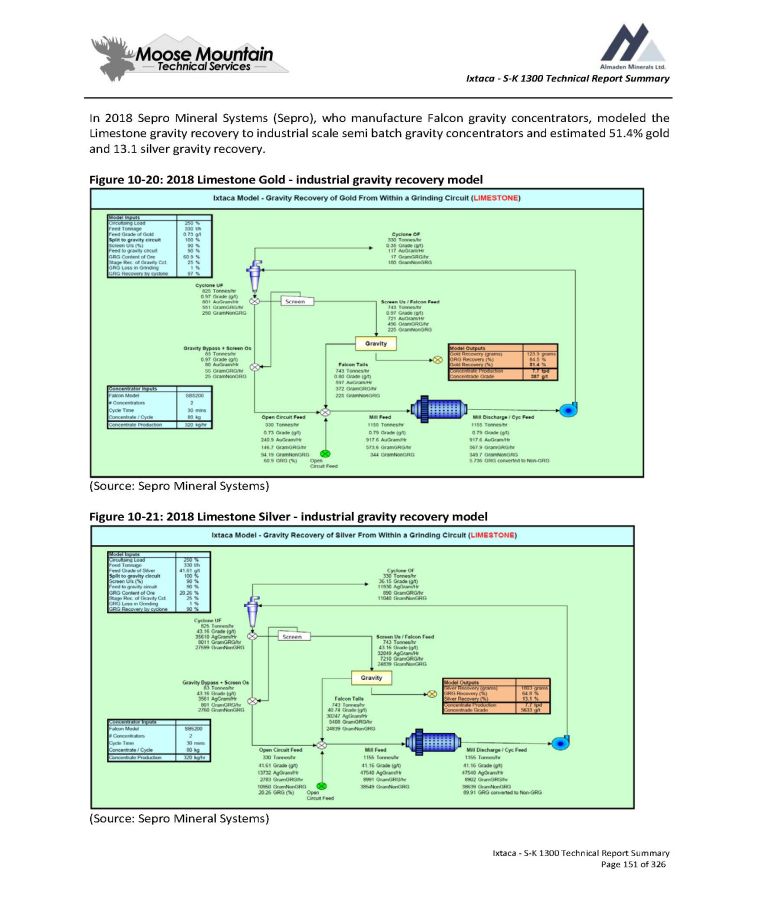
Ixtaca - S - K 1300 Technical Report Summary In 2018 Sepro Mineral Systems (Sepro), who manufacture Falcon gravity concentrators, modeled the Limestone gravity recovery to industrial scale semi batch gravity concentrators and estimated 51 . 4 % gold and 13 . 1 silver gravity recovery . Figure 10 - 20 : 2018 Limestone Gold - industrial gravity recovery model (Source: Sepro Mineral Systems) Figure 10 - 21: 2018 Limestone Silver - industrial gravity recovery model (Source: Sepro Mineral Systems) Ixtaca - S - K 1300 Technical Report Summary Page 151 of 326
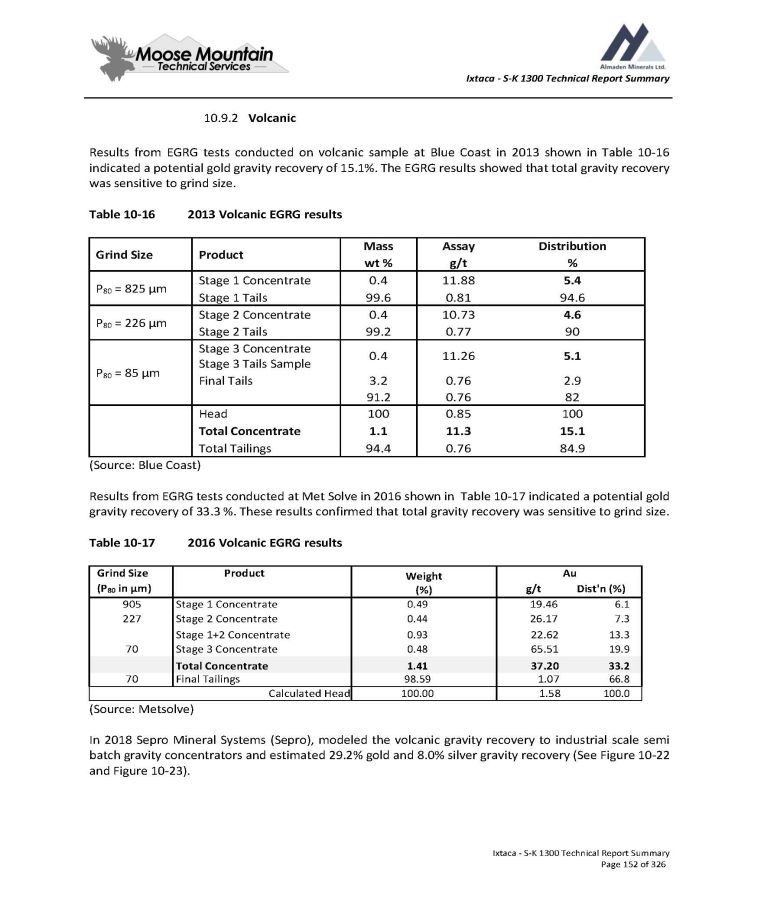
Ixtaca - S - K 1300 Technical Report Summary 10.9.2 Volcanic Results from EGRG tests conducted on volcanic sample at Blue Coast in 2013 shown in Table 10 - 16 indicated a potential gold gravity recovery of 15 . 1 % . The EGRG results showed that total gravity recovery was sensitive to grind size . Table 10 - 16 2013 Volcanic EGRG results Ixtaca - S - K 1300 Technical Report Summary Page 152 of 326 Distribution Assay Mass Product Grind Size % g/t wt % 5.4 11.88 0.4 Stage 1 Concentrate P 80 = 825 µm 94.6 0.81 99.6 Stage 1 Tails 4.6 10.73 0.4 Stage 2 Concentrate P 80 = 226 µm 90 0.77 99.2 Stage 2 Tails 5.1 11.26 0.4 Stage 3 Concentrate Stage 3 Tails Sample P 80 = 85 µm 2.9 0.76 3.2 Final Tails 82 0.76 91.2 100 0.85 100 Head 15.1 11.3 1.1 Total Concentrate 84.9 0.76 94.4 Total Tailings (Source: Blue Coast) Results from EGRG tests conducted at Met Solve in 2016 shown in Table 10 - 17 indicated a potential gold gravity recovery of 33.3 %. These results confirmed that total gravity recovery was sensitive to grind size. Table 10 - 17 2016 Volcanic EGRG results Au Dist'n (%) g/t Weight (%) Product Grind Size (P 80 in µm) 19.46 6.1 0.49 Stage 1 Concentrate 905 26.17 7.3 0.44 Stage 2 Concentrate 227 13.3 22.62 0.93 Stage 1+2 Concentrate 19.9 65.51 0.48 Stage 3 Concentrate 70 33.2 37.20 1.41 Total Concentrate 66.8 1.07 98.59 Final Tailings 70 100.0 1.58 100.00 Calculated Head (Source : Metsolve) In 2018 Sepro Mineral Systems (Sepro), modeled the volcanic gravity recovery to industrial scale semi batch gravity concentrators and estimated 29 . 2 % gold and 8 . 0 % silver gravity recovery (See Figure 10 - 22 and Figure 10 - 23 ) .
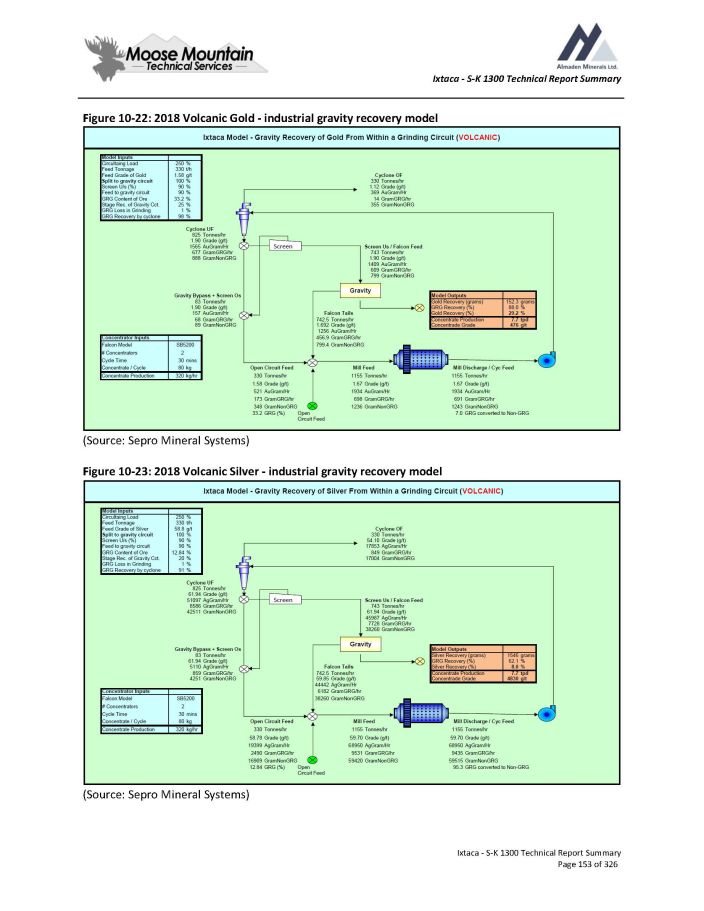
Ixtaca - S - K 1300 Technical Report Summary Figure 10 - 22: 2018 Volcanic Gold - industrial gravity recovery model (Source: Sepro Mineral Systems) Figure 10 - 23: 2018 Volcanic Silver - industrial gravity recovery model (Source: Sepro Mineral Systems) Ixtaca - S - K 1300 Technical Report Summary Page 153 of 326
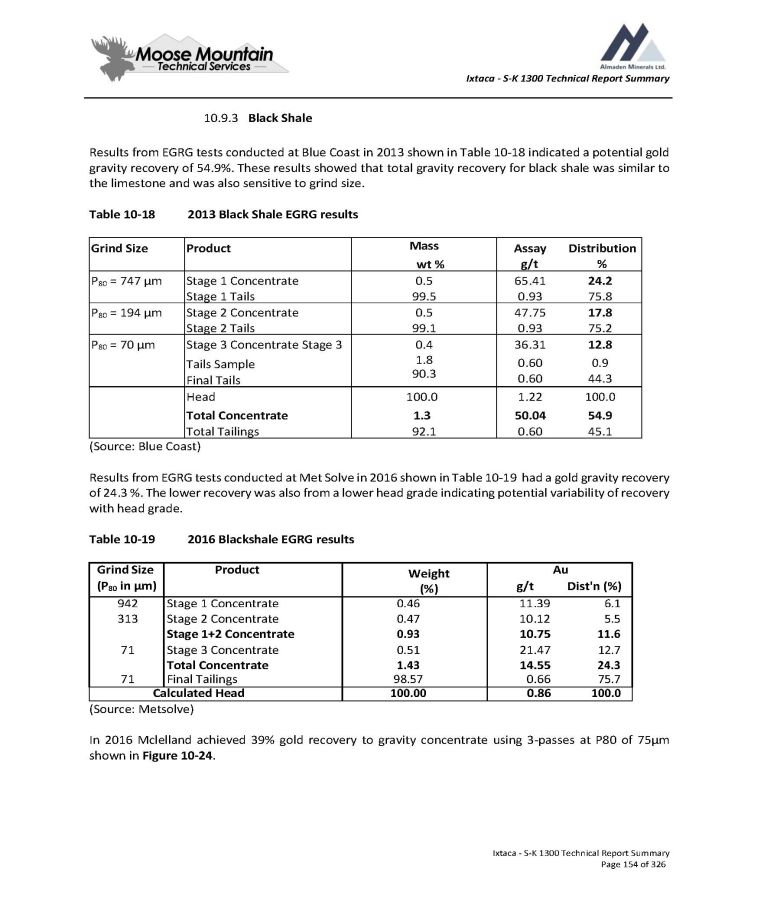
Ixtaca - S - K 1300 Technical Report Summary 10.9.3 Black Shale Results from EGRG tests conducted at Blue Coast in 2013 shown in Table 10 - 18 indicated a potential gold gravity recovery of 54 . 9 % . These results showed that total gravity recovery for black shale was similar to the limestone and was also sensitive to grind size . Table 10 - 18 2013 Black Shale EGRG results Ixtaca - S - K 1300 Technical Report Summary Page 154 of 326 Distribution % Assay g/t Mass wt % Product Grind Size 24.2 75.8 65.41 0.93 0.5 99.5 Stage 1 Concentrate Stage 1 Tails P 80 = 747 µm 17.8 75.2 47.75 0.93 0.5 99.1 Stage 2 Concentrate Stage 2 Tails P 80 = 194 µm 12.8 0.9 44.3 36.31 0.60 0.60 0.4 1.8 Stage 3 Concentrate Stage 3 Tails Sample Final Tails P 80 = 70 µm 90.3 100.0 54.9 45.1 1.22 50.04 0.60 100.0 1.3 92.1 Head Total Concentrate Total Tailings (Source : Blue Coast) Results from EGRG tests conducted at Met Solve in 2016 shown in Table 10 - 19 had a gold gravity recovery of 24 . 3 % . The lower recovery was also from a lower head grade indicating potential variability of recovery with head grade . Table 10 - 19 2016 Blackshale EGRG results Au Dist'n (%) g/t Weight (%) Product Grind Size (P 80 in µm) 11.39 6.1 0.46 Stage 1 Concentrate 942 10.12 5.5 0.47 Stage 2 Concentrate 313 11.6 10.75 0.93 Stage 1+2 Concentrate 12.7 21.47 0.51 Stage 3 Concentrate 71 24.3 14.55 1.43 Total Concentrate 75.7 0.66 98.57 Final Tailings 71 100.0 0.86 100.00 Calculated Head (Source: Metsolve) In 2016 Mclelland achieved 39% gold recovery to gravity concentrate using 3 - passes at P80 of 75µm shown in Figure 10 - 24 .
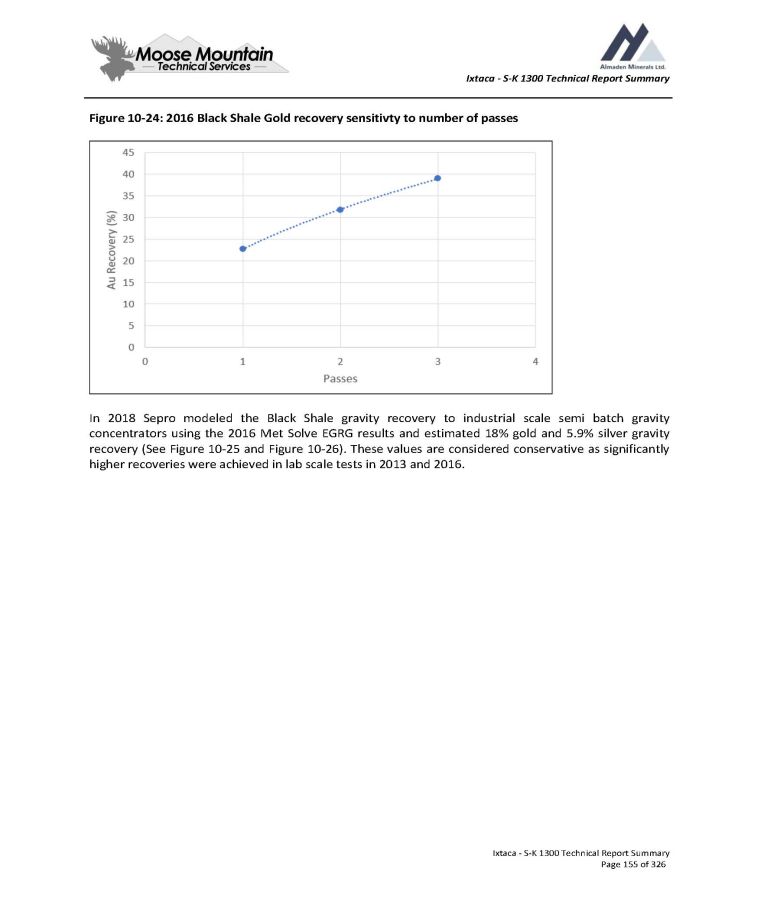
Ixtaca - S - K 1300 Technical Report Summary Figure 10 - 24: 2016 Black Shale Gold recovery sensitivty to number of passes In 2018 Sepro modeled the Black Shale gravity recovery to industrial scale semi batch gravity concentrators using the 2016 Met Solve EGRG results and estimated 18 % gold and 5 . 9 % silver gravity recovery (See Figure 10 - 25 and Figure 10 - 26 ) . These values are considered conservative as significantly higher recoveries were achieved in lab scale tests in 2013 and 2016 . Ixtaca - S - K 1300 Technical Report Summary Page 155 of 326
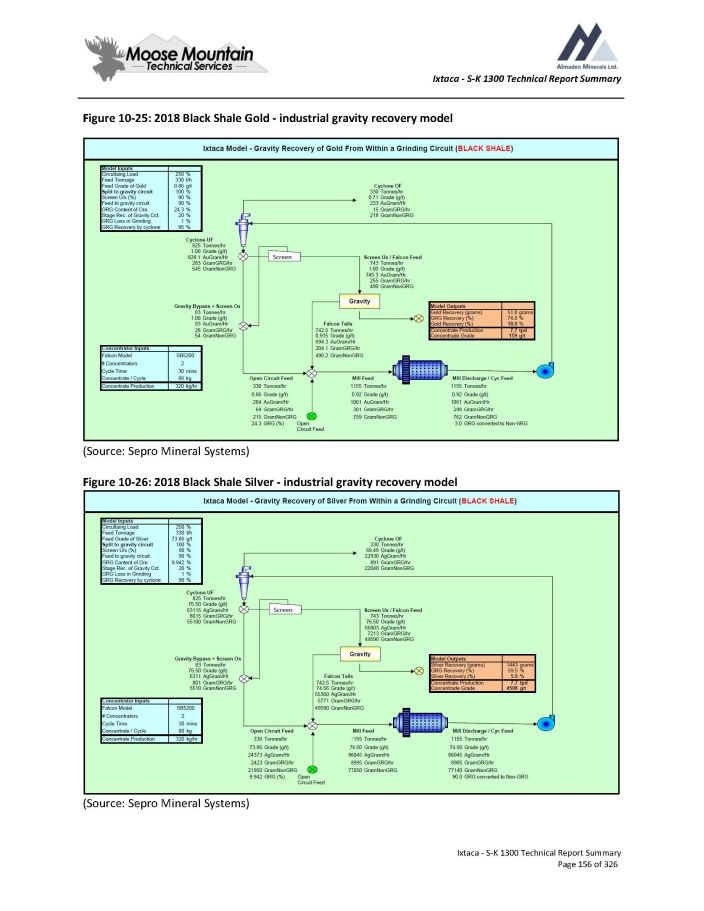
Ixtaca - S - K 1300 Technical Report Summary Figure 10 - 25: 2018 Black Shale Gold - industrial gravity recovery model (Source: Sepro Mineral Systems) Figure 10 - 26: 2018 Black Shale Silver - industrial gravity recovery model (Source: Sepro Mineral Systems) Ixtaca - S - K 1300 Technical Report Summary Page 156 of 326
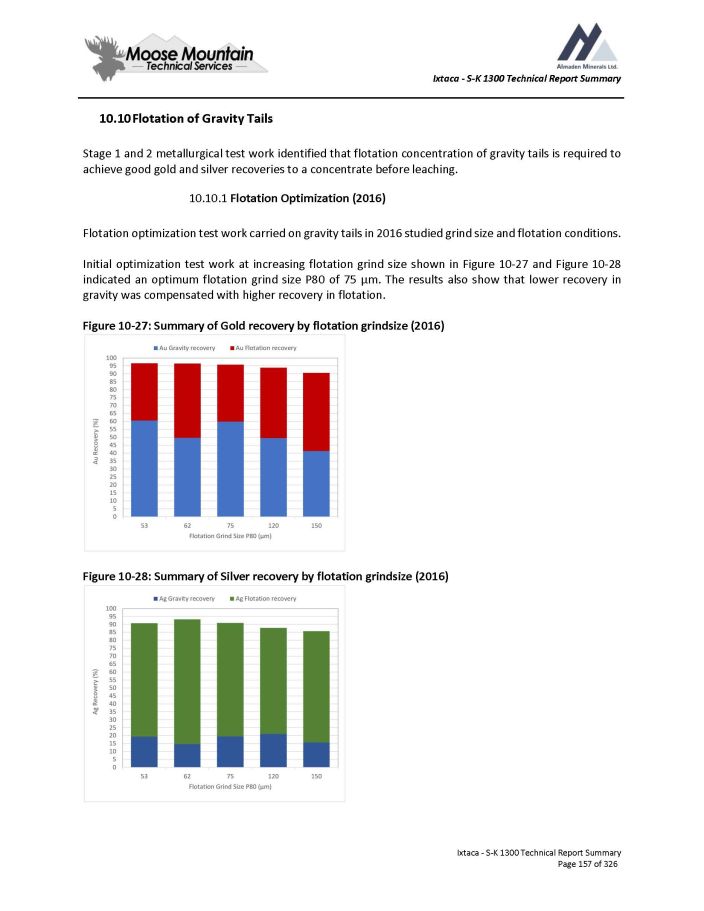
Ixtaca - S - K 1300 Technical Report Summary 10. Flotation of Gravity Tails Stage 1 and 2 metallurgical test work identified that flotation concentration of gravity tails is required to achieve good gold and silver recoveries to a concentrate before leaching . 1. Flotation Optimization (2016) Flotation optimization test work carried on gravity tails in 2016 studied grind size and flotation conditions . Initial optimization test work at increasing flotation grind size shown in Figure 10 - 27 and Figure 10 - 28 indicated an optimum flotation grind size P 80 of 75 µm . The results also show that lower recovery in gravity was compensated with higher recovery in flotation . Figure 10 - 27 : Summary of Gold recovery by flotation grindsize ( 2016 ) Figure 10 - 28: Summary of Silver recovery by flotation grindsize (2016) Ixtaca - S - K 1300 Technical Report Summary Page 157 of 326
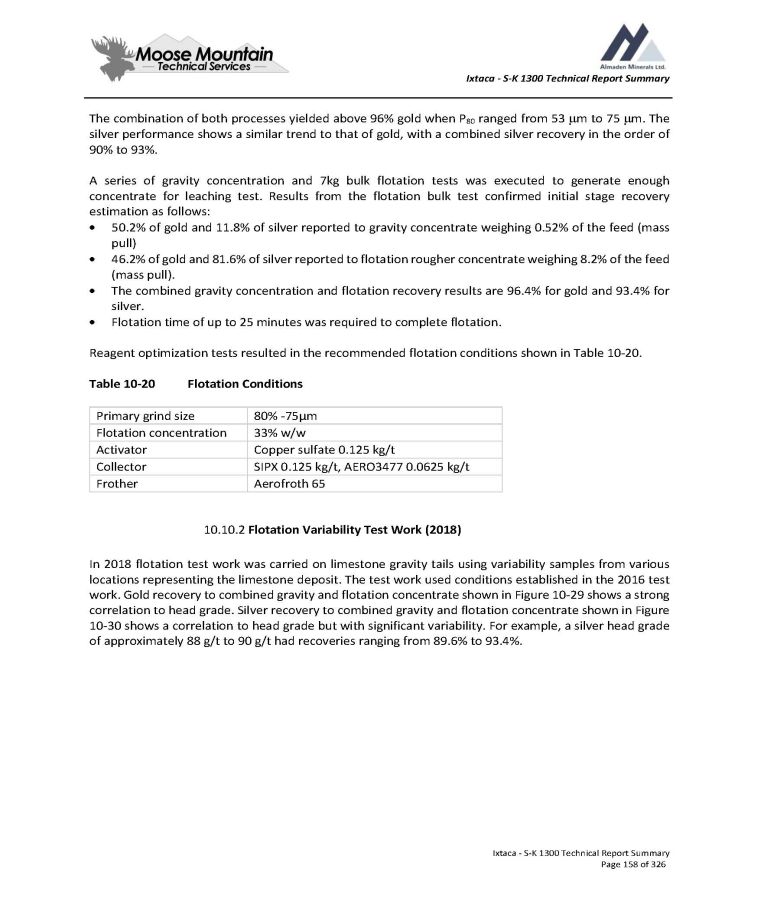
Ixtaca - S - K 1300 Technical Report Summary The combination of both processes yielded above 96 % gold when P 80 ranged from 53 m to 75 m . The silver performance shows a similar trend to that of gold, with a combined silver recovery in the order of 90 % to 93 % . A series of gravity concentration and 7 kg bulk flotation tests was executed to generate enough concentrate for leaching test . Results from the flotation bulk test confirmed initial stage recovery estimation as follows : 50.2% of gold and 11.8% of silver reported to gravity concentrate weighing 0.52% of the feed (mass pull) 46.2% of gold and 81.6% of silver reported to flotation rougher concentrate weighing 8.2% of the feed (mass pull). The combined gravity concentration and flotation recovery results are 96.4% for gold and 93.4% for silver. Flotation time of up to 25 minutes was required to complete flotation. Reagent optimization tests resulted in the recommended flotation conditions shown in Table 10 - 20 . Table 10 - 20 Flotation Conditions Ixtaca - S - K 1300 Technical Report Summary Page 158 of 326 80% - 75μm Primary grind size 33% w/w Flotation concentration Copper sulfate 0.125 kg/t Activator SIPX 0.125 kg/t, AERO3477 0.0625 kg/t Collector Aerofroth 65 Frother 10.10.2 Flotation Variability Test Work (2018) In 2018 flotation test work was carried on limestone gravity tails using variability samples from various locations representing the limestone deposit . The test work used conditions established in the 2016 test work . Gold recovery to combined gravity and flotation concentrate shown in Figure 10 - 29 shows a strong correlation to head grade . Silver recovery to combined gravity and flotation concentrate shown in Figure 10 - 30 shows a correlation to head grade but with significant variability . For example, a silver head grade of approximately 88 g/t to 90 g/t had recoveries ranging from 89 . 6 % to 93 . 4 % .
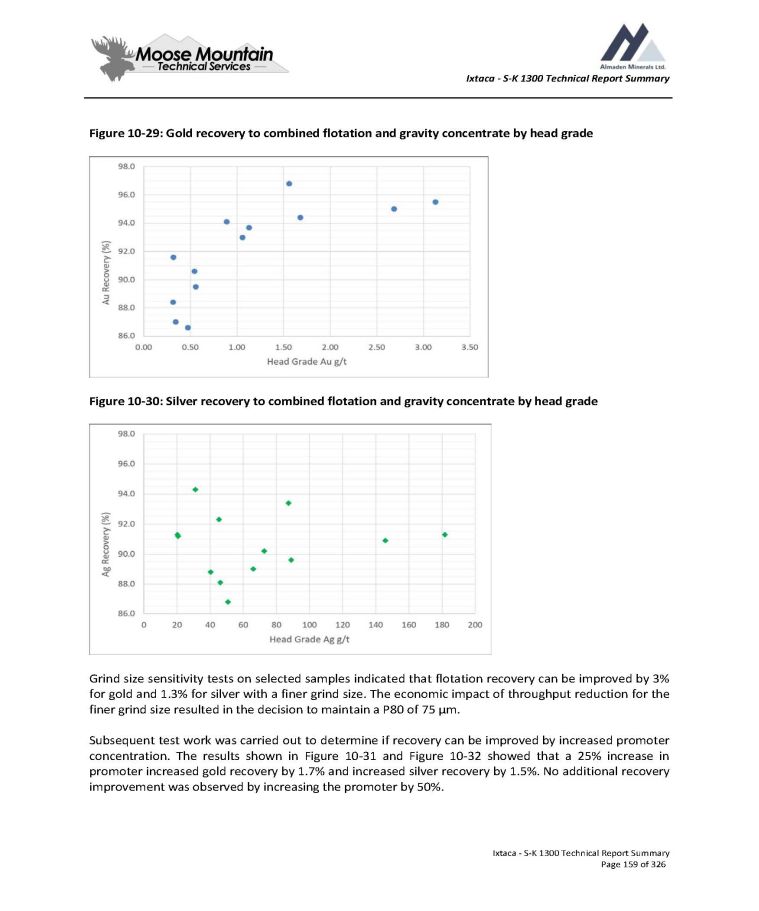
Ixtaca - S - K 1300 Technical Report Summary Figure 10 - 29: Gold recovery to combined flotation and gravity concentrate by head grade Figure 10 - 30: Silver recovery to combined flotation and gravity concentrate by head grade Grind size sensitivity tests on selected samples indicated that flotation recovery can be improved by 3 % for gold and 1 . 3 % for silver with a finer grind size . The economic impact of throughput reduction for the finer grind size resulted in the decision to maintain a P 80 of 75 µm . Subsequent test work was carried out to determine if recovery can be improved by increased promoter concentration . The results shown in Figure 10 - 31 and Figure 10 - 32 showed that a 25 % increase in promoter increased gold recovery by 1 . 7 % and increased silver recovery by 1 . 5 % . No additional recovery improvement was observed by increasing the promoter by 50 % . Ixtaca - S - K 1300 Technical Report Summary Page 159 of 326
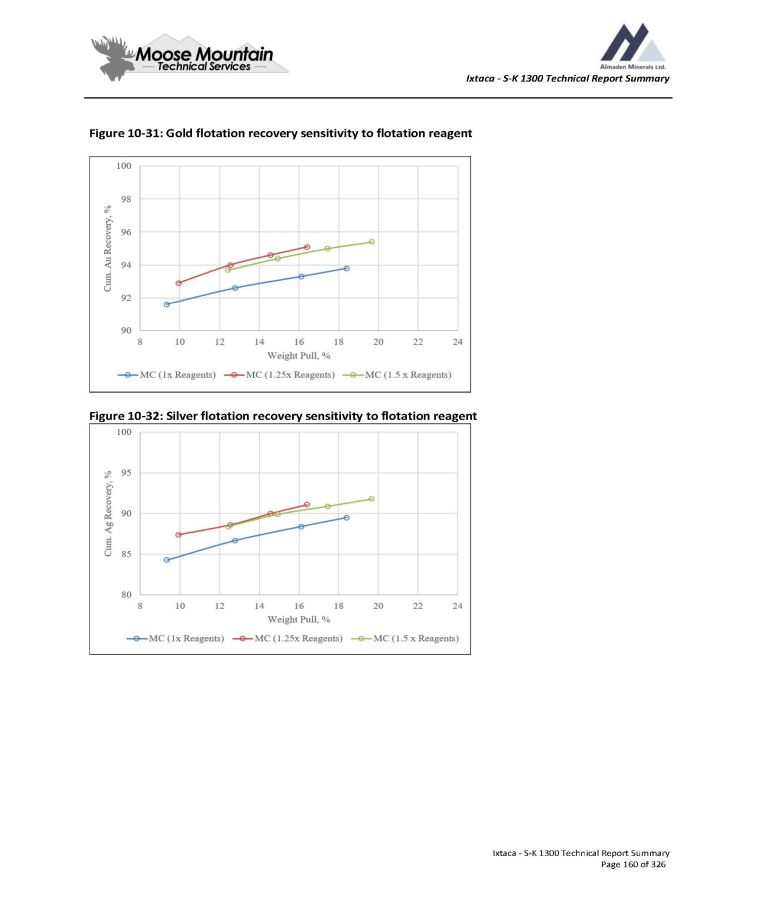
Ixtaca - S - K 1300 Technical Report Summary Figure 10 - 31: Gold flotation recovery sensitivity to flotation reagent Figure 10 - 32: Silver flotation recovery sensitivity to flotation reagent Ixtaca - S - K 1300 Technical Report Summary Page 160 of 326
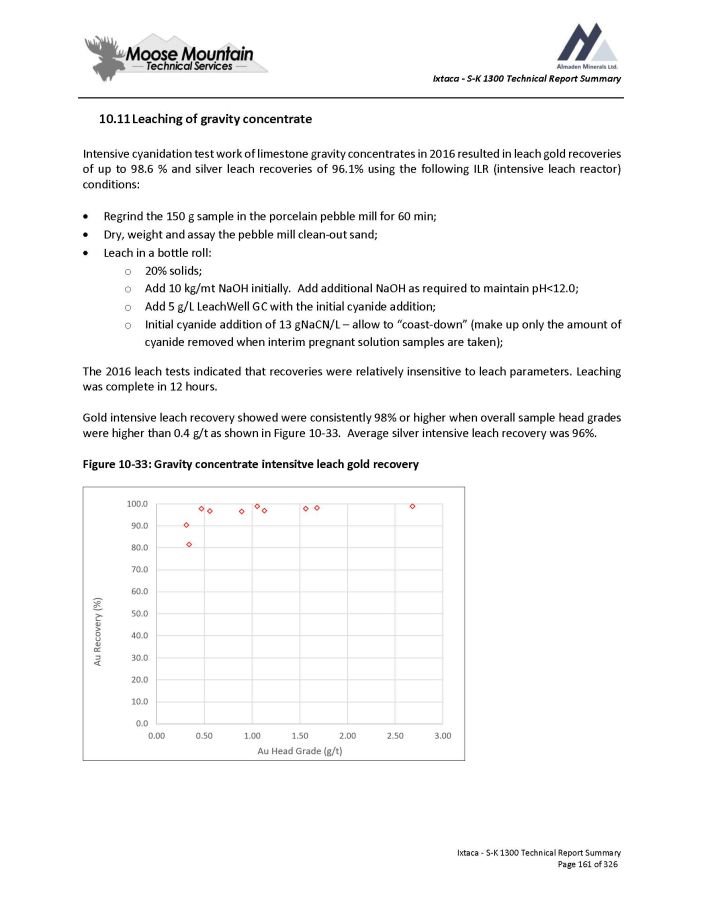
Ixtaca - S - K 1300 Technical Report Summary 10.11 Leaching of gravity concentrate Intensive cyanidation test work of limestone gravity concentrates in 2016 resulted in leach gold recoveries of up to 98 . 6 % and silver leach recoveries of 96 . 1 % using the following ILR (intensive leach reactor) conditions : Regrind the 150 g sample in the porcelain pebble mill for 60 min; Dry, weight and assay the pebble mill clean - out sand; Leach in a bottle roll: o 20% solids; o Add 10 kg/mt NaOH initially. Add additional NaOH as required to maintain pH<12.0; o Add 5 g/L LeachWell GC with the initial cyanide addition; o Initial cyanide addition of 13 gNaCN/L – allow to “coast - down” (make up only the amount of cyanide removed when interim pregnant solution samples are taken); The 2016 leach tests indicated that recoveries were relatively insensitive to leach parameters . Leaching was complete in 12 hours . Gold intensive leach recovery showed were consistently 98 % or higher when overall sample head grades were higher than 0 . 4 g/t as shown in Figure 10 - 33 . Average silver intensive leach recovery was 96 % . Figure 10 - 33 : Gravity concentrate intensitve leach gold recovery Ixtaca - S - K 1300 Technical Report Summary Page 161 of 326
Ixtaca - S - K 1300 Technical Report Summary 12. Leaching of flotation concentrate 1. Limestone Cyanidation tests were carried out in 2016 on limestone flotation concentrate evaluating: grind size (regrind time); point of addition for lime; carbon in leaching (CIL) vs direct agitated leaching (CN); slurry pre - treatment with air sparging; calcium peroxide; solids concentration; sodium cyanide concentration; Optimized agitated leach test work conditions were as follows: 30 min regrind time 4 kg/mt Lime added during regrinding 33% solids (not optimized during earlier testing) pH 11.0 with lime 8 g NaCN/L, maintained during first 12 hrs leaching, then allowed to coast - down 96 hour leach cycle Leaching stage recovery of gold reached values up to 88 . 8 % and silver reached up to 97 . 2 % with cyanide consumption less than 1 kg/tonne ore . Cyanide consumption was found to be sensitive to lime addition during the regrind stage before leaching was initiated . Agitated leach kinetics work in showed that gold leaching was complete with 24 hours, but silver leaching requires up to 72 hours for leaching to complete (See Figure 10 - 34 and Figure 10 - 35 ) . Ixtaca - S - K 1300 Technical Report Summary Page 162 of 326
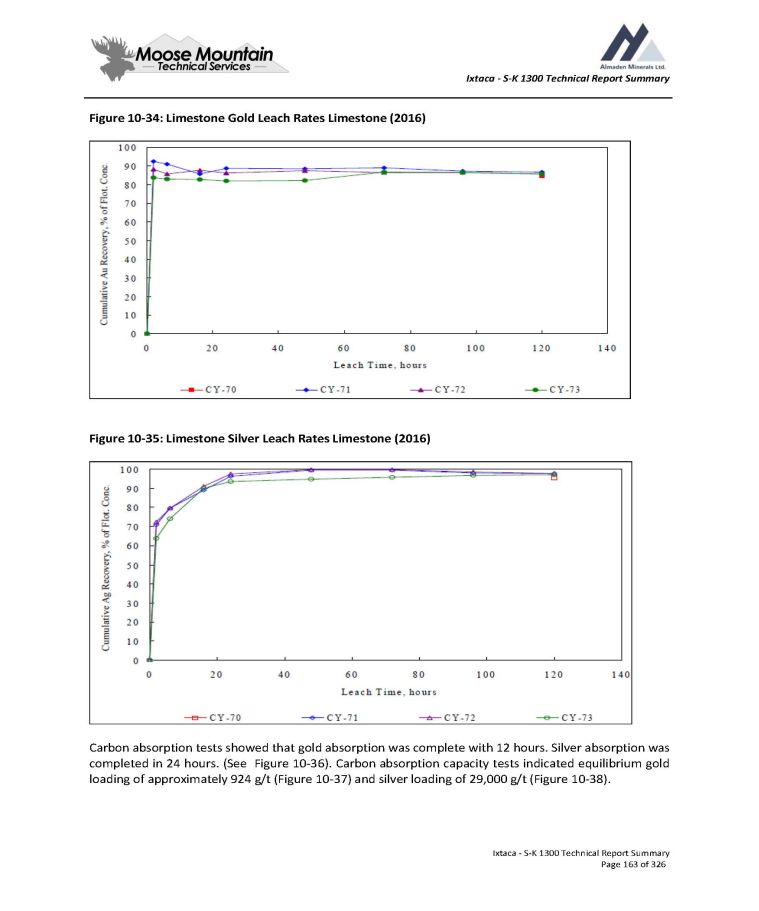
Ixtaca - S - K 1300 Technical Report Summary Figure 10 - 34: Limestone Gold Leach Rates Limestone (2016) Figure 10 - 35: Limestone Silver Leach Rates Limestone (2016) Carbon absorption tests showed that gold absorption was complete with 12 hours . Silver absorption was completed in 24 hours . (See Figure 10 - 36 ) . Carbon absorption capacity tests indicated equilibrium gold loading of approximately 924 g/t ( Figure 10 - 37 ) and silver loading of 29 , 000 g/t ( Figure 10 - 38 ) . Ixtaca - S - K 1300 Technical Report Summary Page 163 of 326
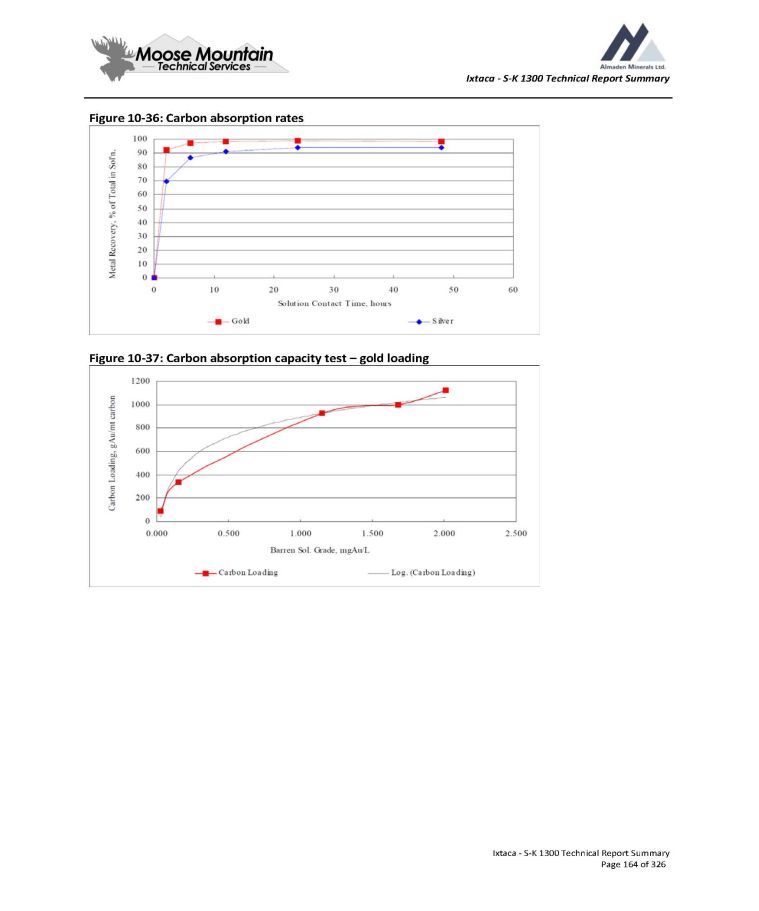
Ixtaca - S - K 1300 Technical Report Summary Figure 10 - 36: Carbon absorption rates Figure 10 - 37: Carbon absorption capacity test – gold loading Ixtaca - S - K 1300 Technical Report Summary Page 164 of 326
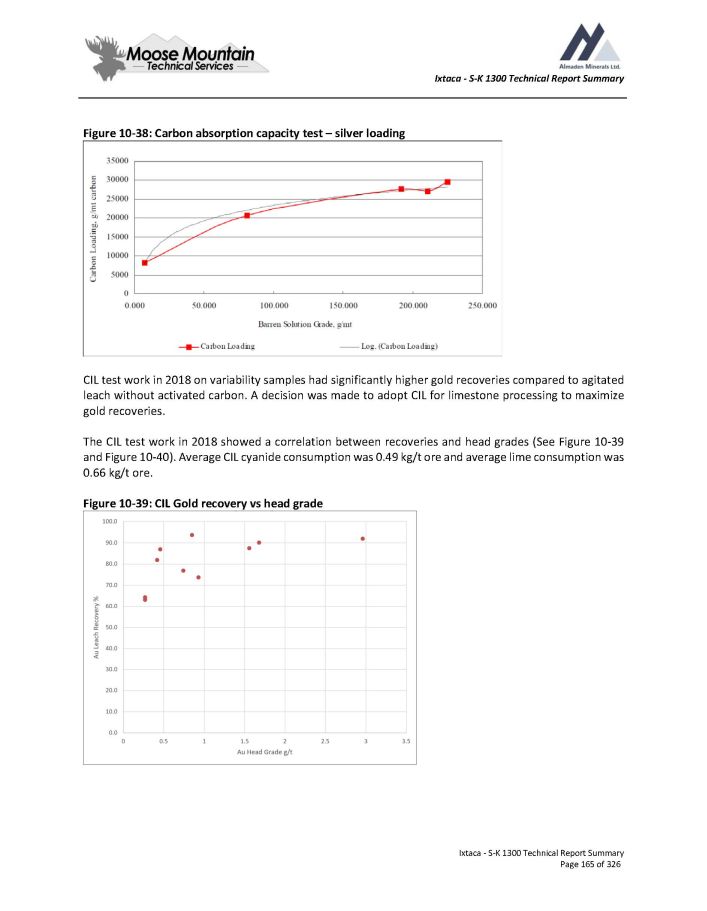
Ixtaca - S - K 1300 Technical Report Summary Figure 10 - 38: Carbon absorption capacity test – silver loading CIL test work in 2018 on variability samples had significantly higher gold recoveries compared to agitated leach without activated carbon . A decision was made to adopt CIL for limestone processing to maximize gold recoveries . The CIL test work in 2018 showed a correlation between recoveries and head grades (See Figure 10 - 39 and Figure 10 - 40 ) . Average CIL cyanide consumption was 0 . 49 kg/t ore and average lime consumption was 0.66 kg/t ore. Figure 10 - 39 : CIL Gold recovery vs head grade Ixtaca - S - K 1300 Technical Report Summary Page 165 of 326
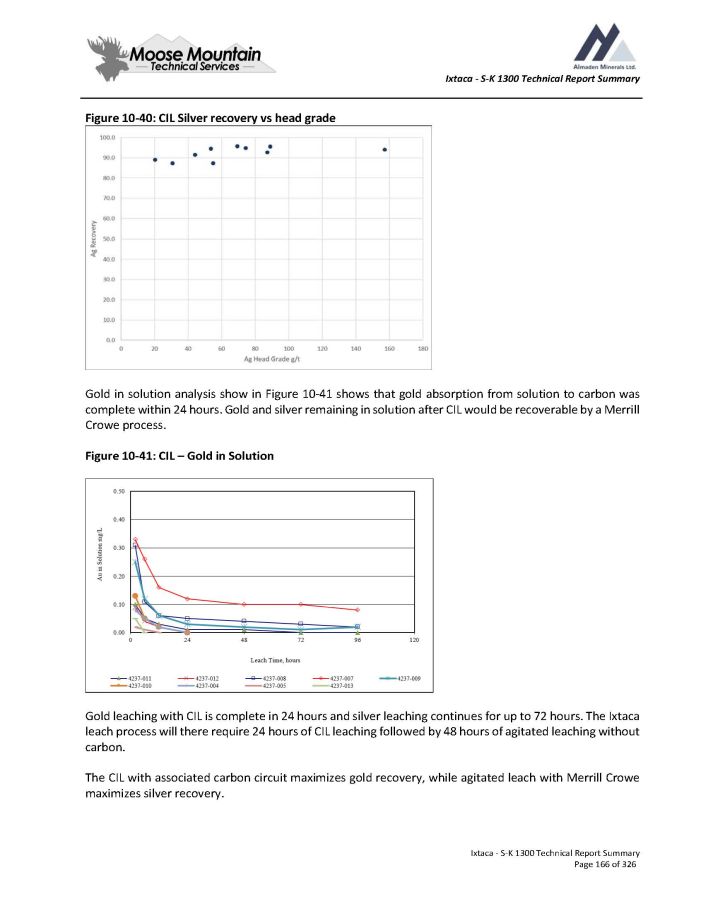
Ixtaca - S - K 1300 Technical Report Summary Figure 10 - 40: CIL Silver recovery vs head grade Gold in solution analysis show in Figure 10 - 41 shows that gold absorption from solution to carbon was complete within 24 hours . Gold and silver remaining in solution after CIL would be recoverable by a Merrill Crowe process . Figure 10 - 41 : CIL – Gold in Solution Gold leaching with CIL is complete in 24 hours and silver leaching continues for up to 72 hours . The Ixtaca leach process will there require 24 hours of CIL leaching followed by 48 hours of agitated leaching without carbon . The CIL with associated carbon circuit maximizes gold recovery, while agitated leach with Merrill Crowe maximizes silver recovery . Ixtaca - S - K 1300 Technical Report Summary Page 166 of 326
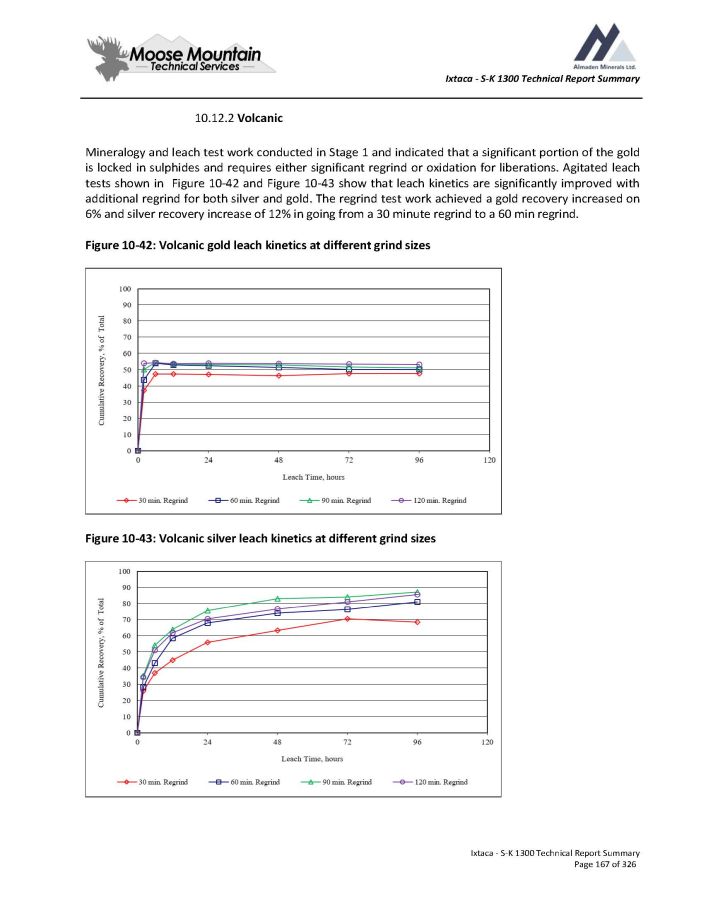
Ixtaca - S - K 1300 Technical Report Summary 10.12.2 Volcanic Mineralogy and leach test work conducted in Stage 1 and indicated that a significant portion of the gold is locked in sulphides and requires either significant regrind or oxidation for liberations . Agitated leach tests shown in Figure 10 - 42 and Figure 10 - 43 show that leach kinetics are significantly improved with additional regrind for both silver and gold . The regrind test work achieved a gold recovery increased on 6 % and silver recovery increase of 12 % in going from a 30 minute regrind to a 60 min regrind . Figure 10 - 42 : Volcanic gold leach kinetics at different grind sizes Figure 10 - 43: Volcanic silver leach kinetics at different grind sizes Ixtaca - S - K 1300 Technical Report Summary Page 167 of 326
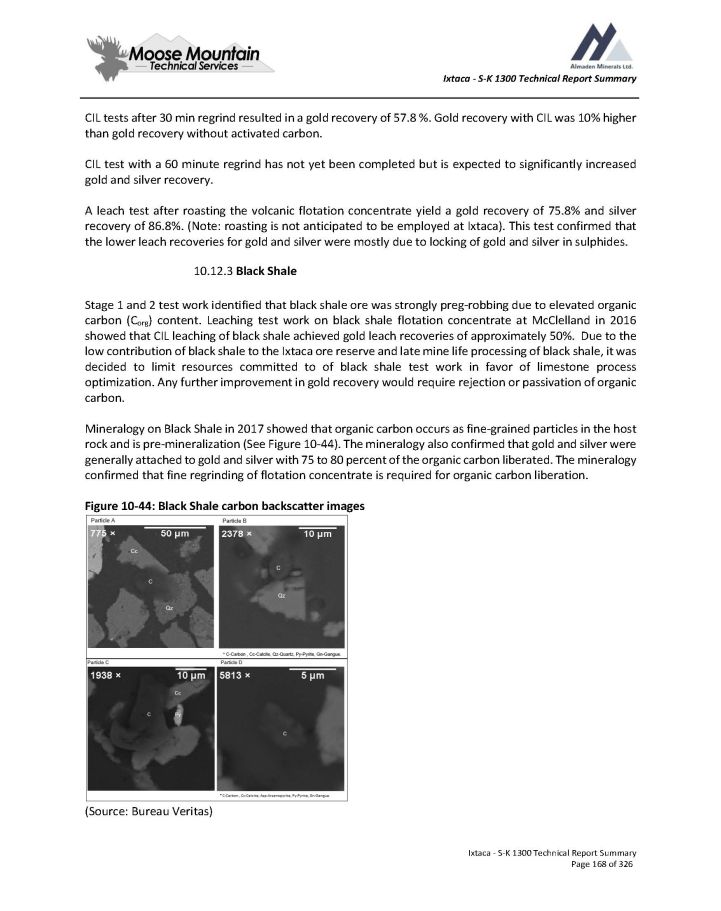
Ixtaca - S - K 1300 Technical Report Summary CIL tests after 30 min regrind resulted in a gold recovery of 57 . 8 % . Gold recovery with CIL was 10 % higher than gold recovery without activated carbon . CIL test with a 60 minute regrind has not yet been completed but is expected to significantly increased gold and silver recovery . A leach test after roasting the volcanic flotation concentrate yield a gold recovery of 75 . 8 % and silver recovery of 86 . 8 % . (Note : roasting is not anticipated to be employed at Ixtaca) . This test confirmed that the lower leach recoveries for gold and silver were mostly due to locking of gold and silver in sulphides . 10.12.3 Black Shale Stage 1 and 2 test work identified that black shale ore was strongly preg - robbing due to elevated organic carbon (C org ) content . Leaching test work on black shale flotation concentrate at McClelland in 2016 showed that CIL leaching of black shale achieved gold leach recoveries of approximately 50 % . Due to the low contribution of black shale to the Ixtaca ore reserve and late mine life processing of black shale, it was decided to limit resources committed to of black shale test work in favor of limestone process optimization . Any further improvement in gold recovery would require rejection or passivation of organic carbon . Mineralogy on Black Shale in 2017 showed that organic carbon occurs as fine - grained particles in the host rock and is pre - mineralization (See Figure 10 - 44 ) . The mineralogy also confirmed that gold and silver were generally attached to gold and silver with 75 to 80 percent of the organic carbon liberated . The mineralogy confirmed that fine regrinding of flotation concentrate is required for organic carbon liberation . Figure 10 - 44 : Black Shale carbon backscatter exh142s (Source: Bureau Veritas) Ixtaca - S - K 1300 Technical Report Summary Page 168 of 326
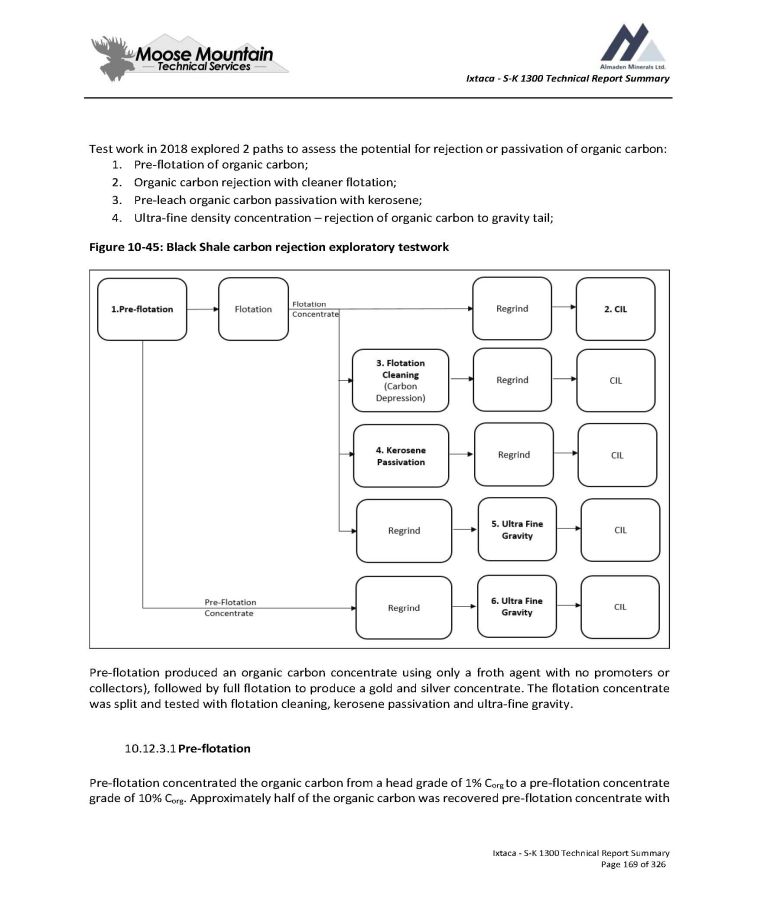
Ixtaca - S - K 1300 Technical Report Summary Test work in 2018 explored 2 paths to assess the potential for rejection or passivation of organic carbon: 1. Pre - flotation of organic carbon; 2. Organic carbon rejection with cleaner flotation; 3. Pre - leach organic carbon passivation with kerosene; 4. Ultra - fine density concentration – rejection of organic carbon to gravity tail; Figure 10 - 45: Black Shale carbon rejection exploratory testwork Pre - flotation produced an organic carbon concentrate using only a froth agent with no promoters or collectors), followed by full flotation to produce a gold and silver concentrate . The flotation concentrate was split and tested with flotation cleaning, kerosene passivation and ultra - fine gravity . 10.12.3.1 Pre - flotation Pre - flotation concentrated the organic carbon from a head grade of 1 % C org to a pre - flotation concentrate grade of 10 % C org . Approximately half of the organic carbon was recovered pre - flotation concentrate with Ixtaca - S - K 1300 Technical Report Summary Page 169 of 326
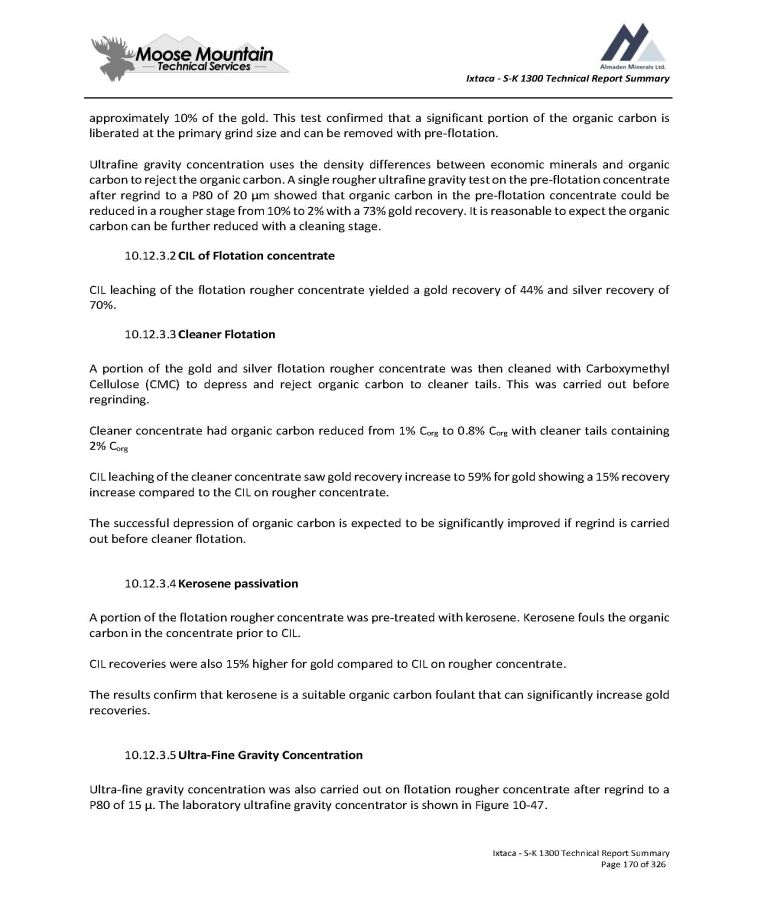
Ixtaca - S - K 1300 Technical Report Summary approximately 10 % of the gold . This test confirmed that a significant portion of the organic carbon is liberated at the primary grind size and can be removed with pre - flotation . Ultrafine gravity concentration uses the density differences between economic minerals and organic carbon to reject the organic carbon . A single rougher ultrafine gravity test on the pre - flotation concentrate after regrind to a P 80 of 20 µm showed that organic carbon in the pre - flotation concentrate could be reduced in a rougher stage from 10 % to 2 % with a 73 % gold recovery . It is reasonable to expect the organic carbon can be further reduced with a cleaning stage . 2. CIL of Flotation concentrate CIL leaching of the flotation rougher concentrate yielded a gold recovery of 44 % and silver recovery of 70 % . 3. Cleaner Flotation A portion of the gold and silver flotation rougher concentrate was then cleaned with Carboxymethyl Cellulose (CMC) to depress and reject organic carbon to cleaner tails . This was carried out before regrinding . Cleaner concentrate had organic carbon reduced from 1 % C org to 0 . 8 % C org with cleaner tails containing 2 % C org CIL leaching of the cleaner concentrate saw gold recovery increase to 59 % for gold showing a 15 % recovery increase compared to the CIL on rougher concentrate . The successful depression of organic carbon is expected to be significantly improved if regrind is carried out before cleaner flotation . 4. Kerosene passivation A portion of the flotation rougher concentrate was pre - treated with kerosene . Kerosene fouls the organic carbon in the concentrate prior to CIL . CIL recoveries were also 15 % higher for gold compared to CIL on rougher concentrate . The results confirm that kerosene is a suitable organic carbon foulant that can significantly increase gold recoveries . 5. Ultra - Fine Gravity Concentration Ultra - fine gravity concentration was also carried out on flotation rougher concentrate after regrind to a P 80 of 15 µ . The laboratory ultrafine gravity concentrator is shown in Figure 10 - 47 . Ixtaca - S - K 1300 Technical Report Summary Page 170 of 326
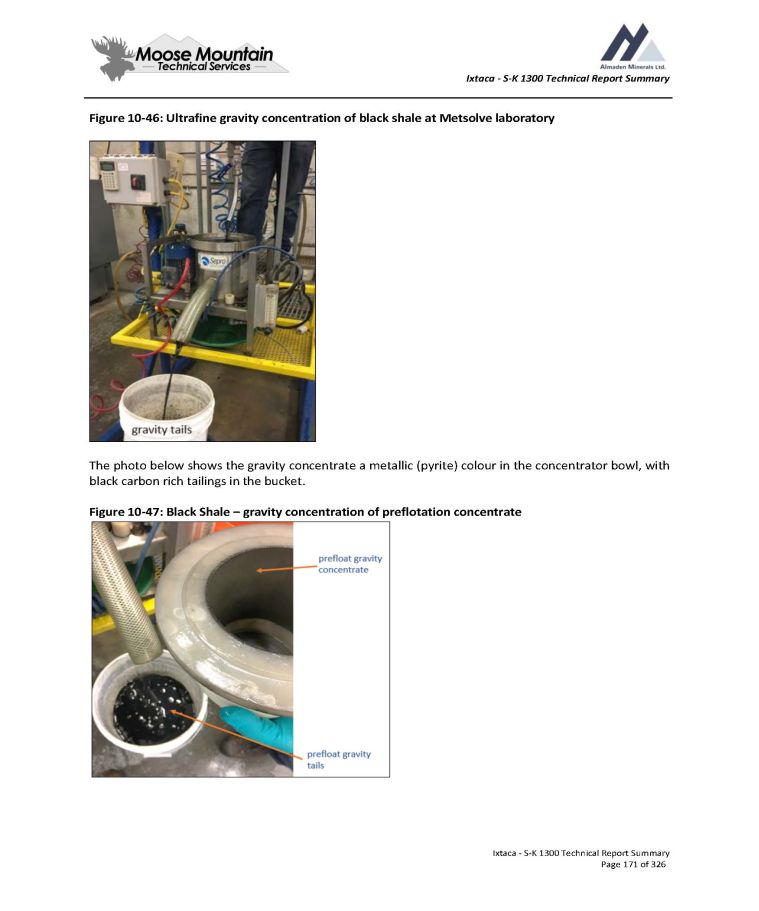
Ixtaca - S - K 1300 Technical Report Summary Figure 10 - 46: Ultrafine gravity concentration of black shale at Metsolve laboratory The photo below shows the gravity concentrate a metallic (pyrite) colour in the concentrator bowl, with black carbon rich tailings in the bucket. Figure 10 - 47: Black Shale – gravity concentration of preflotation concentrate Ixtaca - S - K 1300 Technical Report Summary Page 171 of 326
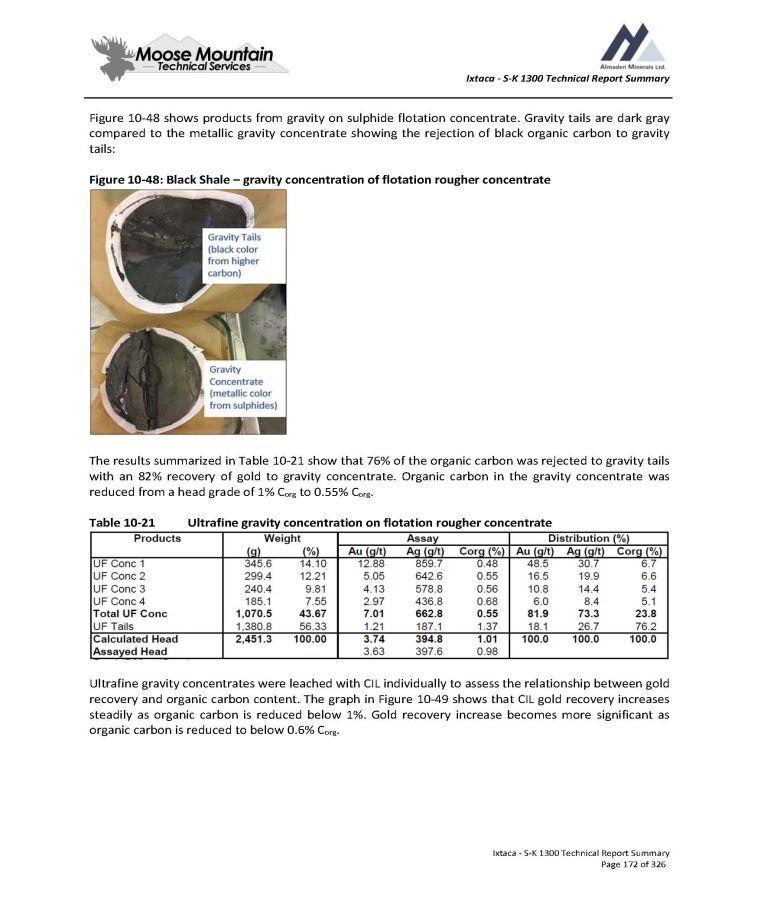
Ixtaca - S - K 1300 Technical Report Summary Figure 10 - 48 shows products from gravity on sulphide flotation concentrate . Gravity tails are dark gray compared to the metallic gravity concentrate showing the rejection of black organic carbon to gravity tails : Figure 10 - 48 : Black Shale – gravity concentration of flotation rougher concentrate The results summarized in Table 10 - 21 show that 76 % of the organic carbon was rejected to gravity tails with an 82 % recovery of gold to gravity concentrate . Organic carbon in the gravity concentrate was reduced from a head grade of 1 % C org to 0 . 55 % C org . Table 10 - 21 Ultrafine gravity concentration on flotation rougher concentrate Ultrafine gravity concentrates were leached with CIL individually to assess the relationship between gold recovery and organic carbon content . The graph in Figure 10 - 49 shows that CIL gold recovery increases steadily as organic carbon is reduced below 1 % . Gold recovery increase becomes more significant as organic carbon is reduced to below 0 . 6 % C org . Ixtaca - S - K 1300 Technical Report Summary Page 172 of 326
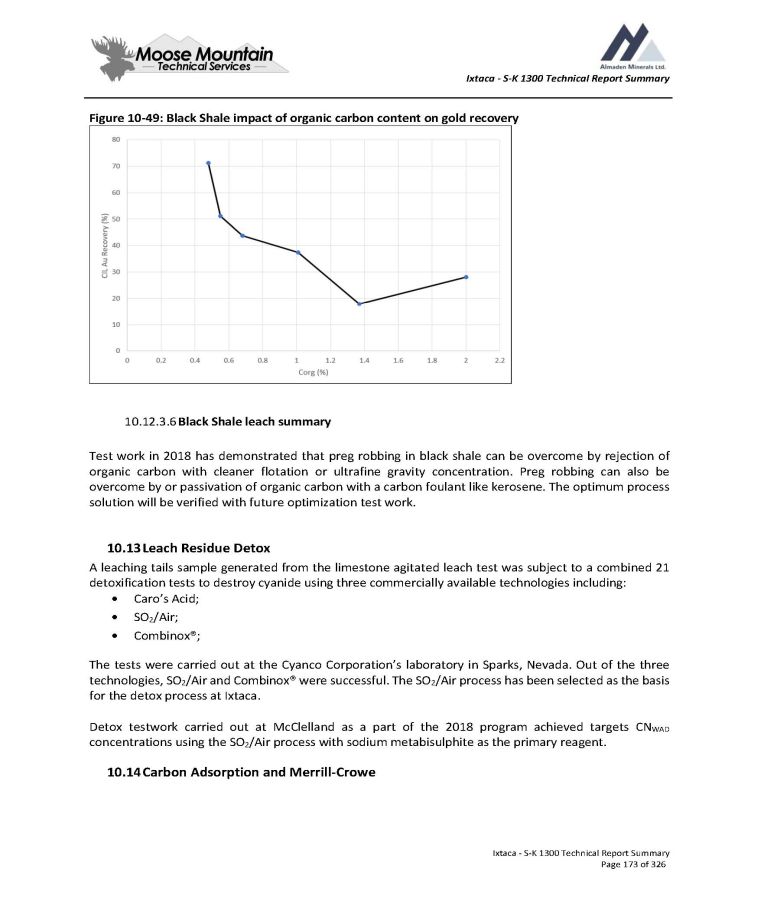
Ixtaca - S - K 1300 Technical Report Summary Figure 10 - 49: Black Shale impact of organic carbon content on gold recovery 10.12.3.6 Black Shale leach summary Test work in 2018 has demonstrated that preg robbing in black shale can be overcome by rejection of organic carbon with cleaner flotation or ultrafine gravity concentration . Preg robbing can also be overcome by or passivation of organic carbon with a carbon foulant like kerosene . The optimum process solution will be verified with future optimization test work . 10.13 Leach Residue Detox A leaching tails sample generated from the limestone agitated leach test was subject to a combined 21 detoxification tests to destroy cyanide using three commercially available technologies including : Caro’s Acid; SO 2 /Air; Combinox®; The tests were carried out at the Cyanco Corporation’s laboratory in Sparks, Nevada . Out of the three technologies, SO 2 /Air and Combinox® were successful . The SO 2 /Air process has been selected as the basis for the detox process at Ixtaca . Detox testwork carried out at McClelland as a part of the 2018 program achieved targets CN WAD concentrations using the SO 2 /Air process with sodium metabisulphite as the primary reagent . 10.14 Carbon Adsorption and Merrill - Crowe Ixtaca - S - K 1300 Technical Report Summary Page 173 of 326
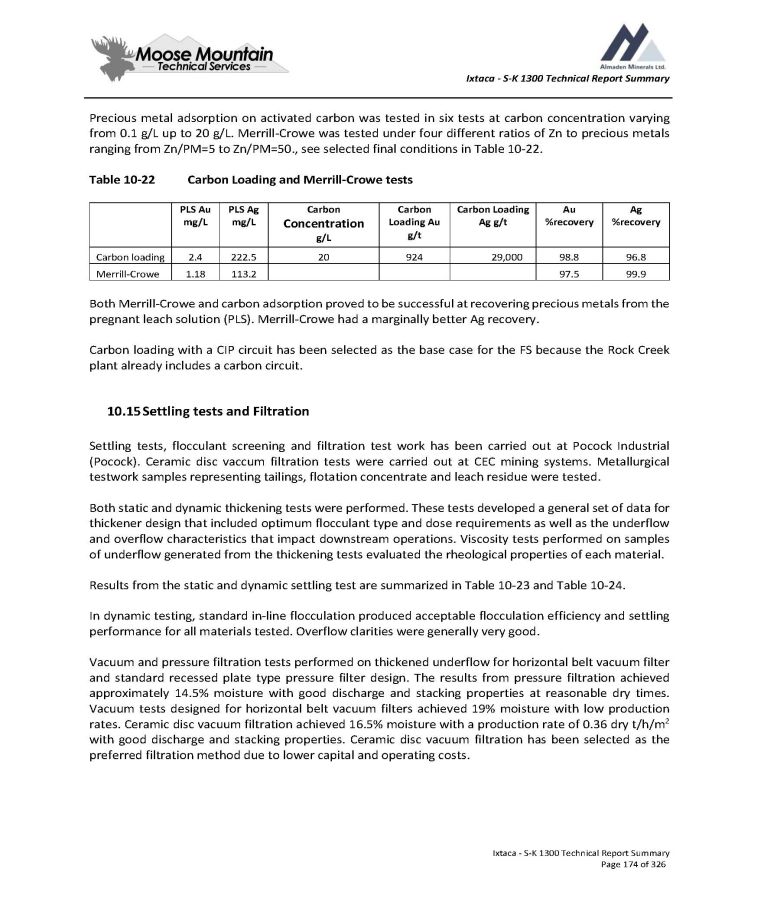
Ixtaca - S - K 1300 Technical Report Summary Precious metal adsorption on activated carbon was tested in six tests at carbon concentration varying from 0 . 1 g/L up to 20 g/L . Merrill - Crowe was tested under four different ratios of Zn to precious metals ranging from Zn/PM= 5 to Zn/PM= 50 . , see selected final conditions in Table 10 - 22 . Table 10 - 22 Carbon Loading and Merrill - Crowe tests Ixtaca - S - K 1300 Technical Report Summary Page 174 of 326 Ag %recovery Au %recovery Carbon Loading Ag g/t Carbon Loading Au g/t Carbon Concentration g/L PLS Ag mg/L PLS Au mg/L 96.8 98.8 29,000 924 20 222.5 2.4 Carbon loading 99.9 97.5 113.2 1.18 Merrill - Crowe Both Merrill - Crowe and carbon adsorption proved to be successful at recovering precious metals from the pregnant leach solution (PLS) . Merrill - Crowe had a marginally better Ag recovery . Carbon loading with a CIP circuit has been selected as the base case for the FS because the Rock Creek plant already includes a carbon circuit . 10.15 Settling tests and Filtration Settling tests, flocculant screening and filtration test work has been carried out at Pocock Industrial (Pocock) . Ceramic disc vaccum filtration tests were carried out at CEC mining systems . Metallurgical testwork samples representing tailings, flotation concentrate and leach residue were tested . Both static and dynamic thickening tests were performed . These tests developed a general set of data for thickener design that included optimum flocculant type and dose requirements as well as the underflow and overflow characteristics that impact downstream operations . Viscosity tests performed on samples of underflow generated from the thickening tests evaluated the rheological properties of each material . Results from the static and dynamic settling test are summarized in Table 10 - 23 and Table 10 - 24 . In dynamic testing, standard in - line flocculation produced acceptable flocculation efficiency and settling performance for all materials tested . Overflow clarities were generally very good . Vacuum and pressure filtration tests performed on thickened underflow for horizontal belt vacuum filter and standard recessed plate type pressure filter design . The results from pressure filtration achieved approximately 14 . 5 % moisture with good discharge and stacking properties at reasonable dry times . Vacuum tests designed for horizontal belt vacuum filters achieved 19 % moisture with low production rates . Ceramic disc vacuum filtration achieved 16 . 5 % moisture with a production rate of 0 . 36 dry t/h/m 2 with good discharge and stacking properties . Ceramic disc vacuum filtration has been selected as the preferred filtration method due to lower capital and operating costs .
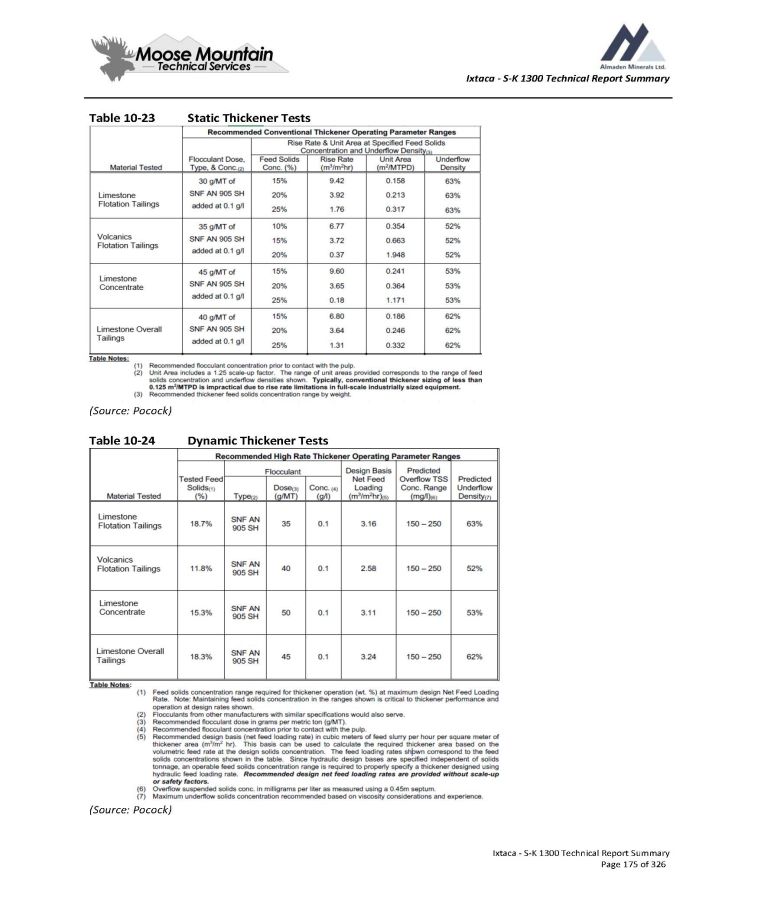
Ixtaca - S - K 1300 Technical Report Summary Table 10 - 23 Static Thickener Tests (Source: Pocock) Table 10 - 24 Dynamic Thickener Tests (Source: Pocock) Ixtaca - S - K 1300 Technical Report Summary Page 175 of 326
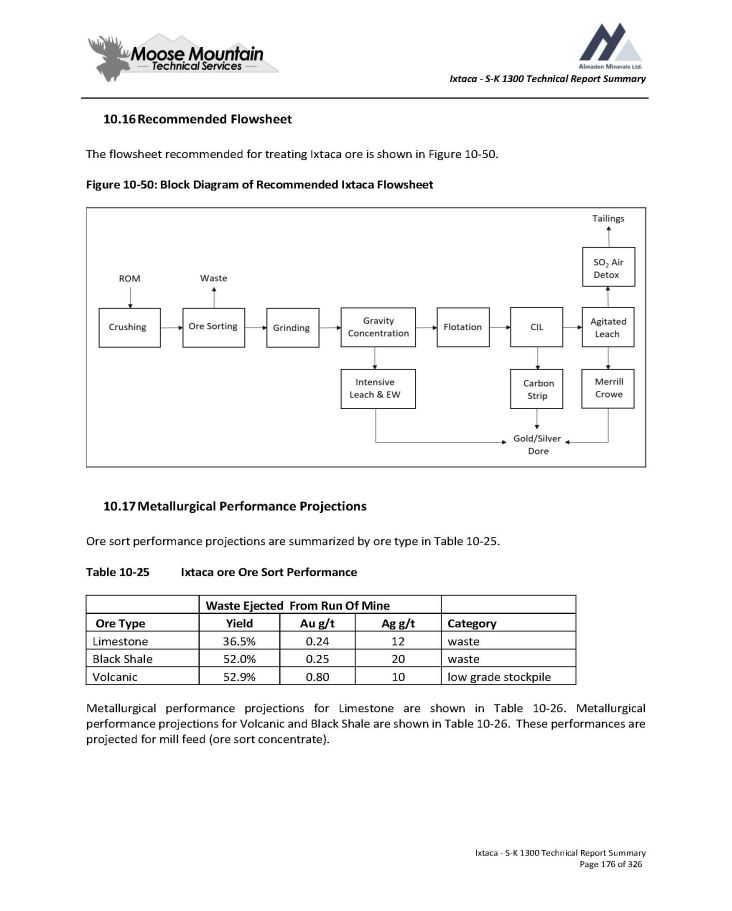
Ixtaca - S - K 1300 Technical Report Summary 10.16 Recommended Flowsheet The flowsheet recommended for treating Ixtaca ore is shown in Figure 10 - 50. Figure 10 - 50: Block Diagram of Recommended Ixtaca Flowsheet 10.17 Metallurgical Performance Projections Ore sort performance projections are summarized by ore type in Table 10 - 25. Table 10 - 25 Ixtaca ore Ore Sort Performance Waste Ejected From Run Of Mine Category Ag g/t Au g/t Yield Ore Type waste 12 0.24 36.5% Limestone waste 20 0.25 52.0% Black Shale low grade stockpile 10 0.80 52.9% Volcanic Metallurgical performance projections for Limestone are shown in Table 10 - 26 . Metallurgical performance projections for Volcanic and Black Shale are shown in Table 10 - 26 . These performances are projected for mill feed (ore sort concentrate) . Ixtaca - S - K 1300 Technical Report Summary Page 176 of 326
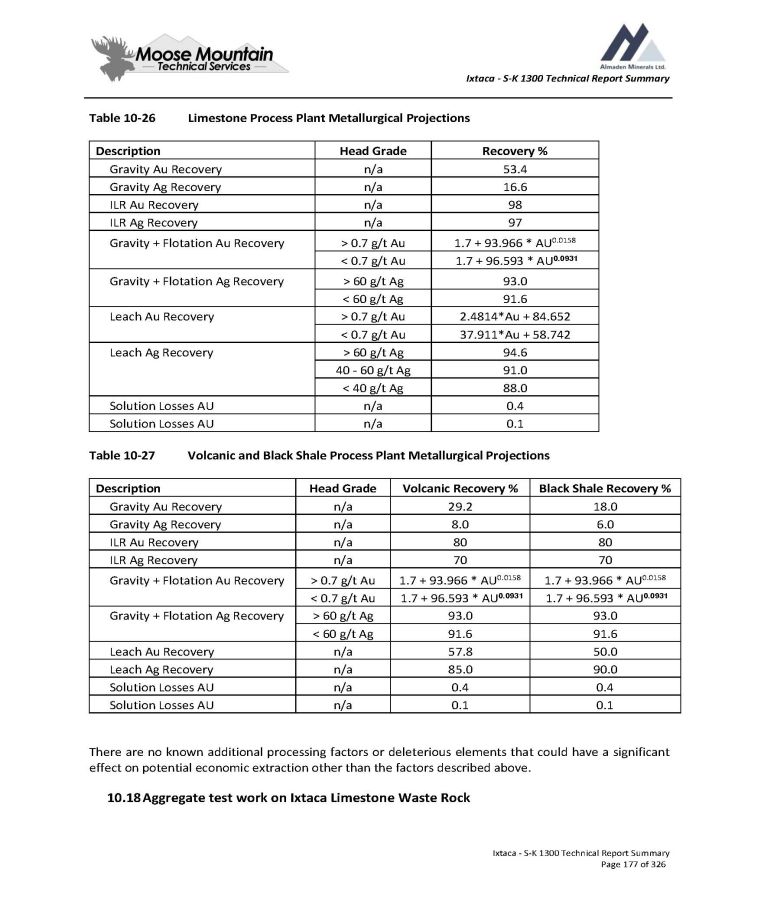
Ixtaca - S - K 1300 Technical Report Summary Table 10 - 26 Ixtaca - S - K 1300 Technical Report Summary Page 177 of 326 Limestone Process Plant Metallurgical Projections Recovery % Head Grade Description 53.4 n/a Gravity Au Recovery 16.6 n/a Gravity Ag Recovery 98 n/a ILR Au Recovery 97 n/a ILR Ag Recovery 1.7 + 93.966 * AU 0.0158 > 0.7 g/t Au Gravity + Flotation Au Recovery 1.7 + 96.593 * AU 0.0931 < 0.7 g/t Au 93.0 > 60 g/t Ag Gravity + Flotation Ag Recovery 91.6 < 60 g/t Ag 2.4814*Au + 84.652 > 0.7 g/t Au Leach Au Recovery 37.911*Au + 58.742 < 0.7 g/t Au 94.6 > 60 g/t Ag Leach Ag Recovery 91.0 40 - 60 g/t Ag 88.0 < 40 g/t Ag 0.4 n/a Solution Losses AU 0.1 n/a Solution Losses AU Table 10 - 27 Volcanic and Black Shale Process Plant Metallurgical Projections Black Shale Recovery % Volcanic Recovery % Head Grade Description 18.0 29.2 n/a Gravity Au Recovery 6.0 8.0 n/a Gravity Ag Recovery 80 80 n/a ILR Au Recovery 70 70 n/a ILR Ag Recovery 1.7 + 93.966 * AU 0.0158 1.7 + 93.966 * AU 0.0158 > 0.7 g/t Au Gravity + Flotation Au Recovery 1.7 + 96.593 * AU 0.0931 1.7 + 96.593 * AU 0.0931 < 0.7 g/t Au 93.0 93.0 > 60 g/t Ag Gravity + Flotation Ag Recovery 91.6 91.6 < 60 g/t Ag 50.0 57.8 n/a Leach Au Recovery 90.0 85.0 n/a Leach Ag Recovery 0.4 0.4 n/a Solution Losses AU 0.1 0.1 n/a Solution Losses AU There are no known additional processing factors or deleterious elements that could have a significant effect on potential economic extraction other than the factors described above. 10.18 Aggregate test work on Ixtaca Limestone Waste Rock
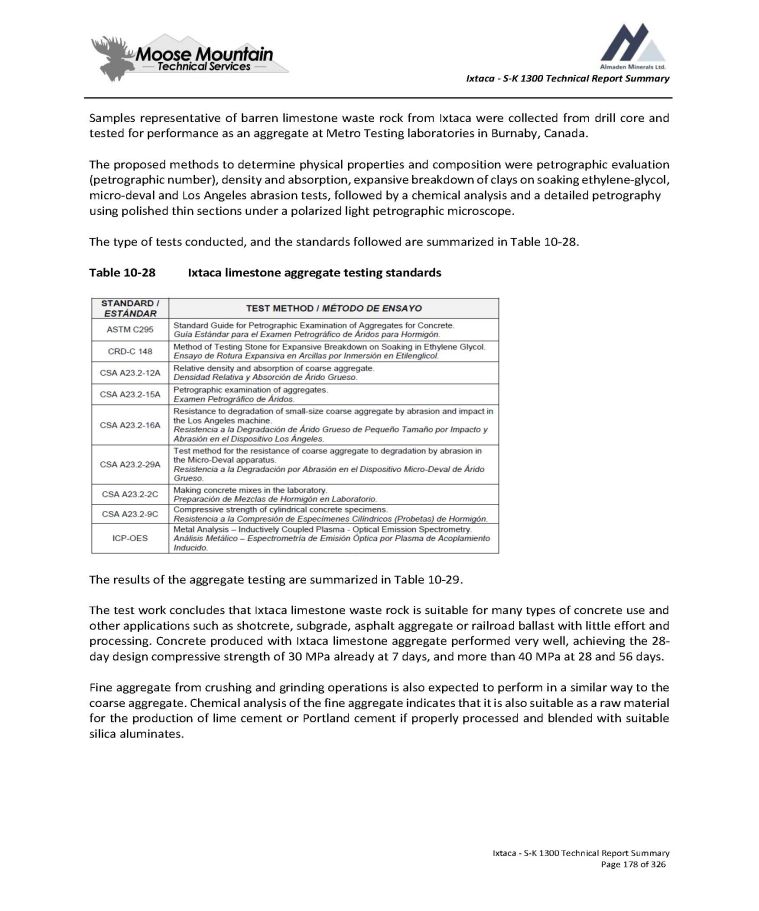
Ixtaca - S - K 1300 Technical Report Summary Samples representative of barren limestone waste rock from Ixtaca were collected from drill core and tested for performance as an aggregate at Metro Testing laboratories in Burnaby, Canada. The proposed methods to determine physical properties and composition were petrographic evaluation (petrographic number), density and absorption, expansive breakdown of clays on soaking ethylene - glycol, micro - deval and Los Angeles abrasion tests, followed by a chemical analysis and a detailed petrography using polished thin sections under a polarized light petrographic microscope. The type of tests conducted, and the standards followed are summarized in Table 10 - 28. Table 10 - 28 Ixtaca limestone aggregate testing standards The results of the aggregate testing are summarized in Table 10 - 29 . The test work concludes that Ixtaca limestone waste rock is suitable for many types of concrete use and other applications such as shotcrete, subgrade, asphalt aggregate or railroad ballast with little effort and processing . Concrete produced with Ixtaca limestone aggregate performed very well, achieving the 28 - day design compressive strength of 30 MPa already at 7 days, and more than 40 MPa at 28 and 56 days . Fine aggregate from crushing and grinding operations is also expected to perform in a similar way to the coarse aggregate . Chemical analysis of the fine aggregate indicates that it is also suitable as a raw material for the production of lime cement or Portland cement if properly processed and blended with suitable silica aluminates . Ixtaca - S - K 1300 Technical Report Summary Page 178 of 326
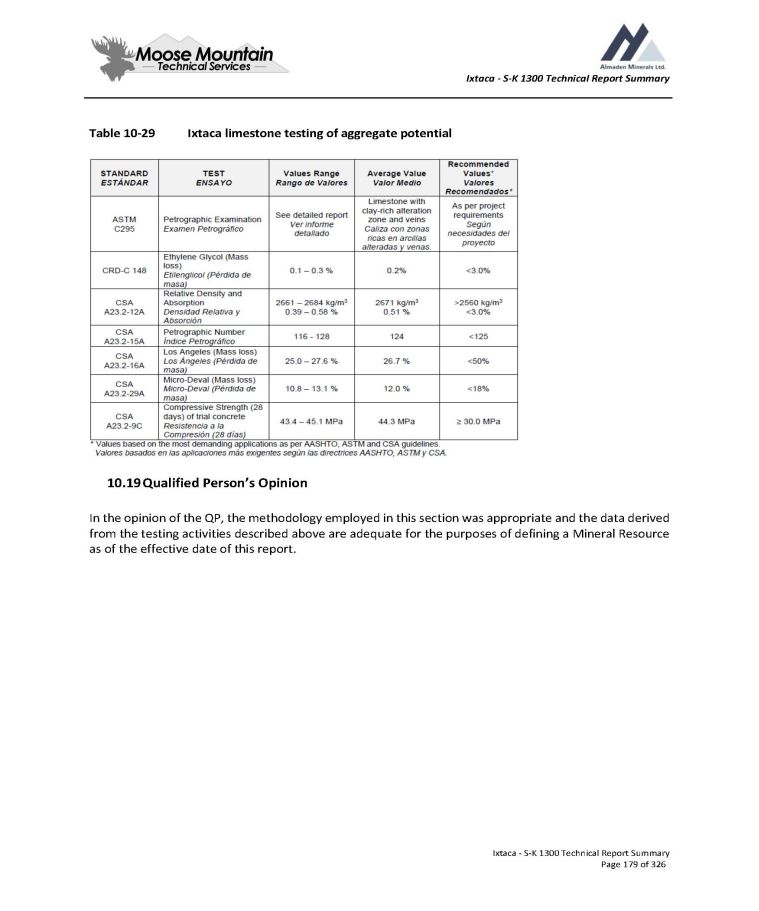
Ixtaca - S - K 1300 Technical Report Summary Table 10 - 29 Ixtaca limestone testing of aggregate potential 10.19 Qualified Person’s Opinion In the opinion of the QP, the methodology employed in this section was appropriate and the data derived from the testing activities described above are adequate for the purposes of defining a Mineral Resource as of the effective date of this report . Ixtaca - S - K 1300 Technical Report Summary Page 179 of 326
Ixtaca - S - K 1300 Technical Report Summary 11.0 Mineral Resource Estimates The information in this section was drawn from the most recent major study prepared entitled “The Ixtaca Gold - Silver Project Puebla State, Mexico NI 43 - 101 Technical Report on the Feasibility Study” dated January 24 th 2019 and updated October 3 , 2019 . 11 . 1 Data Analysis Almaden has supplied a total of 649 drillholes with 7 , 655 down hole surveys and 139 , 041 assays for gold and silver . Of these drillholes, 558 totalling 180 , 697 m outline the Ixtaca Main zone and NE Extension which are estimated in this resource . All drillholes are included in Appendix A with the holes intersecting the various mineralized solids highlighted . A total of 378 gaps were found in the from – to record . These gaps are explained as follows : Often the drillers need to tricone the tops of the holes (particularly those collared in volcanics which a lot of them are) until they get to more stable rock and set in casing . That’s why there are gaps often at the tops of holes because no core samples could be collected . In 2011 the geologist who was logging took recovery very seriously. So if there was 10cm missing in the run he shortened the assay interval creating 10 - 30cm gaps. Lots of the geotechnical holes (GT) have sample gaps because samples could not be assayed where whole core geotechnical samples were collected. In earlier holes there are often 10m gaps to save on assaying costs. Also, there are large sample gaps in the exploration holes outside the immediate area to save on assaying costs. No recovery Some MET tests required whole core that could not be assayed (ie samples used for Ore Sorting). Approximately 20m of samples from holes GMET - 17 - 01 and 02A have been removed from the database due to a lab prep issue. These are the only samples that have ever been removed from the database. Almaden also supplied a series of geologic solids for the Ixtaca Zone, which outlined the following mineralized domains : Ixtaca - S - K 1300 Technical Report Summary Page 180 of 326 Description Code A clay altered tuff overlying the mineralized carbonate rocks ASH The Main Ixtaca High Grade Mineralized Zone comprised of varying density of carbonate - quartz epithermal veining MHG The North Limb High Grade Mineralized Zone NHG A North east trending extension of High Grade carbonate - quartz epithermal veining NEHG A lower grade envelope around the Main High Grade Zone MLG A lower grade envelope around the North Limb High Grade Zone NLG A lower grade envelope around the Eastern North East High Grade Zone NELG All material between and outside of the 7 mineralized zones Waste
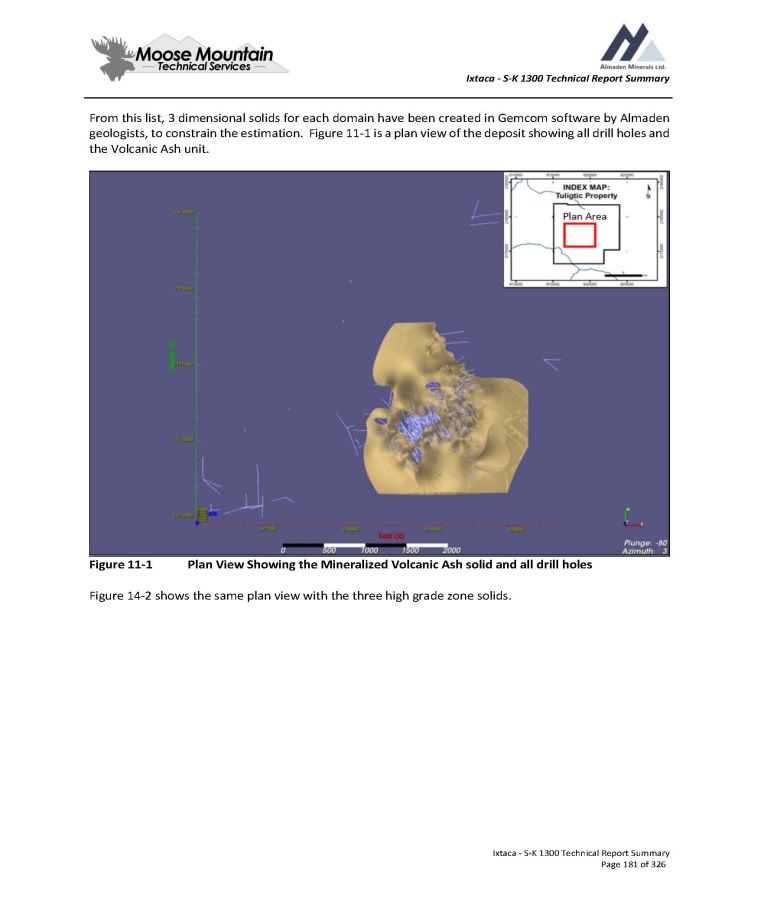
Ixtaca - S - K 1300 Technical Report Summary From this list, 3 dimensional solids for each domain have been created in Gemcom software by Almaden geologists, to constrain the estimation . Figure 11 - 1 is a plan view of the deposit showing all drill holes and the Volcanic Ash unit . Figure 11 - 1 Plan View Showing the Mineralized Volcanic Ash solid and all drill holes Figure 14 - 2 shows the same plan view with the three high grade zone solids. Ixtaca - S - K 1300 Technical Report Summary Page 181 of 326
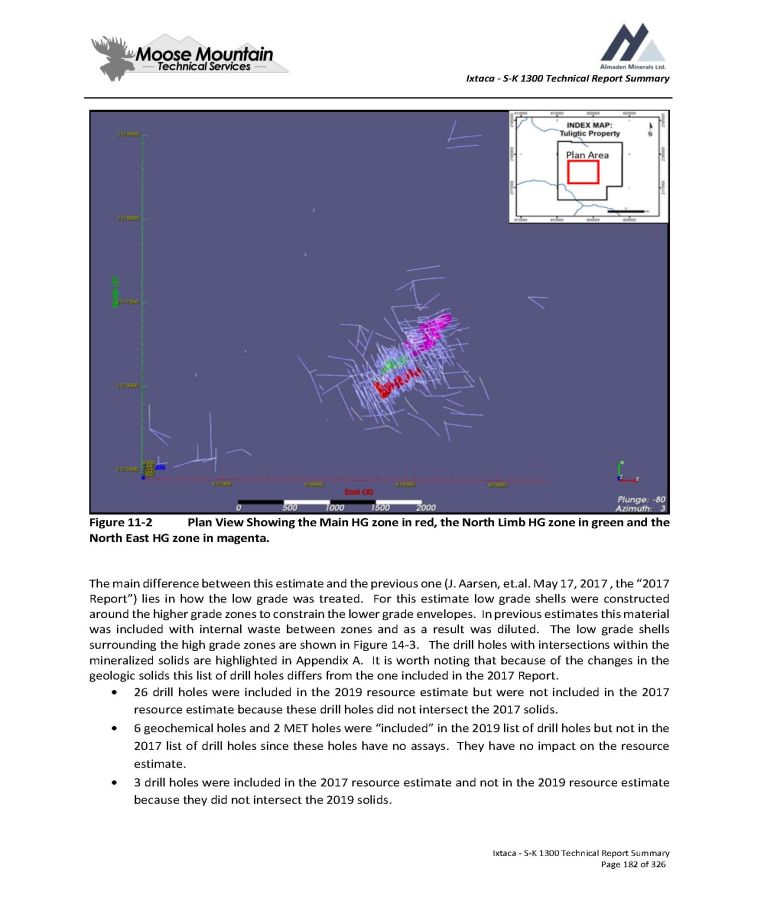
Ixtaca - S - K 1300 Technical Report Summary Figure 11 - 2 Plan View Showing the Main HG zone in red, the North Limb HG zone in green and the North East HG zone in magenta . The main difference between this estimate and the previous one (J . Aarsen, et . al . May 17 , 2017 , the “ 2017 Report”) lies in how the low grade was treated . For this estimate low grade shells were constructed around the higher grade zones to constrain the lower grade envelopes . In previous estimates this material was included with internal waste between zones and as a result was diluted . The low grade shells surrounding the high grade zones are shown in Figure 14 - 3 . The drill holes with intersections within the mineralized solids are highlighted in Appendix A . It is worth noting that because of the changes in the geologic solids this list of drill holes differs from the one included in the 2017 Report . 26 drill holes were included in the 2019 resource estimate but were not included in the 2017 resource estimate because these drill holes did not intersect the 2017 solids . 6 geochemical holes and 2 MET holes were “included” in the 2019 list of drill holes but not in the 2017 list of drill holes since these holes have no assays . They have no impact on the resource estimate . 3 drill holes were included in the 2017 resource estimate and not in the 2019 resource estimate because they did not intersect the 2019 solids . Ixtaca - S - K 1300 Technical Report Summary Page 182 of 326
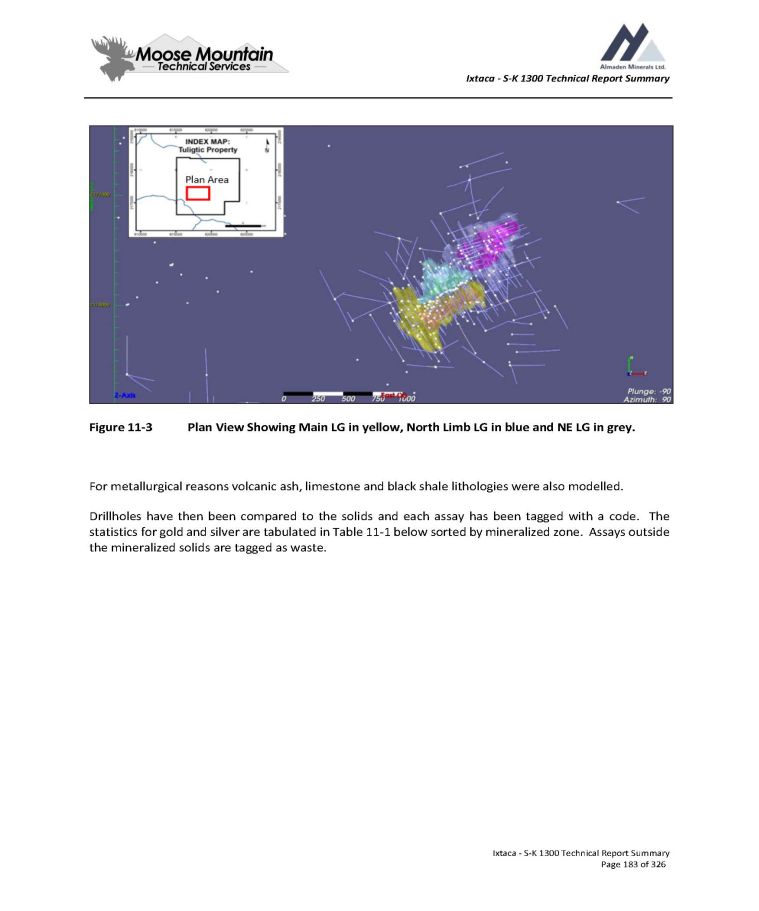
Ixtaca - S - K 1300 Technical Report Summary Figure 11 - 3 Plan View Showing Main LG in yellow, North Limb LG in blue and NE LG in grey. For metallurgical reasons volcanic ash, limestone and black shale lithologies were also modelled . Drillholes have then been compared to the solids and each assay has been tagged with a code . The statistics for gold and silver are tabulated in Table 11 - 1 below sorted by mineralized zone . Assays outside the mineralized solids are tagged as waste . Ixtaca - S - K 1300 Technical Report Summary Page 183 of 326
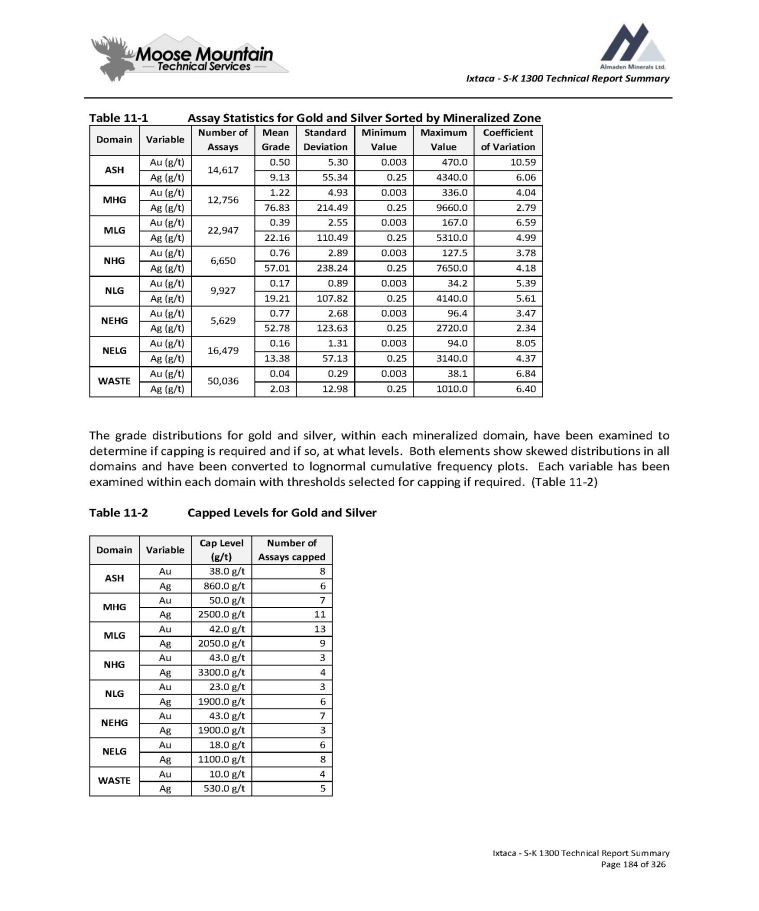
Ixtaca - S - K 1300 Technical Report Summary Table 11 - 1 Ixtaca - S - K 1300 Technical Report Summary Page 184 of 326 Assay Statistics for Gold and Silver Sorted by Mineralized Zone Coefficient of Variation Maximum Value Minimum Value Standard Deviation Mean Grade Number of Assays Variable Domain 10.59 470.0 0.003 5.30 0.50 14,617 Au (g/t) ASH 6.06 4340.0 0.25 55.34 9.13 Ag (g/t) 4.04 336.0 0.003 4.93 1.22 12,756 Au (g/t) MHG 2.79 9660.0 0.25 214.49 76.83 Ag (g/t) 6.59 167.0 0.003 2.55 0.39 22,947 Au (g/t) MLG 4.99 5310.0 0.25 110.49 22.16 Ag (g/t) 3.78 127.5 0.003 2.89 0.76 6,650 Au (g/t) NHG 4.18 7650.0 0.25 238.24 57.01 Ag (g/t) 5.39 34.2 0.003 0.89 0.17 9,927 Au (g/t) NLG 5.61 4140.0 0.25 107.82 19.21 Ag (g/t) 3.47 96.4 0.003 2.68 0.77 5,629 Au (g/t) NEHG 2.34 2720.0 0.25 123.63 52.78 Ag (g/t) 8.05 94.0 0.003 1.31 0.16 16,479 Au (g/t) NELG 4.37 3140.0 0.25 57.13 13.38 Ag (g/t) 6.84 38.1 0.003 0.29 0.04 50,036 Au (g/t) WASTE 6.40 1010.0 0.25 12.98 2.03 Ag (g/t) The grade distributions for gold and silver, within each mineralized domain, have been examined to determine if capping is required and if so, at what levels . Both elements show skewed distributions in all domains and have been converted to lognormal cumulative frequency plots . Each variable has been examined within each domain with thresholds selected for capping if required . ( Table 11 - 2 ) Table 11 - 2 Capped Levels for Gold and Silver Number of Assays capped Cap Level (g/t) Variable Domain 8 38.0 g/t Au ASH 6 860.0 g/t Ag 7 50.0 g/t Au MHG 11 2500.0 g/t Ag 13 42.0 g/t Au MLG 9 2050.0 g/t Ag 3 43.0 g/t Au NHG 4 3300.0 g/t Ag 3 23.0 g/t Au NLG 6 1900.0 g/t Ag 7 43.0 g/t Au NEHG 3 1900.0 g/t Ag 6 18.0 g/t Au NELG 8 1100.0 g/t Ag 4 10.0 g/t Au WASTE 5 530.0 g/t Ag
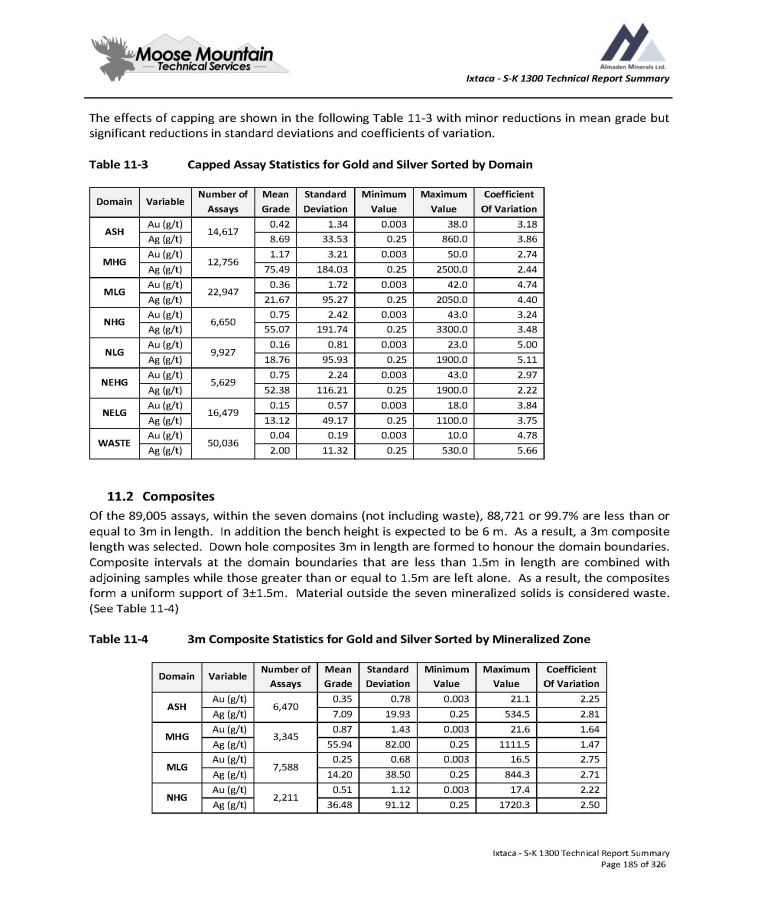
Ixtaca - S - K 1300 Technical Report Summary The effects of capping are shown in the following Table 11 - 3 with minor reductions in mean grade but significant reductions in standard deviations and coefficients of variation. Table 11 - 3 Capped Assay Statistics for Gold and Silver Sorted by Domain Ixtaca - S - K 1300 Technical Report Summary Page 185 of 326 Coefficient Of Variation Maximum Value Minimum Value Standard Deviation Mean Grade Number of Assays Variable Domain 3.18 38.0 0.003 1.34 0.42 14,617 Au (g/t) ASH 3.86 860.0 0.25 33.53 8.69 Ag (g/t) 2.74 50.0 0.003 3.21 1.17 12,756 Au (g/t) MHG 2.44 2500.0 0.25 184.03 75.49 Ag (g/t) 4.74 42.0 0.003 1.72 0.36 22,947 Au (g/t) MLG 4.40 2050.0 0.25 95.27 21.67 Ag (g/t) 3.24 43.0 0.003 2.42 0.75 6,650 Au (g/t) NHG 3.48 3300.0 0.25 191.74 55.07 Ag (g/t) 5.00 23.0 0.003 0.81 0.16 9,927 Au (g/t) NLG 5.11 1900.0 0.25 95.93 18.76 Ag (g/t) 2.97 43.0 0.003 2.24 0.75 5,629 Au (g/t) NEHG 2.22 1900.0 0.25 116.21 52.38 Ag (g/t) 3.84 18.0 0.003 0.57 0.15 16,479 Au (g/t) NELG 3.75 1100.0 0.25 49.17 13.12 Ag (g/t) 4.78 10.0 0.003 0.19 0.04 50,036 Au (g/t) WASTE 5.66 530.0 0.25 11.32 2.00 Ag (g/t) 11 . 2 Composites Of the 89 , 005 assays, within the seven domains (not including waste), 88 , 721 or 99 . 7 % are less than or equal to 3 m in length . In addition the bench height is expected to be 6 m . As a result, a 3 m composite length was selected . Down hole composites 3 m in length are formed to honour the domain boundaries . Composite intervals at the domain boundaries that are less than 1 . 5 m in length are combined with adjoining samples while those greater than or equal to 1 . 5 m are left alone . As a result, the composites form a uniform support of 3 ц 1 . 5 m . Material outside the seven mineralized solids is considered waste . (See Table 11 - 4 ) Table 11 - 4 3 m Composite Statistics for Gold and Silver Sorted by Mineralized Zone Coefficient Of Variation Maximum Value Minimum Value Standard Deviation Mean Grade Number of Assays Variable Domain 2.25 21.1 0.003 0.78 0.35 6,470 Au (g/t) ASH 2.81 534.5 0.25 19.93 7.09 Ag (g/t) 1.64 21.6 0.003 1.43 0.87 3,345 Au (g/t) MHG 1.47 1111.5 0.25 82.00 55.94 Ag (g/t) 2.75 16.5 0.003 0.68 0.25 7,588 Au (g/t) MLG 2.71 844.3 0.25 38.50 14.20 Ag (g/t) 2.22 17.4 0.003 1.12 0.51 2,211 Au (g/t) NHG 2.50 1720.3 0.25 91.12 36.48 Ag (g/t)
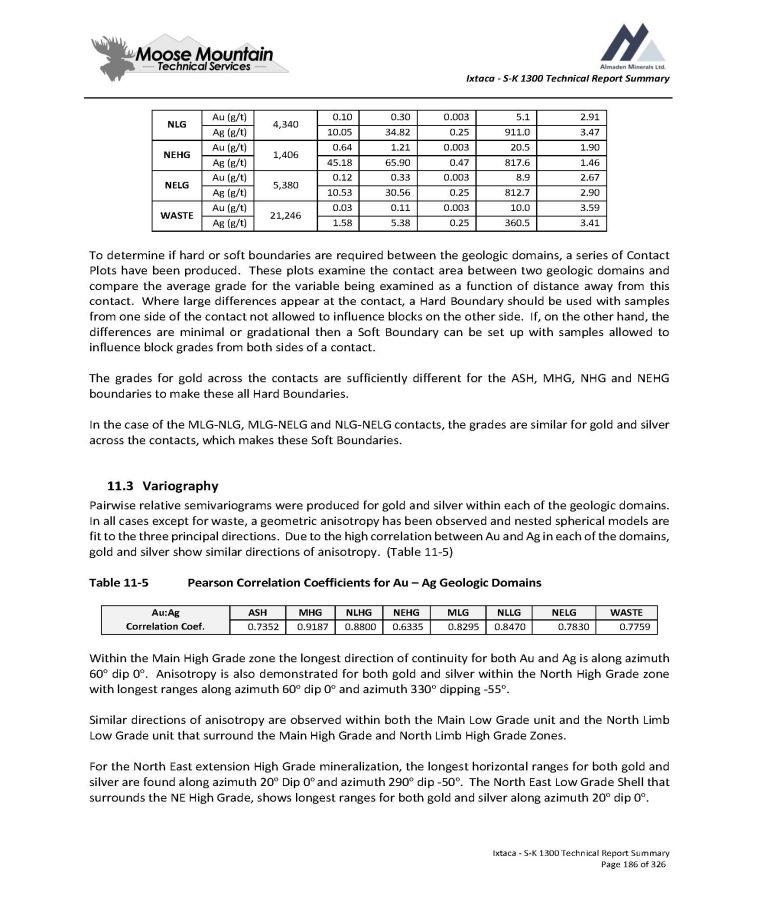
Ixtaca - S - K 1300 Technical Report Summary 2.91 5.1 0.003 0.30 0.10 4,340 Au (g/t) NLG 3.47 911.0 0.25 34.82 10.05 Ag (g/t) 1.90 20.5 0.003 1.21 0.64 1,406 Au (g/t) NEHG 1.46 817.6 0.47 65.90 45.18 Ag (g/t) 2.67 8.9 0.003 0.33 0.12 5,380 Au (g/t) NELG 2.90 812.7 0.25 30.56 10.53 Ag (g/t) 3.59 10.0 0.003 0.11 0.03 21,246 Au (g/t) WASTE 3.41 360.5 0.25 5.38 1.58 Ag (g/t) Ixtaca - S - K 1300 Technical Report Summary Page 186 of 326 To determine if hard or soft boundaries are required between the geologic domains, a series of Contact Plots have been produced . These plots examine the contact area between two geologic domains and compare the average grade for the variable being examined as a function of distance away from this contact . Where large differences appear at the contact, a Hard Boundary should be used with samples from one side of the contact not allowed to influence blocks on the other side . If, on the other hand, the differences are minimal or gradational then a Soft Boundary can be set up with samples allowed to influence block grades from both sides of a contact . The grades for gold across the contacts are sufficiently different for the ASH, MHG, NHG and NEHG boundaries to make these all Hard Boundaries . In the case of the MLG - NLG, MLG - NELG and NLG - NELG contacts, the grades are similar for gold and silver across the contacts, which makes these Soft Boundaries . 11 . 3 Variography Pairwise relative semivariograms were produced for gold and silver within each of the geologic domains . In all cases except for waste, a geometric anisotropy has been observed and nested spherical models are fit to the three principal directions . Due to the high correlation between Au and Ag in each of the domains, gold and silver show similar directions of anisotropy . ( Table 11 - 5 ) Table 11 - 5 Pearson Correlation Coefficients for Au – Ag Geologic Domains WASTE NELG NLLG MLG NEHG NLHG MHG ASH Au:Ag Correlation Coef. 0.7759 0.7830 0.8470 0.8295 0.6335 0.8800 0.9187 0.7352 Within the Main High Grade zone the longest direction of continuity for both Au and Ag is along azimuth 60 o dip 0 o . Anisotropy is also demonstrated for both gold and silver within the North High Grade zone with longest ranges along azimuth 60 o dip 0 o and azimuth 330 o dipping - 55 o . Similar directions of anisotropy are observed within both the Main Low Grade unit and the North Limb Low Grade unit that surround the Main High Grade and North Limb High Grade Zones . For the North East extension High Grade mineralization, the longest horizontal ranges for both gold and silver are found along azimuth 20 o Dip 0 o and azimuth 290 o dip - 50 o . The North East Low Grade Shell that surrounds the NE High Grade, shows longest ranges for both gold and silver along azimuth 20 o dip 0 o .
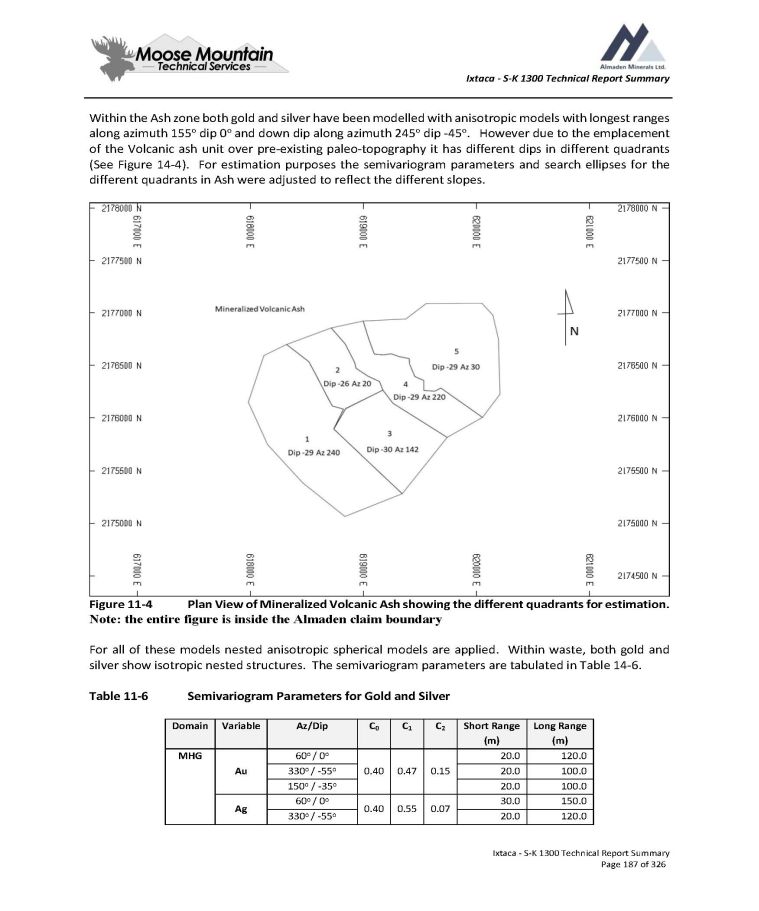
Ixtaca - S - K 1300 Technical Report Summary Within the Ash zone both gold and silver have been modelled with anisotropic models with longest ranges along azimuth 155 o dip 0 o and down dip along azimuth 245 o dip - 45 o . However due to the emplacement of the Volcanic ash unit over pre - existing paleo - topography it has different dips in different quadrants (See Figure 14 - 4 ) . For estimation purposes the semivariogram parameters and search ellipses for the different quadrants in Ash were adjusted to reflect the different slopes . Figure 11 - 4 Plan View of Mineralized Volcanic Ash showing the different quadrants for estimation. Note: the entire figure is inside the Almaden claim boundary For all of these models nested anisotropic spherical models are applied. Within waste, both gold and silver show isotropic nested structures. The semivariogram parameters are tabulated in Table 14 - 6. Table 11 - 6 Semivariogram Parameters for Gold and Silver Long Range (m) Short Range (m) C 2 C 1 C 0 Az/Dip Variable Domain 120.0 20.0 0.15 0.47 0.40 60 o / 0 o Au MHG 100.0 20.0 330 o / - 55 o 100.0 20.0 150 o / - 35 o 150.0 30.0 0.07 0.55 0.40 60 o / 0 o Ag 120.0 20.0 330 o / - 55 o Ixtaca - S - K 1300 Technical Report Summary Page 187 of 326
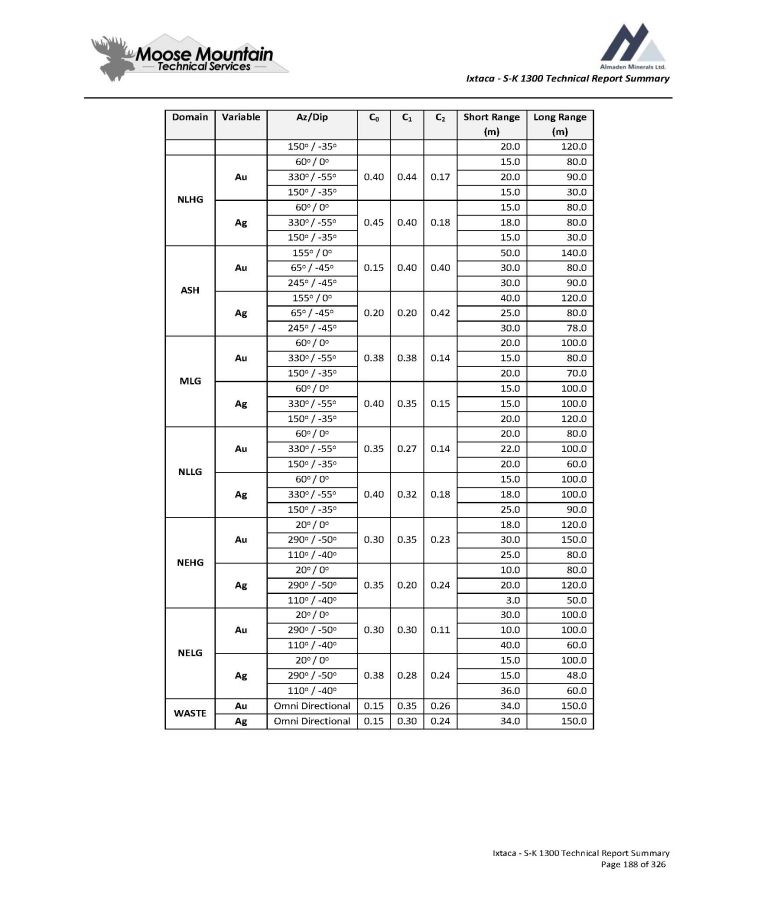
Ixtaca - S - K 1300 Technical Report Summary Long Range (m) Short Range (m) C 2 C 1 C 0 Az/Dip Variable Domain 120.0 20.0 150 o / - 35 o 80.0 15.0 0.17 0.44 0.40 60 o / 0 o Au NLHG 90.0 20.0 330 o / - 55 o 30.0 15.0 150 o / - 35 o 80.0 15.0 0.18 0.40 0.45 60 o / 0 o Ag 80.0 18.0 330 o / - 55 o 30.0 15.0 150 o / - 35 o 140.0 50.0 0.40 0.40 0.15 155 o / 0 o Au ASH 80.0 30.0 65 o / - 45 o 90.0 30.0 245 o / - 45 o 120.0 40.0 0.42 0.20 0.20 155 o / 0 o Ag 80.0 25.0 65 o / - 45 o 78.0 30.0 245 o / - 45 o 100.0 20.0 0.14 0.38 0.38 60 o / 0 o Au MLG 80.0 15.0 330 o / - 55 o 70.0 20.0 150 o / - 35 o 100.0 15.0 0.15 0.35 0.40 60 o / 0 o Ag 100.0 15.0 330 o / - 55 o 120.0 20.0 150 o / - 35 o 80.0 20.0 0.14 0.27 0.35 60 o / 0 o Au NLLG 100.0 22.0 330 o / - 55 o 60.0 20.0 150 o / - 35 o 100.0 15.0 0.18 0.32 0.40 60 o / 0 o Ag 100.0 18.0 330 o / - 55 o 90.0 25.0 150 o / - 35 o 120.0 18.0 0.23 0.35 0.30 20 o / 0 o Au NEHG 150.0 30.0 290 o / - 50 o 80.0 25.0 110 o / - 40 o 80.0 10.0 0.24 0.20 0.35 20 o / 0 o Ag 120.0 20.0 290 o / - 50 o 50.0 3.0 110 o / - 40 o 100.0 30.0 0.11 0.30 0.30 20 o / 0 o Au NELG 100.0 10.0 290 o / - 50 o 60.0 40.0 110 o / - 40 o 100.0 15.0 0.24 0.28 0.38 20 o / 0 o Ag 48.0 15.0 290 o / - 50 o 60.0 36.0 110 o / - 40 o 150.0 34.0 0.26 0.35 0.15 Omni Directional Au WASTE 150.0 34.0 0.24 0.30 0.15 Omni Directional Ag Ixtaca - S - K 1300 Technical Report Summary Page 188 of 326
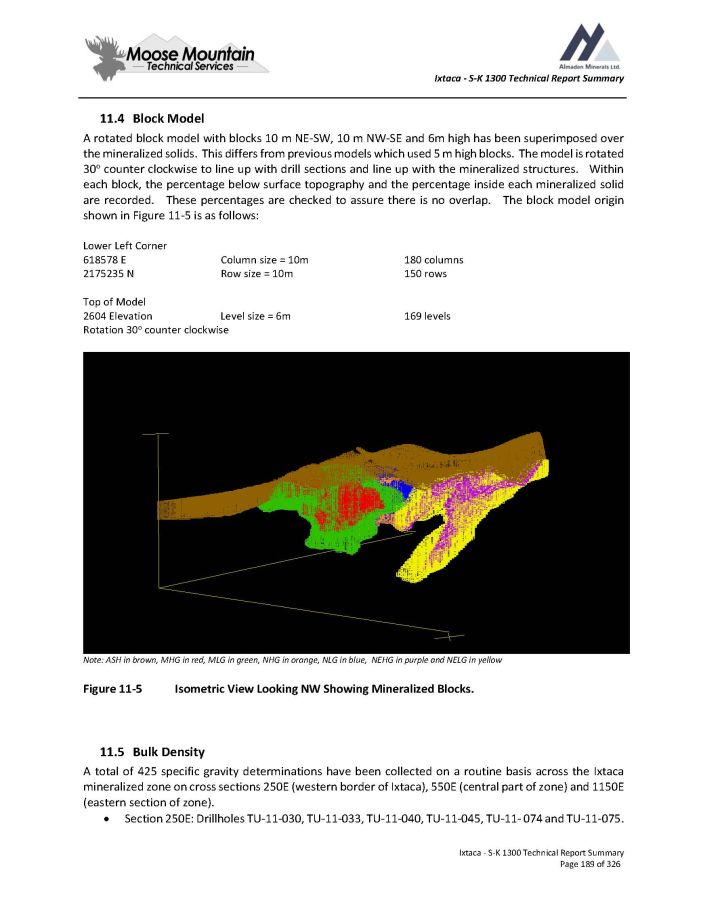
Ixtaca - S - K 1300 Technical Report Summary 11 . 4 Block Model A rotated block model with blocks 10 m NE - SW, 10 m NW - SE and 6 m high has been superimposed over the mineralized solids . This differs from previous models which used 5 m high blocks . The model is rotated 30 o counter clockwise to line up with drill sections and line up with the mineralized structures . Within each block, the percentage below surface topography and the percentage inside each mineralized solid are recorded . These percentages are checked to assure there is no overlap . The block model origin shown in Figure 11 - 5 is as follows : 180 columns Column size = 10m Lower Left Corner 618578 E 150 rows Row size = 10m 2175235 N 169 levels Level size = 6m Top of Model 2604 Elevation Rotation 30 o counter clockwise Note: ASH in brown, MHG in red, MLG in green, NHG in orange, NLG in blue, NEHG in purple and NELG in yellow Figure 11 - 5 Isometric View Looking NW Showing Mineralized Blocks. 11 . 5 Bulk Density A total of 425 specific gravity determinations have been collected on a routine basis across the Ixtaca mineralized zone on cross sections 250 E (western border of Ixtaca), 550 E (central part of zone) and 1150 E (eastern section of zone) . Section 250 E : Drillholes TU - 11 - 030 , TU - 11 - 033 , TU - 11 - 040 , TU - 11 - 045 , TU - 11 - 074 and TU - 11 - 075 . Ixtaca - S - K 1300 Technical Report Summary Page 189 of 326
Ixtaca - S - K 1300 Technical Report Summary Section 550E: Drillholes TU - 10 - 011, TU - 10 - 013, TU - 11 - 016, TU - 11 - 019, TU - 11 - 059, TU - 11 - 066 and TU - 11 - 078. Section 1150E: Drillholes TU - 11 - 041, TU - 11 - 046, CA - 11 - 002 and CA - 11 - 003. The measurements have been made on drill core samples using the Archimedes (weight in air - weight in water) method. The relative number of analysis is shown in the Table below: Table 11 - 7 Specific Gravity Determinations Sorted by Cross Section Ixtaca - S - K 1300 Technical Report Summary Page 190 of 326 Average SG Maximum SG Minimum SG Number of Samples Cross Section 2.57 3.28 1.33 223 550 E 2.41 2.69 1.42 88 250 E 2.60 3.21 1.43 114 1150 E 2.55 3.28 1.33 425 Total The data is also sorted by lithology. Table 11 - 8 Specific Gravity Determinations Sorted by Lithology Average SG Number of Samples Lithology Lithology Code 1.67 33 Ash unit Ash 2.45 3 Breccia / Limestone Bx/Lm 2.46 71 Felsic Dyke Df 2.70 7 Mafic Dyke Dm 2.59 25 Porphyritic Dyke Dp 2.65 58 Limestone/chert Lch 2.67 10 Lime < 10% mud Lg 2.67 72 Lime Mudstone Lm 2.59 37 Lime Packstone Lp 2.65 2 Limestone undifferentiated Ls 2.58 2 Lime wackestone Lw 2.96 7 Mineralized qtz. veining Min 2.58 2 Principal Porphyry Pp 2.61 56 Shale ShB 2.44 3 Green Shale ShG 2.89 20 Skarn Skn 2.71 17 Siltstone Slt Table 11 - 8 summarizes specific gravity values for all lithologies studied in all three sections . Values in the Table have been averaged for each lithology . Values from these lithologies have then been averaged within the various geologic domains to produce the following specific gravities for converting volumes to tonnes : The ash domain has an average specific gravity of 1.67 The low grade limestone (LGLM) domain has an average specific gravity of 2.66 The main high grade (MHG) domain has an average specific gravity of 2.63 (this unit contains about 20% Felsic Dyke)
Ixtaca - S - K 1300 Technical Report Summary The main high grade zone (NHG) North limb has an average specific gravity of 2.60 (this north limb contains about 40% Felsic Dyke and 40% Mafic Dyke) The low grade shale (LGSHW & LGSHE) domains have an average specific gravity of 2.61 The North East extension high grade (NEHG) domain has an average specific gravity of 2.65 11 . 6 Grade Interpolation Grades for gold and silver have been interpolated into the blocks by Ordinary Kriging . Each kriging run has been completed in a series of passes with the search ellipse orientation and dimension a function of the semivariogram for the domain and variable being estimated . The first pass uses search dimensions equal to ¼ the semivariogram range in the three principal directions . A minimum of four composites are required to estimate a block with a maximum of three from any given drillhole . In this manner, all blocks are estimated with a minimum of two drillhole . For blocks not estimated in pass 1 , a second pass using ½ the semivariogram range has been completed . A third pass using the full range and a fourth pass using twice the range has followed . Finally because there were many blocks containing multiple domains, a fifth pass has often been required to ensure all domains were estimated . In all passes the maximum number of composites used is twelve and if more were found in any search, the closest twelve are used . As mentioned in Section 14 . 3 the volcanic ash was subdivided into 5 separate domains with the search ellipse modified for each subdomain to reflect pre - deposition topography . As a result each subdomain in ash was estimated separately (see Table 14 - 9 ) . Once all domains are completed, estimated blocks containing some percentage outside the mineralized domains are estimated in a similar manner using composites from outside the mineralized domains (waste) . Finally blocks completely in waste are estimated using composites from outside the mineralized solids . For all blocks along the contacts, containing multiple domains, a weighted average grade for gold and silver is produced . The search parameters for gold within each domain and the number of blocks estimated in each pass are tabulated in the following Table 14 - 9 . Ixtaca - S - K 1300 Technical Report Summary Page 191 of 326
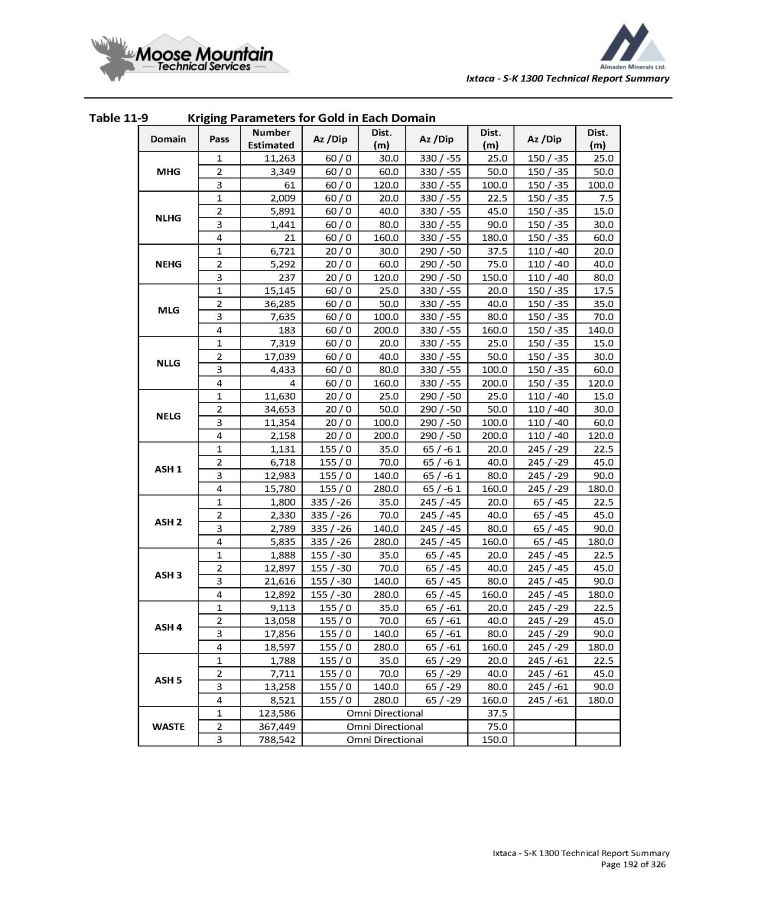
Ixtaca - S - K 1300 Technical Report Summary Table 11 - 9 Ixtaca - S - K 1300 Technical Report Summary Page 192 of 326 Kriging Parameters for Gold in Each Domain Dist. (m) Az /Dip Dist. (m) Az /Dip Dist. (m) Az /Dip Number Estimated Pass Domain 25.0 150 / - 35 25.0 330 / - 55 30.0 60 / 0 11,263 1 MHG 50.0 150 / - 35 50.0 330 / - 55 60.0 60 / 0 3,349 2 100.0 150 / - 35 100.0 330 / - 55 120.0 60 / 0 61 3 7.5 150 / - 35 22.5 330 / - 55 20.0 60 / 0 2,009 1 NLHG 15.0 150 / - 35 45.0 330 / - 55 40.0 60 / 0 5,891 2 30.0 150 / - 35 90.0 330 / - 55 80.0 60 / 0 1,441 3 60.0 150 / - 35 180.0 330 / - 55 160.0 60 / 0 21 4 20.0 110 / - 40 37.5 290 / - 50 30.0 20 / 0 6,721 1 NEHG 40.0 110 / - 40 75.0 290 / - 50 60.0 20 / 0 5,292 2 80.0 110 / - 40 150.0 290 / - 50 120.0 20 / 0 237 3 17.5 150 / - 35 20.0 330 / - 55 25.0 60 / 0 15,145 1 MLG 35.0 150 / - 35 40.0 330 / - 55 50.0 60 / 0 36,285 2 70.0 150 / - 35 80.0 330 / - 55 100.0 60 / 0 7,635 3 140.0 150 / - 35 160.0 330 / - 55 200.0 60 / 0 183 4 15.0 150 / - 35 25.0 330 / - 55 20.0 60 / 0 7,319 1 NLLG 30.0 150 / - 35 50.0 330 / - 55 40.0 60 / 0 17,039 2 60.0 150 / - 35 100.0 330 / - 55 80.0 60 / 0 4,433 3 120.0 150 / - 35 200.0 330 / - 55 160.0 60 / 0 4 4 15.0 110 / - 40 25.0 290 / - 50 25.0 20 / 0 11,630 1 NELG 30.0 110 / - 40 50.0 290 / - 50 50.0 20 / 0 34,653 2 60.0 110 / - 40 100.0 290 / - 50 100.0 20 / 0 11,354 3 120.0 110 / - 40 200.0 290 / - 50 200.0 20 / 0 2,158 4 22.5 245 / - 29 20.0 65 / - 6 1 35.0 155 / 0 1,131 1 ASH 1 45.0 245 / - 29 40.0 65 / - 6 1 70.0 155 / 0 6,718 2 90.0 245 / - 29 80.0 65 / - 6 1 140.0 155 / 0 12,983 3 180.0 245 / - 29 160.0 65 / - 6 1 280.0 155 / 0 15,780 4 22.5 65 / - 45 20.0 245 / - 45 35.0 335 / - 26 1,800 1 ASH 2 45.0 65 / - 45 40.0 245 / - 45 70.0 335 / - 26 2,330 2 90.0 65 / - 45 80.0 245 / - 45 140.0 335 / - 26 2,789 3 180.0 65 / - 45 160.0 245 / - 45 280.0 335 / - 26 5,835 4 22.5 245 / - 45 20.0 65 / - 45 35.0 155 / - 30 1,888 1 ASH 3 45.0 245 / - 45 40.0 65 / - 45 70.0 155 / - 30 12,897 2 90.0 245 / - 45 80.0 65 / - 45 140.0 155 / - 30 21,616 3 180.0 245 / - 45 160.0 65 / - 45 280.0 155 / - 30 12,892 4 22.5 245 / - 29 20.0 65 / - 61 35.0 155 / 0 9,113 1 ASH 4 45.0 245 / - 29 40.0 65 / - 61 70.0 155 / 0 13,058 2 90.0 245 / - 29 80.0 65 / - 61 140.0 155 / 0 17,856 3 180.0 245 / - 29 160.0 65 / - 61 280.0 155 / 0 18,597 4 22.5 245 / - 61 20.0 65 / - 29 35.0 155 / 0 1,788 1 ASH 5 45.0 245 / - 61 40.0 65 / - 29 70.0 155 / 0 7,711 2 90.0 245 / - 61 80.0 65 / - 29 140.0 155 / 0 13,258 3 180.0 245 / - 61 160.0 65 / - 29 280.0 155 / 0 8,521 4 37.5 Omni Directional 123,586 1 WASTE 75.0 Omni Directional 367,449 2 150.0 Omni Directional 788,542 3
Ixtaca - S - K 1300 Technical Report Summary 11.7 Classification Based on the study herein reported, delineated mineralisation of Ixtaca is classified as a resource according to the following definitions from SEC Disclosure by Registrants engaged in Mining Operations: The terms Measured, Indicated and Inferred are defined as follows: “Mineral resource is a concentration or occurrence of material of economic interest in or on the Earth's crust in such form, grade or quality, and quantity that there are reasonable prospects for economic extraction . A mineral resource is a reasonable estimate of mineralization, taking into account relevant factors such as cut - off grade, likely mining dimensions, location or continuity, that, with the assumed and justifiable technical and economic conditions, is likely to, in whole or in part, become economically extractable . It is not merely an inventory of all mineralization drilled or sampled . Inferred Mineral Resource “Inferred mineral resource is that part of a mineral resource for which quantity and grade or quality are estimated on the basis of limited geological evidence and sampling . The level of geological uncertainty associated with an inferred mineral resource is too high to apply relevant technical and economic factors likely to influence the prospects of economic extraction in a manner useful for evaluation of economic viability . Because an inferred mineral resource has the lowest level of geological confidence of all mineral resources, which prevents the application of the modifying factors in a manner useful for evaluation of economic viability, an inferred mineral resource may not be considered when assessing the economic viability of a mining project, and may not be converted to a mineral reserve . ” Indicated Mineral Resource “ Indicated mineral resource is that part of a mineral resource for which quantity and grade or quality are estimated on the basis of adequate geological evidence and sampling . The level of geological certainty associated with an indicated mineral resource is sufficient to allow a qualified person to apply modifying factors in sufficient detail to support mine planning and evaluation of the economic viability of the deposit . Because an indicated mineral resource has a lower level of confidence than the level of confidence of a measured mineral resource, an indicated mineral resource may only be converted to a probable mineral reserve . ” Measured Mineral Resource “Measured mineral resource is that part of a mineral resource for which quantity and grade or quality are estimated on the basis of conclusive geological evidence and sampling . The level of geological certainty associated with a measured mineral resource is sufficient to allow a qualified person to apply modifying factors, as defined in this section, in sufficient detail to support detailed mine planning and final evaluation of the economic viability of the deposit . Because a measured mineral resource has a higher level of confidence than the level of confidence of either an indicated mineral resource or an inferred mineral resource, a measured mineral resource may be converted to a proven mineral reserve or to a probable mineral reserve . ” Modifying Factors “ Modifying factors are the factors that a qualified person must apply to indicated and measured mineral resources and then evaluate in order to establish the economic viability of mineral reserves . A qualified person must apply and evaluate modifying factors to convert measured and indicated mineral resources to proven and probable mineral reserves . These factors include, but are not restricted to : Mining ; processing ; metallurgical ; infrastructure ; economic ; marketing ; legal ; environmental compliance ; plans, negotiations, or agreements with local individuals or groups ; and Ixtaca - S - K 1300 Technical Report Summary Page 193 of 326

Ixtaca - S - K 1300 Technical Report Summary governmental factors. The number, type and specific characteristics of the modifying factors applied will necessarily be a function of and depend upon the mineral, mine, property, or project.” At Ixtaca, the geologic continuity has been established through surface mapping and drillhole interpretation . This has resulted in a multi domain interpretation that has been used to constrain the Resource Estimate . For this estimate the volcanic ash unit has been further subdivided into 5 subdomains to better reflect pre - deposition topography . The grade continuity within each domain has been quantified by semivariogram analysis . The semivariograms have been used to determine the search directions and distances for each pass in the kriging procedure . Using the semivariogram range to estimate blocks would allow classification as follows : Blocks estimated in Pass 1 for both Au and Ag using ¼ of the semivariogram range are considered Measured. Blocks estimated in Pass 2 using ½ of the semivariogram range are considered Indicated All other blocks would be classified as Inferred. A range of cut - offs are presented to demonstrate the sensitivity of the deposit to grade variations. The Resource Tables are shown below using gold equivalent cut - offs where: Gold – price of $1250 / oz Silver – price of $18 / oz Metallurgy has shown roughly equivalent metal recoveries for Au and Ag so for now the Au Equivalent equation is : AuEq = Au + (Ag * 18 / 1250) Ixtaca - S - K 1300 Technical Report Summary Page 194 of 326
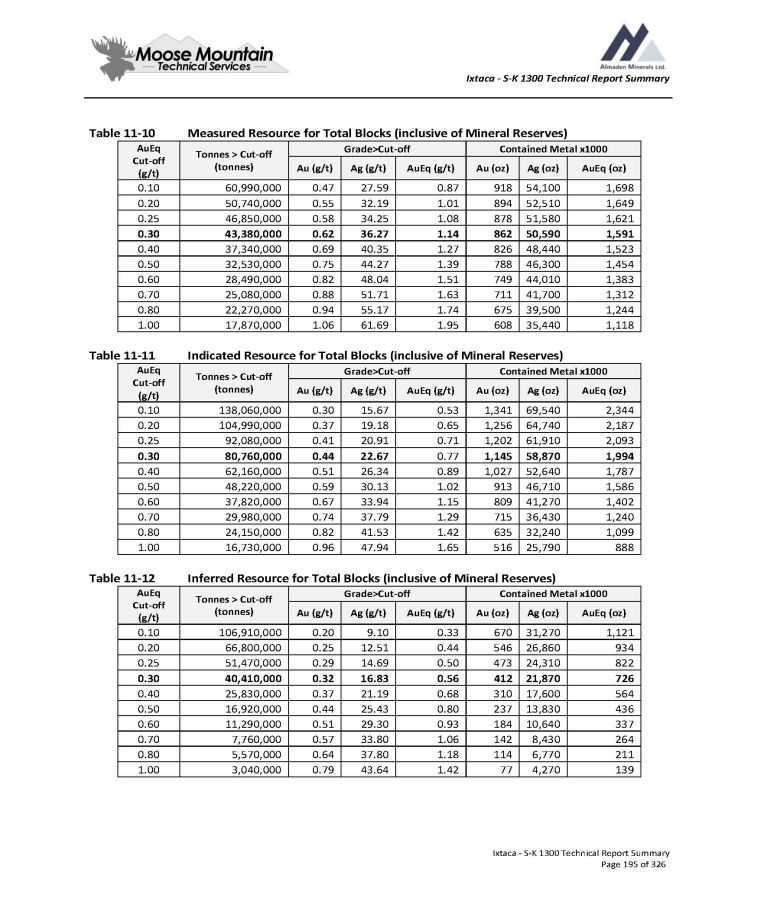
Ixtaca - S - K 1300 Technical Report Summary Table 11 - 10 Ixtaca - S - K 1300 Technical Report Summary Page 195 of 326 Measured Resource for Total Blocks (inclusive of Mineral Reserves) Contained Metal x1000 Grade>Cut - off Tonnes > Cut - off (tonnes) AuEq Cut - off (g/t) AuEq (oz) Ag (oz) Au (oz) AuEq (g/t) Ag (g/t) Au (g/t) 1,698 54,100 918 0.87 27.59 0.47 60,990,000 0.10 1,649 52,510 894 1.01 32.19 0.55 50,740,000 0.20 1,621 51,580 878 1.08 34.25 0.58 46,850,000 0.25 1,591 50,590 862 1.14 36.27 0.62 43,380,000 0.30 1,523 48,440 826 1.27 40.35 0.69 37,340,000 0.40 1,454 46,300 788 1.39 44.27 0.75 32,530,000 0.50 1,383 44,010 749 1.51 48.04 0.82 28,490,000 0.60 1,312 41,700 711 1.63 51.71 0.88 25,080,000 0.70 1,244 39,500 675 1.74 55.17 0.94 22,270,000 0.80 1,118 35,440 608 1.95 61.69 1.06 17,870,000 1.00 Table 11 - 11 Indicated Resource for Total Blocks (inclusive of Mineral Reserves) Contained Metal x1000 Grade>Cut - off Tonnes > Cut - off (tonnes) AuEq Cut - off (g/t) AuEq (oz) Ag (oz) Au (oz) AuEq (g/t) Ag (g/t) Au (g/t) 2,344 69,540 1,341 0.53 15.67 0.30 138,060,000 0.10 2,187 64,740 1,256 0.65 19.18 0.37 104,990,000 0.20 2,093 61,910 1,202 0.71 20.91 0.41 92,080,000 0.25 1,994 58,870 1,145 0.77 22.67 0.44 80,760,000 0.30 1,787 52,640 1,027 0.89 26.34 0.51 62,160,000 0.40 1,586 46,710 913 1.02 30.13 0.59 48,220,000 0.50 1,402 41,270 809 1.15 33.94 0.67 37,820,000 0.60 1,240 36,430 715 1.29 37.79 0.74 29,980,000 0.70 1,099 32,240 635 1.42 41.53 0.82 24,150,000 0.80 888 25,790 516 1.65 47.94 0.96 16,730,000 1.00 Table 11 - 12 Inferred Resource for Total Blocks (inclusive of Mineral Reserves) Contained Metal x1000 Grade>Cut - off Tonnes > Cut - off (tonnes) AuEq Cut - off (g/t) AuEq (oz) Ag (oz) Au (oz) AuEq (g/t) Ag (g/t) Au (g/t) 1,121 31,270 670 0.33 9.10 0.20 106,910,000 0.10 934 26,860 546 0.44 12.51 0.25 66,800,000 0.20 822 24,310 473 0.50 14.69 0.29 51,470,000 0.25 726 21,870 412 0.56 16.83 0.32 40,410,000 0.30 564 17,600 310 0.68 21.19 0.37 25,830,000 0.40 436 13,830 237 0.80 25.43 0.44 16,920,000 0.50 337 10,640 184 0.93 29.30 0.51 11,290,000 0.60 264 8,430 142 1.06 33.80 0.57 7,760,000 0.70 211 6,770 114 1.18 37.80 0.64 5,570,000 0.80 139 4,270 77 1.42 43.64 0.79 3,040,000 1.00
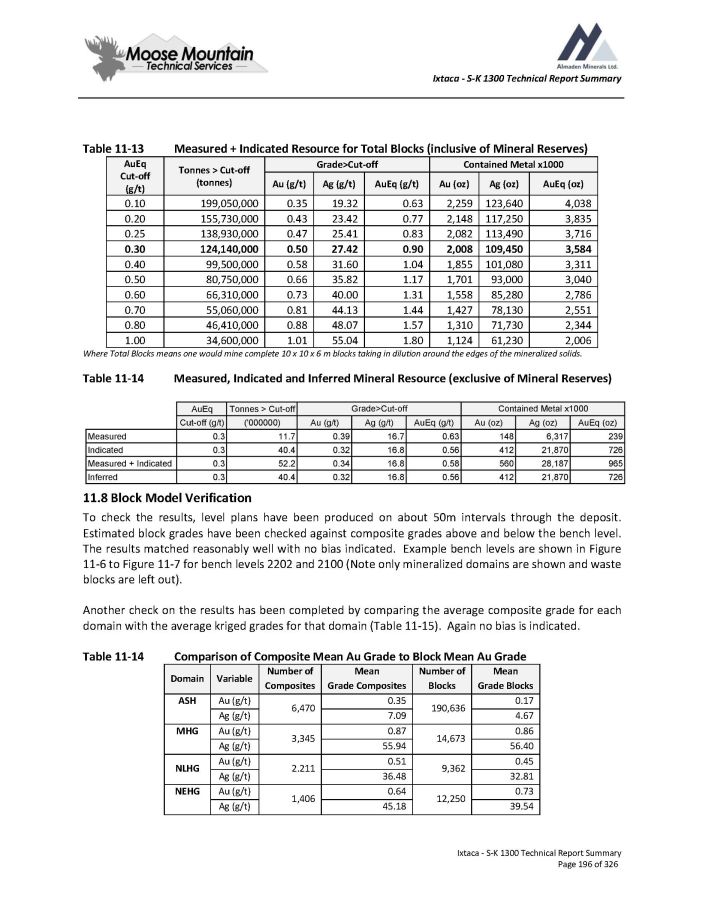
Ixtaca - S - K 1300 Technical Report Summary Table 11 - 13 Measured + Indicated Resource for Total Blocks (inclusive of Mineral Reserves) Contained Metal x1000 Grade>Cut - off Tonnes > Cut - off (tonnes) AuEq Cut - off (g/t) AuEq (oz) Ag (oz) Au (oz) AuEq (g/t) Ag (g/t) Au (g/t) 4,038 123,640 2,259 0.63 19.32 0.35 199,050,000 0.10 3,835 117,250 2,148 0.77 23.42 0.43 155,730,000 0.20 3,716 113,490 2,082 0.83 25.41 0.47 138,930,000 0.25 3,584 109,450 2,008 0.90 27.42 0.50 124,140,000 0.30 3,311 101,080 1,855 1.04 31.60 0.58 99,500,000 0.40 3,040 93,000 1,701 1.17 35.82 0.66 80,750,000 0.50 2,786 85,280 1,558 1.31 40.00 0.73 66,310,000 0.60 2,551 78,130 1,427 1.44 44.13 0.81 55,060,000 0.70 2,344 71,730 1,310 1.57 48.07 0.88 46,410,000 0.80 2,006 61,230 1,124 1.80 55.04 1.01 34,600,000 1.00 Where Total Blocks means one would mine complete 10 x 10 x 6 m blocks taking in dilution around the edges of the mineralized solids. Table 11 - 14 Measured, Indicated and Inferred Mineral Resource (exclusive of Mineral Reserves) 11 . 8 Block Model Verification To check the results, level plans have been produced on about 50 m intervals through the deposit . Estimated block grades have been checked against composite grades above and below the bench level . The results matched reasonably well with no bias indicated . Example bench levels are shown in Figure 11 - 6 to Figure 11 - 7 for bench levels 2202 and 2100 (Note only mineralized domains are shown and waste blocks are left out) . Another check on the results has been completed by comparing the average composite grade for each domain with the average kriged grades for that domain ( Table 11 - 15 ) . Again no bias is indicated . Table 11 - 14 Comparison of Composite Mean Au Grade to Block Mean Au Grade Mean Grade Blocks Number of Blocks Mean Grade Composites Number of Composites Variable Domain 0.17 190,636 0.35 6,470 Au (g/t) ASH 4.67 7.09 Ag (g/t) 0.86 14,673 0.87 3,345 Au (g/t) MHG 56.40 55.94 Ag (g/t) 0.45 9,362 0.51 2.211 Au (g/t) NLHG 32.81 36.48 Ag (g/t) 0.73 12,250 0.64 1,406 Au (g/t) NEHG 39.54 45.18 Ag (g/t) Ixtaca - S - K 1300 Technical Report Summary Page 196 of 326
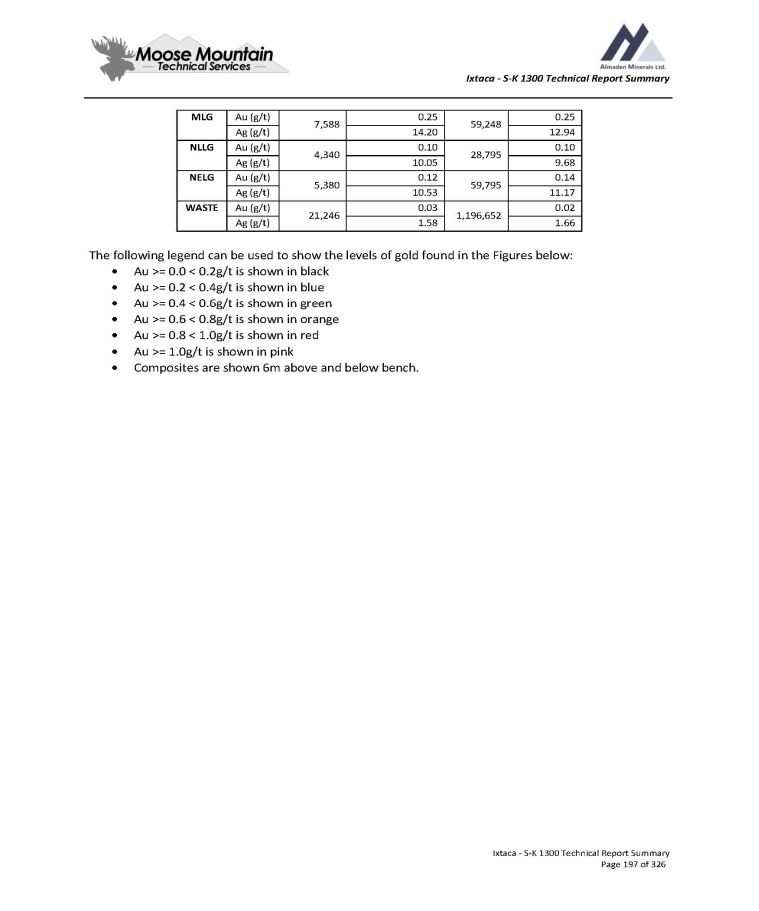
Ixtaca - S - K 1300 Technical Report Summary 0.25 59,248 0.25 7,588 Au (g/t) MLG 12.94 14.20 Ag (g/t) 0.10 28,795 0.10 4,340 Au (g/t) NLLG 9.68 10.05 Ag (g/t) 0.14 59,795 0.12 5,380 Au (g/t) NELG 11.17 10.53 Ag (g/t) 0.02 1,196,652 0.03 21,246 Au (g/t) WASTE 1.66 1.58 Ag (g/t) Ixtaca - S - K 1300 Technical Report Summary Page 197 of 326 The following legend can be used to show the levels of gold found in the Figures below: Au >= 0.0 < 0.2g/t is shown in black Au >= 0.2 < 0.4g/t is shown in blue Au >= 0.4 < 0.6g/t is shown in green Au >= 0.6 < 0.8g/t is shown in orange Au >= 0.8 < 1.0g/t is shown in red Au >= 1.0g/t is shown in pink Composites are shown 6m above and below bench.
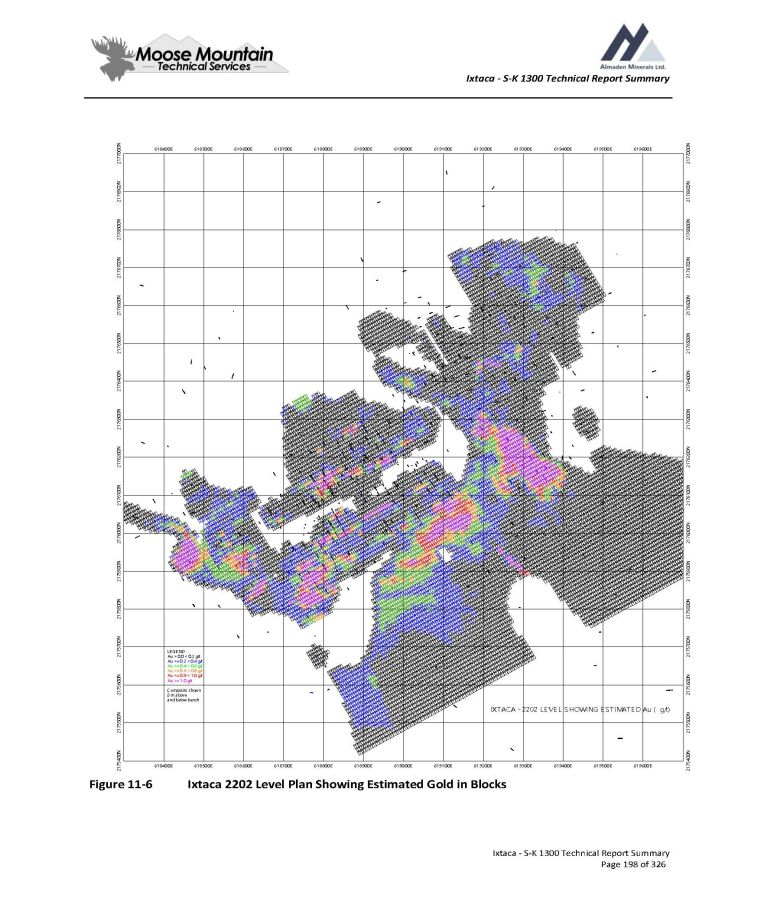
Ixtaca - S - K 1300 Technical Report Summary Figure 11 - 6 618500E 618600E 618700E 618800E 618900E 619000E 619100E 619200E 619300E Ixtaca 2202 Level Plan Showing Estimated Gold in Blocks 618400E 618400E 618500E 618600E 618700E 618800E 618900E 619000E 619100E 619200E 619300E 619400E 619400E 619500E 619500E 619600E 619600E 2175400N 2175400N 2175500N 2175500N 2175600N 2175600N 2175700N 2175700N 2175800N 2175800N 2175900N 2175900N 2176000N 2176000N 2176100N 2176100N 2176200N 2176200N 2176300N 2176300N 2176400N 2176400N 2176500N 2176500N 2176600N 2176600N 2176700N 2176700N 2176800N 2176800N 2176900N 2176900N 2177000N 2177000N IXTACA - 2202 LE VE L S HOWING E STIMATE D Au ( g/t) Ixtaca - S - K 1300 Technical Report Summary Page 198 of 326 LE GE ND Au > 0.0 < 0.2 g/t Au >= 0.2 < 0.4 g/t Au >= 0.4 < 0.6 g/t Au >= 0.6 < 0.8 g/t Au >= 0.8 < 1.0 g/t Au >= 1.0 g/t Composits shown 3 m above and below bench
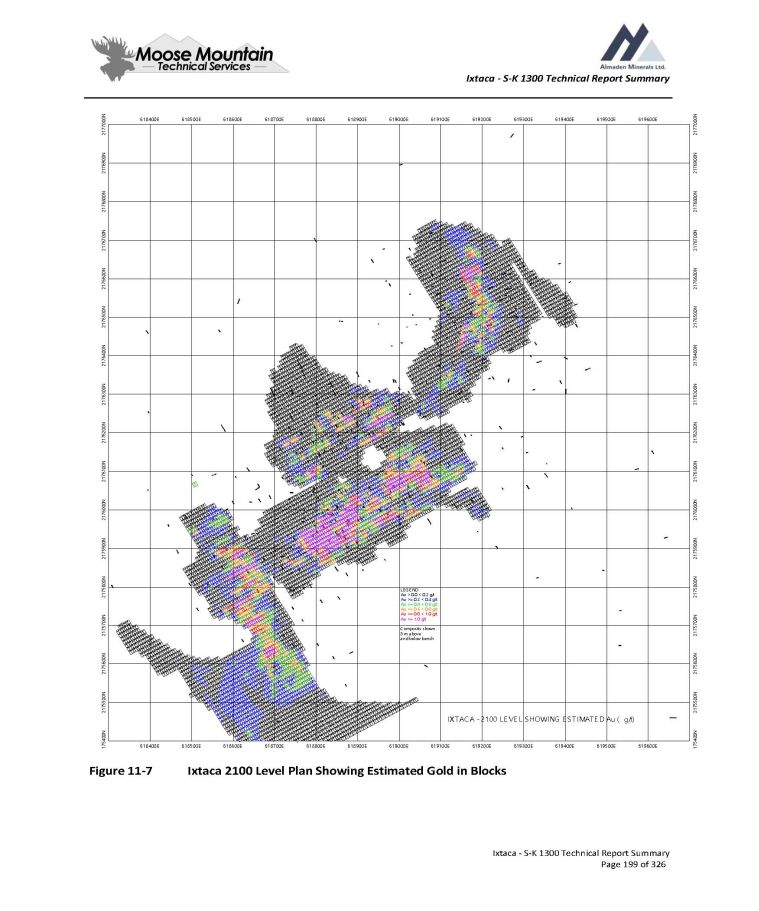
Ixtaca - S - K 1300 Technical Report Summary Figure 11 - 7 Ixtaca 2100 Level Plan Showing Estimated Gold in Blocks 618400E 618400E 618500E 618500E 618600E 618600E 618700E 618700E 618800E 618800E 618900E 618900E 619000E 619000E 619100E 619100E 619200E 619300E 619200E 619300E 619400E 619400E 619500E 619500E 619600E 619600E 175400N 175400N 2175500N 2175500N 2175600N 2175600N 2175700N 2175700N 2175800N 2175800N 2175900N 2175900N 2176000N 2176000N 2176100N 2176100N 2176200N 2176200N 2176300N 2176300N 2176400N 2176400N 2176500N 2176500N 2176600N 2176600N 2176700N 2176700N 2176800N 2176800N 2176900N 2176900N 2177000N 2177000N IXTACA - 2100 LE VE L S HOWING E STIMATE D Au ( g/t) Ixtaca - S - K 1300 Technical Report Summary Page 199 of 326 LE GE ND Au > 0.0 < 0.2 g/t Au >= 0.2 < 0.4 g/t Au >= 0.4 < 0.6 g/t Au >= 0.6 < 0.8 g/t Au >= 0.8 < 1.0 g/t Au >= 1.0 g/t Composits shown 3 m above and below bench

Ixtaca - S - K 1300 Technical Report Summary 11 . 9 Qualified Person’s Opinion As of the effective date of this report, the QP is of the opinion that issues relating to relevant technical and economic factors likely to influence the prospect of economic extraction were addressed adequately using the appropriate methodology based on the information provided . Ixtaca - S - K 1300 Technical Report Summary Page 200 of 326
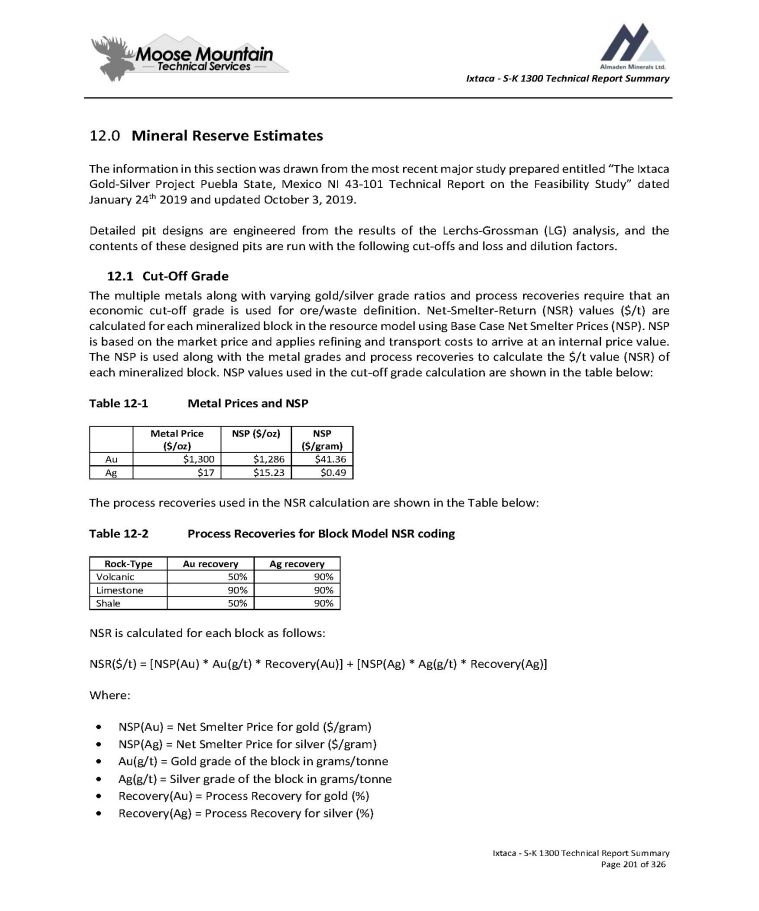
Ixtaca - S - K 1300 Technical Report Summary 12.0 Mineral Reserve Estimates The information in this section was drawn from the most recent major study prepared entitled “The Ixtaca Gold - Silver Project Puebla State, Mexico NI 43 - 101 Technical Report on the Feasibility Study” dated January 24 th 2019 and updated October 3 , 2019 . Detailed pit designs are engineered from the results of the Lerchs - Grossman (LG) analysis, and the contents of these designed pits are run with the following cut - offs and loss and dilution factors . 12 . 1 Cut - Off Grade The multiple metals along with varying gold/silver grade ratios and process recoveries require that an economic cut - off grade is used for ore/waste definition . Net - Smelter - Return (NSR) values ( $ /t) are calculated for each mineralized block in the resource model using Base Case Net Smelter Prices (NSP) . NSP is based on the market price and applies refining and transport costs to arrive at an internal price value . The NSP is used along with the metal grades and process recoveries to calculate the $ /t value (NSR) of each mineralized block . NSP values used in the cut - off grade calculation are shown in the table below : Table 12 - 1 Metal Prices and NSP Ixtaca - S - K 1300 Technical Report Summary Page 201 of 326 NSP ($/gram) NSP ($/oz) Metal Price ($/oz) $41.36 $1,286 $1,300 Au $0.49 $15.23 $17 Ag The process recoveries used in the NSR calculation are shown in the Table below: Table 12 - 2 Process Recoveries for Block Model NSR coding Ag recovery Au recovery Rock - Type 90% 50% Volcanic 90% 90% Limestone 90% 50% Shale NSR is calculated for each block as follows: NSR($/t) = [NSP(Au) * Au(g/t) * Recovery(Au)] + [NSP(Ag) * Ag(g/t) * Recovery(Ag)] Where: NSP(Au) = Net Smelter Price for gold ($/gram) NSP(Ag) = Net Smelter Price for silver ($/gram) Au(g/t) = Gold grade of the block in grams/tonne Ag(g/t) = Silver grade of the block in grams/tonne Recovery(Au) = Process Recovery for gold (%) Recovery(Ag) = Process Recovery for silver (%)
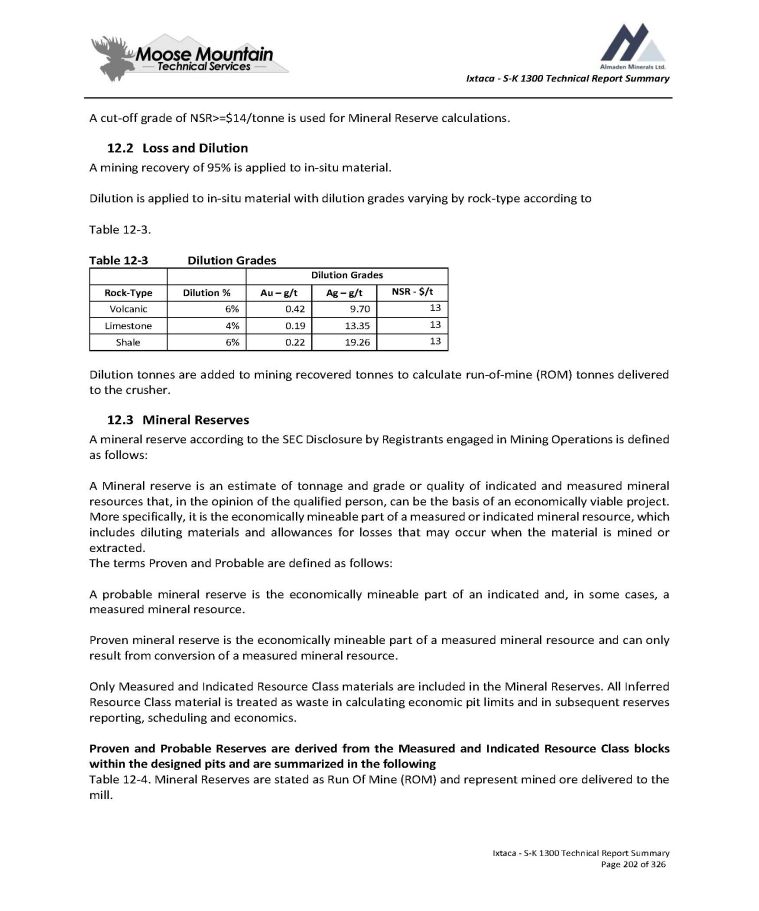
Ixtaca - S - K 1300 Technical Report Summary A cut - off grade of NSR>=$14/tonne is used for Mineral Reserve calculations. 12.2 Loss and Dilution A mining recovery of 95% is applied to in - situ material. Dilution is applied to in - situ material with dilution grades varying by rock - type according to Table 12 - 3. Ixtaca - S - K 1300 Technical Report Summary Page 202 of 326 Table 12 - 3 Dilution Grades Dilution Grades NSR - $/t Ag – g/t Au – g/t Dilution % Rock - Type 13 9.70 0.42 6% Volcanic 13 13.35 0.19 4% Limestone 13 19.26 0.22 6% Shale Dilution tonnes are added to mining recovered tonnes to calculate run - of - mine (ROM) tonnes delivered to the crusher . 12.3 Mineral Reserves A mineral reserve according to the SEC Disclosure by Registrants engaged in Mining Operations is defined as follows : A Mineral reserve is an estimate of tonnage and grade or quality of indicated and measured mineral resources that, in the opinion of the qualified person, can be the basis of an economically viable project . More specifically, it is the economically mineable part of a measured or indicated mineral resource, which includes diluting materials and allowances for losses that may occur when the material is mined or extracted . The terms Proven and Probable are defined as follows : A probable mineral reserve is the economically mineable part of an indicated and, in some cases, a measured mineral resource . Proven mineral reserve is the economically mineable part of a measured mineral resource and can only result from conversion of a measured mineral resource . Only Measured and Indicated Resource Class materials are included in the Mineral Reserves . All Inferred Resource Class material is treated as waste in calculating economic pit limits and in subsequent reserves reporting, scheduling and economics . Proven and Probable Reserves are derived from the Measured and Indicated Resource Class blocks within the designed pits and are summarized in the following Table 12 - 4 . Mineral Reserves are stated as Run Of Mine (ROM) and represent mined ore delivered to the mill .
Ixtaca - S - K 1300 Technical Report Summary Table 12 - 4 Ixtaca - S - K 1300 Technical Report Summary Page 203 of 326 Mineral Reserves Contained Metal Diluted Average Grades ROM Tonnes Ag - '000 ozs Au - '000 ozs Ag (g/t) Au (g/t) (millions) 44,273 714 43.5 0.70 31.6 Proven 40,887 673 30.7 0.51 41.4 Probable 85,159 1,387 36.3 0.59 73.1 TOTAL Notes to Mineral Reserve table : Mineral Reserves have an effective date of November 30 , 2018 . The qualified person responsible for the Mineral Reserves is Jesse Aarsen, P . Eng of Moose Mountain Technical Services . The cut - off grade used for ore/waste determination is NSR>= $ 14 /t All Mineral Reserves in this table are Proven and Probable Mineral Reserves . The Mineral Reserves are not in addition to the Mineral Resources but are a subset thereof . All Mineral Reserves stated above account for mining loss and dilution . Associated metallurgical recoveries (gold and silver, respectively) have been estimated as 90 % and 90 % for limestone, 50 % and 90 % for volcanic, 50 % and 90 % for black shale . Reserves are based on a US $ 1 , 300 /oz gold price, US $ 17 /oz silver price and an exchange rate of US $ 1 . 00 : MXP 20 . 00 . Reserves are converted from resources through the process of pit optimization, pit design, production schedule and supported by a positive cash flow model . Rounding as required by reporting guidelines may result in summation differences . 12 . 4 Qualified Person’s Opinion Mineral reserve estimates consider modifying factors such as technical, economic, environmental, and regulatory parameters containing inherent risks . Changes to these modifying factors can directly affect the operating performance of the mine . As of the effective date of this report, the QP is of the opinion that based on the information provided the risks associated with aspects of the modifying factors were handled using appropriate methodology mitigating any material changes associated with the modifying factors . 13.0 Mining Method The information in this section was drawn from the most recent major study prepared entitled “The Ixtaca Gold - Silver Project Puebla State, Mexico NI 43 - 101 Technical Report on the Feasibility Study” dated January 24 th 2019 and updated October 3 , 2019 . 13 . 1 Introduction A mine plan, mine production schedule, and mine capital and operating costs have been developed for the Project . The following section describes the results of the mine planning completed for this study, including : ultimate pit limits, pit phasing and designs, haul road and Rock Storage Facility (RSF) designs, mine production scheduling, mine operations planning, and mine fleet selection .
Ixtaca - S - K 1300 Technical Report Summary The mine engineering in this study has been done with the MineSight® suite of programs . The mining model considers whole block tonnes and grades . 2. Mining Study Basis 1. Mine Planning Datum Topography is based on a survey done using WorldView 2 satellite with 50 cm resolution in stereo . One metre contour lines generated from this survey are used to form the topography surface used for Mineral Reserve and volume calculations . 2. Resource Classes Only Measured and Indicated Resources are included in the Ixtaca mine plan . Inferred Resources are treated as waste . 3. Metallurgical Recovery for Mine Planning Metallurgical recoveries from mill feed are used for pit optimization and cut - off grade estimation . Recoveries vary by rock - type and are shown in the Table below . Table 13 - 1 Metallurgical Recovery Assumptions Ixtaca - S - K 1300 Technical Report Summary Page 204 of 326 Ag Recovery Au Recovery Rock - Type 90% 50% Volcanic 90% 90% Limestone 90% 50% Shale 4. Cut - off Grade Based on the multiple metals, varying metal grade ratios and varying process recoveries, an economic value for each block is calculated . The NSR ( $ /t) value takes in - situ grades, off - site prices, and process recoveries into account and is described in Section 12 . The cut - off grade used is NSR>= $ 14 . 5. Mining Dilution and Loss Mining recovery and dilution are applied to pit reserves . The in - situ resource estimate already includes internal dilution as whole block grades are considered . Additional mining dilution is added to the in - situ resources to account for the waste that is mined along the waste/ore contact edge . The greater number of waste contacts an ore block has, the higher amount of mining dilution expected . The dilution study performed calculates the total dilution percentages and grades by rock - type . Dilution grades calculated in the dilution study are shown in Section 12 . Mining recovery includes mining losses along the ore/waste boundary and plus other losses during material handling . Mining recovery is 95 % for all rock - types . 13 . 2 . 5 . 1 Mining Recovery of Low - Grade Material An elevated cut - off grade is used in the early parts of the mining schedule to improve the project economics . Marginally economic material is placed in a stockpile and reclaimed at various times throughout the mining schedule .
Ixtaca - S - K 1300 Technical Report Summary 3. Economic Pit Limits The economic pit limit is determined using the Lerchs Grossman (LG) algorithm . The algorithm considers the grades and tonnages for each block in the 3 D block model and compares the expected costs to extract and process the block to the potential revenue from processing the block (if the block has grade in it) . Each block is assigned with a net value (either positive or negative) . Pit wall angle inputs determine which upper blocks need to be mined to extract lower economic blocks . The routine uses input economic and engineering parameters and expands upwards and outwards until the net value sum of all the blocks extracted reach break - even economics . In this study, various cases or pit shells are generated by varying the input gold price and comparing the resultant waste and mill feed tonnages along with gold grades for each pit shell . Additional cases are included in the analysis to evaluate the sensitivities of resources to process costs, mining cost, and recoveries . By varying the economic parameters while keeping inputs for metallurgical recoveries, pit slopes, and processing costs constant, successively larger pit cases are evaluated to determine where the incremental pit shells produce marginal or negative economic returns . The change from positive to negative economic returns results from increasing strip ratios and higher mining costs associated with larger and deeper pit shells . The economic margins from the expanded cases are evaluated on a relative basis to test for payback on capital and return for the project . At some point, further expansion does not add significant value . An ultimate pit limit can then be chosen that has a suitable economic return . The chosen pit shell is used as the basis for more detailed design and mine scheduling . 1. LG Cost Inputs Potential block revenues are calculated based on the gold and silver price, metallurgical recoveries and gold/silver grades within each block . For this analysis a Net Smelter Return (NSR) value in $ /tonne is used which considers the Net Smelter Price (NSP), process recoveries and metal grades . NSP and NSR are described in Section 12 . The following operating costs are used in the LG algorithm against the block NSR value to generate pit shells . Table 13 - 2 LG Operating Cost Inputs Ixtaca - S - K 1300 Technical Report Summary Page 205 of 326 Cost ($/tonne) Activity $1.70 Base Mining Cost $12.50 $/tonne mill feed Process Cost The pit rim is selected at the south end of the deposit where the primary crusher is located and is at 2250 m elevation . Process cost includes conveyance from the primary crusher and ore sorter at the pit rim to the mill . 13 . 3 . 2 LG Slope Inputs Geotechnical parameters are provided for the Ixtaca open pit . These parameters prescribe bench face angles, berm widths and inter - ramp slope angles for different azimuths and rock types within the potential open pit .
Ixtaca - S - K 1300 Technical Report Summary The following tables show pit slope inputs used for generating the Ixtaca LG pit shells. Table 13 - 3 Bench Face Angles Ixtaca - S - K 1300 Technical Report Summary Page 206 of 326 115 110 075 070 000 Azimuth Start ( o ) 360 115 110 075 070 Azimuth End ( o ) 70 o 70 o 70 o 70 o 70 o Volcanic 72 o 72 o 72 o 72 o 72 o Limestone/Shale Table 13 - 4 Inter - Ramp Angles (Final) 100 040 000 Azimuth Start ( o ) 360 100 040 Azimuth End ( o ) 43 o 43 o 43 o Volcanic 48 o 48 o 48 o Limestone 48 o 45 o 48 o Shale 13 . 3 . 3 LG Sensitivity Cases The economic pit limits are based on the estimated costs and current metal price assumptions but are applied to approximately 15 years of mine life . Since these economic parameters are estimates, especially gold price, the sensitivity of the ultimate economic pit limits has been evaluated . This is done by varying the economic parameters in a series of cases . The pit shells generated from these cases are also used to evaluate potential pit pushbacks or phases . For this analysis the input gold price is varied from $ 390 USD/oz to $ 1 , 690 USD/oz while silver price is varied from $ 5 . 10 USD/oz to $ 22 . 10 USD/oz . The operating costs are kept constant in this analysis . This is not a price sensitivity, as cut - off grades are not varied when calculating the contents of the resultant pit shells . Mining recovery and dilution is not included at the LG level of design since it is determined that these factors do not have an impact on the ultimate pit limit selection . Only Measured and Indicated Resource classes are used in the LG economics . Inferred Resource class is considered as waste . The figure below shows the generated LG pit shells for Ixtaca . Pit resources are generated for each price case using a cut - off grade of NSR>= $ 12 . 50 (process cost) .
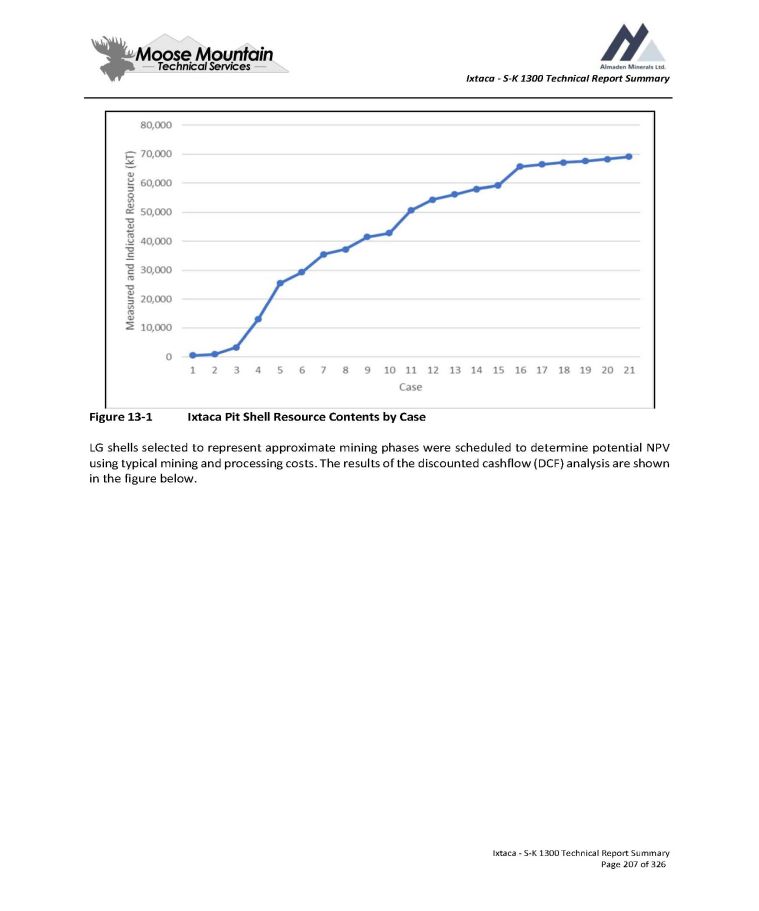
Ixtaca - S - K 1300 Technical Report Summary Figure 13 - 1 Ixtaca Pit Shell Resource Contents by Case LG shells selected to represent approximate mining phases were scheduled to determine potential NPV using typical mining and processing costs . The results of the discounted cashflow (DCF) analysis are shown in the figure below . Ixtaca - S - K 1300 Technical Report Summary Page 207 of 326
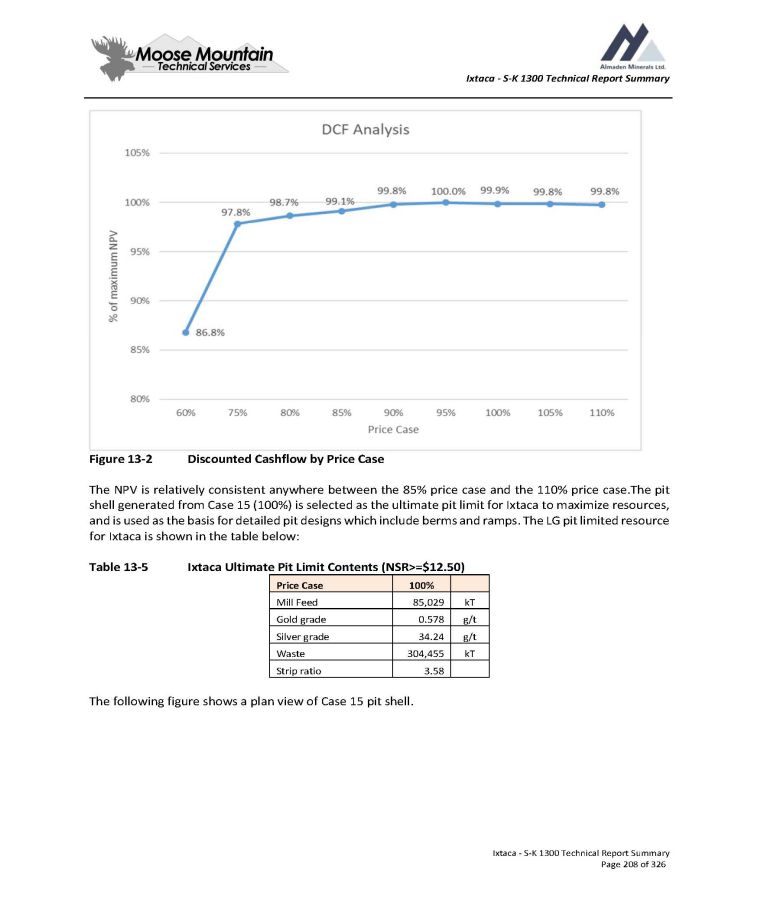
Ixtaca - S - K 1300 Technical Report Summary Figure 13 - 2 Discounted Cashflow by Price Case The NPV is relatively consistent anywhere between the 85 % price case and the 110 % price case . The pit shell generated from Case 15 ( 100 % ) is selected as the ultimate pit limit for Ixtaca to maximize resources, and is used as the basis for detailed pit designs which include berms and ramps . The LG pit limited resource for Ixtaca is shown in the table below : Table 13 - 5 Ixtaca Ultimate Pit Limit Contents (NSR>= $ 12 . 50 ) 100% Price Case kT 85,029 Mill Feed g/t 0.578 Gold grade g/t 34.24 Silver grade kT 304,455 Waste 3.58 Strip ratio The following figure shows a plan view of Case 15 pit shell. Ixtaca - S - K 1300 Technical Report Summary Page 208 of 326
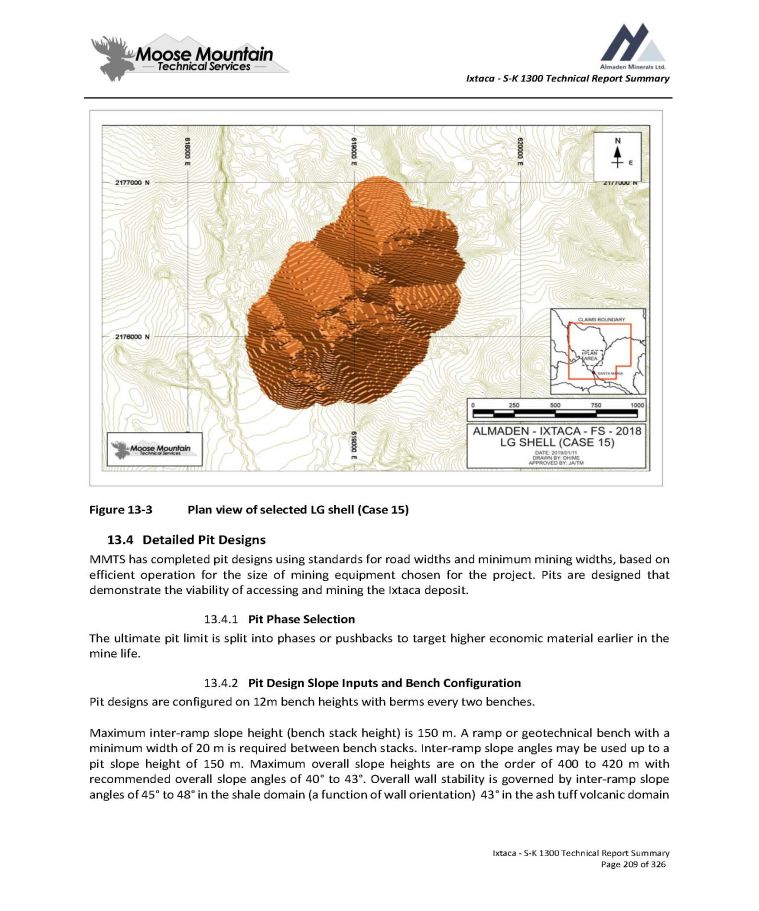
Ixtaca - S - K 1300 Technical Report Summary Figure 13 - 3 Plan view of selected LG shell (Case 15 ) 4. Detailed Pit Designs MMTS has completed pit designs using standards for road widths and minimum mining widths, based on efficient operation for the size of mining equipment chosen for the project . Pits are designed that demonstrate the viability of accessing and mining the Ixtaca deposit . 1. Pit Phase Selection The ultimate pit limit is split into phases or pushbacks to target higher economic material earlier in the mine life . 2. Pit Design Slope Inputs and Bench Configuration Pit designs are configured on 12 m bench heights with berms every two benches . Maximum inter - ramp slope height (bench stack height) is 150 m . A ramp or geotechnical bench with a minimum width of 20 m is required between bench stacks . Inter - ramp slope angles may be used up to a pit slope height of 150 m . Maximum overall slope heights are on the order of 400 to 420 m with recommended overall slope angles of 40 Σ to 43 Σ . Overall wall stability is governed by inter - ramp slope angles of 45 Σ to 48 Σ in the shale domain (a function of wall orientation) 43 Σ in the ash tuff volcanic domain Ixtaca - S - K 1300 Technical Report Summary Page 209 of 326
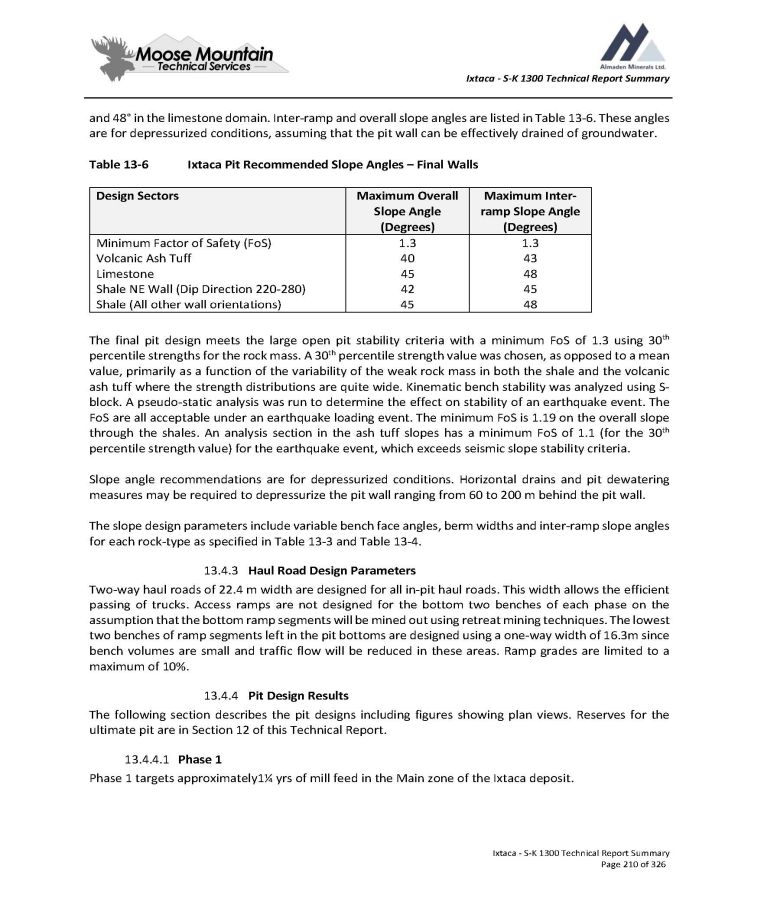
Ixtaca - S - K 1300 Technical Report Summary and 48 Σ in the limestone domain. Inter - ramp and overall slope angles are listed in Table 13 - 6. These angles are for depressurized conditions, assuming that the pit wall can be effectively drained of groundwater. Table 13 - 6 Ixtaca Pit Recommended Slope Angles – Final Walls Ixtaca - S - K 1300 Technical Report Summary Page 210 of 326 Maximum Inter - ramp Slope Angle (Degrees) Maximum Overall Slope Angle (Degrees) Design Sectors 1.3 1.3 Minimum Factor of Safety (FoS) 43 40 Volcanic Ash Tuff 48 45 Limestone 45 42 Shale NE Wall (Dip Direction 220 - 280) 48 45 Shale (All other wall orientations) The final pit design meets the large open pit stability criteria with a minimum FoS of 1 . 3 using 30 th percentile strengths for the rock mass . A 30 th percentile strength value was chosen, as opposed to a mean value, primarily as a function of the variability of the weak rock mass in both the shale and the volcanic ash tuff where the strength distributions are quite wide . Kinematic bench stability was analyzed using S - block . A pseudo - static analysis was run to determine the effect on stability of an earthquake event . The FoS are all acceptable under an earthquake loading event . The minimum FoS is 1 . 19 on the overall slope through the shales . An analysis section in the ash tuff slopes has a minimum FoS of 1 . 1 (for the 30 th percentile strength value) for the earthquake event, which exceeds seismic slope stability criteria . Slope angle recommendations are for depressurized conditions . Horizontal drains and pit dewatering measures may be required to depressurize the pit wall ranging from 60 to 200 m behind the pit wall . The slope design parameters include variable bench face angles, berm widths and inter - ramp slope angles for each rock - type as specified in Table 13 - 3 and Table 13 - 4 . 3. Haul Road Design Parameters Two - way haul roads of 22 . 4 m width are designed for all in - pit haul roads . This width allows the efficient passing of trucks . Access ramps are not designed for the bottom two benches of each phase on the assumption that the bottom ramp segments will be mined out using retreat mining techniques . The lowest two benches of ramp segments left in the pit bottoms are designed using a one - way width of 16 . 3 m since bench volumes are small and traffic flow will be reduced in these areas . Ramp grades are limited to a maximum of 10 % . 4. Pit Design Results The following section describes the pit designs including figures showing plan views . Reserves for the ultimate pit are in Section 12 of this Technical Report . 13.4.4.1 Phase 1 Phase 1 targets approximately 1 ¼ yrs of mill feed in the Main zone of the Ixtaca deposit .
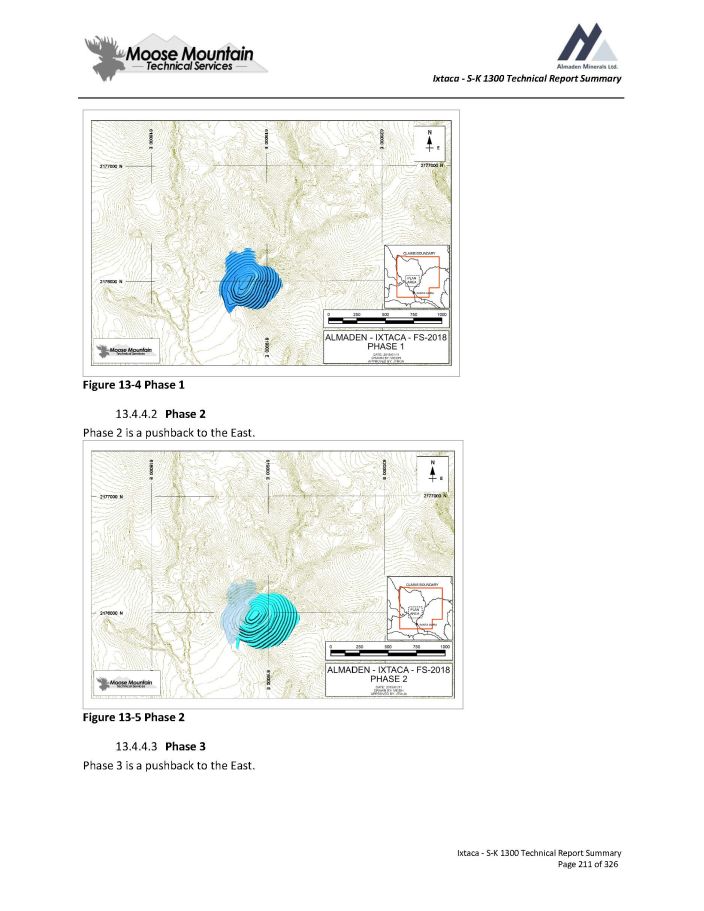
Ixtaca - S - K 1300 Technical Report Summary Figure 13 - 4 Phase 1 13.4.4.2 Phase 2 Phase 2 is a pushback to the East. Figure 13 - 5 Phase 2 13.4.4.3 Phase 3 Phase 3 is a pushback to the East. Ixtaca - S - K 1300 Technical Report Summary Page 211 of 326
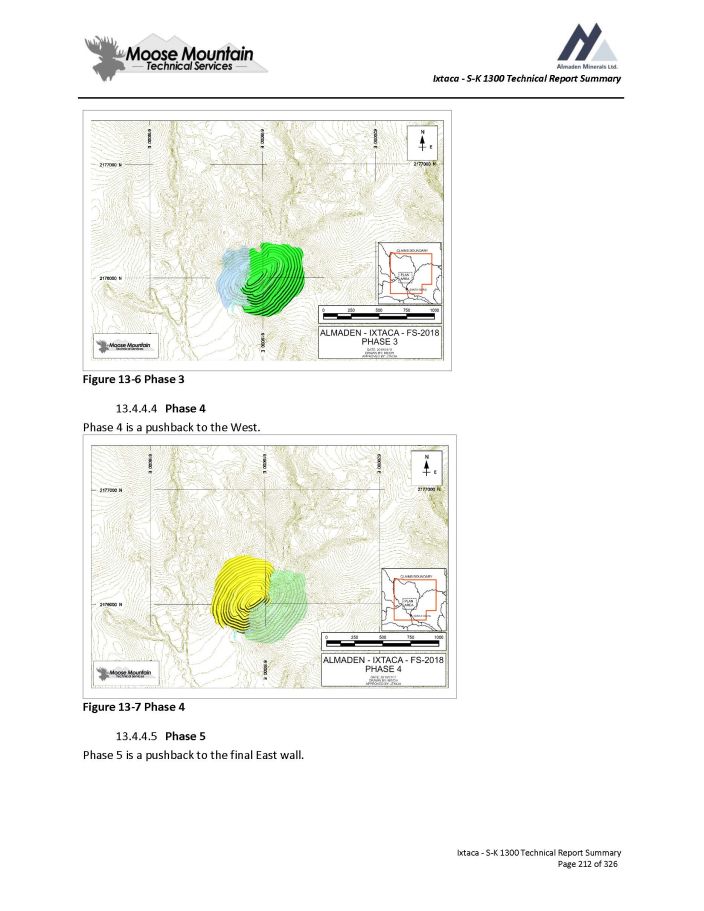
Ixtaca - S - K 1300 Technical Report Summary Figure 13 - 6 Phase 3 13.4.4.4 Phase 4 Phase 4 is a pushback to the West. Figure 13 - 7 Phase 4 13.4.4.5 Phase 5 Phase 5 is a pushback to the final East wall. Ixtaca - S - K 1300 Technical Report Summary Page 212 of 326
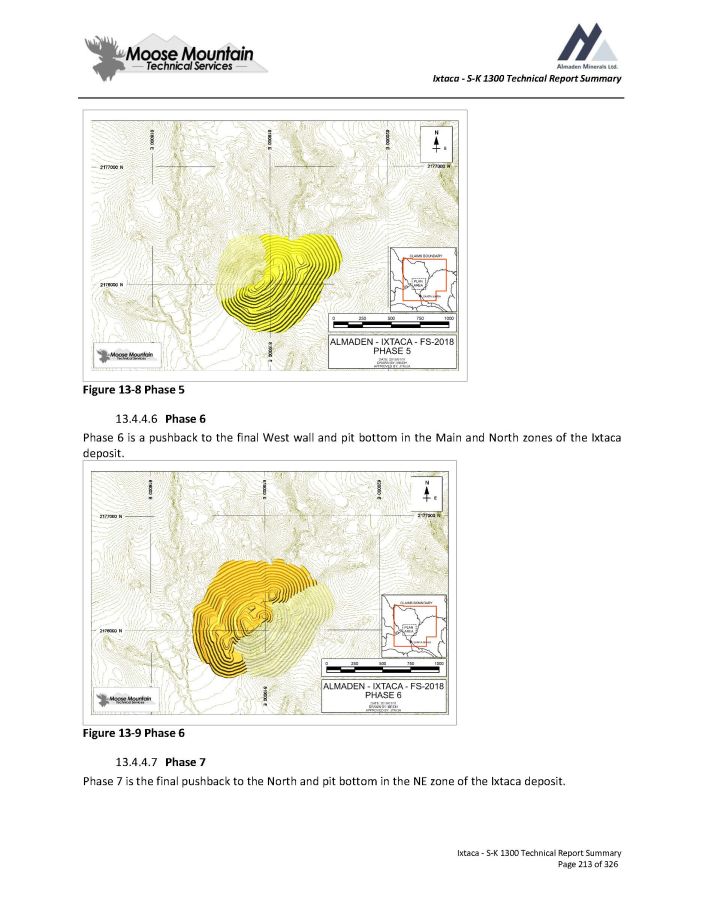
Ixtaca - S - K 1300 Technical Report Summary Figure 13 - 8 Phase 5 13.4.4.6 Phase 6 Phase 6 is a pushback to the final West wall and pit bottom in the Main and North zones of the Ixtaca deposit. Figure 13 - 9 Phase 6 13.4.4.7 Phase 7 Phase 7 is the final pushback to the North and pit bottom in the NE zone of the Ixtaca deposit. Ixtaca - S - K 1300 Technical Report Summary Page 213 of 326
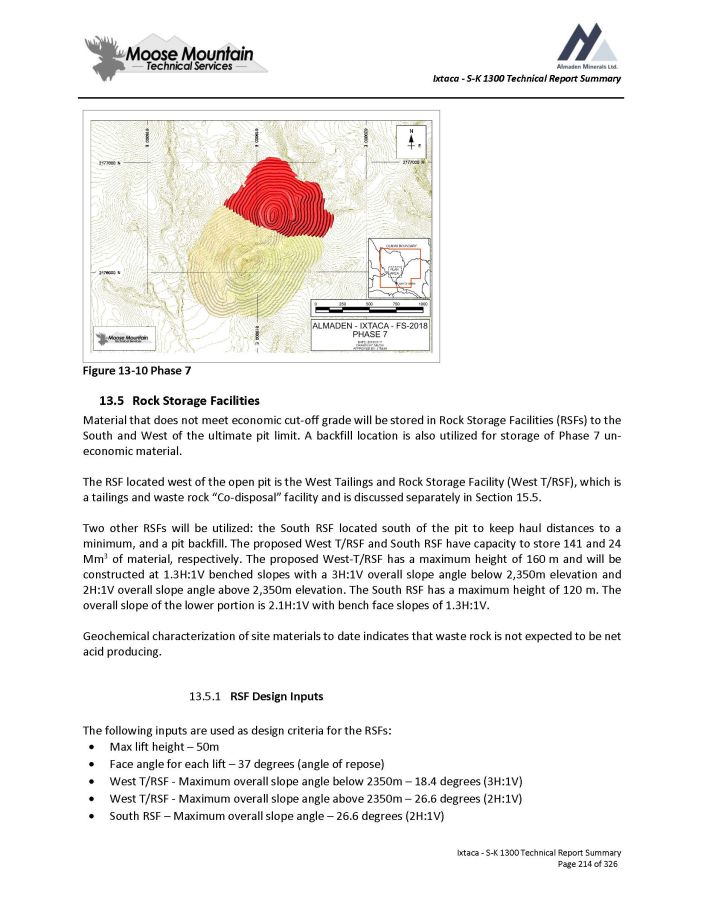
Ixtaca - S - K 1300 Technical Report Summary Figure 13 - 10 Phase 7 5. Rock Storage Facilities Material that does not meet economic cut - off grade will be stored in Rock Storage Facilities (RSFs) to the South and West of the ultimate pit limit . A backfill location is also utilized for storage of Phase 7 un - economic material . The RSF located west of the open pit is the West Tailings and Rock Storage Facility (West T/RSF), which is a tailings and waste rock “Co - disposal” facility and is discussed separately in Section 15.5. Two other RSFs will be utilized : the South RSF located south of the pit to keep haul distances to a minimum, and a pit backfill . The proposed West T/RSF and South RSF have capacity to store 141 and 24 Mm 3 of material, respectively . The proposed West - T/RSF has a maximum height of 160 m and will be constructed at 1 . 3 H : 1 V benched slopes with a 3 H : 1 V overall slope angle below 2 , 350 m elevation and 2 H : 1 V overall slope angle above 2 , 350 m elevation . The South RSF has a maximum height of 120 m . The overall slope of the lower portion is 2 . 1 H : 1 V with bench face slopes of 1 . 3 H : 1 V . Geochemical characterization of site materials to date indicates that waste rock is not expected to be net acid producing . 1. RSF Design Inputs The following inputs are used as design criteria for the RSFs: Max lift height – 50m Face angle for each lift – 37 degrees (angle of repose) West T/RSF - Maximum overall slope angle below 2350m – 18.4 degrees (3H:1V) West T/RSF - Maximum overall slope angle above 2350m – 26.6 degrees (2H:1V) South RSF – Maximum overall slope angle – 26.6 degrees (2H:1V) Ixtaca - S - K 1300 Technical Report Summary Page 214 of 326
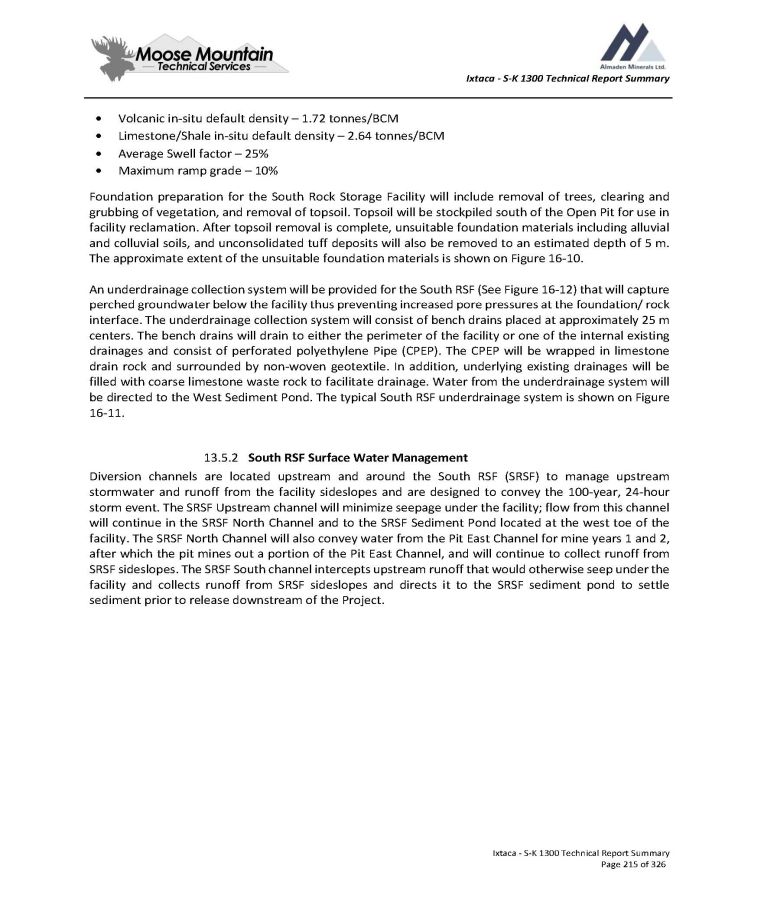
Ixtaca - S - K 1300 Technical Report Summary Volcanic in - situ default density – 1.72 tonnes/BCM Limestone/Shale in - situ default density – 2.64 tonnes/BCM Average Swell factor – 25% Maximum ramp grade – 10% Foundation preparation for the South Rock Storage Facility will include removal of trees, clearing and grubbing of vegetation, and removal of topsoil . Topsoil will be stockpiled south of the Open Pit for use in facility reclamation . After topsoil removal is complete, unsuitable foundation materials including alluvial and colluvial soils, and unconsolidated tuff deposits will also be removed to an estimated depth of 5 m . The approximate extent of the unsuitable foundation materials is shown on Figure 16 - 10 . An underdrainage collection system will be provided for the South RSF (See Figure 16 - 12 ) that will capture perched groundwater below the facility thus preventing increased pore pressures at the foundation/ rock interface . The underdrainage collection system will consist of bench drains placed at approximately 25 m centers . The bench drains will drain to either the perimeter of the facility or one of the internal existing drainages and consist of perforated polyethylene Pipe (CPEP) . The CPEP will be wrapped in limestone drain rock and surrounded by non - woven geotextile . In addition, underlying existing drainages will be filled with coarse limestone waste rock to facilitate drainage . Water from the underdrainage system will be directed to the West Sediment Pond . The typical South RSF underdrainage system is shown on Figure 16 - 11 . 13 . 5 . 2 South RSF Surface Water Management Diversion channels are located upstream and around the South RSF (SRSF) to manage upstream stormwater and runoff from the facility sideslopes and are designed to convey the 100 - year, 24 - hour storm event . The SRSF Upstream channel will minimize seepage under the facility ; flow from this channel will continue in the SRSF North Channel and to the SRSF Sediment Pond located at the west toe of the facility . The SRSF North Channel will also convey water from the Pit East Channel for mine years 1 and 2 , after which the pit mines out a portion of the Pit East Channel, and will continue to collect runoff from SRSF sideslopes . The SRSF South channel intercepts upstream runoff that would otherwise seep under the facility and collects runoff from SRSF sideslopes and directs it to the SRSF sediment pond to settle sediment prior to release downstream of the Project . Ixtaca - S - K 1300 Technical Report Summary Page 215 of 326
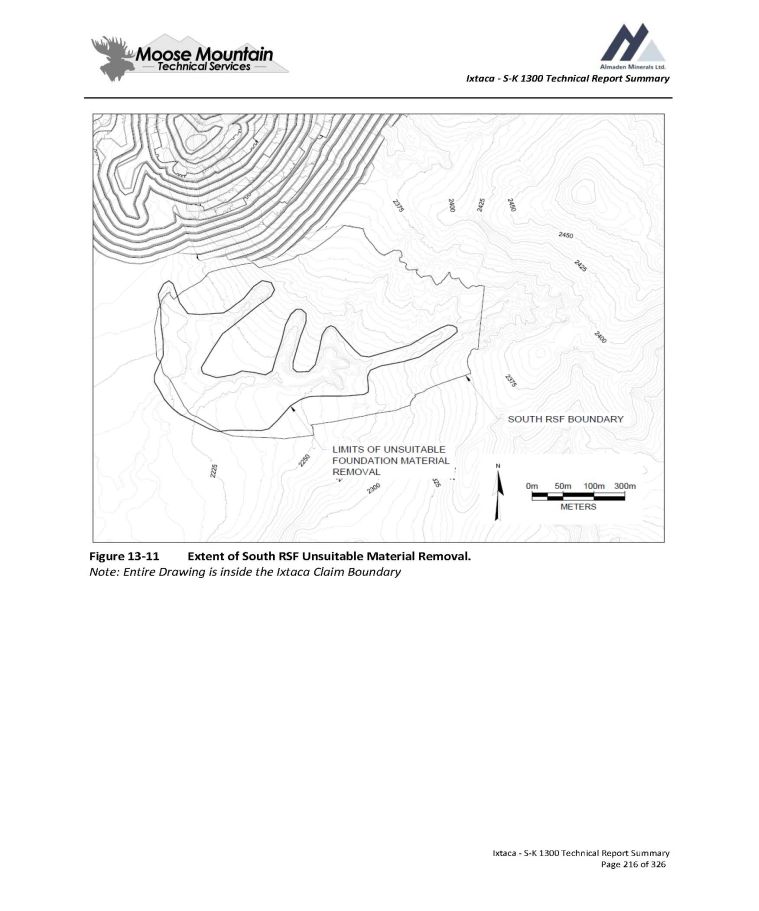
Ixtaca - S - K 1300 Technical Report Summary Figure 13 - 11 Extent of South RSF Unsuitable Material Removal. Note: Entire Drawing is inside the Ixtaca Claim Boundary Ixtaca - S - K 1300 Technical Report Summary Page 216 of 326
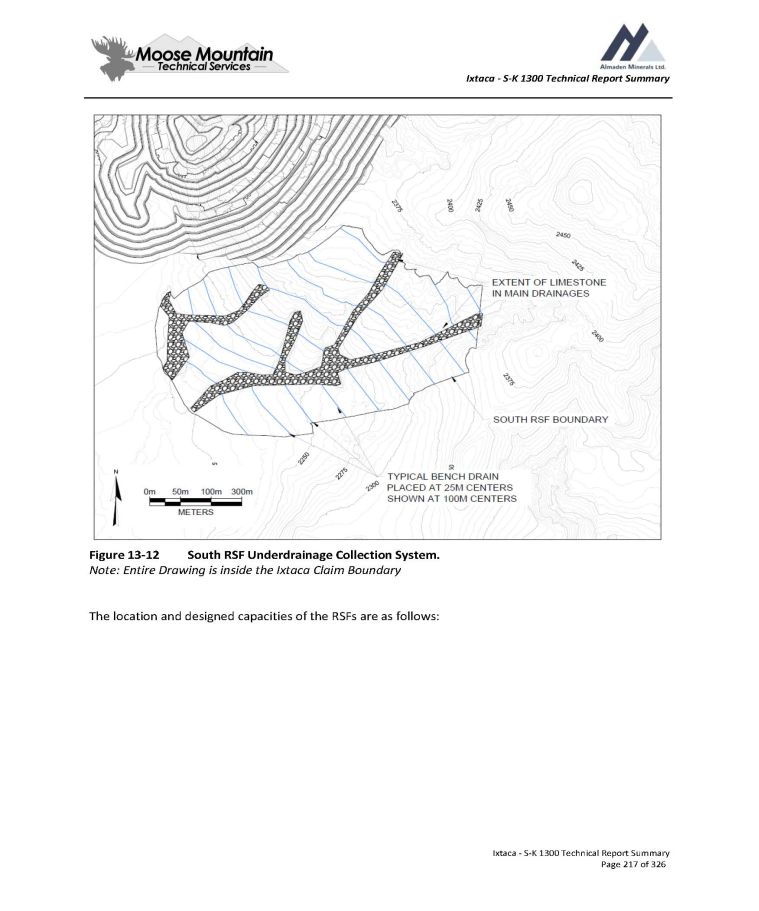
Ixtaca - S - K 1300 Technical Report Summary Figure 13 - 12 South RSF Underdrainage Collection System. Note: Entire Drawing is inside the Ixtaca Claim Boundary The location and designed capacities of the RSFs are as follows: Ixtaca - S - K 1300 Technical Report Summary Page 217 of 326
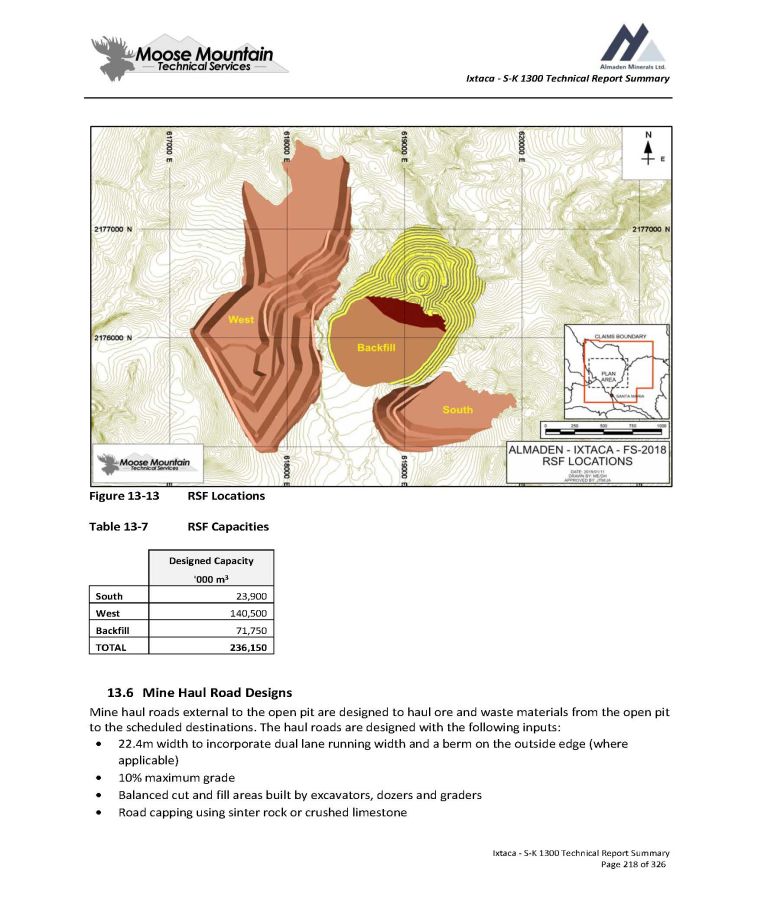
Ixtaca - S - K 1300 Technical Report Summary Figure 13 - 13 RSF Locations Table 13 - 7 RSF Capacities Designed Capacity '000 m 3 23,900 South 140,500 West 71,750 Backfill 236,150 TOTAL 13.6 Mine Haul Road Designs Mine haul roads external to the open pit are designed to haul ore and waste materials from the open pit to the scheduled destinations. The haul roads are designed with the following inputs: 22.4m width to incorporate dual lane running width and a berm on the outside edge (where applicable) 10% maximum grade Balanced cut and fill areas built by excavators, dozers and graders Road capping using sinter rock or crushed limestone Ixtaca - S - K 1300 Technical Report Summary Page 218 of 326

Ixtaca - S - K 1300 Technical Report Summary 13 . 7 Ore Stockpiles When ore is mined from the pit it will either be delivered to the primary crusher or the ore stockpile . The grade of the material sent to the ore stockpile each year is dependent on the best economics determined by the mine scheduling program . Ore is stockpiled on the upper lift of the South RSF . The maximum stockpile size is 22 . 7 M tonnes and occurs in Year 6 of operations . The ore stockpile is fully reclaimed at the end of the mine life . 13 . 8 Mine Production Schedule The mine production schedule for Ixtaca is developed with MineSight Strategic Planner (MSSP), a long range schedule optimizing tool . It is typically used to produce a life - of - mine schedule that will maximize the Net Present Value of a property subject to specified conditions and constraints . Inputs include production requirements, mine operating considerations, product prices, recoveries, destination capacities, equipment performance, haul cycle times and operating costs . From this the program develops an optimal production schedule from the given pit phase reserves . The open pit mine production schedule is based on the following parameters : One year of pre - production and pre - stripping Mill feed of 7,650tpd for Years 1 - 4, ramping up to 15,300tpd from Year 5 onwards Phased pit bench reserves are used as input to the mine production schedule Maximum 12 benches mined from a single phase in one year (1 bench per month) Maximum of 3 partial benches mined in a single period Ore tonnes mined in excess of the mill capacity is stockpiled Volcanic material crusher throughput is 34% higher than Limestone (due to the soft nature of Volcanic material) Shale material crusher throughput is 27% higher than Limestone The mine production schedule is shown in the following tables and graphs . Note that all gold and silver grades shown in the tables and graphs are diluted . Gold equivalent grade is calculated using the ratio of the base case metal prices ( $ 1 , 300 /oz for gold and $ 17 /oz for silver – results in ~ 76 : 1 silver to gold ratio) . Ore is reported using a cut - off grade of Diluted NSR>= $ 14 /tonne . Ixtaca - S - K 1300 Technical Report Summary Page 219 of 326
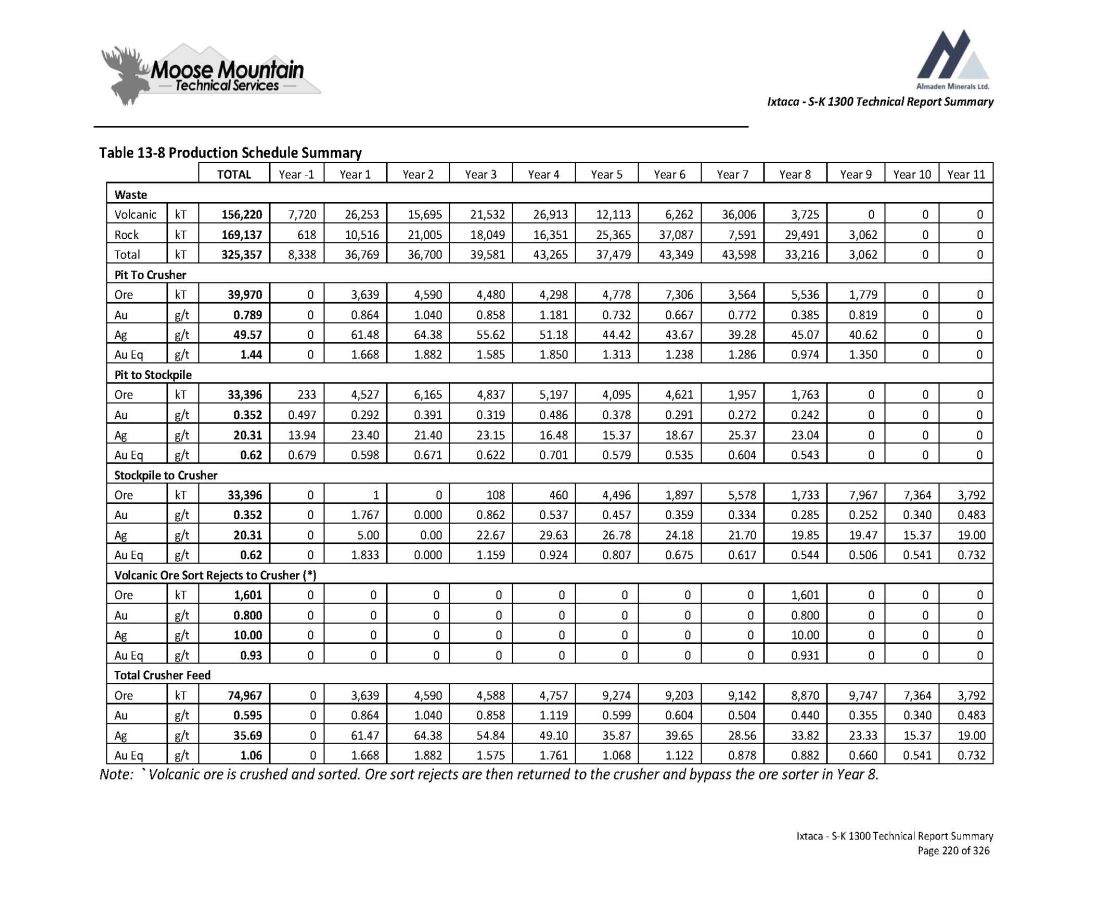
Ixtaca - S - K 1300 Technical Report Summary Ixtaca - S - K 1300 Technical Report Summary Page 220 of 326 Table 13 - 8 Production Schedule Summary Year 11 Year 10 Year 9 Year 8 Year 7 Year 6 Year 5 Year 4 Year 3 Year 2 Year 1 Year - 1 TOTAL Waste 0 0 0 3,725 36,006 6,262 12,113 26,913 21,532 15,695 26,253 7,720 156,220 kT Volcanic 0 0 3,062 29,491 7,591 37,087 25,365 16,351 18,049 21,005 10,516 618 169,137 kT Rock 0 0 3,062 33,216 43,598 43,349 37,479 43,265 39,581 36,700 36,769 8,338 325,357 kT Total Pit To Crusher 0 0 1,779 5,536 3,564 7,306 4,778 4,298 4,480 4,590 3,639 0 39,970 kT Ore 0 0 0.819 0.385 0.772 0.667 0.732 1.181 0.858 1.040 0.864 0 0.789 g/t Au 0 0 40.62 45.07 39.28 43.67 44.42 51.18 55.62 64.38 61.48 0 49.57 g/t Ag 0 0 1.350 0.974 1.286 1.238 1.313 1.850 1.585 1.882 1.668 0 1.44 g/t Au Eq Pit to Stockpile 0 0 0 1,763 1,957 4,621 4,095 5,197 4,837 6,165 4,527 233 33,396 kT Ore 0 0 0 0.242 0.272 0.291 0.378 0.486 0.319 0.391 0.292 0.497 0.352 g/t Au 0 0 0 23.04 25.37 18.67 15.37 16.48 23.15 21.40 23.40 13.94 20.31 g/t Ag 0 0 0 0.543 0.604 0.535 0.579 0.701 0.622 0.671 0.598 0.679 0.62 g/t Au Eq Stockpile to Crusher 3,792 7,364 7,967 1,733 5,578 1,897 4,496 460 108 0 1 0 33,396 kT Ore 0.483 0.340 0.252 0.285 0.334 0.359 0.457 0.537 0.862 0.000 1.767 0 0.352 g/t Au 19.00 15.37 19.47 19.85 21.70 24.18 26.78 29.63 22.67 0.00 5.00 0 20.31 g/t Ag 0.732 0.541 0.506 0.544 0.617 0.675 0.807 0.924 1.159 0.000 1.833 0 0.62 g/t Au Eq Volcanic Ore Sort Rejects to Crusher (*) 0 0 0 1,601 0 0 0 0 0 0 0 0 1,601 kT Ore 0 0 0 0.800 0 0 0 0 0 0 0 0 0.800 g/t Au 0 0 0 10.00 0 0 0 0 0 0 0 0 10.00 g/t Ag 0 0 0 0.931 0 0 0 0 0 0 0 0 0.93 g/t Au Eq Total Crusher Feed 3,792 7,364 9,747 8,870 9,142 9,203 9,274 4,757 4,588 4,590 3,639 0 74,967 kT Ore 0.483 0.340 0.355 0.440 0.504 0.604 0.599 1.119 0.858 1.040 0.864 0 0.595 g/t Au 19.00 15.37 23.33 33.82 28.56 39.65 35.87 49.10 54.84 64.38 61.47 0 35.69 g/t Ag 0.732 0.541 0.660 0.882 0.878 1.122 1.068 1.761 1.575 1.882 1.668 0 1.06 g/t Au Eq Note: ` Volcanic ore is crushed and sorted. Ore sort rejects are then returned to the crusher and bypass the ore sorter in Year 8.
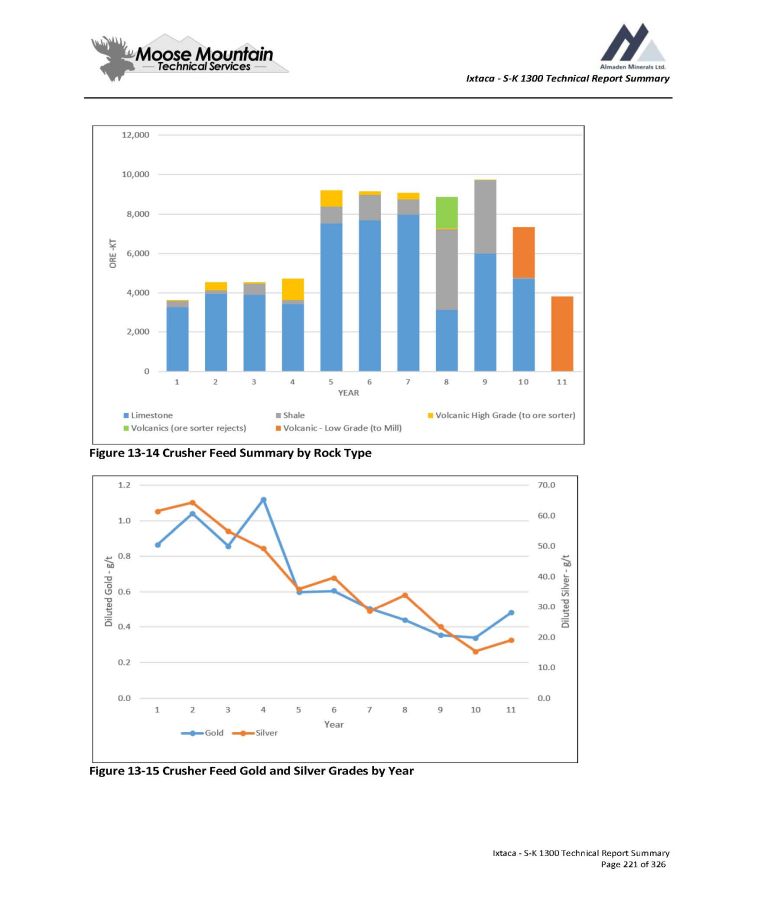
Ixtaca - S - K 1300 Technical Report Summary Figure 13 - 14 Crusher Feed Summary by Rock Type Figure 13 - 15 Crusher Feed Gold and Silver Grades by Year Ixtaca - S - K 1300 Technical Report Summary Page 221 of 326
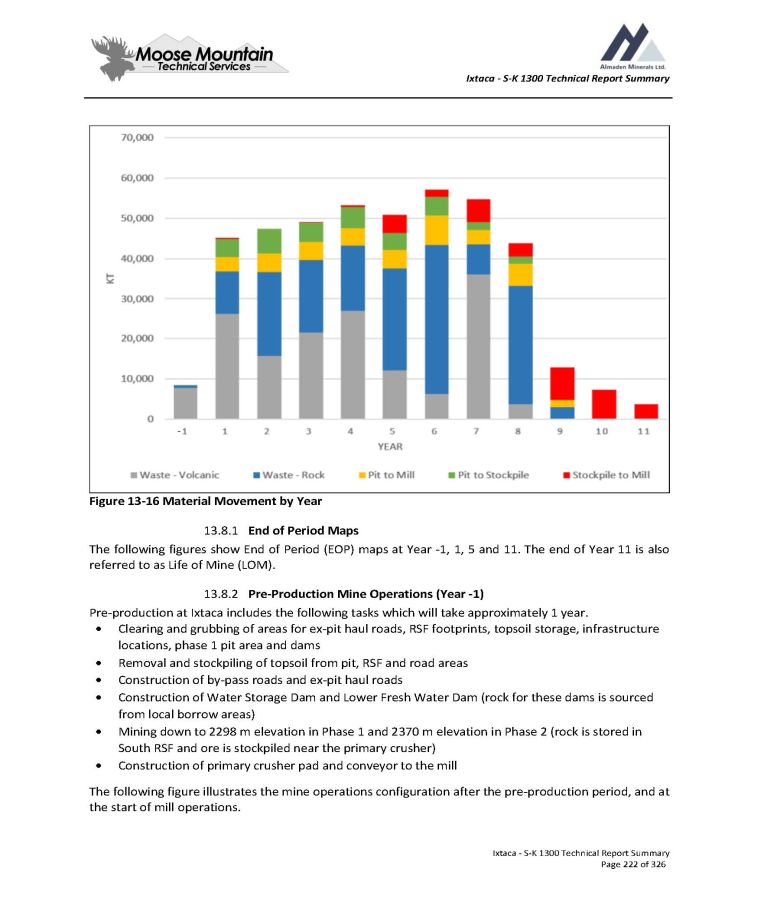
Ixtaca - S - K 1300 Technical Report Summary Figure 13 - 16 Material Movement by Year 1. End of Period Maps The following figures show End of Period (EOP) maps at Year - 1, 1, 5 and 11. The end of Year 11 is also referred to as Life of Mine (LOM). 2. Pre - Production Mine Operations (Year - 1) Pre - production at Ixtaca includes the following tasks which will take approximately 1 year. Clearing and grubbing of areas for ex - pit haul roads, RSF footprints, topsoil storage, infrastructure locations, phase 1 pit area and dams Removal and stockpiling of topsoil from pit, RSF and road areas Construction of by - pass roads and ex - pit haul roads Construction of Water Storage Dam and Lower Fresh Water Dam (rock for these dams is sourced from local borrow areas) Mining down to 2298 m elevation in Phase 1 and 2370 m elevation in Phase 2 (rock is stored in South RSF and ore is stockpiled near the primary crusher) Construction of primary crusher pad and conveyor to the mill The following figure illustrates the mine operations configuration after the pre - production period, and at the start of mill operations. Ixtaca - S - K 1300 Technical Report Summary Page 222 of 326
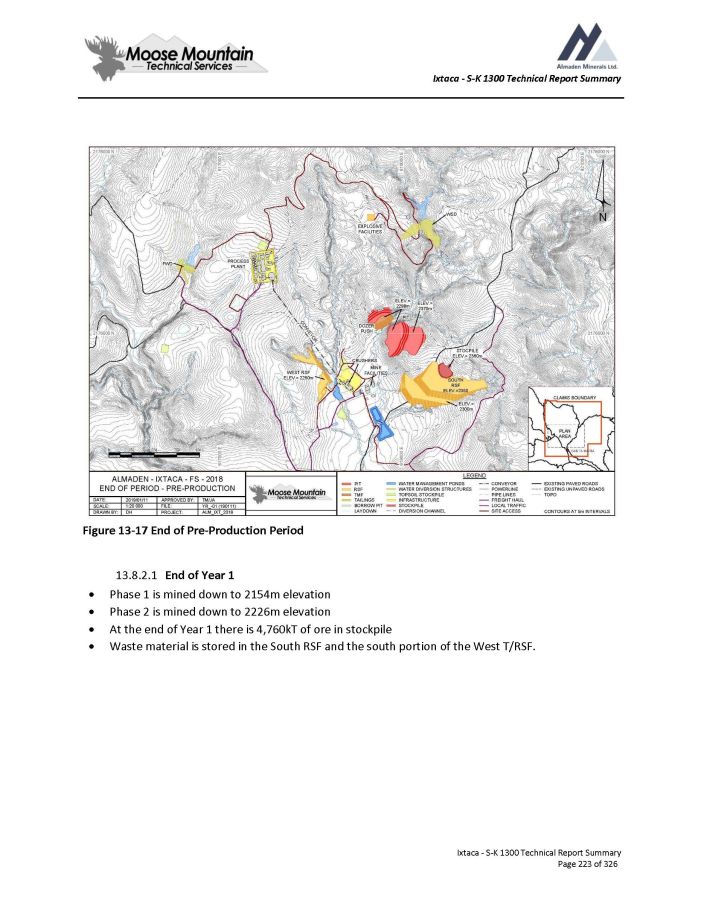
Ixtaca - S - K 1300 Technical Report Summary Figure 13 - 17 End of Pre - Production Period 13.8.2.1 End of Year 1 Phase 1 is mined down to 2154m elevation Phase 2 is mined down to 2226m elevation At the end of Year 1 there is 4,760kT of ore in stockpile Waste material is stored in the South RSF and the south portion of the West T/RSF. Ixtaca - S - K 1300 Technical Report Summary Page 223 of 326
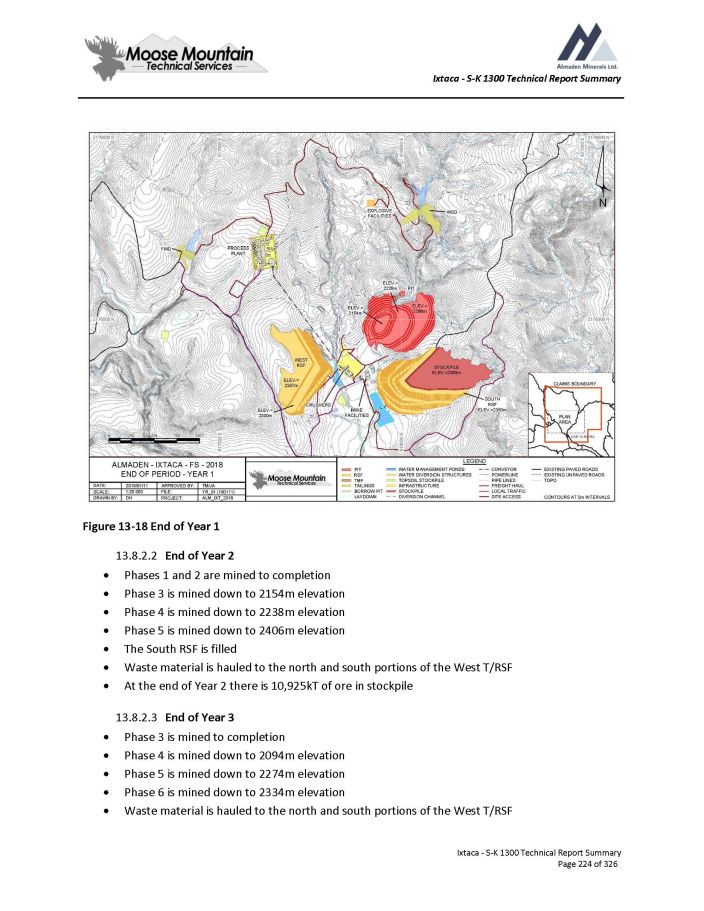
Ixtaca - S - K 1300 Technical Report Summary Figure 13 - 18 End of Year 1 13.8.2.2 End of Year 2 Phases 1 and 2 are mined to completion Phase 3 is mined down to 2154m elevation Phase 4 is mined down to 2238m elevation Phase 5 is mined down to 2406m elevation The South RSF is filled Waste material is hauled to the north and south portions of the West T/RSF At the end of Year 2 there is 10,925kT of ore in stockpile 13.8.2.3 End of Year 3 Phase 3 is mined to completion Phase 4 is mined down to 2094m elevation Phase 5 is mined down to 2274m elevation Phase 6 is mined down to 2334m elevation Waste material is hauled to the north and south portions of the West T/RSF Ixtaca - S - K 1300 Technical Report Summary Page 224 of 326
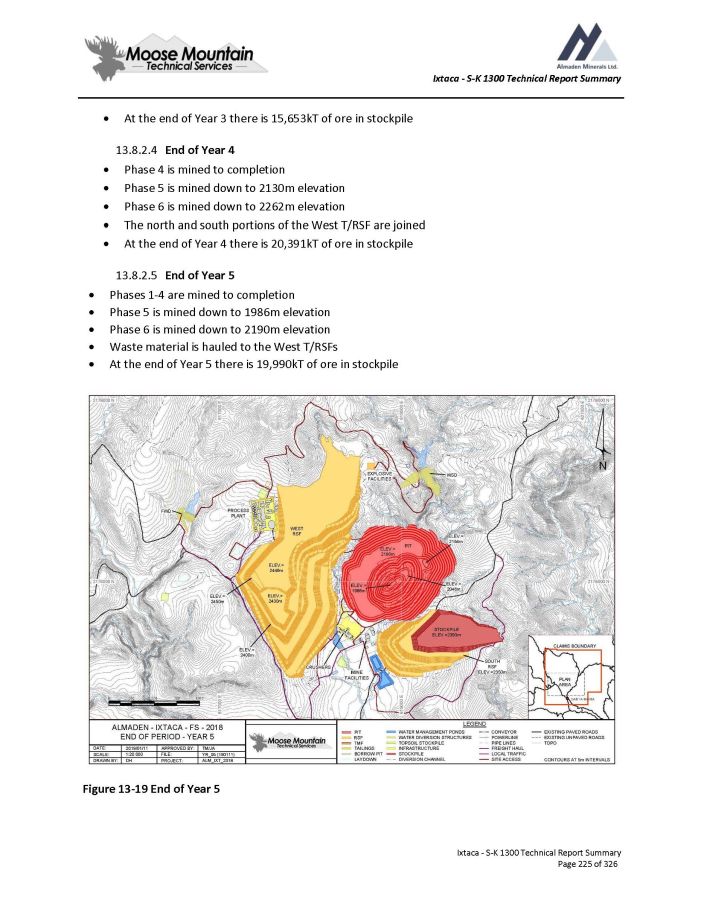
Ixtaca - S - K 1300 Technical Report Summary At the end of Year 3 there is 15,653kT of ore in stockpile 13.8.2.4 End of Year 4 Phase 4 is mined to completion Phase 5 is mined down to 2130m elevation Phase 6 is mined down to 2262m elevation The north and south portions of the West T/RSF are joined At the end of Year 4 there is 20,391kT of ore in stockpile 13.8.2.5 End of Year 5 Phases 1 - 4 are mined to completion Phase 5 is mined down to 1986m elevation Phase 6 is mined down to 2190m elevation Waste material is hauled to the West T/RSFs At the end of Year 5 there is 19,990kT of ore in stockpile Figure 13 - 19 End of Year 5 Ixtaca - S - K 1300 Technical Report Summary Page 225 of 326
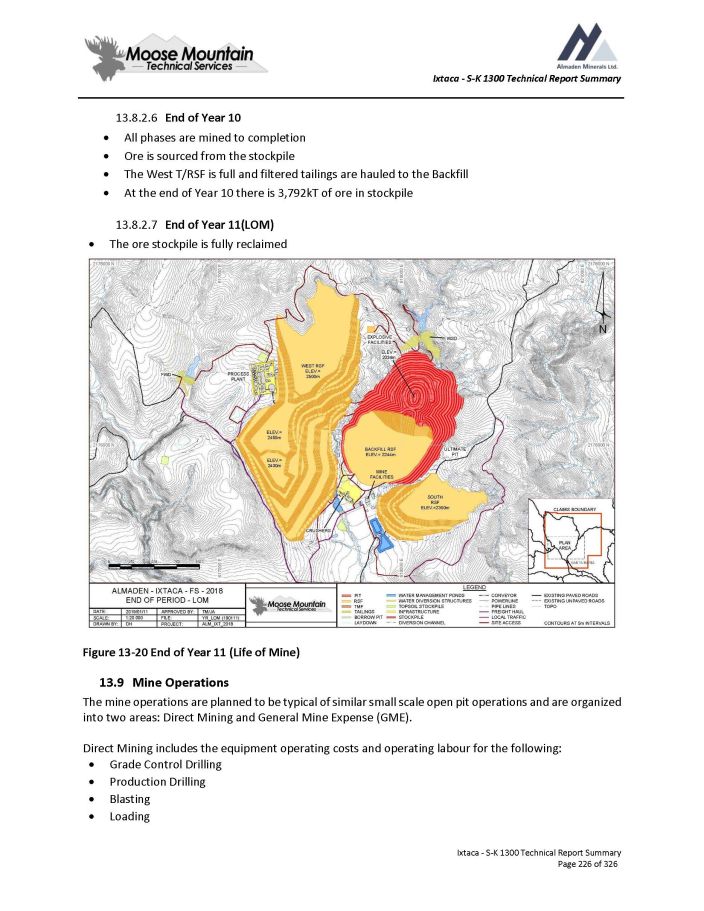
Ixtaca - S - K 1300 Technical Report Summary 13.8.2.6 End of Year 10 All phases are mined to completion Ore is sourced from the stockpile The West T/RSF is full and filtered tailings are hauled to the Backfill At the end of Year 10 there is 3,792kT of ore in stockpile 13.8.2.7 End of Year 11(LOM) The ore stockpile is fully reclaimed Figure 13 - 20 End of Year 11 (Life of Mine) 13.9 Mine Operations The mine operations are planned to be typical of similar small scale open pit operations and are organized into two areas: Direct Mining and General Mine Expense (GME). Direct Mining includes the equipment operating costs and operating labour for the following: Grade Control Drilling Production Drilling Blasting Loading Ixtaca - S - K 1300 Technical Report Summary Page 226 of 326
Ixtaca - S - K 1300 Technical Report Summary Hauling Pit Services Mine Maintenance Each unit operation accounts for all equipment consumables and parts, manpower required (both operating and maintenance) and all material costs (blasting) . This also includes the distributed mine maintenance items such as maintenance labour and repair parts plus off - site repairs which contribute to the hourly operating cost of the equipment . GME includes the supervision for the direct mining activities . GME also includes technical support requirements from Mine Engineering and Geology functions . More detailed descriptions of the mine organization and unit mining activities follows . In this study Direct Mining and Mine Maintenance is planned as Contract mining operations . The contract mining company will be responsible for all equipment mob/demob, operating, and labour costs as well as maintenance of the mining equipment . Blasting unit operations will be performed by a specific blasting company contractor . Supervision, geology and mine planning will be done by the Owner . 13.9.1 Direct Mining Unit Operations (Contractor) Direct mining activities will be done by a contract mining company . Estimates received from different Mexican - based contractors confirm the mining equipment sizes assumed for this study . 1. Ore Control Drilling An ore control system (OCS) is planned to provide field control for the loading equipment to define the ore/waste boundary as well as selectively mine low/medium/high grade ore for stockpiling . Variable angle reverse circulation (RC) drilling will be done on alternating benches throughout the mineralized areas of the deposit . Sampling will be done on the angled drill holes to determine various grade cut - off boundaries . Sample results will be used to build a short range mine planning model to be used for dig limit calculations . Ore control drilling will be supervised by the Owner and sampling will be performed by the Owner . The sampling program has only been estimated at this point for the FS and will need more detailed evaluation in future studies . 2. Production Drilling The ore and waste rock at Ixtaca will require drilling and blasting . The Volcanic material is generally softer than the Limestone and Shale material and will have a higher drilling penetration rate . Production drilling will be carried out with 273 mm ( 10 ¾”) diesel hydraulic rotary drills . Estimated effective penetration rates range from 28 m/hr (Limestone and Shale) up to 43 m/hr (Volcanics) . The production drills will also be adequate for drilling the pre - shear and buffer blast holes on the ultimate pit highwall . The assumed drill productivity for highwall drilling activity is the same as the primary drilling fleet productivity . Ixtaca - S - K 1300 Technical Report Summary Page 227 of 326

Ixtaca - S - K 1300 Technical Report Summary 3. Production Blasting A powder factor of 0 . 15 kg/tonne is assumed for volcanic material and 0 . 21 kg/tonne for Limestone and Shale material based on results from a blasting study performed by MMTS in 2015 . Production blasting will be done with ANFO where possible or emulsion if the holes are too wet (during the rainy season or in pit bottoms) . The blasting activities are planned to fall under a contract service agreement with a local explosives supplier, including supply of explosives, direct labour and blast - hole loading trucks . The Owner will provide an on - site explosives storage facility (silos), perimeter fencing around the storage facility and portable offices . The Owner will also pit supervision and planning for blasting operations . 4. Loading The mine production plan requires a maximum of seven 12 m 3 bucket hydraulic excavators which are sized to handle 90 tonne payload haul trucks . The hydraulic excavators are specified to handle the bulk excavation from the pits including all identified mineralized zones and waste rock in those mineralized zones . An excavator - type configuration will allow for greater flexibility in separation of ore into grade bins for stockpiling . The excavator size is chosen based on its ability to minimize losses and dilution for the proposed ore control operations, as well as its proven reliability and equipment ownership by various contract mining groups . The chosen excavator can work in a 6 m split bench configuration for greater ore selectivity as well as full 12 m bench operations . 5. Hauling Ore and waste rock haulage will be handled with 90 tonne payload haul trucks . Some of the haul trucks will be equipped with side - boards to allow full weight capacity when hauling volcanic material, since the density of this material is low . Haul profiles are estimated from each bench centroid to each potential dumping location . The following hauler productivity parameters are applied to calculate the cycle times . Table 13 - 9 Hauler Cycle Time Assumptions Ixtaca - S - K 1300 Technical Report Summary Page 228 of 326 10% Maximum Haul Grade 3% Rolling Resistance on Hauls 5% Rolling Resistance near shovels and on RSF surfaces 50 km/hr Truck Speed Limit 90% Operator Efficiency 3.42 minutes Loading + Spot + Waiting Time 13.9.1.6 Primary Mining Equipment A summary of the major mining equipment fleet is presented in the table below.
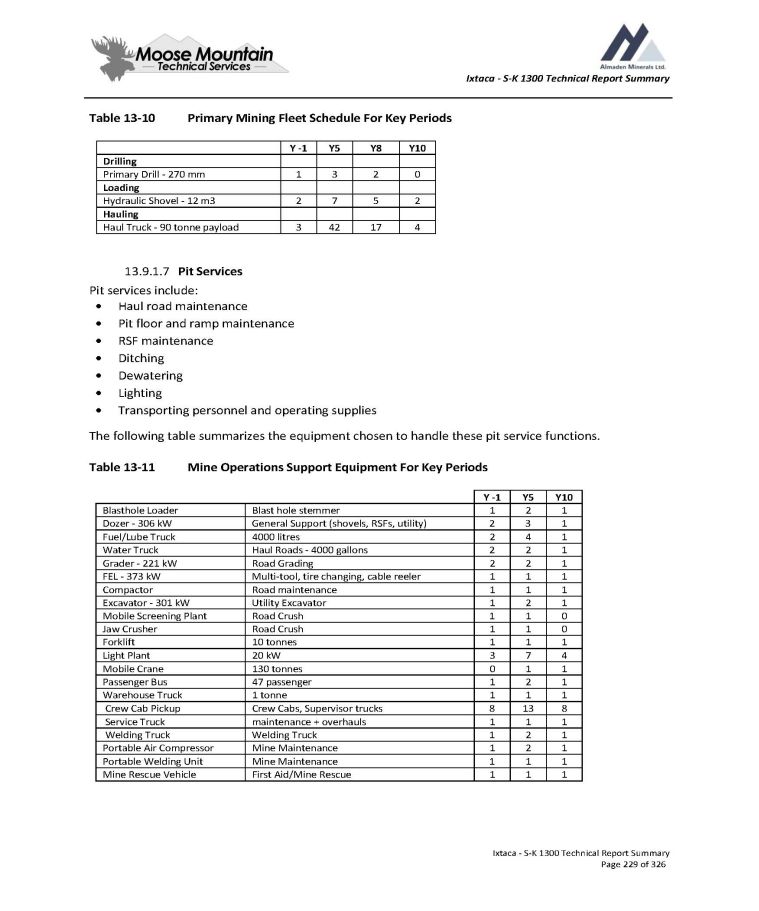
Ixtaca - S - K 1300 Technical Report Summary Table 13 - 10 Ixtaca - S - K 1300 Technical Report Summary Page 229 of 326 Primary Mining Fleet Schedule For Key Periods Y10 Y8 Y5 Y - 1 Drilling 0 2 3 1 Primary Drill - 270 mm Loading 2 5 7 2 Hydraulic Shovel - 12 m3 Hauling 4 17 42 3 Haul Truck - 90 tonne payload 13.9.1.7 Pit Services Pit services include: Haul road maintenance Pit floor and ramp maintenance RSF maintenance Ditching Dewatering Lighting Transporting personnel and operating supplies The following table summarizes the equipment chosen to handle these pit service functions. Table 13 - 11 Mine Operations Support Equipment For Key Periods Y10 Y5 Y - 1 1 2 1 Blast hole stemmer Blasthole Loader 1 3 2 General Support (shovels, RSFs, utility) Dozer - 306 kW 1 4 2 4000 litres Fuel/Lube Truck 1 2 2 Haul Roads - 4000 gallons Water Truck 1 2 2 Road Grading Grader - 221 kW 1 1 1 Multi - tool, tire changing, cable reeler FEL - 373 kW 1 1 1 Road maintenance Compactor 1 2 1 Utility Excavator Excavator - 301 kW 0 1 1 Road Crush Mobile Screening Plant 0 1 1 Road Crush Jaw Crusher 1 1 1 10 tonnes Forklift 4 7 3 20 kW Light Plant 1 1 0 130 tonnes Mobile Crane 1 2 1 47 passenger Passenger Bus 1 1 1 1 tonne Warehouse Truck 8 13 8 Crew Cabs, Supervisor trucks Crew Cab Pickup 1 1 1 maintenance + overhauls Service Truck 1 2 1 Welding Truck Welding Truck 1 2 1 Mine Maintenance Portable Air Compressor 1 1 1 Mine Maintenance Portable Welding Unit 1 1 1 First Aid/Mine Rescue Mine Rescue Vehicle
Ixtaca - S - K 1300 Technical Report Summary Haul Road Maintenance The grader is used to maintain the haul routes for the haul trucks and other equipment within the pits and on all routes to various RSF locations and the primary crusher . The grader ensures the haul roads are free of debris and that they conform to the design parameters of the routes for cross - section and grade . The water truck is outfitted with a water tank to spray the width of the haul roads to control dust that creates both visibility (productivity) and environmental issues . The water truck will also spray the active in - pit areas and the active RSF areas . RSF Maintenance Up to 3 track dozers ( 306 kW) are included to handle rock that is dumped at the RSFs . The dozer will push free dumped piles over the dump face edge as well as keep berms along the dump face edge and ensure the dumping area is clean and free of large boulders that would cause damage to haul truck tires . Pit Dewatering Water will be collected on active benches and directed to in - pit sumps where it can be pumped from the pit . Bench floors can be sloped slightly to facilitate drainage of water away from the working face(s) . All surface water and precipitation in the pit will be handled by submersible pumps installed in each active pit bottom . 13.9.1.8 Mine Fleet Maintenance Mine fleet maintenance activities will be generally performed in the maintenance facility located near the pit rim . Maintenance activities will be the responsibility of the contract mining group . Expected maintenance of the mining equipment will include break - down maintenance, field maintenance and repairs, regular PMs, component change - outs and field fuel, lube and tire change - outs . Fuel, lube and maintenance support in the pit will be by mobile service truck . The mobile maintenance fleet is included as a category under direct mining unit operations . 13 . 9 . 2 GME and Technical (Owner) Mine GME will include mine operations supervision . The General Manager will assume responsibility for the entire project and will have an Administrative Assistant to help with logistics, communications, planning and reporting . A Production Supervisor will oversee and direct the contract mining group and a Technical Services Manager will direct the technical services group . The Technical Services department includes engineers (mining and environmental) and geologists . The mine planning engineer will be responsible for directing the short and long - range scheduling and destination of materials (stockpile, crusher, RSF location, TMF, etc . ) . The ore grade technicians will work in the field to help ensure that ore is sent to the correct destination . Ore grade technicians will also perform surveying activities in the field to ensure that contract mining group is following the mine plan . The Technical Services department will provide reconciliation of material movement volumes against the numbers supplied by the contract mining group . The Mine Geologist will be responsible for ore control planning and provide guidance on construction of the short range geology model using sampling inputs . The geologist and sampler will be responsible for collecting samples from the Ore Control Drilling program and feeding assay results back into the geology and mine planning model . Ixtaca - S - K 1300 Technical Report Summary Page 230 of 326
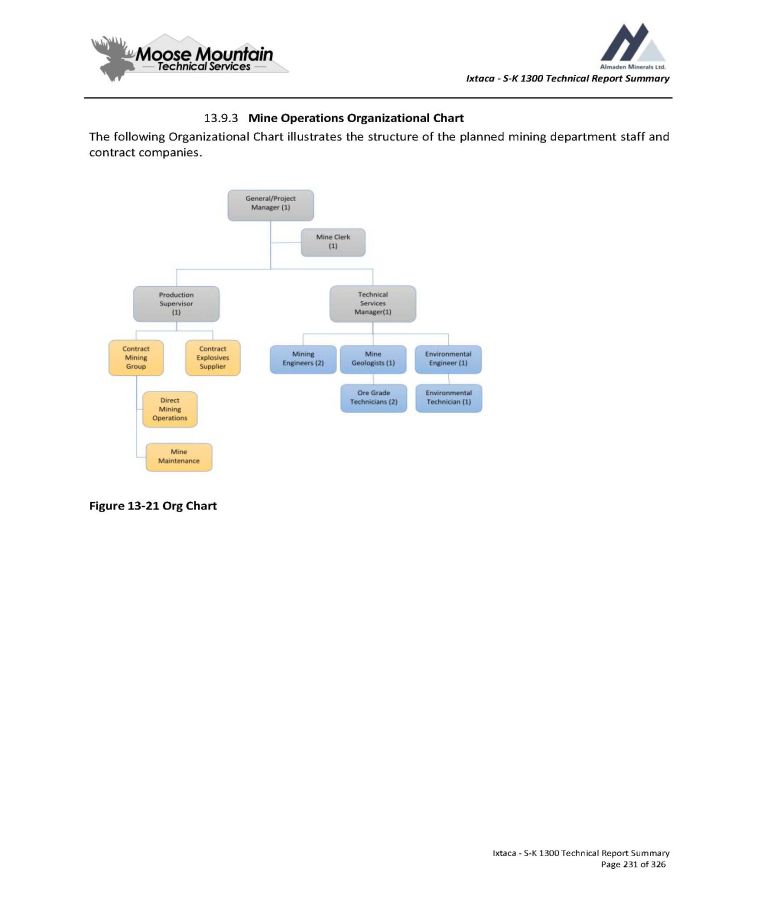
Ixtaca - S - K 1300 Technical Report Summary 13.9.3 Mine Operations Organizational Chart The following Organizational Chart illustrates the structure of the planned mining department staff and contract companies. Figure 13 - 21 Org Chart Ixtaca - S - K 1300 Technical Report Summary Page 231 of 326
Ixtaca - S - K 1300 Technical Report Summary 14.0 Processing and Recovery Methods The information in this section was drawn from the most recent major study prepared entitled “The Ixtaca Gold - Silver Project Puebla State, Mexico NI 43 - 101 Technical Report on the Feasibility Study” dated January 24 th 2019 and updated October 3 , 2019 . 14.1 Process Flowsheet Metallurgical test work results discussed in Section 10 confirm that ROM ore from the Ixtaca deposit can be processed using : Crushing; Pre - concentration with XRT Ore sorting; Grinding; Gravity concentration; Intensive leaching; Flotation; Carbon - in - Leach (CIL); Carbon elution and Electro - winning; Agitated leach with Merrill Crowe; Cyanide destruction with the SO 2 /Air process; Tailings filtration; Design of the Ixtaca flowsheet summarized in Figure 17 - 1 is based on the results from the metallurgical testwork, and includes input from process equipment suppliers and PMICSA, a local Mexican based construction company with experience in similar operations . Ixtaca - S - K 1300 Technical Report Summary Page 232 of 326
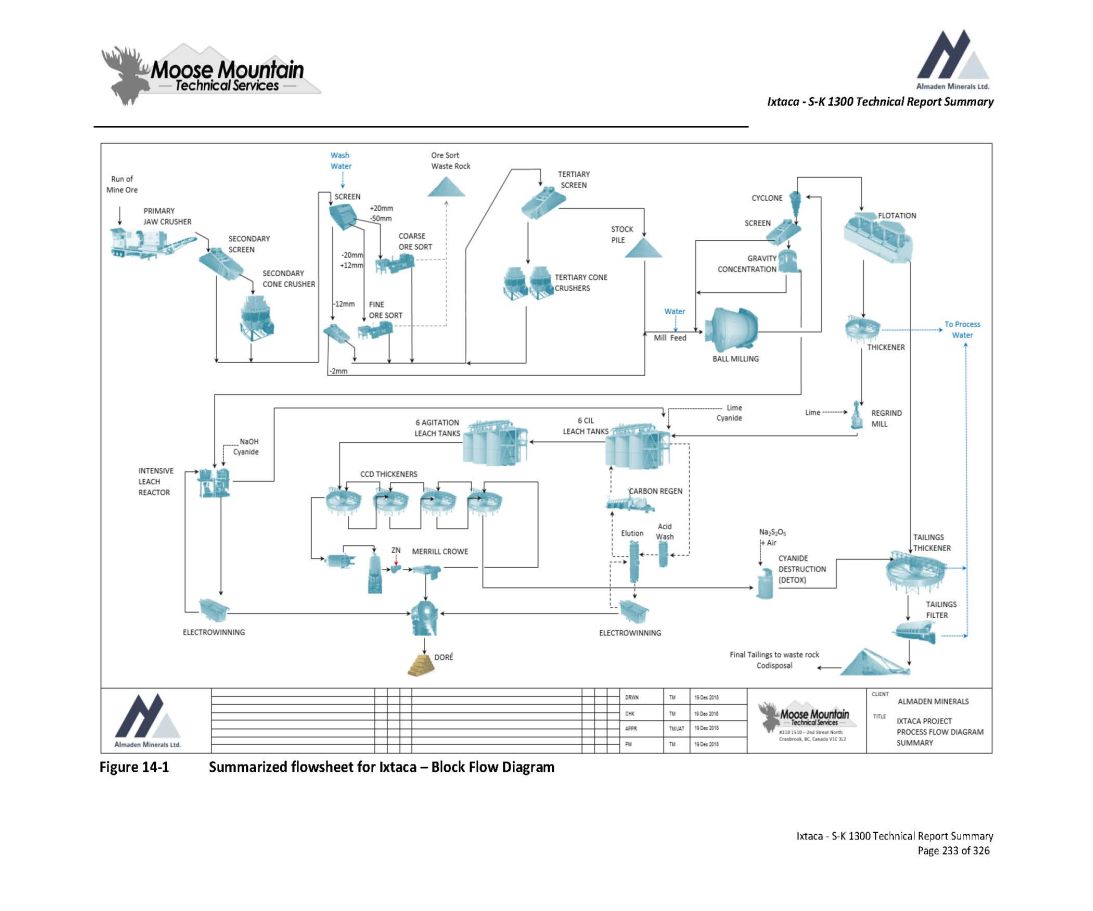
Ixtaca - S - K 1300 Technical Report Summary Ixtaca - S - K 1300 Technical Report Summary Page 233 of 326 Figure 14 - 1 Summarized flowsheet for Ixtaca – Block Flow Diagram
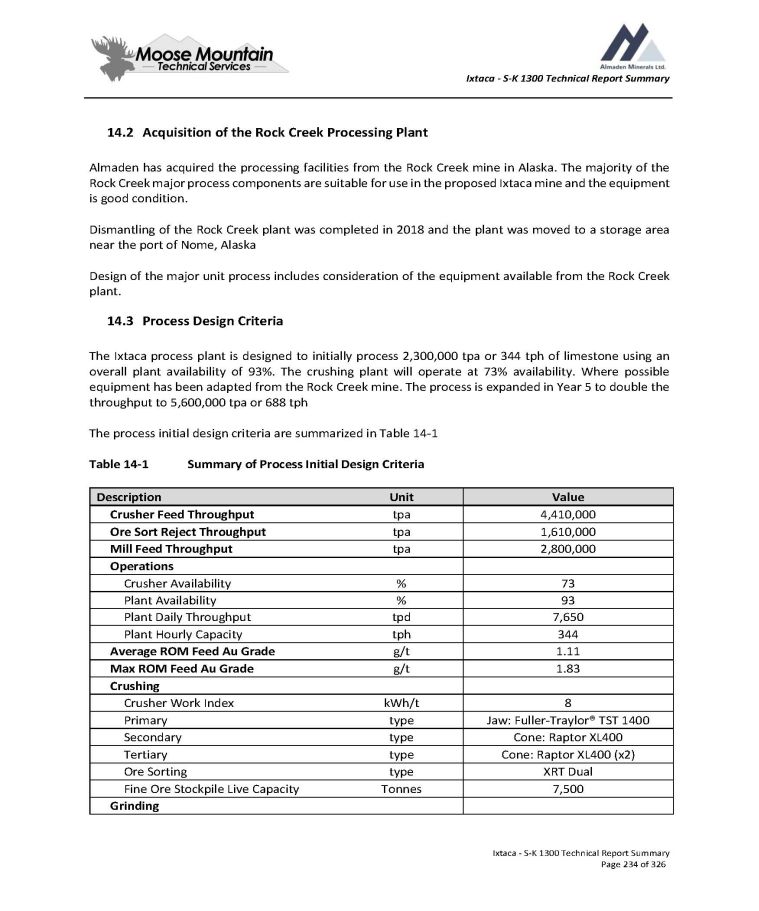
Ixtaca - S - K 1300 Technical Report Summary 14.2 Acquisition of the Rock Creek Processing Plant Almaden has acquired the processing facilities from the Rock Creek mine in Alaska . The majority of the Rock Creek major process components are suitable for use in the proposed Ixtaca mine and the equipment is good condition . Dismantling of the Rock Creek plant was completed in 2018 and the plant was moved to a storage area near the port of Nome, Alaska Design of the major unit process includes consideration of the equipment available from the Rock Creek plant . 14.3 Process Design Criteria The Ixtaca process plant is designed to initially process 2 , 300 , 000 tpa or 344 tph of limestone using an overall plant availability of 93 % . The crushing plant will operate at 73 % availability . Where possible equipment has been adapted from the Rock Creek mine . The process is expanded in Year 5 to double the throughput to 5 , 600 , 000 tpa or 688 tph The process initial design criteria are summarized in Table 14 - 1 Table 14 - 1 Summary of Process Initial Design Criteria Ixtaca - S - K 1300 Technical Report Summary Page 234 of 326 Value Unit Description 4,410,000 tpa Crusher Feed Throughput 1,610,000 tpa Ore Sort Reject Throughput 2,800,000 tpa Mill Feed Throughput Operations 73 % Crusher Availability 93 % Plant Availability 7,650 tpd Plant Daily Throughput 344 tph Plant Hourly Capacity 1.11 g/t Average ROM Feed Au Grade 1.83 g/t Max ROM Feed Au Grade Crushing 8 kWh/t Crusher Work Index Jaw: Fuller - Traylor® TST 1400 type Primary Cone: Raptor XL400 type Secondary Cone: Raptor XL400 (x2) type Tertiary XRT Dual type Ore Sorting 7,500 Tonnes Fine Ore Stockpile Live Capacity Grinding
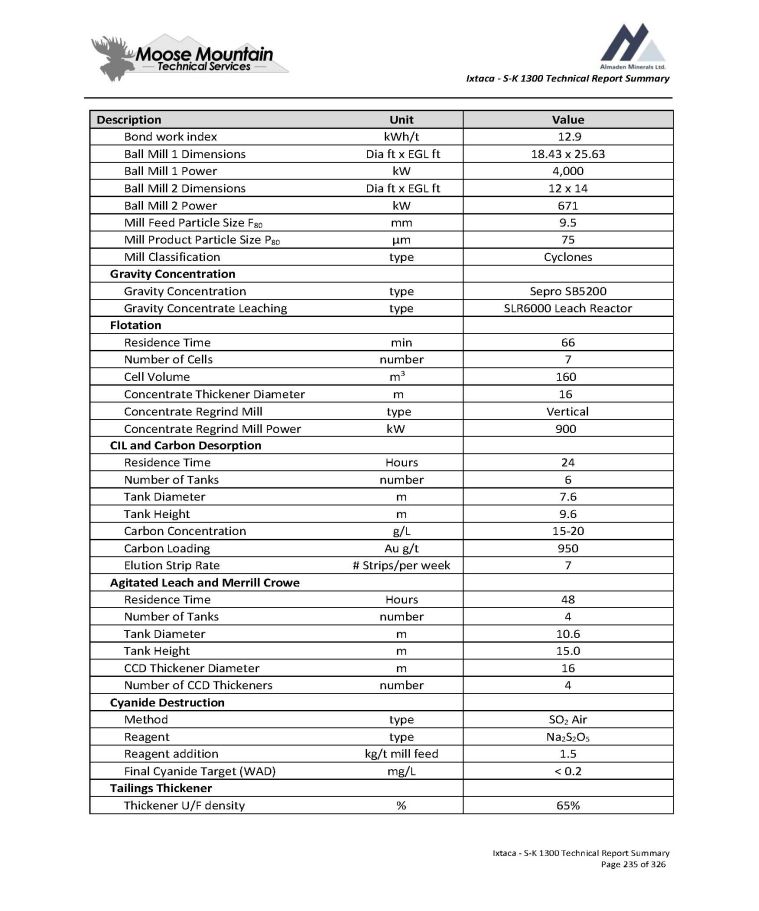
Ixtaca - S - K 1300 Technical Report Summary Value Unit Description 12.9 kWh/t Bond work index 18.43 x 25.63 Dia ft x EGL ft Ball Mill 1 Dimensions 4,000 kW Ball Mill 1 Power 12 x 14 Dia ft x EGL ft Ball Mill 2 Dimensions 671 kW Ball Mill 2 Power 9.5 mm Mill Feed Particle Size F 80 75 µm Mill Product Particle Size P 80 Cyclones type Mill Classification Gravity Concentration Sepro SB5200 type Gravity Concentration SLR6000 Leach Reactor type Gravity Concentrate Leaching Flotation 66 min Residence Time 7 number Number of Cells 160 m 3 Cell Volume 16 m Concentrate Thickener Diameter Vertical type Concentrate Regrind Mill 900 kW Concentrate Regrind Mill Power CIL and Carbon Desorption 24 Hours Residence Time 6 number Number of Tanks 7.6 m Tank Diameter 9.6 m Tank Height 15 - 20 g/L Carbon Concentration 950 Au g/t Carbon Loading 7 # Strips/per week Elution Strip Rate Agitated Leach and Merrill Crowe 48 Hours Residence Time 4 number Number of Tanks 10.6 m Tank Diameter 15.0 m Tank Height 16 m CCD Thickener Diameter 4 number Number of CCD Thickeners Cyanide Destruction SO 2 Air type Method Na 2 S 2 O 5 type Reagent 1.5 kg/t mill feed Reagent addition < 0.2 mg/L Final Cyanide Target (WAD) Tailings Thickener 65% % Thickener U/F density Ixtaca - S - K 1300 Technical Report Summary Page 235 of 326
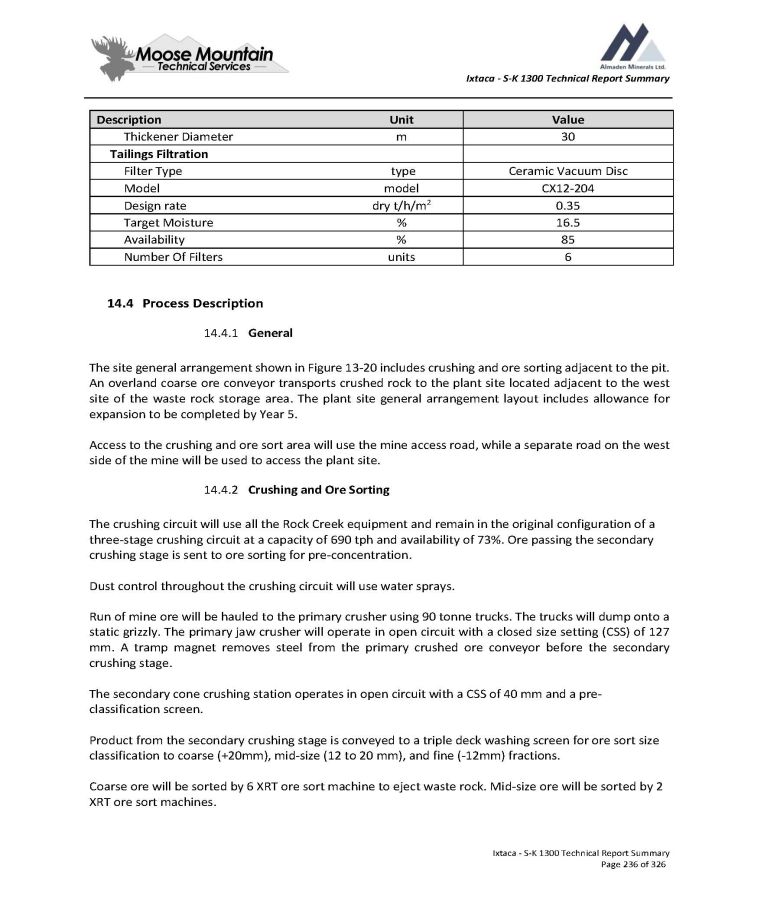
Ixtaca - S - K 1300 Technical Report Summary Value Unit Description 30 m Thickener Diameter Tailings Filtration Ceramic Vacuum Disc type Filter Type CX12 - 204 model Model 0.35 dry t/h/m 2 Design rate 16.5 % Target Moisture 85 % Availability 6 units Number Of Filters Ixtaca - S - K 1300 Technical Report Summary Page 236 of 326 4. Process Description 1. General The site general arrangement shown in Figure 13 - 20 includes crushing and ore sorting adjacent to the pit . An overland coarse ore conveyor transports crushed rock to the plant site located adjacent to the west site of the waste rock storage area . The plant site general arrangement layout includes allowance for expansion to be completed by Year 5 . Access to the crushing and ore sort area will use the mine access road, while a separate road on the west side of the mine will be used to access the plant site . 2. Crushing and Ore Sorting The crushing circuit will use all the Rock Creek equipment and remain in the original configuration of a three - stage crushing circuit at a capacity of 690 tph and availability of 73 % . Ore passing the secondary crushing stage is sent to ore sorting for pre - concentration . Dust control throughout the crushing circuit will use water sprays . Run of mine ore will be hauled to the primary crusher using 90 tonne trucks . The trucks will dump onto a static grizzly . The primary jaw crusher will operate in open circuit with a closed size setting (CSS) of 127 mm. A tramp magnet removes steel from the primary crushed ore conveyor before the secondary crushing stage. The secondary cone crushing station operates in open circuit with a CSS of 40 mm and a pre - classification screen. Product from the secondary crushing stage is conveyed to a triple deck washing screen for ore sort size classification to coarse (+20mm), mid - size (12 to 20 mm), and fine ( - 12mm) fractions. Coarse ore will be sorted by 6 XRT ore sort machine to eject waste rock. Mid - size ore will be sorted by 2 XRT ore sort machines.
Ixtaca - S - K 1300 Technical Report Summary Fine ore bypasses ore sorting with the less than 2 mm fraction being pumped to the mill while the greater than 2 mm fraction is conveyed to the mill feed stockpile . Ore sort product is conveyed to the tertiary crushing stage which operates in close - circuit using two cone crusher stations with pre - classification vibrating screens . Final crushing product size is P 80 of 9.5 mm. The crushing and ore sort layout is shown in Figure 14 - 2. 3. Fine Ore Stockpile Ore from the crushing circuit is transported to the fine ore stockpile by a 1,250 m overland conveyor. The stockpile is approximately 26 m high and 37 m diameter with a live capacity of 7500 tonnes. Ore from the stockpile is reclaimed by 3 vibrating feeders . The Layout of the stockpile is shown in Figure 14 - 3 . 4. Processing Plant The grinding, gravity concentration, flotation, leaching, thickening areas are located outdoors . Intensive cyanidation, elution, Merrill Crowe, refinery and reagent preparation, offices, electrical rooms and control rooms and maintenance facilities are located indoors . The Layout of the processing plant area is shown in Figure 14 - 4 . Allowance for the planned Year 5 expansion has been made in the plant layout and are depicted by the grey areas on the layout drawings . 14.4.4.1 Grinding and Gravity Concentration Grinding from an F 80 of 9 . 5 mm to P 80 of 75 μm is carried out with two ball mills in a closed circuit with cyclones . The grinding circuit can process a nominal 7 , 650 tpd at 344 tph and 93 % availability and 250 % recirculating load . Grinding includes two ball mills in parallel . The first ball mill is the Rock Creek 18 . 43 feet diameter x 25 . 63 feet length mill with two 2 , 000 kW fixed speed motors . The second mill is a 12 feet diameter x 14 feet length mill with a 671 kW motors . The combined mill power is 4 , 671 kW . Cyclone underflow is screened on a 6 ' X 16 ' single deck screen . Screen undersize ( - 2 mm) feeds two semi batch gravity concentrators . Screen oversize is returned to the ball mills . Gravity tails flows back to the mill and gravity concentrate flows to an intensive leach reactor on the ground floor . Pregnant leach solution (PLS) from the intensive leach reactor is pumped periodically to a dedicated tank in the refining area . Leach reactor tailings are pumped to concentrate regrinding . A general arrangement section of the grinding and gravity area is shown in Figure 14 - 5. Ixtaca - S - K 1300 Technical Report Summary Page 237 of 326
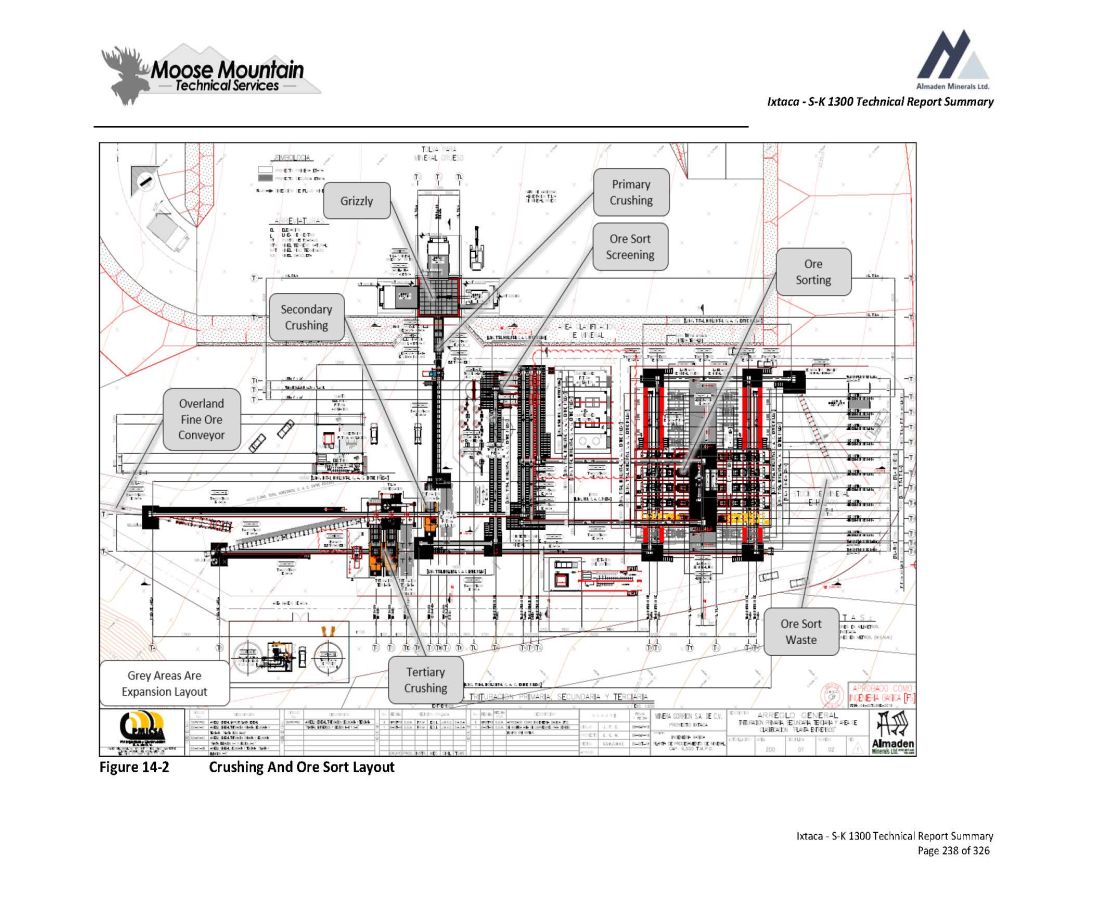
Ixtaca - S - K 1300 Technical Report Summary Figure 14 - 2 Crushing And Ore Sort Layout Ixtaca - S - K 1300 Technical Report Summary Page 238 of 326
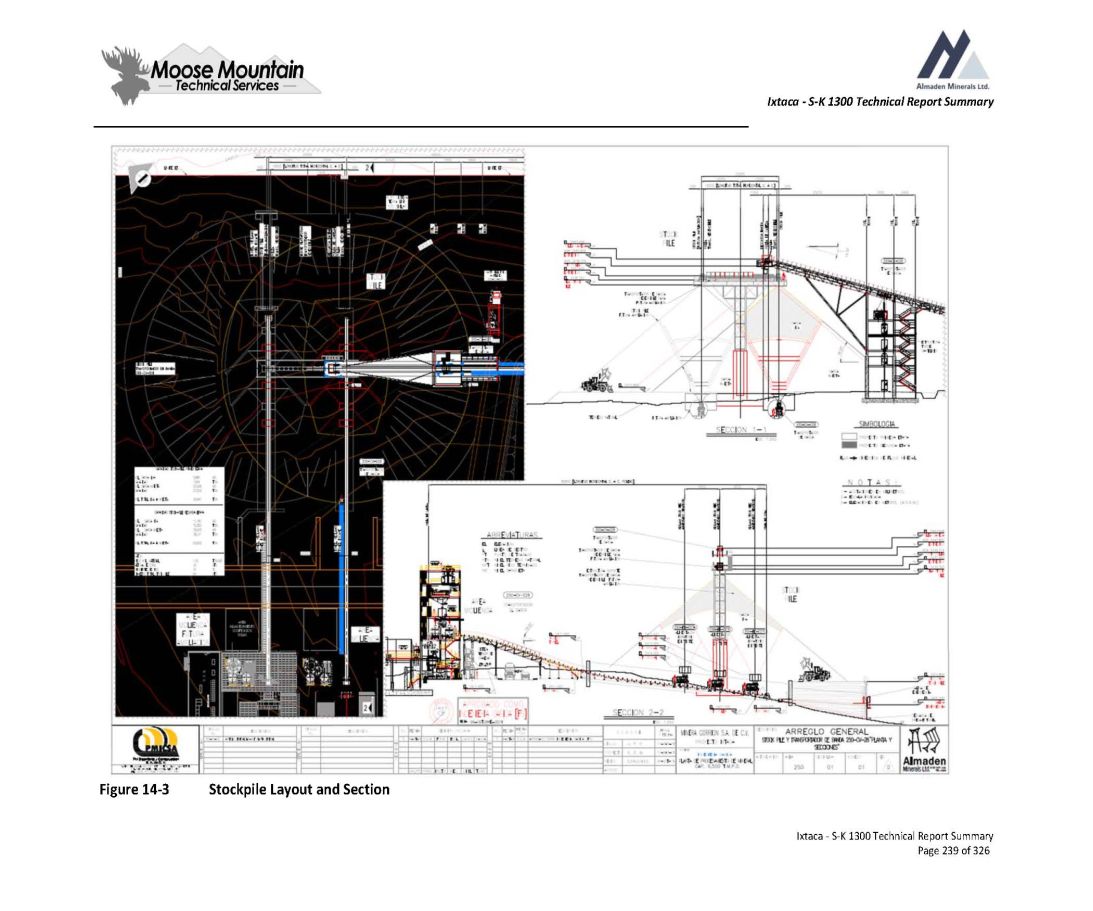
Ixtaca - S - K 1300 Technical Report Summary Figure 14 - 3 Stockpile Layout and Section Ixtaca - S - K 1300 Technical Report Summary Page 239 of 326
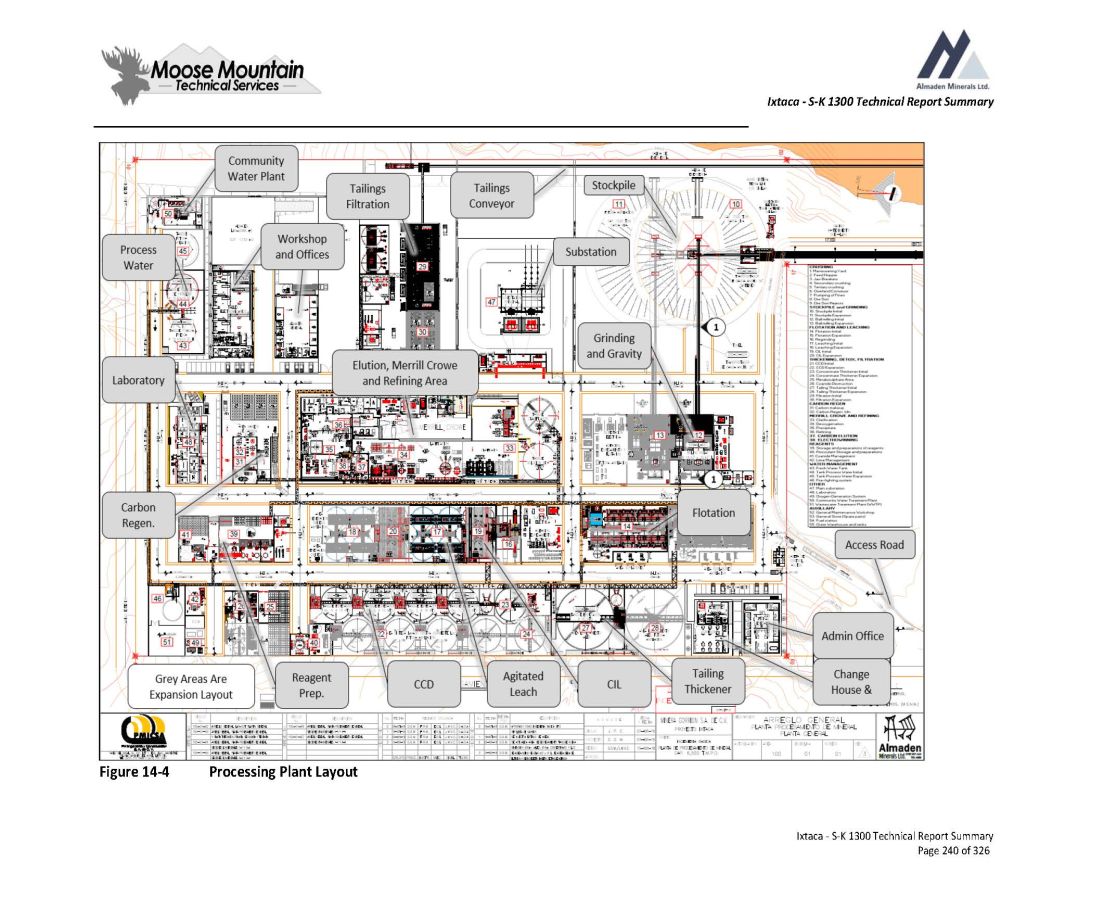
Ixtaca - S - K 1300 Technical Report Summary Figure 14 - 4 Processing Plant Layout Ixtaca - S - K 1300 Technical Report Summary Page 240 of 326
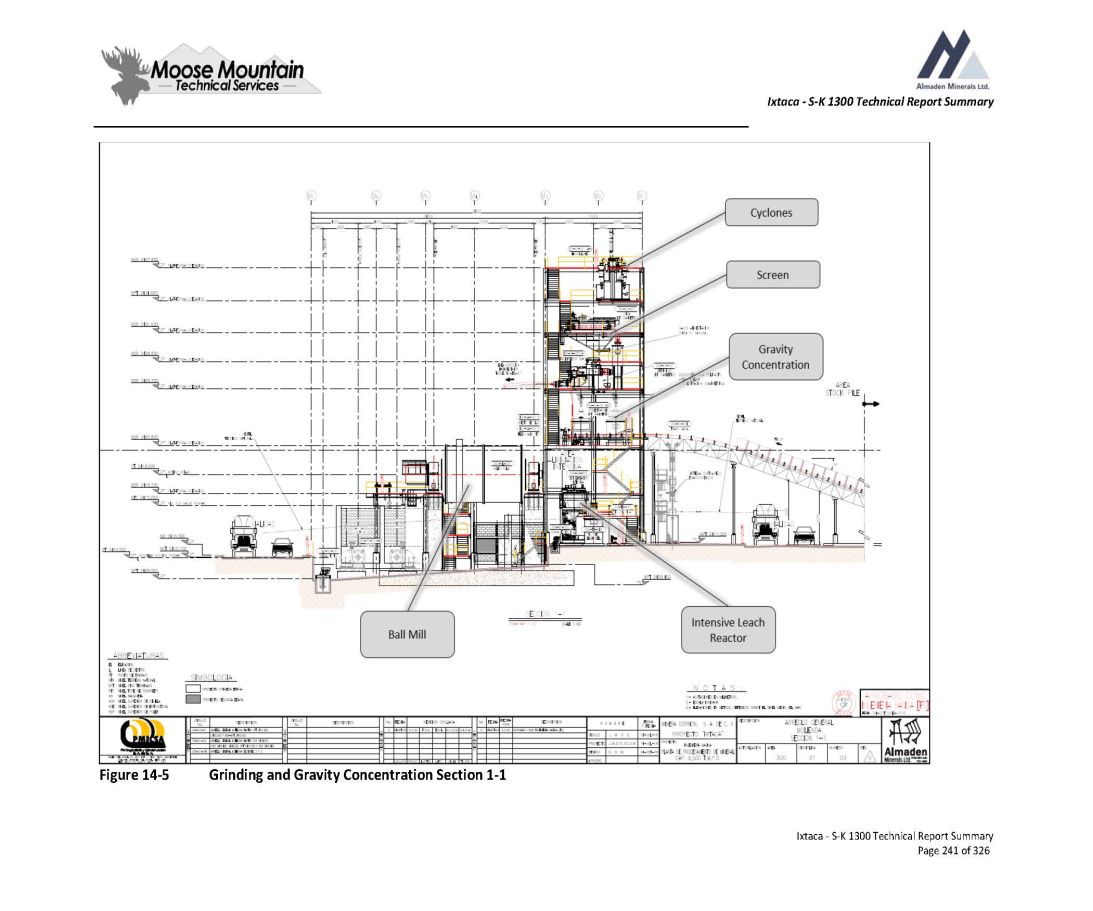
Ixtaca - S - K 1300 Technical Report Summary Figure 14 - 5 Grinding and Gravity Concentration Section 1 - 1 Ixtaca - S - K 1300 Technical Report Summary Page 241 of 326
Ixtaca - S - K 1300 Technical Report Summary 2. Flotation Cyclone overflow from the grinding circuit is pumped to a flotation conditioning tank . Copper sulfate, sodium isopropyl xanthate (SIPX), frother (AEROFROTH 65 ), and promoter (AERO 3477 ) are added to enhance flotation performance . Flotation is carried out in seven conventional 160 m 3 mechanical cells, each using forced - air . Flotation concentrate is collected and pumped to the concentrate thickener . Thickener overflow gravity flows to a tank where it is recycled for plant use . Thickener underflow is pumped at 40 % solids to a 900 kW vertical regrind mill where lime is added before regrinding . Regrind product at approximately P 80 10 µm is pumped to the CIL for leaching . 3. CIL and Agitated Leach Leaching is carried out in 2 stages . CIL leaching for 24 hours will complete gold extraction, followed by 72 hours of agitated leaching to complete silver leaching . Leach feed from the regrind mill is first pumped to a CIL feed sampler, and then slurry is contacted with carbon using six CIP tanks operating in series accounting to a total of 24 hours of residence time . Sodium cyanide and lime slurry is added to CIL Tanks 1 and 3 . Carbon concentrations of 20 g/L are required in all tanks . Barren carbon enters the adsorption circuit at CIP Tank 6 and moves countercurrent to the slurry flow using interstage screens and pumps from a downstream to upstream tanks . The countercurrent process is repeated until the carbon becomes loaded and reaches CIP Tank 1 . Carbon is then moved to loaded carbon recovery screen . The loaded carbon is washed with water and pumped to the desorption area . Underflow from the loaded carbon recovery screen is returned to CIL Tank 1 . The slurry from CIP Tank 6 flows by gravity to a carbon safety screen to recover any carbon in the event of damage to the CIP Tank 6 interstage screen . Recovered carbon is collected in a bin for manual transfer . Underflow from the carbon safety screen gravitates to four agitated leach tanks to complete silver leaching . Slurry from the last leach tank gravity flows to a Merrill Crowe circuit . 4. Carbon Desorption and Regeneration Carbon desorption and regeneration areas is carried out by acid washing of carbon, stripping of gold from loaded carbon (elution), and carbon regeneration . Carbon from the loaded carbon screen is pumped to acid wash. Acid wash is carried out with dilute hydrochloric acid with two 5.8 m 3 acid wash columns inside an acid - proofed concrete bund to ensure that all spillage is captured and kept separate from other process streams. Ixtaca - S - K 1300 Technical Report Summary Page 242 of 326
Ixtaca - S - K 1300 Technical Report Summary After acid wash the carbon is pumped to an elution circuit that includes elution columns, strip solution tank, strip solution pump, and a strip solution heat exchanger . The elution circuit operates in closed circuit with electro - winning cells . The elution is carried out in 2 columns, one with dimensions 3 ’ diameter x 24 ’ height, and a second column with 4 ’ diameter x 32 ’ height . Strip solution heat exchangers maintains the strip solution at 145 Σ C during the stripping cycle and ensures that the temperature of solution entering the electro - winning cells is below 100 Σ C . Eluate flows directly from the top of the elution column to a loaded solution tank after cooling through heat exchangers . The eluate is pumped from the loaded solution tank to electro - winning cells to recover gold and silver as sludge . Barren solution from electro - winning gravitates back to the strip solution tank . The sludge is drained from the electrowinning cells and vacuum filtered before refining . 5. Merrill Crowe A Merrill Crowe process operates in closed circuit with four counter current decantation (CCD) thickeners . Slurry from the final leach tank flows to the CCD thickeners where pregnant solution is removed . The pregnant solution is clarified with three horizontal leaf clarifiers using a diatomaceous earth precoat . Oxygen is then removed from the clarified solution with a vacuum de - aeration column . Solution is percolated through a packing bed while under a vacuum . Zinc dust is added to the clarified, de - aerated solution which precipitates gold and silver . The precipitate is filtered using three filter presses and sent to refining . 6. Refining Filtered cake from electro - winning and Merrill Crowe is dried in two drying ovens and directly smelted with fluxes in two induction furnaces. Gold - silver doré is poured into doré moulds. Gold - Silver doré bars are weighed, stamped, sampled and stored in a safe ready for dispatch. Furnace exhaust is passed through a wet scrubber to remove any entrained particles and then vented through a stack. 7. Detoxification Tails from the last CCD stage are thickened and fed to a detox reactor at 45 % solids w/w . Cyanide destruction is carried out using the SO 2 /Air process using sodium metabisulphite . Slurry produced from the detoxification stage is pumped to the final tailings thickener . Ixtaca - S - K 1300 Technical Report Summary Page 243 of 326
Ixtaca - S - K 1300 Technical Report Summary An HCN detector will monitor for airborne gas and a cyanide analyzer will be used to monitor cyanide levels and ensure that target cyanide levels are achieved. 8. Tailings thickener The final tailings thickener combines tailings streams from flotation and detoxification . Thickener overflow is recirculated to the process water system . Thickener underflow is pumped to tailings filtration at 65 % solids . 9. Tailings Filtration Tailings thickener underflow is pumped to tailings filtration where moisture is reduced to 16.5% using six ceramic disc vacuum filters. Filter cake is discharged and transported to the waste rock co - disposal area by a conveyor. Filtered tails is deposited in a stockpile by a mobile radial stacker ready for placement in the co - disposal area. 14.5 Reagents and Power Consumption Reagents are prepared in a separate contained area and are bunded to control any spillage. Tank storage capacity is based on reagent consumption rates to supply the process without any interruption. A summary of the estimated reagent consumption rates is provided in Table 14 - 2. Electrical power is estimated at 15 MW ramping up to 26MW in Year 5. Ixtaca - S - K 1300 Technical Report Summary Page 244 of 326
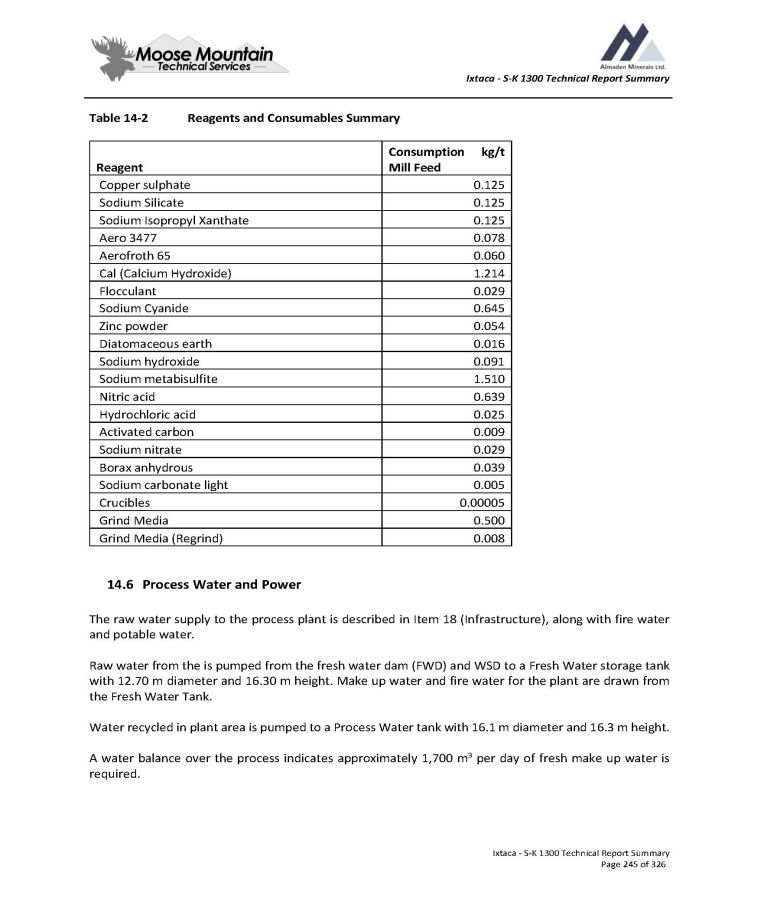
Ixtaca - S - K 1300 Technical Report Summary Table 14 - 2 Ixtaca - S - K 1300 Technical Report Summary Page 245 of 326 Reagents and Consumables Summary Consumption kg/t Mill Feed Reagent 0.125 Copper sulphate 0.125 Sodium Silicate 0.125 Sodium Isopropyl Xanthate 0.078 Aero 3477 0.060 Aerofroth 65 1.214 Cal (Calcium Hydroxide) 0.029 Flocculant 0.645 Sodium Cyanide 0.054 Zinc powder 0.016 Diatomaceous earth 0.091 Sodium hydroxide 1.510 Sodium metabisulfite 0.639 Nitric acid 0.025 Hydrochloric acid 0.009 Activated carbon 0.029 Sodium nitrate 0.039 Borax anhydrous 0.005 Sodium carbonate light 0.00005 Crucibles 0.500 Grind Media 0.008 Grind Media (Regrind) 14.6 Process Water and Power The raw water supply to the process plant is described in Item 18 (Infrastructure), along with fire water and potable water . Raw water from the is pumped from the fresh water dam (FWD) and WSD to a Fresh Water storage tank with 12 . 70 m diameter and 16 . 30 m height . Make up water and fire water for the plant are drawn from the Fresh Water Tank . Water recycled in plant area is pumped to a Process Water tank with 16 . 1 m diameter and 16 . 3 m height . A water balance over the process indicates approximately 1 , 700 m 3 per day of fresh make up water is required .

Ixtaca - S - K 1300 Technical Report Summary 14.7 Process Personnel Process labour summarized in Table 18 - 8 averages 105 personnel in the initial operation . Process labour is estimated to peak at approximately 160 personnel after the throughput expansion . Labour will primarily be locally sourced living with 20 minutes from the mine site . Labour rates are based on in - house data from local Mexican mining operations . A 5 day shift rotation with 3 x 8 hour shifts has been assumed . Ixtaca - S - K 1300 Technical Report Summary Page 246 of 326
Ixtaca - S - K 1300 Technical Report Summary 1. Infrastructure The information in this section was drawn from the most recent major study prepared entitled “The Ixtaca Gold - Silver Project Puebla State, Mexico NI 43 - 101 Technical Report on the Feasibility Study” dated January 24 th 2019 and updated October 3 , 2019 . 1. Site Access The Project is accessible by driving 40 km east along Highway 119 from Apizaco ; an industrial center located approximately 50 km north of Puebla City, and then north approximately 20 km along a paved road to the town of Santa Maria . Public gravel roads currently traverse the proposed mining areas . Site access road requirement are depicted on Figure 15 - 1 . Public bypass roads are located to the east and west of the Project . A new road is constructed around Santa Maria to bypass mine traffic around the town . A new bridge will be installed across the Rio Apulco to accommodate mine deliveries . Most onsite road will only require upgrading of existing roads . Figure 15 - 1 distinguishes between new and upgraded roads . 2. Power Almaden engaged Federal Electricity Commission (Comisión Federal de Electricidad or CFE) through one of its departments, the Centro Nacional de Control de la Energía (CENACE) to complete an assessment of power delivery to the Project . The first study, (Estudio Indicativo) completed by CENACE examined generation capacity and concluded that Ixtaca will be supplied through a 115 kV transmission line from a substation at Apizaco called Zocac . Total length of the transmission line is 27 km . The Project requires a new 115/4.16 transformer onsite as the connection point to the transmission line. Plant power distribution from the main substation will be by overhead power lines and buried conduits. Standby emergency power will be supplied by diesel generators relocated from the Rock Creek mine. 3. Fuel Diesel will be delivered to site in tanker trucks and will be available for use by vehicles using onsite 120 , 000 litre storage . Ixtaca - S - K 1300 Technical Report Summary Page 247 of 326
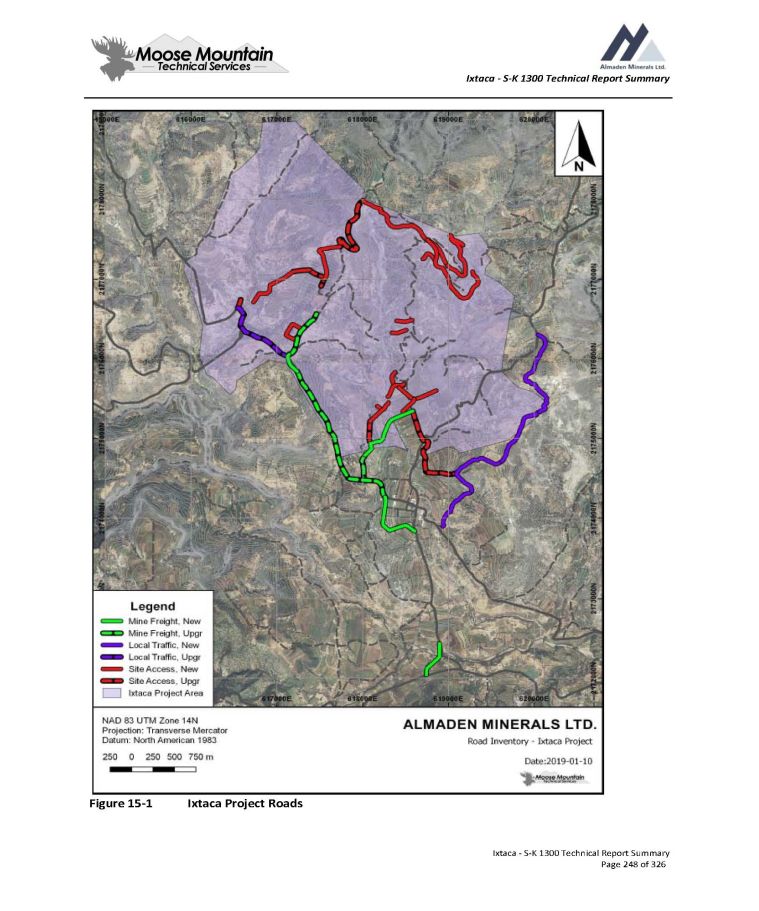
Ixtaca - S - K 1300 Technical Report Summary Figure 15 - 1 Ixtaca Project Roads Ixtaca - S - K 1300 Technical Report Summary Page 248 of 326
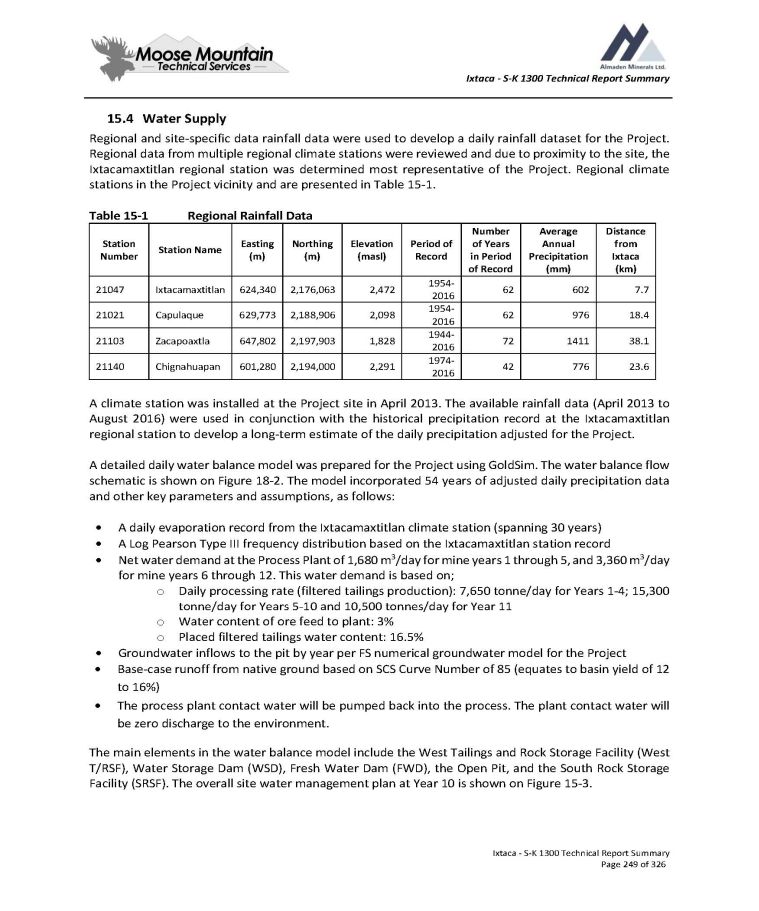
Ixtaca - S - K 1300 Technical Report Summary 15 . 4 Water Supply Regional and site - specific data rainfall data were used to develop a daily rainfall dataset for the Project . Regional data from multiple regional climate stations were reviewed and due to proximity to the site, the Ixtacamaxtitlan regional station was determined most representative of the Project . Regional climate stations in the Project vicinity and are presented in Table 15 - 1 . Table 15 - 1 Regional Rainfall Data Ixtaca - S - K 1300 Technical Report Summary Page 249 of 326 Distance from Ixtaca (km) Average Annual Precipitation (mm) Number of Years in Period of Record Period of Record Elevation (masl) Northing (m) Easting (m) Station Name Station Number 7.7 602 62 1954 - 2016 2,472 2,176,063 624,340 Ixtacamaxtitlan 21047 18.4 976 62 1954 - 2016 2,098 2,188,906 629,773 Capulaque 21021 38.1 1411 72 1944 - 2016 1,828 2,197,903 647,802 Zacapoaxtla 21103 23.6 776 42 1974 - 2016 2,291 2,194,000 601,280 Chignahuapan 21140 A climate station was installed at the Project site in April 2013 . The available rainfall data (April 2013 to August 2016 ) were used in conjunction with the historical precipitation record at the Ixtacamaxtitlan regional station to develop a long - term estimate of the daily precipitation adjusted for the Project . A detailed daily water balance model was prepared for the Project using GoldSim . The water balance flow schematic is shown on Figure 18 - 2 . The model incorporated 54 years of adjusted daily precipitation data and other key parameters and assumptions, as follows : A daily evaporation record from the Ixtacamaxtitlan climate station (spanning 30 years) A Log Pearson Type III frequency distribution based on the Ixtacamaxtitlan station record Net water demand at the Process Plant of 1,680 m 3 /day for mine years 1 through 5, and 3,360 m 3 /day for mine years 6 through 12. This water demand is based on; o Daily processing rate (filtered tailings production): 7,650 tonne/day for Years 1 - 4; 15,300 tonne/day for Years 5 - 10 and 10,500 tonnes/day for Year 11 o Water content of ore feed to plant: 3% o Placed filtered tailings water content: 16.5% Groundwater inflows to the pit by year per FS numerical groundwater model for the Project Base - case runoff from native ground based on SCS Curve Number of 85 (equates to basin yield of 12 to 16%) The process plant contact water will be pumped back into the process. The plant contact water will be zero discharge to the environment. The main elements in the water balance model include the West Tailings and Rock Storage Facility (West T/RSF), Water Storage Dam (WSD), Fresh Water Dam (FWD), the Open Pit, and the South Rock Storage Facility (SRSF) . The overall site water management plan at Year 10 is shown on Figure 15 - 3 .
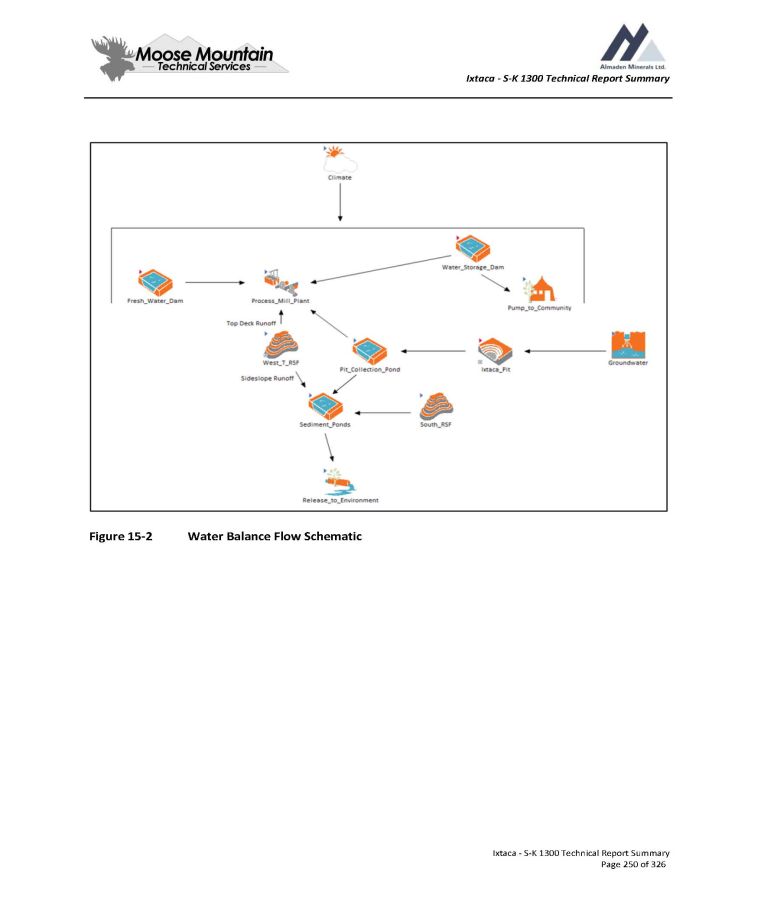
Ixtaca - S - K 1300 Technical Report Summary Figure 15 - 2 Water Balance Flow Schematic Ixtaca - S - K 1300 Technical Report Summary Page 250 of 326
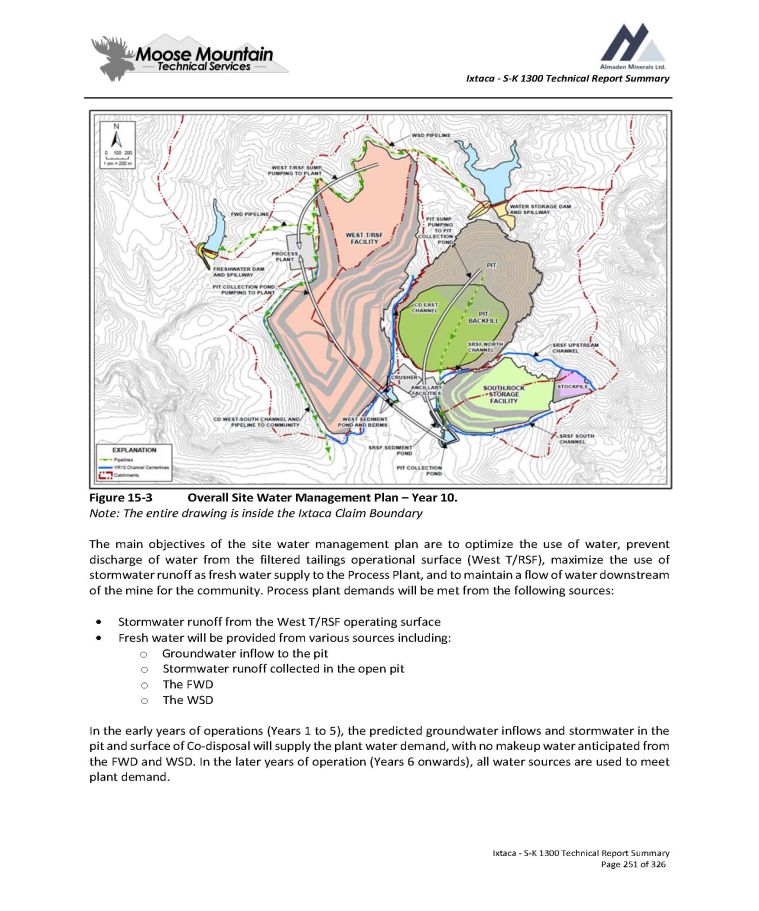
Ixtaca - S - K 1300 Technical Report Summary Figure 15 - 3 Overall Site Water Management Plan – Year 10. Note: The entire drawing is inside the Ixtaca Claim Boundary The main objectives of the site water management plan are to optimize the use of water, prevent discharge of water from the filtered tailings operational surface (West T/RSF), maximize the use of stormwater runoff as fresh water supply to the Process Plant, and to maintain a flow of water downstream of the mine for the community . Process plant demands will be met from the following sources : Stormwater runoff from the West T/RSF operating surface Fresh water will be provided from various sources including: o Groundwater inflow to the pit o Stormwater runoff collected in the open pit o The FWD o The WSD In the early years of operations (Years 1 to 5 ), the predicted groundwater inflows and stormwater in the pit and surface of Co - disposal will supply the plant water demand, with no makeup water anticipated from the FWD and WSD . In the later years of operation (Years 6 onwards), all water sources are used to meet plant demand . Ixtaca - S - K 1300 Technical Report Summary Page 251 of 326
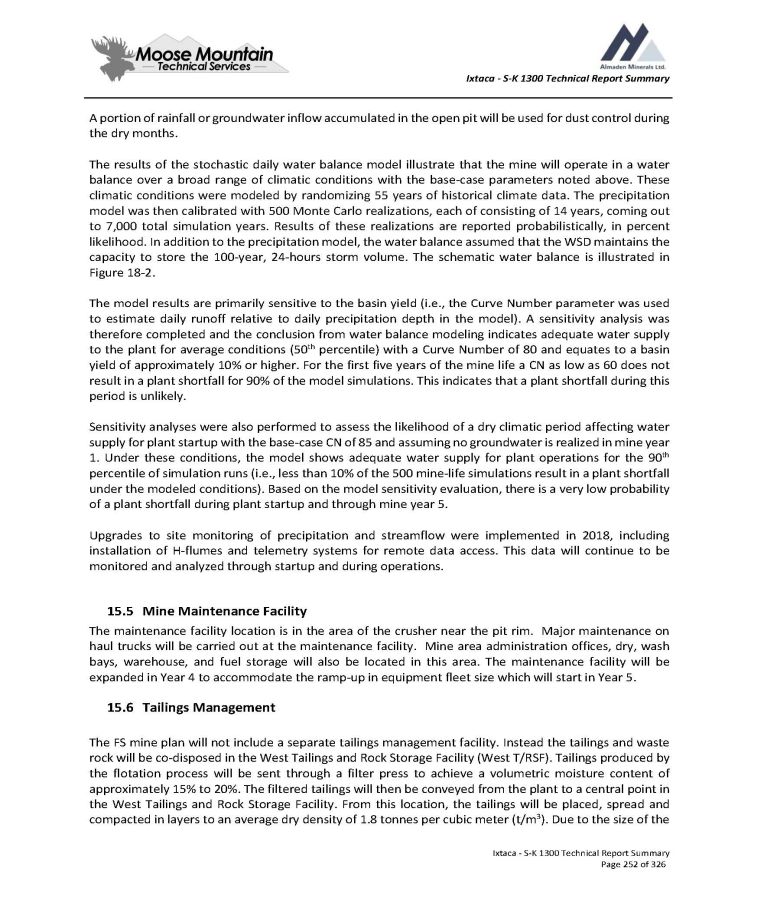
Ixtaca - S - K 1300 Technical Report Summary A portion of rainfall or groundwater inflow accumulated in the open pit will be used for dust control during the dry months . The results of the stochastic daily water balance model illustrate that the mine will operate in a water balance over a broad range of climatic conditions with the base - case parameters noted above . These climatic conditions were modeled by randomizing 55 years of historical climate data . The precipitation model was then calibrated with 500 Monte Carlo realizations, each of consisting of 14 years, coming out to 7 , 000 total simulation years . Results of these realizations are reported probabilistically, in percent likelihood . In addition to the precipitation model, the water balance assumed that the WSD maintains the capacity to store the 100 - year, 24 - hours storm volume . The schematic water balance is illustrated in Figure 18 - 2 . The model results are primarily sensitive to the basin yield (i . e . , the Curve Number parameter was used to estimate daily runoff relative to daily precipitation depth in the model) . A sensitivity analysis was therefore completed and the conclusion from water balance modeling indicates adequate water supply to the plant for average conditions ( 50 th percentile) with a Curve Number of 80 and equates to a basin yield of approximately 10 % or higher . For the first five years of the mine life a CN as low as 60 does not result in a plant shortfall for 90 % of the model simulations . This indicates that a plant shortfall during this period is unlikely . Sensitivity analyses were also performed to assess the likelihood of a dry climatic period affecting water supply for plant startup with the base - case CN of 85 and assuming no groundwater is realized in mine year 1 . Under these conditions, the model shows adequate water supply for plant operations for the 90 th percentile of simulation runs (i . e . , less than 10 % of the 500 mine - life simulations result in a plant shortfall under the modeled conditions) . Based on the model sensitivity evaluation, there is a very low probability of a plant shortfall during plant startup and through mine year 5 . Upgrades to site monitoring of precipitation and streamflow were implemented in 2018 , including installation of H - flumes and telemetry systems for remote data access . This data will continue to be monitored and analyzed through startup and during operations . 15 . 5 Mine Maintenance Facility The maintenance facility location is in the area of the crusher near the pit rim . Major maintenance on haul trucks will be carried out at the maintenance facility . Mine area administration offices, dry, wash bays, warehouse, and fuel storage will also be located in this area . The maintenance facility will be expanded in Year 4 to accommodate the ramp - up in equipment fleet size which will start in Year 5 . 15 . 6 Tailings Management The FS mine plan will not include a separate tailings management facility . Instead the tailings and waste rock will be co - disposed in the West Tailings and Rock Storage Facility (West T/RSF) . Tailings produced by the flotation process will be sent through a filter press to achieve a volumetric moisture content of approximately 15 % to 20 % . The filtered tailings will then be conveyed from the plant to a central point in the West Tailings and Rock Storage Facility . From this location, the tailings will be placed, spread and compacted in layers to an average dry density of 1 . 8 tonnes per cubic meter (t/m 3 ) . Due to the size of the Ixtaca - S - K 1300 Technical Report Summary Page 252 of 326
Ixtaca - S - K 1300 Technical Report Summary planned operational deck, tailings may be transported from the central stacker area to the limits of the facility by truck or conveyor . The filtered tailings will be surrounded by a limestone waste rock buttress and will be deposited with shale and volcanic waste rock . Approximately 48 million tonnes of tailings and 216 million tonnes of waste rock consisting of limestone, volcanics, and black shale will be stored in the West Tailings and Rock Storage Facility . 1. Tailings Storage Alternatives Based on the results of assessments for both tailings storage locations and tailings technologies (Knight Piesold, 2017 ), the tailings storage facility initially designed as a conventional slurry tailings facility within the drainage to the west of the plant site . A geotechnical site investigation program was developed and implemented for the study to better characterize the foundation materials within the valley as well as to identify potential borrow materials . This program consisted of 12 boreholes, 18 test pits, and 6 geophysical lines as well as laboratory testing on disturbed and undisturbed samples . The results of the investigation indicated weaker than anticipated foundation conditions within the drainage west of the plant site and insufficient suitable construction materials within the TMF footprint for construction of the starter embankment and basin liner . Revisions required to the initial design to address these factors increased the costs of the starter and phased embankment construction . Based on the results of the geotechnical investigation and input received from local communities suggesting a preference for filtered tailings, a slurry facility (designed to address the results of the geotechnical investigation increased risk identified) was compared to a co - disposal facility with both rock and filtered tailings stored in the location of the West Tailings and Rock Storage Facility . This comparison considered high - level costs along with construction, operations and closure risks . Based on this assessment, the co - disposal option was considered the best approach to tailings management at Ixtaca . 2. Design Criteria Summary Key design criteria for the West Tailings and Rock Storage Facility are summarized in Table 15 - 2 . Table 15 - 2 Ixtaca West Tailings and Rock Storage Facility Design Criteria Summary Ixtaca - S - K 1300 Technical Report Summary Page 253 of 326 11years Life of Mine 6,100 tpd (Year 1) 7,650 tpd (Year 2 - 4) 13,300 tpd (Years 5 - 11) Mill Throughput (Tailings Production) 15% to 20% Filtered Tailings Volumetric Moisture Content 48 Mt 216 Mt 1.8 t/m 3 2.11 t/m 3 2.09 t/m 3 1.37 t/m 3 Total Tailings Total Waste Rock Tailings Compacted Average Dry Density Limestone Stacked Average Dry Density Shale Stacked Average Dry Density Volcanics Stacked Average Dry Density Minimum Static Factor of Safety At Peak Strength : 1 . 5 At Residual Strength : 1 . 5 Seismic : Deformation analysis showing acceptable deformations (less than 0 . 5 m to 1 m) for the calculated k yeild seismic acceleration Facility Stability Applicable Earthquake Design Ground Motion (EDGM) for the operation phase = MCE ( 1 in 10 , 000 - year event) Seismic Design Criteria
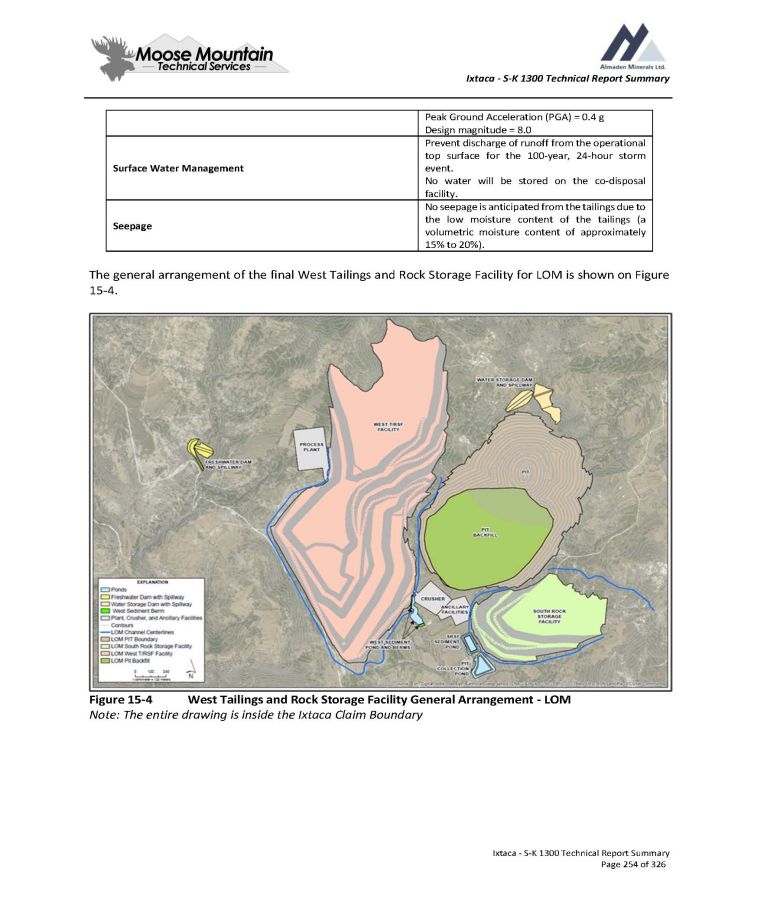
Ixtaca - S - K 1300 Technical Report Summary Peak Ground Acceleration (PGA) = 0.4 g Design magnitude = 8.0 Prevent discharge of runoff from the operational top surface for the 100 - year, 24 - hour storm event. No water will be stored on the co - disposal facility. Surface Water Management No seepage is anticipated from the tailings due to the low moisture content of the tailings (a volumetric moisture content of approximately 15 % to 20 % ) . Seepage The general arrangement of the final West Tailings and Rock Storage Facility for LOM is shown on Figure 15 - 4. Figure 15 - 4 West Tailings and Rock Storage Facility General Arrangement - LOM Note: The entire drawing is inside the Ixtaca Claim Boundary Ixtaca - S - K 1300 Technical Report Summary Page 254 of 326
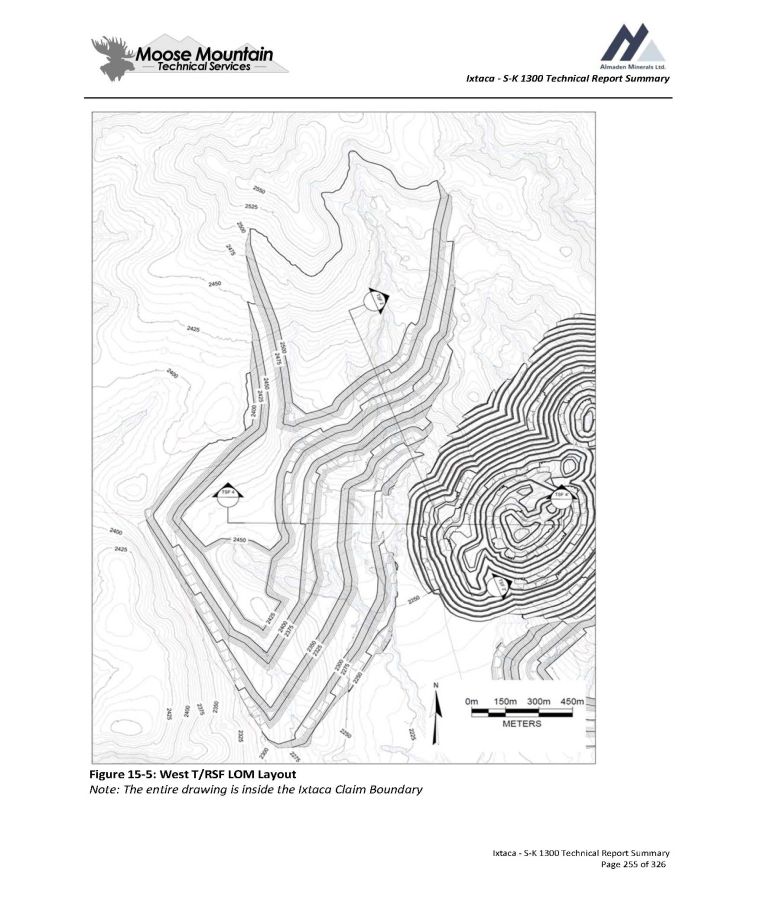
Ixtaca - S - K 1300 Technical Report Summary Figure 15 - 5: West T/RSF LOM Layout Note: The entire drawing is inside the Ixtaca Claim Boundary Ixtaca - S - K 1300 Technical Report Summary Page 255 of 326
Ixtaca - S - K 1300 Technical Report Summary 15.6.3 Tailings and Rock Storage Design The following sections provide a brief description of the West Tailings and Rock Storage Facility design . Facility Foundation Preparation – Foundation preparation for the West Tailings and Rock Storage Facility will include removal of trees, clearing and grubbing of vegetation, and removal of topsoil and unsuitable foundation materials . Topsoil will be stockpiled south of the Open Pit for use in facility reclamation . After topsoil removal is complete, unsuitable foundation materials including alluvial and colluvial soils, and unconsolidated tuff deposits will be removed to an estimated depth of 5 m . The currently - estimated extent of unsuitable foundation material removal is shown on Figure 15 - 6 . At the downgradient toe of the West Tailings and Rock Storage Facility, a shear key will be excavated . The northern portion of the shear key will be excavated to a depth of approximately 10 meters below ground surface (mbgs) with 2 (H) : 1 (V) side slopes and a bottom width of 100 m (refer to blue shaded area on Figure 15 - 6 and cross - section on Figure 15 - 7 ) . The southern portion of the shear key will be excavated to a depth of 20 mbgs with 2 (H) : 1 (V) side slopes and a bottom width of 60 m (refer to orange shaded area on Figure 15 - 6 and cross section on Figure 15 - 8 ) . The shear key excavation will be backfilled with limestone rock fill . Cross - section locations are shown on Figure 15 - 5 . Ixtaca - S - K 1300 Technical Report Summary Page 256 of 326
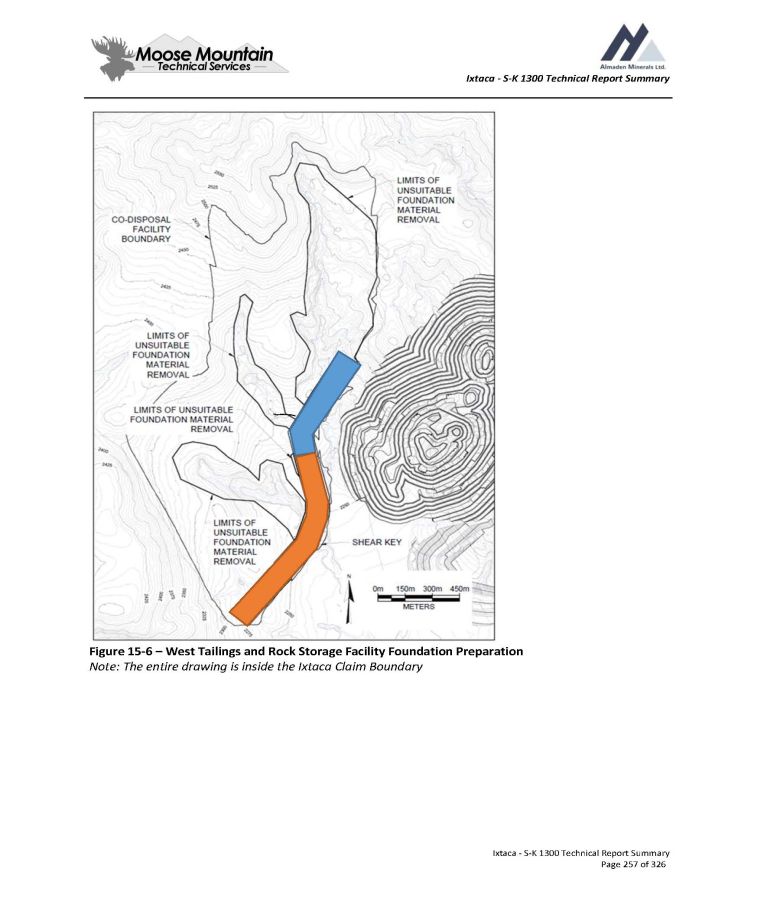
Ixtaca - S - K 1300 Technical Report Summary Figure 15 - 6 – West Tailings and Rock Storage Facility Foundation Preparation Note: The entire drawing is inside the Ixtaca Claim Boundary Ixtaca - S - K 1300 Technical Report Summary Page 257 of 326
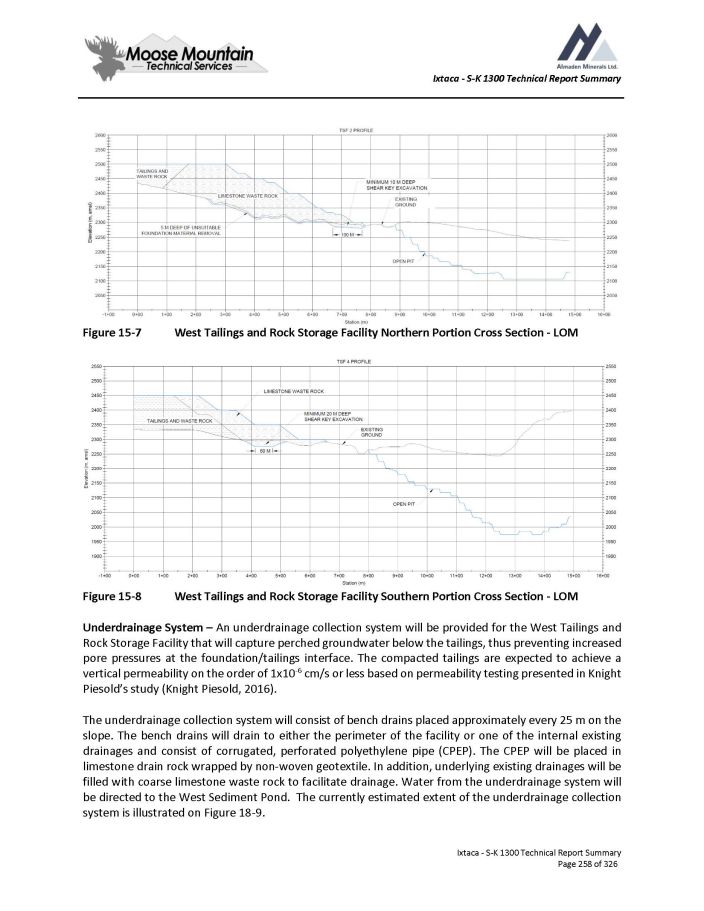
Ixtaca - S - K 1300 Technical Report Summary Figure 15 - 7 West Tailings and Rock Storage Facility Northern Portion Cross Section - LOM Figure 15 - 8 West Tailings and Rock Storage Facility Southern Portion Cross Section - LOM Underdrainage System – An underdrainage collection system will be provided for the West Tailings and Rock Storage Facility that will capture perched groundwater below the tailings, thus preventing increased pore pressures at the foundation/tailings interface . The compacted tailings are expected to achieve a vertical permeability on the order of 1 x 10 - 6 cm/s or less based on permeability testing presented in Knight Piesold’s study (Knight Piesold, 2016 ) . The underdrainage collection system will consist of bench drains placed approximately every 25 m on the slope . The bench drains will drain to either the perimeter of the facility or one of the internal existing drainages and consist of corrugated, perforated polyethylene pipe (CPEP) . The CPEP will be placed in limestone drain rock wrapped by non - woven geotextile . In addition, underlying existing drainages will be filled with coarse limestone waste rock to facilitate drainage . Water from the underdrainage system will be directed to the West Sediment Pond . The currently estimated extent of the underdrainage collection system is illustrated on Figure 18 - 9 . Ixtaca - S - K 1300 Technical Report Summary Page 258 of 326
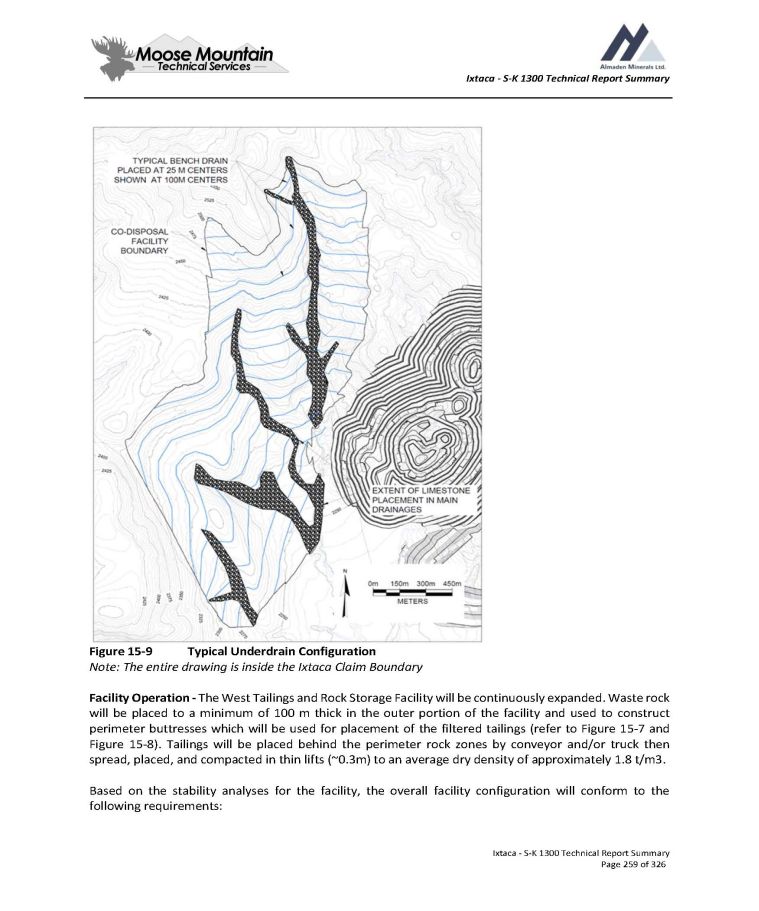
Ixtaca - S - K 1300 Technical Report Summary Figure 15 - 9 Typical Underdrain Configuration Note: The entire drawing is inside the Ixtaca Claim Boundary Facility Operation - The West Tailings and Rock Storage Facility will be continuously expanded . Waste rock will be placed to a minimum of 100 m thick in the outer portion of the facility and used to construct perimeter buttresses which will be used for placement of the filtered tailings (refer to Figure 15 - 7 and Figure 15 - 8 ) . Tailings will be placed behind the perimeter rock zones by conveyor and/or truck then spread, placed, and compacted in thin lifts (~ 0 . 3 m) to an average dry density of approximately 1 . 8 t/m 3 . Based on the stability analyses for the facility, the overall facility configuration will conform to the following requirements : Ixtaca - S - K 1300 Technical Report Summary Page 259 of 326

Ixtaca - S - K 1300 Technical Report Summary 75 m offset from the pit boundary 3H:1V overall slope (achieved using an 85m bench width) to an elevation of 2350m 2H:1V overall slope (achieved using an 35m bench width) above 2350m Maximum elevation of the southern portion of 2450m Maximum elevation of the northern portion of 2550m Each compacted lift on the operating deck will be graded to a minimum 5 % to 7 % slope to drain stormwater to a collection sump . The collection sumps will be drained via pumping and pipeline directly to the Process Plant . Water Management - Diversion channels are designed around the West Tailings and Rock Storage Facility to manage upstream stormwater and minimize seepage into the open pit highwall (refer Figure 15 - 4 ) . A runoff diversion channel and pipeline corridor (WSD Channel and Pipeline from the Water Storage Dam to the Process Plant) will be located upstream of the West T/RSF . The channel and pipeline will be relocated up - gradient following Year 4 . The West - South Diversion Channel is intended to collect and convey stormwater from natural catchments upstream of the facility, and from the limestone buttress slopes of the West T/RSF, to the West Sediment Pond . The West T/RSF (Co - disposal) (CD) East Channel is located to collect and convey stormwater from natural catchments and the slopes of the West T/RSF buttress slopes, to the West Sediment Pond . This channel is intended to minimize ponding and seepage of stormwater above the open pit highwall to maximize open pit stability . Facility Instrumentation – Instrumentation is included for ongoing monitoring of the performance of the West Tailings and Rock Storage Facility . The instrumentation will include vibrating wire piezometers installed in the foundation and tailings mass . In addition, monitoring wells will be placed downgradient of the facility to monitor groundwater quality . These are detailed in the mine environmental plans . 15.6.4 West Tailings and Rock Storage Facility Closure The objective of the closure of the West Tailings and Rock Storage Facility is to leave the facility as a physically and environmentally stable landform, with a landscape and habitat consistent with adjacent land use that will require minimal post - closure monitoring and maintenance . The mine site closure plans are detailed in Section 17 . 4 and summarized as follows : Facility slopes will be regraded to an overall maximum slope of 2 . 5 H : 1 V . Any exposed tailings will be covered with a layer of limestone waste rock with a minimum slope of approximately 5 % to direct stormwater runoff away from the surface of the facility . A 300 mm thick layer of topsoil will be placed over the entire facility (topsoil will be stockpiled as part of the foundation preparation of the West Tailings and Rock Storage Facility) and revegetated . The stormwater runoff collection sump and pipeline to the Pit Collection Pond will be decommission and removed . Stormwater runoff from the closed West Tailings and Rock Storage Facility will be routed in stormwater control channels around the facility and discharged into natural channels downgradient from the facility . Ixtaca - S - K 1300 Technical Report Summary Page 260 of 326

Ixtaca - S - K 1300 Technical Report Summary 15 . 7 Site Wide Water Management The open pit has a large upstream watershed and a water diversion system is required to prevent uncontrolled runoff from flowing into the open pit . The open pit diversion system includes the Water Storage Dam (WSD), located upstream of the open pit, with a floating pump station and pipeline to transfer water to the Process Plant, or to release excess flow to downstream communities . The WSD is a Rockfill embankment structure designed to store up to approximately 1 . 8 million m³ of water . The results of the daily water balance model illustrate that the WSD has the capacity to store the 100 - year, 24 - hours storm volume over a broad range of climatic conditions as discussed in Section 15 . 3 . The volume of water stored in the WSD is relatively constant through Year 5 and fluctuates over the year to store wet season stormwater and to supply plant makeup water and community demand . The primary outflow from the WSD is pumping of fresh water for release to the downstream community ; the pumping rate is graduated with higher pumping rates corresponding to higher water levels to maintain storm storage capacity on an annual basis . An emergency spillway will be excavated in bedrock on the west abutment of the WSD to prevent overtopping of the facility during the Inflow Design Flood (IDF) event . Extreme event flows would be routed through the spillway and discharged into a drainage upstream of the open pit . The Fresh Water Dam (FWD) is in the drainage adjacent to the west of the process plant site . The FWD is a Rockfill embankment structure designed to store approximately 330 , 000 m 3 of water and will provide makeup water to the Process Plant during the dry season . The FWD has a spillway located in the west abutment to pass overflow downstream . Diversion channels are located upstream and around the West T/RSF and South RSF to manage upstream stormwater and runoff from the facility side slopes . These surface water controls will minimize seepage under the facilities and will convey runoff from disturbed areas through sediment control ponds to settle sediment prior to release downstream of the Project . A temporary diversion channel will be located east of the open pit for Year 1 and Year 2 of the mine life to reduce stormwater inflow to the pit when the pit is small . Runoff from this channel will be routed through the South RSF sediment pond . Surface water that cannot be diverted around the pit due to topography, together with pit wall runoff, will be pumped during operations to the Pit Collection Pond located east of the South RSF . Groundwater inflows to the open pit will also be pumped from the pit bottom to the Pit Collection Pond . Horizontal drains will be installed in the pit walls to reduce pore water pressure in the pit highwalls . Water in the Pit Collection Pond will be pumped to the Process Plant as makeup water or directed to the South RSF Sediment Pond and released downstream of the project . Ixtaca - S - K 1300 Technical Report Summary Page 261 of 326
Ixtaca - S - K 1300 Technical Report Summary 1. Market Studies The information in this section was drawn from the most recent major study prepared entitled “The Ixtaca Gold - Silver Project Puebla State, Mexico NI 43 - 101 Technical Report on the Feasibility Study” dated January 24 th 2019 and updated October 3 , 2019 . 1. Market Studies The Ixtaca Project is expected to produce silver - gold doré bars . Gold and silver production will likely be sold under hedging transactions or on the spot market, or both . Terms and conditions are expected to be typical of similar contracts for the sale of doré throughout the world . Almaden has not yet entered into sales agreements with potential buyers . Contracts to support operations will include the supply and delivery of bulk explosives and contract mining . 2. Commodity Price Projections For the purpose of the Study a gold price of US $ 1 , 275 /oz, and silver price of US $ 17 /oz was assumed derived from common peer usage at the time . Exchange rate of 1 US $ = 20 MXN Peso was been assumed . 3. Comments on Section 16 The QP has reviewed the information provided by Almaden on marketing, contracts, and metal price projections, and note that the information provided is consistent with the source documents used, and that the information is consistent with what is publicly available on industry norms . The information can be used in mine planning and financial analyses in the context of this Report . Ixtaca - S - K 1300 Technical Report Summary Page 262 of 326
Ixtaca - S - K 1300 Technical Report Summary 1. Environmental Studies, Permitting, and Plans, Negotiations, or Agreements with local individuals or groups The information in this section was drawn from the most recent major study prepared entitled “The Ixtaca Gold - Silver Project Puebla State, Mexico NI 43 - 101 Technical Report on the Feasibility Study” dated January 24 th 2019 and updated October 3 , 2019 . Significant environmental and social study and analyses have been conducted for the Ixtaca Project . 1. Environmental Studies A summary of key physical, chemical, and biological environments is provided in the following sub - sections . 1. Meteorology Site - specific climate data collection began in 2013 , using an automated climate station established by KP downstream of the then proposed tailings management facility (TMF), at an elevation of approximately 2250 m . This station, which is called the Ixtaca Climate station, is currently operating and collects data of air temperature, humidity, solar and net radiation, wind speed and direction, precipitation, and atmospheric pressure . In 2015 , two additional automated precipitation stations were added, both of which consist of a tipping bucket rain gauge and a data logger . The Almeya station is located upstream of the TMF at an approximate elevation of 2615 m, and the Bodega station is located downstream of the proposed Project area at an approximate elevation of 2250 m . In 2018 , an additional tipping bucket rain gage was added at the Puente station located in the upper portion of the watershed containing the open pit . Also in 2018 , telemetry systems were added to the site monitoring program to enable desktop access of remote data . Summary data from the Ixtaca Climate station includes a mean annual temperature of approximately 14 Σ C, with mean monthly temperatures ranging from a low of approximately 12 Σ C to 13 Σ C in December/January to a high of approximately 16 Σ C to 17 Σ C in April/May/June . Other metrics from the station include (Knight Piésold, 2017 ) : Relative humidity measurements indicate that the climate is reasonably dry, particularly in the winter months, with an annual average of approximately 70%. Over an approximate three - year period, the maximum wind speed was 14.9 m/s, and monthly average wind speeds ranged from 2 m/s to 3 m/s. The predominant wind directions were north and north - west. Solar radiation is typically greatest in April and least in October, and ranges from approximately 5.9 kWh/m² to 3.4 kWh/m². The mean annual lake evaporation is estimated to be approximately 714 mm, with monthly mean values ranging from approximately 46 mm in December/January to 74 mm in May. The long - term mean annual precipitation is estimated to be 720 mm, and occurs entirely as rainfall. The wet season is from May to October, when 84% of annual rainfall is expected to occur, on average. The wettest month is typically June. Ixtaca - S - K 1300 Technical Report Summary Page 263 of 326
Ixtaca - S - K 1300 Technical Report Summary Rainfall on site, particularly during the wet season, tends to arrive in short duration, high intensity bursts . Barometric pressure is relatively uniform year round at approximately 102 . 6 kPa . Additionally, climate data are available from Government of Mexico regional meteorological stations ; several of which are located within 35 km of the Project, each with over 25 years of daily data on precipitation, evaporation, and minimum and maximum temperatures . The Ixtaca Climate station data were compared to the regional stations and found to have similar data trends . 17 . 1 . 2 Surface Hydrology The local climate along with size, vegetation cover, and soil and rock types of each drainage basin all contribute to the runoff response of Project area watersheds . Typical of many areas in Mexico, the Project experiences rainfall primarily as short duration, high - intensity storm events during the wet season (May to October) . This type of precipitation distribution combined with the steep topography and poorly draining soils results in a rapid runoff response with correspondingly high peak flows of short duration . The distinct dry and wet climatic seasons in the region result in intermittent and episodic streamflows in the wet season and little to no flow during the dry season . The Project area streams are above the water table and constant baseflow is not observed ; however, interflow/ temporary baseflow is observed as flows decrease from low to little or no flow through the dry season . Five streamflow monitoring stations were installed at the Project in 2014 and were enhanced in 2017 following complications with high sediment loads and were further updated in late 2018 . Continuous streamflow records for streams in the Project area are currently being collected . Data collected to date include the following (Knight Piésold, 2017 ) : The mean annual runoff is estimated to range from 58 mm ( 1 . 8 l/s/km 2 ) to 87 mm ( 2 . 8 l/s/km 2 ) . Streams in the area follow an episodic/ephemeral hydrologic regime, and the annual hydrographs mimic the patterns of annual precipitation, with the highest flows typically occurring during the wet season of May to October and the lowest flows occurring during the dry season of November to April . The stage records for the Project site stream gauges exhibit the ‘flashy nature’ of streams in the area, with water levels rising and falling very rapidly in response to short duration high - intensity rainstorms . Return period peak discharge values at the Project were calculated to range between 2 m 3 /s for a 2 - year return period, up to 77 m 3 /s for a 500 - year return period . Flows typically fall to very low levels during the dry season, and some creeks go completely dry for short and extended periods each year . Low flows are typically higher at the Project area in northern upland sites than in southern lowland sites . 17 . 1 . 3 Surface Water Quality Surface water quality sampling sites were established to target background and pre - mining (baseline) water quality upstream and downstream of the project facilities . Thirteen surface water monitoring Ixtaca - S - K 1300 Technical Report Summary Page 264 of 326
Ixtaca - S - K 1300 Technical Report Summary locations were sampled as conditions allowed from 2009 to 2016 (KP, 2017 a) and in 2018 by SRK (SRK, 2018 ) . The surface water quality monitoring locations are shown on Figure 20 - 1 . Sample collection has been intermittent depending on flow conditions . Upstream sites in the El Tecolote and Coxalenteme catchments had sufficient flow to sample surface water quality year - round but the monitoring sites in the lower reaches of these catchments were frequently reported as dry outside of the rainy season (KP, 2017 a) . Flow conditions were always sufficient to collect water quality samples from the monitoring locations farther downstream in the Rio Apulco and Rio Los Lobos and only occasionally reported as dry in the Rio Los Ameles . During the most recent sampling event in April 2018 , only four of the 13 surface water monitoring stations had adequate water for sampling (Apulco, Hotel, Puente, and Sector Riego) . After the April 2018 site visit SRK recommended the removal of four monitoring stations (Tuligtic 1 , Tuligtic 2 , El Protrero, and RLA 100 E) . Water within the project area is generally classified as neutral to slightly basic, hard to very hard and well - buffered, with variable turbidity and total suspended solids (KP, 2017 a) . Turbidity and TSS exceed the relevant water quality standards at some sites . Metal concentrations were generally highest toward the end of the wet season, in September and October, and conclusions regarding concentrations at most sites during the drier season cannot be made as samples were not typically collected due to insufficient flow . When compared with the water quality standards of Ley Federal de Derechos (aquatic life), NOM - 127 - DW (drinking water standards), and NOM - 001 (discharge standards for irrigation and aquatic life), the baseline surface water quality exceeds numerous standards . The most frequent aquatic life guideline exceedances were reported for total suspended solids, ammonia, dissolved and total aluminum, dissolved and total barium, and total iron . Concentrations of these parameters exceeded the standard in most samples collected from most sites . Total lead and zinc also exceeded the standard in samples collected from most sites ; however, standard exceedances were less frequent (i . e . less than half of the total number of samples) . Parameters that exceeded the standard sporadically or at only one or two sites include total beryllium, chromium, copper, mercury, molybdenum, and silver, and dissolved iron, molybdenum, and zinc . Parameters that exceeded irrigation standards in at least one sample collected from most sites include TSS, total aluminum, total iron, and total manganese . Fluoride, sulphate, and dissolved manganese concentrations also exceeded the standard in at least one sample ; however, exceedances were limited to one or two sites . Exceedances of the drinking water standard (NOM - 127 - DW) were frequently reported for pH, turbidity, ammonia, nitrite, dissolved and total aluminum and iron, and total barium, manganese, and sodium . Parameters that exceeded the drinking water standard less frequently include sulphate, dissolved manganese, and total cadmium and chromium . Elevated baseline concentrations of metals and other parameters are common in areas close to mineral deposits (e . g . , the El Tecolote and Coxalenteme catchments), or in large river systems that carry high total suspended solids (e . g . , the Río Apulco/Río Los Ameles) . The site locations are illustrated on Figure 17 - 1 . Ixtaca - S - K 1300 Technical Report Summary Page 265 of 326
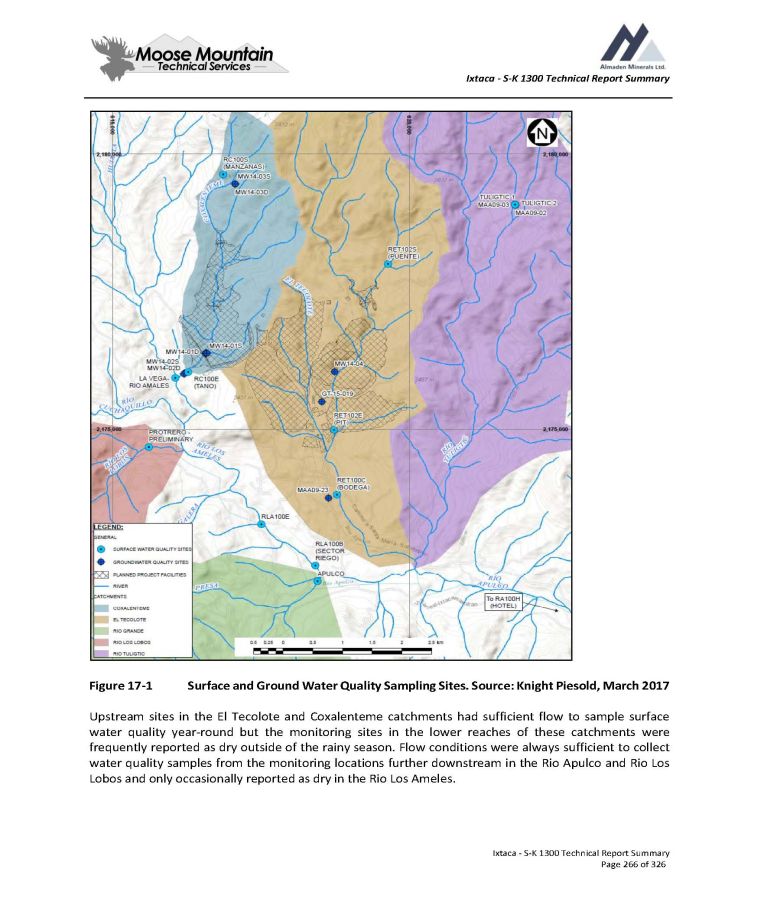
Ixtaca - S - K 1300 Technical Report Summary Figure 17 - 1 Surface and Ground Water Quality Sampling Sites . Source : Knight Piesold, March 2017 Upstream sites in the El Tecolote and Coxalenteme catchments had sufficient flow to sample surface water quality year - round but the monitoring sites in the lower reaches of these catchments were frequently reported as dry outside of the rainy season . Flow conditions were always sufficient to collect water quality samples from the monitoring locations further downstream in the Rio Apulco and Rio Los Lobos and only occasionally reported as dry in the Rio Los Ameles . Ixtaca - S - K 1300 Technical Report Summary Page 266 of 326

Ixtaca - S - K 1300 Technical Report Summary Ion concentrations generally decreased from upstream to downstream and were higher in the Coxalenteme and El Tecolote catchments than at sites outside of the project area . Water within the project area is generally classified as neutral to slightly basic, hard to very hard and well - buffered, with variable turbidity and total suspended solids (TSS) . Turbidity and TSS increased from upstream to downstream within the Coxalenteme and El Tecolote catchments and exceeded the relevant water quality standards at some sites . Total and dissolved concentrations of some metals (aluminum, copper, chromium iron, and lead) increased from upstream to downstream in the El Tecolote catchment and in the Coxalenteme catchment . Metal concentrations were generally highest toward the end of the wet season, in September and October . Analytical results were compared with the water quality standards included in the following : Ley Federal de Derechos (LFD) and Norma Oficial Mexicana (NOM ; NOM - 127 - DW (drinking water standards) and NOM - 001 (discharge standards for irrigation and aquatic life)) . The standards were selected based on the potential local uses, which include : Aquatic Life (NOM 001 Aq and LFD - Aq), Irrigation (NOM - 001 - Irrigation and LFD - Irrigation), and Drinking Water (NOM - 127 - DW) . 17.1.4 Groundwater Previous studies of the groundwater, including monitoring well constructions, hydraulic testing, water - quality testing, and environmental background and pre - mining (baseline)studies were conducted by Hidrogeologos Consultores ( 2013 ) and Knight Piésold ( 2014 , 2017 a, 2017 b, and 2017 c) . For the Ixtaca technical report, a field data collection program for hydrogeologic characterization was carried out and a 3 D numerical model of groundwater flow beneath the Ixtaca Project area was developed . Field activities consisted of packer isolated interval testing (packer testing) ; monitoring well construction, development, and testing of newly installed and existing wells ; and water level monitoring . A technical report (SRK, 2018 ) documents the field work and groundwater modeling . The study evaluates pre - mining, mining, and post - mining hydrogeological conditions and predicts dewatering requirements, and potential environmental impacts . The proposed Project facilities lie in two catchment areas, which are tributaries of the Río Los Ameles/Río Apulco river system : Coxalenteme and El Tecolote . Streams in the area follow an episodic/ephemeral hydrologic regime (Knight Piésold, 2017 b) . The annual hydrographs mimic the pattern of annual precipitation, with the highest flows typically occurring during the wet season of May to October and the lowest flows occurring during the dry season of November to April . Water use in the project area consists of domestic use of springs occurring in the catchment above the project area . Springs and seeps within the project area were mapped and characterized by AML personnel . Additional springs and seeps within the region mapped by outside sources were provided by AML . These data along with water levels within the project area were combined to evaluate and understand groundwater gradients, to evaluate potential variability in hydraulic conductivity, and to further refine the conceptual groundwater model . SRK’s 2018 field program consisted of drilling four core holes, packer testing, monitoring well installation, hydraulic testing of existing and newly installed wells, and water level monitoring . A summary of prior Ixtaca - S - K 1300 Technical Report Summary Page 267 of 326
Ixtaca - S - K 1300 Technical Report Summary testing, instrumentation, and well construction information for the Ixtaca Project was compiled from multiple volumes of historic reports, figures, and appendices . Based on the review, 58 existing water level monitoring, testing, and installation points were identified within the project boundary . Water level elevations range from 49 . 5 mbgs and 2 , 554 meters above measured sea level (mamsl) in the high country north of the project area to 30 . 5 mbgs and 2 , 540 mamsl in the low country south of the pit area . Generally, groundwater flow follows topography, with a steep downward gradient from north to south near the project . Two areas do not follow the general pattern, including an area underlain by undifferentiated ash units west of the proposed pit, and the lowland area south of the proposed pit . Both exhibit relatively flat - water tables . Hydraulic testing during the 2018 field program was done using packers to isolate test intervals in the newly drilled core holes before well construction . Additional testing was performed in accessible existing and newly - installed monitoring wells . Testing included slug tests, constant - rate injection tests, and constant - head injection tests . Lower permeability intervals were tested using stepped - pressure, or Lugeon methods . A total of 44 tests were performed during the 2018 field program ( 21 packer and 23 wells tested) . An additional 203 packer and well tests were performed during previous field campaigns between 2012 and 2017 . Short - term hydraulic testing revealed a wide range of hydraulic conductivity values within the various hydrogeologic units of the project area . After careful review of the historic data, it was decided not to use the information in developing the 3 D numerical groundwater model . However, in the future these data may be useful in mitigating uncertainties or in identifying areas requiring additional characterization . The conceptual model of groundwater flow at Ixtaca includes the following components : The long - term mean annual precipitation is estimated to be 720 mm and occurs entirely as rainfall . The wettest month is typically June . The mean annual evapotranspiration is estimated to be approximately 714 mm, with monthly mean values ranging from 46 mm in December to 74 mm in May . Groundwater recharges from precipitation and generally flows from topographically high areas (highland with elevation of about 3 , 000 mamsl in the north to topographically low areas in the south (the lowest elevation is 2 , 150 mamsl at the Rio Apulco River south of the proposed pit) . The recharge from precipitation in the highlands is estimated to be 72 mm/a or 10 % of precipitation . The recharge in the lowlands is estimated to be about 14 . 4 mm/a or 2 % of precipitation . These recharge rates, and their distribution based on topography were obtained during the process of model calibration to measured water levels . Rio Grande and Rio Apulco are primary rivers near the project and groundwater discharges into them and their tributaries . Flows in these rivers decrease significantly during dry months . Additional rivers in the region that are typically ephemeral include Rio Loa Ameles, Rio Los Lobos, and Rio Tuligitic . Hydrogeologic units in the project area include : o Volcaniclastics – The volcaniclastic unit shows localized sub - layers of fine ash, coarse ash, breccia, and lapilli tuff . Permeability of the volcaniclastics varies depending on the degree of consolidation and fracturing . Volcaniclastic materials associated with hydrothermal alteration are typically more competent and more prone to fracturing, which increases the permeability . o Limestone and Shale – The sedimentary units are typically of low permeability, but hydraulic conductivity increases locally along fold axes and near the intrusive contact . Ixtaca - S - K 1300 Technical Report Summary Page 268 of 326
Ixtaca - S - K 1300 Technical Report Summary o Intrusions/Dikes – The intrusive bodies are expected to have low permeability, except at the contacts with host rocks . Fracturing and permeability locally increases in the sedimentary host rocks near intrusions . o Structure – The limited testing conducted across faults during drilling did not identify structures with increased permeability or faults acting as major barriers to groundwater flow . o Additional to bedrock water - bearing zones, saturated overburden is present within the project area . The overburden is generally thin (less than 1 m) but reaches up to 7 m thick in river valleys . Zones of alluvium, colluvium, ash - tuff, and/or an agglomeration of all may be up to 100 m thick based on drilling information south of the proposed pit location . Measured hydraulic conductivity values vary over a wide range, from 0 . 00003 m/d to 9 m/d (by more than five orders of magnitude as described in Section 3 ) and do not allow definition of hydrogeological units based on lithological signature . Available testing data indicates that the measured hydraulic parameters show a trend of hydraulic conductivity decreasing with depth . Based on the analyses, three major hydrogeological units were defined : o Shallow bedrock (upper 50 m) with intermediate hydraulic conductivity; o Intermediate bedrock (depth from 50 to 300 m) with low hydraulic conductivity; and o Deep bedrock (depth below 300 m) with very low hydraulic conductivity. Water level elevations throughout the project area exhibit a steep hydraulic gradient, with levels ranging from 2 , 540 mamsl in the highlands north of the project to 2 , 154 mamsl just south of the pit over approximately 4 . 5 km . This generally indicates the presence of low hydraulic conductivity rocks . Flat water level gradients were observed in the ash west of the proposed pit at 2 , 350 mamsl and the area south of the proposed pit extending to the Rio Apulco at 2 , 150 mamsl . These flat groundwater gradients support the assumption that these areas exhibit elevated hydraulic conductivity . A numerical groundwater model for the Ixtaca Project was developed using the MODFLOW - SURFACT finite - difference code (Hydrogeologic, 1996 ; Harbaugh and McDonald, 1996 ) and the Groundwater Vistas v . 7 interface developed by Environmental Simulations, Inc . (Rumbaugh and Rumbaugh, 2017 ) . The groundwater model domain covers approximately 157 square kilometers (km 2 ) within the vicinity of the proposed open pit mine . The northern, western and eastern model boundaries primarily follow topographic divides and/or are parallel to regional groundwater flow and are thus assumed to be ‘no flow’ boundaries . The southern boundary is defined by the Apulco River . Twelve model zones were created considering the low and high hydraulic conductivity values established from historic aquifer testing data . Each model zone has specific values for horizontal (Kh) and vertical (Kz) hydraulic conductivity (K), specific storage (Ss) and specific yield (Sy) . Storage parameters are based on literature and onexperience from projects with similar conditions . The creeks and springs in the model area are represented by ‘drain cells’ . The Apulco River is assumed to flow for most of the year . Within the model area it is therefore represented using model ‘river cells’ . The mine plan for the open pit was dated 6 August 2018 and consists of annual pit layouts that span an 11 - year period . They were processed into drain cells with the location and head representing the elevation of the pit for each time period . The model simulates transient filling of the pits using the LAK 2 package for MODFLOW - SURFACT (Council 1997 ) . Lake cells were assigned based on the ultimate pit - shell excavations and planned backfill, as provided by Ixtaca ( 2018 ) . Ixtaca - S - K 1300 Technical Report Summary Page 269 of 326
Ixtaca - S - K 1300 Technical Report Summary Head distribution in a steady state calibration depends on recharge, hydraulic conductivity values (K), sources, sinks and boundary conditions . In the case of the Ixtaca model, the valid K values from short - term tests are considered good qualitative indicators of the properties of the rocks . However, because of the limited number of valid tests and the concentrated coverage (within the proposed pit extents) of the 2018 tests, the numerical model does not rely on K values for calibration . Instead, water level elevations from the existing monitoring wells are used . The short - term tests are used qualitatively to adjust the numerical groundwater model where needed . The calibration objective was reached when an acceptable correlation was obtained between the observed and simulated water levels and hydraulic gradient . Twenty - six of the 34 target water levels over the model area were calibrated to within 3 m of observed, and 4 of the remaining 8 were within 4 m of observed . No long - term hydraulic test data suitable for transient calibration are available for the Ixtaca site . Consequently, a transient calibration was obtained using water level fluctuations in response to seasonal recharge . Recharge factors were calculated over a 3 - year period and the resultant fluctuations in groundwater levels compared to water level observations . In the author’s opinion, the groundwater model reproduces hydrogeological conditions prior to the mining and reasonably calibrated to the measured water levels, and the model can be used for predictive simulations . Predicted passive groundwater inflows to the proposed pit range between 19 L/s ( 1 , 618 m 3 /d) and 34 L/s ( 2 , 974 m 3 /d) . Changes in simulated average pit inflows over time will occur in response to the mine pit elevation, the extent of the mine pit area, and the drawing down of the local water table over time through release of groundwater storage . The maximum inflows are reached in year 2 ( 34 L/s when the open pit is rapidly excavated within the most permeable upper bedrock) and the final pit inflow in year 11 is 20 L/s . Actual pit groundwater inflows are likely to be sporadic, with higher inflows related to the intersection of preferential groundwater flow paths (such as fractures) during mining . Based on the predictive results, the groundwater inflow into the pit could be handled passively (by in - pit sumps) without any active dewatering by perimeter wells or pit wall horizontal holes . Additional inflow from direct precipitation to the pit (less evaporation) is estimated to be 29 L/s ( 2 , 517 m 3 /d) under average long - term conditions . Thus, direct precipitation to the pit will likely form the largest component of water to be pumped from the pit sumps during mining . It is assumed that up - gradient/ catchment runoff will be diverted around the pit during mining to the extent possible . Groundwater flow near the open pit is predicted to be radially inward from all directions . The predicted change in the long - term water table from pre - mining water levels reaches a maximum of 200 m within the pit . The 1 - m drawdown zone extends 1 km north of the pit, 2 km west of the pit, 1 . 5 km east of the pit and 3 km south of the site, thus just reaching the banks of the Apulco River . In response to the lowered groundwater levels around the pit during mining, groundwater baseflow to the creeks and springs in the catchment are predicted to decrease by 9 % (from 5 , 937 m 3 /d to 5 , 420 m 3 /d ; 69 L/s to 63 L/s) compared to pre - mining conditions . In addition, net groundwater baseflow to the Apulco River decreases from an average of 8 L/s ( 710 m 3 /d) to a net groundwater contribution of 0 L/s during the 11 years of mining . The model predicts that a pit lake will form after mining, and the pit lake will exhibit both spillover and flow - through characteristics . The pit lake will reach 90 % of full recovery within 90 to 100 years . After 113 years, the pit lake elevation reaches the maximum possible stage ( 2 , 230 mamsl) before surface spillover Ixtaca - S - K 1300 Technical Report Summary Page 270 of 326
Ixtaca - S - K 1300 Technical Report Summary commences at a rate of 15 L/s down - gradient (south) of the pit . Groundwater seepage will be only inwards for the first 40 years following the end of mining ; thereafter, there will also be groundwater outflows, with equilibrium conditions being 7 L/s inflow and 6 L/s outflow to groundwater . There are varying levels of uncertainty associated with model parameters, and sensitivity analysis was undertaken to evaluate the implications of these uncertainties . The sensitivity analysis results indicate that the model is most sensitive to increases in the specific yield . The results have a medium sensitivity to hydraulic conductivities . Doubling the hydraulic conductivity of the hydrogeological units increases the average dewatering rate by 21 % , with the range being between 25 L/s and 35 L/s ; Doubling the specific yield and specific storage increases the average dewatering rate by 42 % , with the range being between 27 L/s and 46 L/s . Sensitivity analysis indicates that the post - mining simulation results are most sensitive to precipitation parameters, where alterations by 25 % decrease/increase start of surface spillover by 25 years and flow rates increase/decrease by 7 L/s . 17 . 1 . 5 Groundwater Quality To provide background and pre - mining (baseline)groundwater data for the project, seven groundwater monitoring wells were installed in 2014 (KP, 2015 ) . About a year later geotechnical borehole GT - 15 - 019 was converted to a monitoring well . The groundwater quality monitoring program includes both upgradient and downgradient groundwater wells . Monitoring well locations are shown on Figure 17 . 2 . Ixtaca - S - K 1300 Technical Report Summary Page 271 of 326
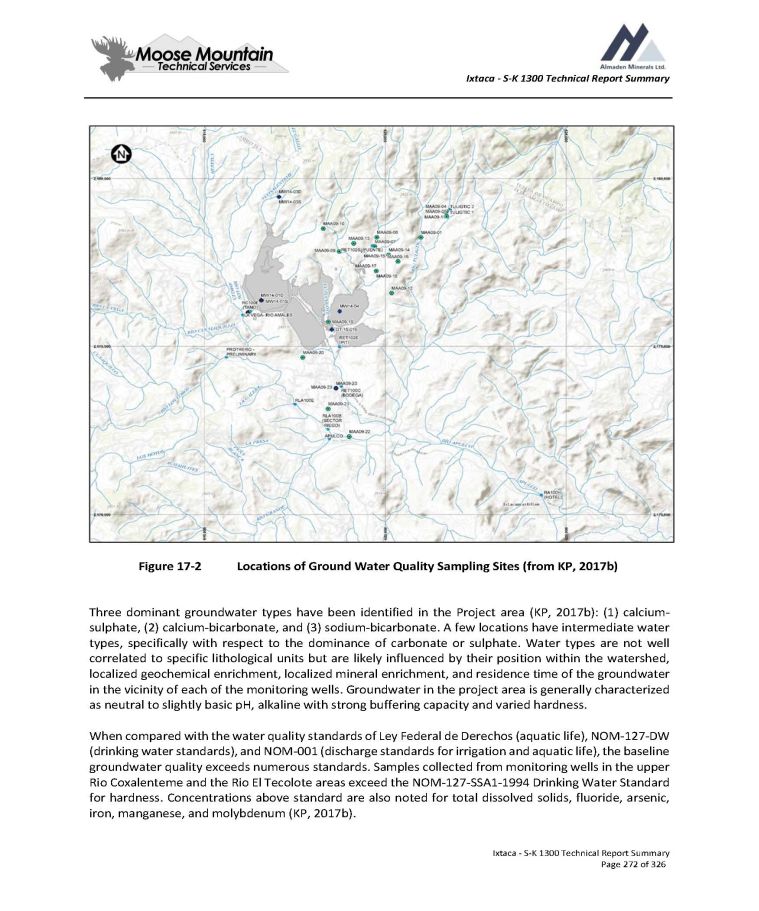
Ixtaca - S - K 1300 Technical Report Summary Figure 17 - 2 Locations of Ground Water Quality Sampling Sites (from KP, 2017b) Three dominant groundwater types have been identified in the Project area (KP, 2017 b) : ( 1 ) calcium - sulphate, ( 2 ) calcium - bicarbonate, and ( 3 ) sodium - bicarbonate . A few locations have intermediate water types, specifically with respect to the dominance of carbonate or sulphate . Water types are not well correlated to specific lithological units but are likely influenced by their position within the watershed, localized geochemical enrichment, localized mineral enrichment, and residence time of the groundwater in the vicinity of each of the monitoring wells . Groundwater in the project area is generally characterized as neutral to slightly basic pH, alkaline with strong buffering capacity and varied hardness . When compared with the water quality standards of Ley Federal de Derechos (aquatic life), NOM - 127 - DW (drinking water standards), and NOM - 001 (discharge standards for irrigation and aquatic life), the baseline groundwater quality exceeds numerous standards . Samples collected from monitoring wells in the upper Rio Coxalenteme and the Rio El Tecolote areas exceed the NOM - 127 - SSA 1 - 1994 Drinking Water Standard for hardness . Concentrations above standard are also noted for total dissolved solids, fluoride, arsenic, iron, manganese, and molybdenum (KP, 2017 b) . Ixtaca - S - K 1300 Technical Report Summary Page 272 of 326
Ixtaca - S - K 1300 Technical Report Summary 17 . 1 . 6 Geochemistry A program of geochemical sampling and analyses to determine the acid rock drainage and metal leaching (ARDML) potential of mine rocks was carried out . The program consisted of 276 samples of drill core representing future waste rock ( 191 samples), low - grade ore ( 40 samples), and ultimate pit wall rocks ( 45 samples) . In addition to the data from this program, Almaden has a database consisting of nearly 130 , 000 multi - element analyses for 35 elements . Theanalytical program included the following analyses : Multi - element analyses of 59 elements by aqua regia digestion with ICP - MS finish. Acid - base Accounting, which consisted of the following: o Total sulphur and sulphate sulphur. Sulphide sulphur was calculated by difference, from which acid generating potential (AP) is calculated (S 2 - x 31.25 = AP) o Total inorganic carbon o Paste pH, using method EPA 600/2 - 78 - 054/3.2.2 (Sobek et al., 1978) o Acid neutralizing potential (NP). NP was determined by two methods: ▪ The modified method of Lawrence and Wang (1997), and ▪ Laboratory analysis of total inorganic carbon (TIC). Mineralogical analyses were conducted on five samples of waste rock and one sample of low - grade ore at SGS Canada using the QEMSCAN high definition mineralogical scanning method . The Shake Flask Extraction (SFE) method was conducted on 11 samples, using the protocol described in Price ( 2009 ) with a water - to - rock ratio of 3 : 1 . One duplicate test was run using a 20 : 1 water - to - rock ratio as a comparison to the Price ( 2009 ) method . The SFE provides an estimate of leachate quality resulting from the first flush by meteoric water . Kinetic Net Acid Generation (KNAG) tests (Price, 2009 ) were conducted on 16 samples of waste rock and 12 samples of ultimate pit wallrock, with multi - element analyses of KNAG leachate . Humidity cell testing of a yet to be determined number of samples is recommended and if approved will commence as soon as practical . The testing program was designed to obtain data sufficient to ensure compliance with best practice for mine waste management . The program also complies with Mexican regulations, including NOM - 157 - SEMARNAT - 2009 , which establishes procedures to implement mine waste management plans and Anexo Normative 5 of NOM - 141 - SEMARNAT - 2003 , which describes the test methods for whole rock chemistry analysis, leach tests and acid base accounting . Based on sample distribution, the program concluded that approximately 5 % of waste rock, 30 % of low grade ore, and 7 % of pit wall rocks will be PAG . The potential for ARDML from these facilities will be assessed in the predictive geochemical modeling task which will be reported in a subsequent document . SFE testing on waste rock and low - grade indicated no constituents leaching at concentrations above NOM - 157 or NOM - 001 limits . However, arsenic, antimony, manganese, molybdenum, and selenium in SFE leachate exceeded World Health Organization guidelines . Ixtaca - S - K 1300 Technical Report Summary Page 273 of 326
Ixtaca - S - K 1300 Technical Report Summary The low - grade ore stockpile will be removed by the end of mining, so there is no potential for environmental impacts from low - grade ore after closure . Runoff from the LGO stockpile will be managed to prevent impacts to water resources during operations . The metallurgical processing flowsheet was not updated from the PFS, so no new tailings products were generated for geochemical testing . Flotation and cyanide detoxed tailings were subjected to geochemical testing for the PFS (KP, 2017 c) . The flotation tailings solids exceed regulatory limits for antimony, arsenic, and lead, but no analytes exceed regulatory limits in SFE leachate . The detoxed tailings exhibit no exceedances of either solid or aqueous concentrations in the SFE test results . It should be noted that the SFE indicates only short term leaching potential rather than long term . From a bulk perspective, there will be more than enough neutralizing potential present in the tailings, waste rock, and pit walls to neutralize any acid generated . However, there are still unknowns that must be evaluated in the predictive modeling . One unknown is how the fraction of PAG materials will affect the overall drainage quality . If the PAG rocks are concentrated in specific zones, then localized ARD may occur at specific stages of mining from the waste rock stockpiles or the pit walls . The current geologic model and mine plan lack the sequencing detail to evaluate this potential, so identification of localized ARD will likely have to be done operationally . Another unknown is the potential for long term neutral metal drainage . Oxyanions that are mobile at neutral pH, including antimony, arsenic and selenium, must be assessed in greater detail . The potential for long term metal leaching will be addressed in the predictive modeling report . 17 . 1 . 7 Flora and Fauna According to INEGI (Carta de Uso de Suelo y Vegetación, Serie V, INEGI 2011 ) and with the flora and fauna field work performed by the company within the Sistema Ambiental Regional (SAR) and the footprint of the mine, the SAR showed ten types of vegetation, from which only three correspond to natural vegetation : Pine forest (22.21%), Táscate forest (8.99%) Pino - encino forest (3.10%). The remaining vegetation is dedicated to agriculture, and secondary vegetation and grass ; the area is largely degraded . In the footprint of the mine the natural vegetation represented by Táscate forest with only a 0 . 05 % from the total area, the rest of the vegetation is secondary arboreal vegetation from Táscate forest ( 64 . 97 % ), agriculture ( 26 . 86 % ) and induced grass ( 8 . 11 % ) with Junierus deppeana and Pinus Pseudostrobus the dominant species . The SAR and the footprint of the mine have been historically impacted by anthropogenic (agriculture and cattle raising), resulting in a widely fragmented Pinus vegetation, leaving auspicious room for the establishment of secondary vegetation . Diversity in the SAR is considered as medium, due to the presence of dominant species of each vegetation type . Inside the footprint of the mine 60 species of flora have been registered, 22 of them are weeds . Ixtaca - S - K 1300 Technical Report Summary Page 274 of 326
Ixtaca - S - K 1300 Technical Report Summary Of the species at risk and protected by NOM - 059 - SEMARNAT - 2010 inside the SAR and the footprint only one species was identified : Cupressus Iusitanica (white cedar) . The geographic distribution of this species is wide in Mexico, it is distributed all along the Sierra Madre Oriental, Sierra Sur, Occidental, Meseta de Chiapas, and part of the Trans Mexican Volcanic Belt . It is reported as a species with no problems for survival . At total of 117 species of fauna have been registered ( 6 amphibians, 15 reptiles, 25 mammals and 71 birds) . The fauna diversity inside the SAR is considered as medium high . In respect to the NOM - 059 - SEMARNAT - 2010 two amphibian species were cataloged within the NOM : Aquiloeurycea cephalica (as threatened species) and Lithobates montezumae (As Pr) ; six reptile species : Crotalus ravus y Phrynosoma orbiculae (as Category A for protection ), Barisia imbricata, Plestiodon Iynxe ; Salvadora bairdi and Sceloporus grammicus as Pr ; one mammal species Glaucomys Volans as category A for protection . Nine species of birds were registered inside the mine footprint, three of them are in risk category : Accipeter cooperil, Chatharus mexicanus with Pr category and Tilmatura dupontii as A gategory, Contopus cooperi, Myarchus tuberculifer, Pheucticus melanocephalus, Setophaga oocidentalis, Troglodytes aedon and Tyrannus melancholicus . The majority of these species are migratory . 17.1.7.1 Relocation of flora and fauna. The Ixtaca project environmental management plan includes the following activities for mitigating impacts to flora and fauna : To rescue the largest quantity of individual plants (vascular and epiphytes), during site preparation previous to construction, with regulated environmental techniques; Relocate previously rescued flora individuals, to a similar surface from the original ; List the priority flora species for the rescue, endemic species or all species catalogued as risk species for NOM - 059 - SEMARNAT - 2010 ; Avoid or reduce the adverse effects on the fauna inside the footprint of the project, by identifying adequate methods for the rescue and relocation of individuals, as well as the site rehabilitation all inside the footprint . Relocate species of wild fauna that could be affected by the development, or by any mine infrastructure for the development of the project . Special emphasis will be given to species under NOM - 059 - SEMARNAT - 2010 , with slow displacement ; for the capturing and relocation close to the site area ; Capture and relocation of species with slow displacement, who’s habitat or distribution is restricted . Implement adequate techniques for the capture and relocation controlled to avoid harm or stress to all organisms of wild fauna ; Identify relocations sites, close to and with similar natural characteristics to the original habitat . Verify that the relocation zones present equivalent environmental conditions from rescue zones and that and ecosystem overload is not generated ; Ixtaca - S - K 1300 Technical Report Summary Page 275 of 326

Ixtaca - S - K 1300 Technical Report Summary Train the project work force to identify fauna species and to protect them ; All these activities will be performed to comply with NOM - 059 - SEMARNAT - 2010 . In general, where necessary and reasonable, any sensitive species of flora and fauna within the proposed disturbance footprint will be relocated prior to development as part of the Environmental Management Plan . There are no known species of flora and fauna located at the Ixtaca site that will prevent the development of the proposed mine . 17 . 2 Permitting Mine permitting in Mexico is administered by the federal government body Secretaría de Medio Ambiente y Recursos Naturales (SEMARNAT) . Guidance for the federal environmental requirements is derived from the Ley General del Equilibrio Ecológico y la Protección al Ambiente (LGEEPA) . Article 28 of the LGEEPA specifies that SEMARNAT must issue prior approval to parties intending to develop a mine and mineral processing plant . An Environmental Impact Assessment (Manifestación de Impacto Ambiental (MIA) by Mexican regulations) is the mechanism whereby approval conditions are specified where works or activities have the potential to cause ecological imbalance or have adverse effects on the environment . This is supported by Article 62 of the Reglamento de la Ley Minera . Article 5 of the LGEEPA authorizes SEMARNAT to provide the approvals for the works specified in Article 28 . The LGEEPA also contains articles that are relevant to conservation of soils, tailings management, water quality, flora and fauna, noise emissions, air quality, and hazardous waste management . The Ley de Aguas Nacionales provides authority to the Comisión Nacional de Agua (CONAGUA), an agency within SEMARNAT, to issue water abstraction concessions, and specifies certain requirements to be met by applicants . Another important piece of environmental legislation is the Ley General de Desarrollo Forestal Sustentable (LGDFS) . Article 117 of the LGDFS indicates that authorizations must be granted by SEMARNAT for land use changes to industrial purposes . An application for change in land use or Cambio de Uso de Suelo (CUS), must be accompanied by a Technical Supporting Study (Estudio Técnico Justificativo, or ETJ) . Almaden has engaged a Mexican environmental consultant to develop the MIA, CUS, and ETJ for the Ixtaca Project, with an anticipated submission in the first quarter of 2019 . Guidance for implementation and adherence to many of the stipulations of environmental legislation is provided in a series of Normas Oficiales Mexicanas (NOM) . These NOM provide specific procedures, limits, and guidelines, and carry the force of law . The relevant permit application will be developed as the Project progresses . The Company has informed the author that material changes to the permitting status of the Property since the date of the Study are provided in the Company’s public disclosure record since that time . Ixtaca - S - K 1300 Technical Report Summary Page 276 of 326

Ixtaca - S - K 1300 Technical Report Summary 3. Social and Community Engagement 1. Local Communities The Ixtaca Project is located within the State of Puebla, in the municipality of Ixtacamaxtitlán . Ixtacamaxtitlán covers approximately 561 km 2 and the Project is located in the northern portion of the municipality . Ixtacamaxtitlán is home to approximately 0 . 4 % of the population of the State of Puebla, or 25 , 326 people ( 2010 census) and, although located only a short 2 - hour drive from large Volkswagen and Audi manufacturing facilities, it is one of Puebla’s poorest municipalities . The local economy is based on activities such as agriculture and livestock ranching which is done on a limited commercial basis, but largely for individual and family use . There are small - scale artisans known locally for fabrication of wooden furniture . Mexico’s Instituto Nacional de Estadística y Geografía (“INEGI”) collected extensive census data on Ixtacamaxtitlán in 2010 , which provides a good general picture of this part of Mexico . The closest communities to Ixtaca are Santa Maria Zotoltepec, Zacatepec, Vista Hermosa de Lázaro Cárdenas, and Tuligtic . Generally speaking, these communities have a lack of employment opportunities with a large number of families dependent on social services . The Consejo Nacional de Población (CONAPO) rates their degree of marginalization as “high”, which is an index calculation based on levels of illiteracy, and access to basic services and infrastructure (drainage, availability of drinking water, dirt floor, toilet, electric power) . Similarly, the Consejo Nacional de Evaluación de la Politica de Desarrollo Social (CONEVAL) estimates that 25 . 1 % of the municipal population lives in extreme poverty ; 56 % in conditions of moderate poverty ; and 17 % of the population are vulnerable to some aspect of social deficiency . 2. Community Engagement Open, transparent communication with stakeholders has been fundamental to Almaden’s approach since staking the original Tuligtic claims in 2001. Over the past several years, Almaden has interacted with over 20 , 000 people from over 53 communities and 8 different states in the following ways : Coordinated nine large community meetings, with total attendance at these meetings approaching 4 , 100 people ; Taken a total of approximately 480 people, drawn from local communities, to visit 24 mines ; Arranged 46 sessions of “Dialogos Transversales”, wherein community members are invited to attend discussions with experts on a diverse range of issues relating to the mining industry such as an overview of Mexican Mining Law, Human Rights and Mining, mineral processing, explosives, water in mining, risk management, and mine infrastructure amongst other things ; Opened a central community office in the town of Santa Maria Zotoltepec, which is continually open to community members and includes an anonymous suggestion box ; Ixtaca - S - K 1300 Technical Report Summary Page 277 of 326
Ixtaca - S - K 1300 Technical Report Summary Invested in a “mobile mining module” which allows company representatives to establish a temporary presence in communities more distant from the project, and allows for those interested to learn more about the project ; Employed as many local people as possible, reaching up to 70 people drawn from five local communities . Almaden operates the drills used at the project, and hence can draw and train a local workforce as opposed to bringing in external contractors ; Initiated a program of scholarships for top performing local students, with 130 scholarships granted to date to individuals from 23 different communities ( 79 women and 51 men) ; Established several clubs, including reading, dancing, football, music, and theatre clubs, to contribute to the vitality of local communities ; Focused on education, enabling over 4 , 300 people to be positively impacted by our investments, such as rehabilitation of school - related infrastructure, donation of electronic equipment, and scholarships for top - performing students . In 2017 , Almaden engaged a third - party consultant to lead a community consultation and impact assessment at the Ixtaca project . In Mexico, only the energy industry requires completion of such an assessment (known in Mexico as a Trámite Evaluación de Impacto Social, or “EVIS”) as part of the permitting process . The purpose of these studies is to identify the people in the area of influence of a project (“Focus Area”), and assess the potential positive and negative consequences of project development to assist in the development of mitigation measures and the formation of social investment plans . To Almaden’s knowledge, this is the first time a formal EVIS has been completed in the minerals industry in Mexico, and as such reflects the Company’s commitment to best national and international standards in Ixtaca project development . The EVIS and subsequent work on the development of a Social Investment Plan were conducted according to Mexican and international standards such as the Guiding Principles on Business and Human Rights, the Equator Principles, and the OECD Guidelines for Multinational Enterprises and Due Diligence Guidance for Meaningful Stakeholder Engagement in the Extractive Sector . Fieldwork for the EVIS was conducted by an interdisciplinary group of nine anthropologists, ethnologists and sociologists graduated from various universities, who lived in community homes within the Ixtaca Focus Area during the study to allow for ethnographic immersion and an appreciation for the local customs and way of life . This third - party consultation sought voluntary participation from broad, diverse population groups, with specific attention to approximately one thousand persons in the Focus Area . This extensive consultation resulted in changes to some elements of the mine design, including the planned construction of a permanent water reservoir to serve the local area long after mine closure, and the shift to drystack filtered waste management . Positive impacts to the socio - economy of the region are expected to continue as the Project is developed into a mine and becomes a source of more jobs . Almaden plans to continue its open communication with the communities to provide for realistic expectations of any proposed mining operation and the social impacts of such a development . Ixtaca - S - K 1300 Technical Report Summary Page 278 of 326
Ixtaca - S - K 1300 Technical Report Summary 3. Land Acquisition At the time of the Study, Almaden had secured through purchase agreements with numerous independent owners, roughly 1 , 139 hectares which are required for the proposed production plan . This was completed through friendly land purchase agreements with locals, considering fair market value . There are no communities that require relocation as part of the Project development . Mineral Claim owners have the right to obtain the temporary occupancy, or creation of land easements required to carry out exploration and mining operations, under the Federal Mining Law . 4. Potential Social or Community Requirements and/or Plans The Ixtaca project is in an area previously logged and with little to no current land use . The mine will not require the resettlement of any communities . It is currently anticipated that water wells will not be required, as preliminary models indicate that there is sufficient water for operations from collection of rainwater . As the local community draws its water from springs at higher elevations than the mine plan, community water is unlikely to be impacted by mine development . The Company has informed the author that updates to the Company’s engagement activities with local communities since the date of the Study are provided in the Company’s public disclosure record since that time . 4. Mine Closure Reclamation and closure actions describe activities during the active closure period, when the bulk of physical reclamation will take place, and the post - closure period, when monitoring and some miscellaneous maintenance activities may be required . The reclamation and closure actions were developed to provide walk - away solutions for post - closure . 1. Open Pit At closure, given the open pit will be a permanent structure, a safety berm will be built around the open pit to serve as a warning to the public and preclude their access . Fences and signs would require maintenance in perpetuity and would not constitute a walk - away solution . Therefore, these structures are not proposed as closure actions . The pit berm will be constructed by dozing material around the perimeter of the open pit . A lake is expected to form in the pit . Geochemical testing indicates that approximately 7 % of the pit shell area will be potentially acid generating (PAG) . At this time has been assumed that the neutralizing potential of the waste rock will dominate, and no long - term treatment or mitigation will be required . In the long term (year 100 - 113 ), the lake is expected to spill over the crest of the pit . A spillway and channel have been located and sized to divert pit lake overflow around the South Rock Storage Facility . 2. West Tailings and Rock Storage Facility The slopes of the West Tailings and Rock Storage Facility will be regraded to an overall slope of 2 . 5 H : 1 V to facilitate cover placement and revegetation . The top surface will be placed with a 5 % slope to direct Ixtaca - S - K 1300 Technical Report Summary Page 279 of 326
Ixtaca - S - K 1300 Technical Report Summary stormwater runoff during operations and will be re - graded as required at closure to ensure that water does not pond on the final surface . Based on the tailings production schedule, at the end of the mine life, some compacted filtered tailings will be exposed at the surface of the facility at the end of the mine life . These areas will be covered with 1 m of limestone rock underlain by 0 . 5 m of compacted limestone rock which will be sourced from select areas within the Rock Storage Facility . After placement of the rock, the entire facility will be covered with 300 mm of locally - salvaged growth media and revegetated . Growth media will be sourced from stockpiles around the dump . No solution management is anticipated for the co - disposal facility given the tailings is filtered and compacted thus resulting in significant reduction of potential for long - term seepage . 3. South Rock Storage Facility During closure of the facility, the slopes of the South RSF will be regraded to an overall slope of 2 . 5 H : 1 V to facilitate cover placement and revegetation . The entire facility will be covered with 300 - mm of locally - salvaged growth media and revegetated . The top surface of the waste rock dump will be graded to 2 % to direct stormwater runoff . 4. Water Dams At closure the Fresh Water Dam will be reclaimed . The Fresh Water Dam embankment will be breached and the disturbance covered and revegetated . The Water Storage Dam will remain post - closure for the benefit of local communities . 5. Buildings Materials and reagents in the beneficiation plant will be removed and disposed of in appropriate landfills and/or returned to manufacturers . Processing equipment will be removed and sold for salvage value . Buildings and structures at the plant and elsewhere across the site as well as linear networks such as pipelines, powerlines, and conveyors will be demolished and the debris hauled to an on - site landfill . The foundations will be broken and covered with locally sourced rock and/or growth media . It has been assumed that demolition debris will be hauled up to 30 km to account for both on - site and off - site disposal . 6. Roads Roads not required for the active reclamation and closure period will be removed at the end of operations . Those not required for long - term monitoring or maintenance activities will be reclaimed at the end of the active reclamation and closure period . Any remaining roads required for the post - closure period will be reclaimed once the post - closure monitoring period ends . 7. Diversions At closure, all earthworks structures will be reclaimed for positive drainage . The diversion channels used during operations will be reclaimed by backfilling and revegetation . Ixtaca - S - K 1300 Technical Report Summary Page 280 of 326
Ixtaca - S - K 1300 Technical Report Summary 8. Wells Monitoring wells required for monitoring groundwater quality during the closure and post - closure periods will remain and the rest will be abandoned . Once the monitoring period is over, the remaining monitoring wells will be abandoned . 9. Monitoring A surface and groundwater quality monitoring will continue for 20 years during the closure and post - closure periods . 17 . 5 Qualified Person’s Opinion As of the effective date of this report, the QP is of the opinion that appropriate methodologies were utilized to mitigate issues related to environmental compliance, permitting and local communities . As of the effective date of the report, there were no known issues that could have materially impacted the ability to extract the mineral resources at the Ixtaca Project . Ixtaca - S - K 1300 Technical Report Summary Page 281 of 326
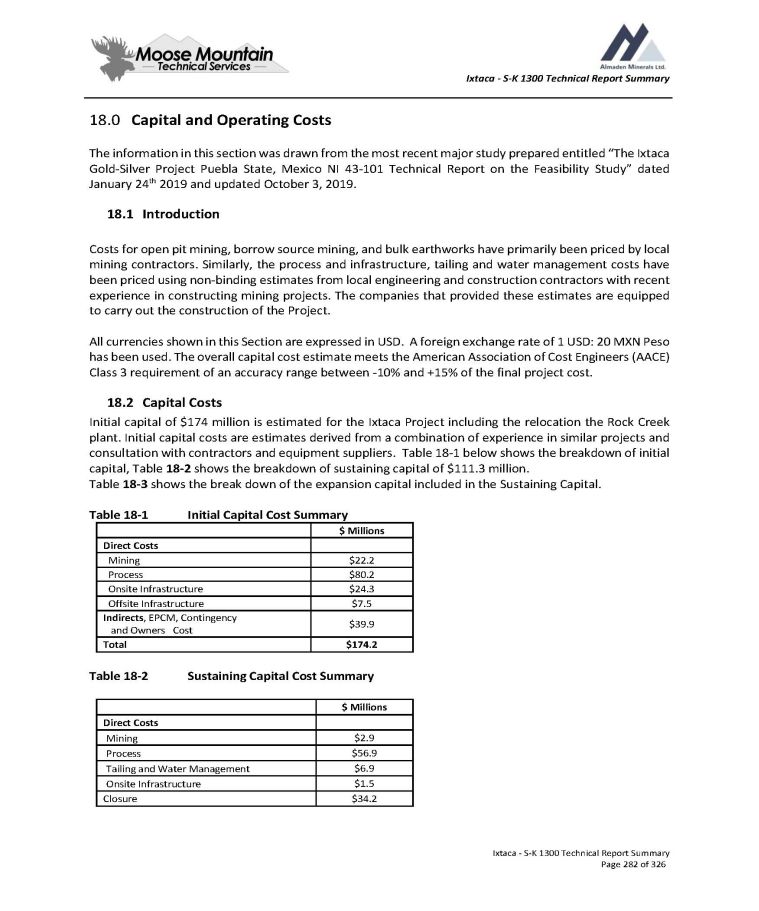
Ixtaca - S - K 1300 Technical Report Summary 1. Capital and Operating Costs The information in this section was drawn from the most recent major study prepared entitled “The Ixtaca Gold - Silver Project Puebla State, Mexico NI 43 - 101 Technical Report on the Feasibility Study” dated January 24 th 2019 and updated October 3 , 2019 . 1. Introduction Costs for open pit mining, borrow source mining, and bulk earthworks have primarily been priced by local mining contractors . Similarly, the process and infrastructure, tailing and water management costs have been priced using non - binding estimates from local engineering and construction contractors with recent experience in constructing mining projects . The companies that provided these estimates are equipped to carry out the construction of the Project . All currencies shown in this Section are expressed in USD . A foreign exchange rate of 1 USD : 20 MXN Peso has been used . The overall capital cost estimate meets the American Association of Cost Engineers (AACE) Class 3 requirement of an accuracy range between - 10 % and + 15 % of the final project cost . 2. Capital Costs Initial capital of $ 174 million is estimated for the Ixtaca Project including the relocation the Rock Creek plant . Initial capital costs are estimates derived from a combination of experience in similar projects and consultation with contractors and equipment suppliers . Table 18 - 1 below shows the breakdown of initial capital, Table 18 - 2 shows the breakdown of sustaining capital of $ 111 . 3 million . Table 18 - 3 shows the break down of the expansion capital included in the Sustaining Capital . Table 18 - 1 Initial Capital Cost Summary Ixtaca - S - K 1300 Technical Report Summary Page 282 of 326 $ Millions Direct Costs $22.2 Mining $80.2 Process $24.3 Onsite Infrastructure $7.5 Offsite Infrastructure $39.9 Indirects , EPCM, Contingency and Owners Cost $174.2 Total Table 18 - 2 Sustaining Capital Cost Summary $ Millions Direct Costs $2.9 Mining $56.9 Process $6.9 Tailing and Water Management $1.5 Onsite Infrastructure $34.2 Closure
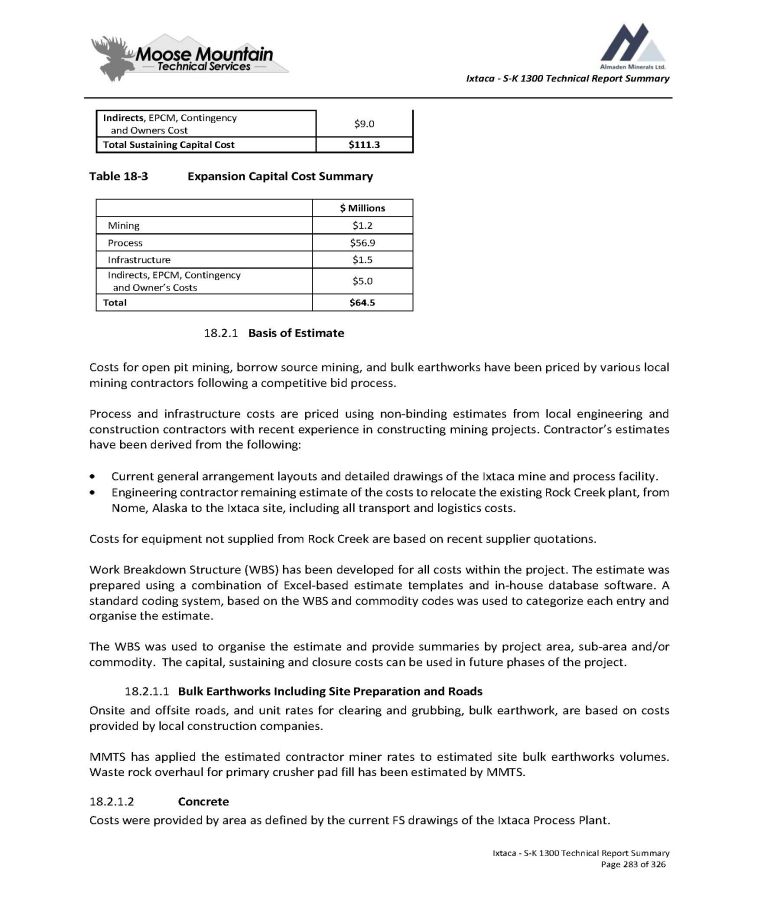
Ixtaca - S - K 1300 Technical Report Summary $9.0 Indirects , EPCM, Contingency and Owners Cost $111.3 Total Sustaining Capital Cost Ixtaca - S - K 1300 Technical Report Summary Page 283 of 326 Table 18 - 3 Expansion Capital Cost Summary $ Millions $1.2 Mining $56.9 Process $1.5 Infrastructure $5.0 Indirects, EPCM, Contingency and Owner’s Costs $64.5 Total 18.2.1 Basis of Estimate Costs for open pit mining, borrow source mining, and bulk earthworks have been priced by various local mining contractors following a competitive bid process . Process and infrastructure costs are priced using non - binding estimates from local engineering and construction contractors with recent experience in constructing mining projects . Contractor’s estimates have been derived from the following : Current general arrangement layouts and detailed drawings of the Ixtaca mine and process facility. Engineering contractor remaining estimate of the costs to relocate the existing Rock Creek plant, from Nome, Alaska to the Ixtaca site, including all transport and logistics costs. Costs for equipment not supplied from Rock Creek are based on recent supplier quotations . Work Breakdown Structure (WBS) has been developed for all costs within the project . The estimate was prepared using a combination of Excel - based estimate templates and in - house database software . A standard coding system, based on the WBS and commodity codes was used to categorize each entry and organise the estimate . The WBS was used to organise the estimate and provide summaries by project area, sub - area and/or commodity . The capital, sustaining and closure costs can be used in future phases of the project . 1. Bulk Earthworks Including Site Preparation and Roads Onsite and offsite roads, and unit rates for clearing and grubbing, bulk earthwork, are based on costs provided by local construction companies . MMTS has applied the estimated contractor miner rates to estimated site bulk earthworks volumes . Waste rock overhaul for primary crusher pad fill has been estimated by MMTS . 2. Concrete Costs were provided by area as defined by the current FS drawings of the Ixtaca Process Plant .
Ixtaca - S - K 1300 Technical Report Summary 3. Structural Steel Structural steel costs have been derived from the current Ixtaca FS drawings. 4. Mechanical The estimate was prepared from the FS mechanical equipment list and process diagrams. The mechanical installation pricing includes consideration of receiving free issue mechanical equipment from the Rock Creek mine . Recent quotations were used to assess costs for other major equipment, and all other mechanical equipment which will not be delivered from Rock Creek . These costs are based on recent quotes and similar projects . 5. Platework and Liners Costs for all platework and metal liners (measured in kilograms), for tanks, launders, pumpboxes, and chutes have been assessed from the FS drawings . 6. Piping Estimates for piping have been prepared from the current FS drawings for the Ixtaca facility. 7. Site Services Services were estimated from the FS Ixtaca drawings. 8. On Site Electrical Distribution Electrical costs were estimated from the current Ixtaca layout and FS electrical drawings. 9. Off Site Electrical Distribution The cost estimate for permanent electrical power supply by means of a transmission line to the site’s substation was developed by a Mexican engineering contractor specializing in wholesale power distribution . This includes interaction with the external power network, transmission line right of way and proposed design concept . 10. Instrumentation Plant instrumentation and control system costs are based on the installation of a Distributed Control System (DCS) . Field Instruments are based on Ixtaca FS drawings and instrument lists, including necessary junction boxes and cabling . Site communication costs are based on Ixtaca FS drawings . 11. Open Pit Mining Contract miner quotes have been used to estimate: Earthworks unit rates. Equipment mobilization costs Explosive related facilities MMTS has included allowance for mine operations management, mine planning, and mine technical services in EPCM . Ixtaca - S - K 1300 Technical Report Summary Page 284 of 326
Ixtaca - S - K 1300 Technical Report Summary 18 . 2 . 1 . 12 Tailings, Water Management, and Closure MTOs were estimated based on design drawings. Unit rates were sourced as follows: Unit rates for earthworks and liner supply and install were obtained by subcontract with Servicios Geologicos IMEx, S.C. (IMEx) located in Hermosillo, Sonora, Mexico Unit rates for gabions and geosynthetic clay liner were calculated based on labor rates provided by IMEX and supplier estimates for materials 13. Environmental MMTS costs for environmental include estimated CONAFOR compensation for habitat disturbance . An allowance has also been made for erosion control during construction . 14. Estimate base currency The estimate has been prepared with US dollars (US $ ) as the base currency . Estimates provided by Mexican mining contractor were based in Mexican Peso (MXN) and converted to USD using 1 US $ = 20 MXN . Fluctuations in foreign exchange rates were not considered in this FS estimate . 15. Labour Cost Labour costs for the FS are by contractor’s budgetary quotations for the following: Contract mining; Process and infrastructure; Tailing Co - disposal, RSF, and Water Management; Rock Creek Dismantling, Refurbishment, Transportation and Delivery to site; Travel and living out allowance is included in the contractor’s quoted rates . It is expected that most personnel will be hired locally by the contractor . The location is close to several small towns, and 50 km from Apizaco a major industrial zone . It is expected that the contractor will arrange their own accommodation . A productivity factor has been built into the Contractor’s costs and applied to the labour portion of the estimate to allow for the inefficiency . 18 . 2 . 1 . 16 Indirect Costs Indirect costs include items that are necessary for the completion of the project, but are not directly related to the direct construction costs, and are in addition to items covered directly by the contractor ‘all - in’ labour rate . Construction Indirects Construction Indirects to be calculated as a percentage of the Direct Costs and will allow for all temporary buildings and services required during construction and commissioning . Estimates will be based on Ixtaca - S - K 1300 Technical Report Summary Page 285 of 326

Ixtaca - S - K 1300 Technical Report Summary durations from the construction schedule. Construction indirects are based on all services and facilities required to support the various construction activities. Local Mexican contractor construction indirects for process and infrastructure are included in the direct cost estimates. External roads construction indirects are included in the construction directs. Pioneering construction indirects are included in the direct costs. Mining indirects where calculated on 3% of the all mining non - pioneering costs. Construction indirects for the external powerline are included. Environmental construction indirects of 1% is included. Construction indirects are included for the West T/RSF (Co - disposal Facility), South RSF, water management, Water Storage Dam, Fresh Water Dam, and sustaining and closure capital. Spares The local Mexican contractor estimated the capital and commissioning spares, 3% and 2% of the capital process equipment respectively. Mining spares are included in the mining direct costs. Initial Fills An allowance is included for initial fills. Freight and Logistics The dismantling and relocation of the Rock Creek plant has been estimated by an engineering contractor based on a budget quotation to freight from Alaska, US to Ixtaca, Mexico . Freight and logistics costs include : Land and ocean transportation. Loading and offloading including cranage. Ocean transportation. Bonds and insurance. Customs duties and brokerage, are excluded from the freight and logistics estimate. An additional allowance of 3 % of material and equipment costs has been made for freight and logistics . Commissioning and Start - up An allowance has been included for commissioning in the direct costs . The contractor will be responsible for the testing and commissioning all equipment in their scope under the observation of Company representatives . MMTS has made additional allowance for commissioning and start - up indirect costs . Ixtaca - S - K 1300 Technical Report Summary Page 286 of 326

Ixtaca - S - K 1300 Technical Report Summary EPCM Costs EPCM allowance is calculated based on consultant and contractor quotations, taking percentages of the direct costs as applicable : Process and infrastructure – 12% applied to the discipline material take - offs. Relocation of Rock Creek Equipment – 15% of the relocation cost of the Rock Creek Equipment. Tailing and Water Management - a contractor has provided estimated costs for the detailed engineering and construction management of the West T/RSF and South RSF foundations, FWD, WSD, and water management based on the contractor’s estimate of personnel time and expenses. Others – 15% of environmental, plant mobile equipment, non - PMI indirects and Owners Costs. Vendor Assistance Vendors’ assistance is based on estimates by MMTS . An allowance is calculated based on number of men and duration for Vendor’s assistance during construction . Temporary Construction Facilities & Services Based on construction staffing and site requirements, estimates have been included for temporary structures, facilities and services required during construction, and commissioning . 17. Owner’s costs Owner’s costs have been estimated by MMTS to cover those costs which are normally incurred by the Owner for their support of the project . These costs include Almaden project management costs, pre - production operations, commissioning, staff recruitment, site office and storage facilities, safety equipment, travel, site transportation, field general expenses, communication systems, training and orientation programmes . 18. Contingency Contingency is an allowance for undefined items of work that reside within the current scope of the project which have not been foreseen or described at the time the estimate . A contingency based on the total direct and indirect costs is included to cover undefined costs . Contingency Excludes: Major scope changes such as changes in end product specification, capacities, building sizes, and location of the asset or project. Extraordinary events such as major strikes and natural disasters. Management reserves. Escalation and currency effects. Contingency is generally included in most estimates and is expected to be expended . Varying amounts of contingency have been applied to reflect the varying degrees of risk of different components of the project . Ixtaca - S - K 1300 Technical Report Summary Page 287 of 326
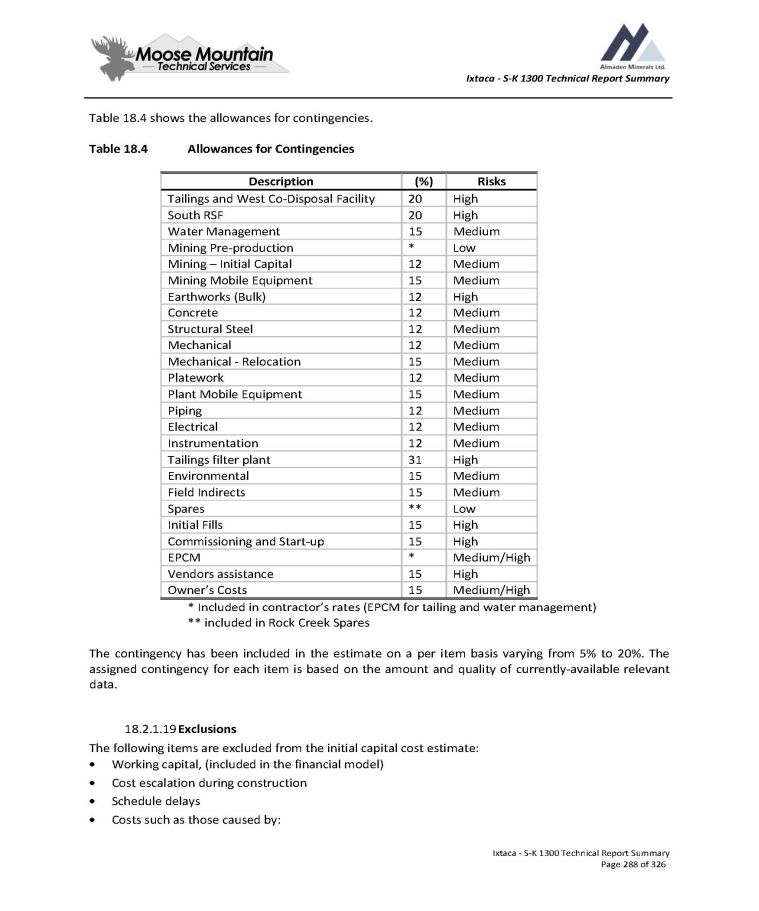
Ixtaca - S - K 1300 Technical Report Summary Table 18.4 shows the allowances for contingencies. Table 18.4 Allowances for Contingencies Ixtaca - S - K 1300 Technical Report Summary Page 288 of 326 Risks (%) Description High 20 Tailings and West Co - Disposal Facility High 20 South RSF Medium 15 Water Management Low * Mining Pre - production Medium 12 Mining – Initial Capital Medium 15 Mining Mobile Equipment High 12 Earthworks (Bulk) Medium 12 Concrete Medium 12 Structural Steel Medium 12 Mechanical Medium 15 Mechanical - Relocation Medium 12 Platework Medium 15 Plant Mobile Equipment Medium 12 Piping Medium 12 Electrical Medium 12 Instrumentation High 31 Tailings filter plant Medium 15 Environmental Medium 15 Field Indirects Low ** Spares High 15 Initial Fills High 15 Commissioning and Start - up Medium/High * EPCM High 15 Vendors assistance Medium/High 15 Owner’s Costs * Included in contractor’s rates (EPCM for tailing and water management) ** included in Rock Creek Spares The contingency has been included in the estimate on a per item basis varying from 5 % to 20 % . The assigned contingency for each item is based on the amount and quality of currently - available relevant data . 18.2.1.19 Exclusions The following items are excluded from the initial capital cost estimate : Working capital, (included in the financial model) Cost escalation during construction Schedule delays Costs such as those caused by:
Ixtaca - S - K 1300 Technical Report Summary - scope changes - unidentified adverse ground conditions - extraordinary climatic events - labor disputes - permit applications - receipt of information beyond the control of EPCM contractors - cost of financing - sunk costs - research and exploration drilling - royalties, corporate and mining taxes - sustaining capital (but will be included in the financial model) - permitting costs - closure costs (estimated separately) - Duties and taxes - sales taxes should be identified in all costing so that exemptions can be estimated - Foreign exchange fluctuations Financing costs. Refundable taxes and duties. Currency fluctuations. Lost time due to severe weather conditions. Lost time due to force majeure. Customs duties and brokerage, are excluded from the freight and logistics estimate. Additional costs for accelerated or decelerated deliveries of equipment, materials and services resultant from a change in project schedule. Warehouse inventories other than those supplied in initial fills. Environmental bond cost. Any project sunk costs including this study. Mine reclamation and closure costs (included in sustaining capital costs). Escalation post (Q4 2018). Social, sustainability and community related issues. Consequences from encountering different geotechnical conditions during future project phases than those upon which the existing design criteria and assumptions are based. 3. Operating Cost Estimate 1. Operating Cost Summary The total life of mine operating costs for the Ixtaca Project are $22.5/tonne mill feed. Operating costs are summarized in Table 18 - 5 . Ixtaca - S - K 1300 Technical Report Summary Page 289 of 326
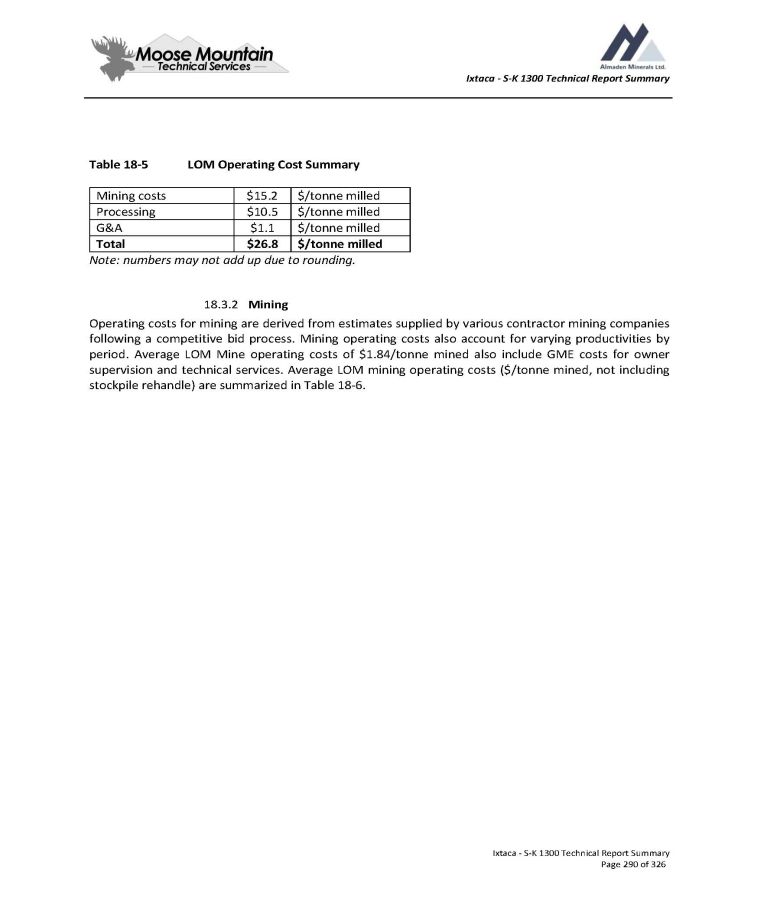
Ixtaca - S - K 1300 Technical Report Summary Table 18 - 5 Ixtaca - S - K 1300 Technical Report Summary Page 290 of 326 LOM Operating Cost Summary $/tonne milled $15.2 Mining costs $/tonne milled $10.5 Processing $/tonne milled $1.1 G&A $/tonne milled $26.8 Total Note : numbers may not add up due to rounding . 18 . 3 . 2 Mining Operating costs for mining are derived from estimates supplied by various contractor mining companies following a competitive bid process . Mining operating costs also account for varying productivities by period . Average LOM Mine operating costs of $ 1 . 84 /tonne mined also include GME costs for owner supervision and technical services . Average LOM mining operating costs ( $ /tonne mined, not including stockpile rehandle) are summarized in Table 18 - 6 .
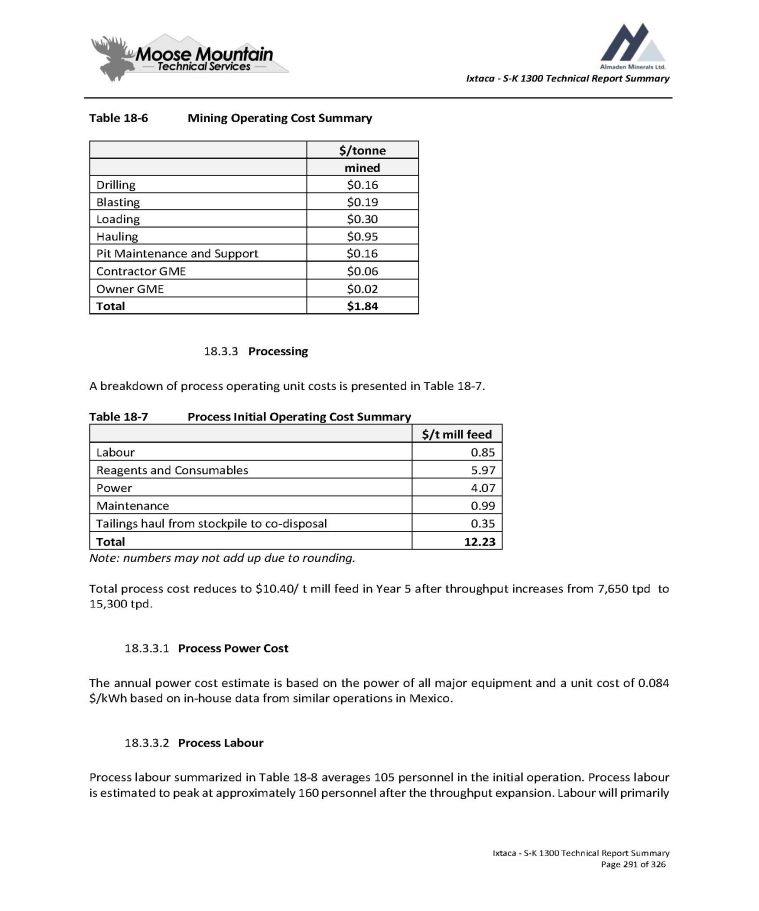
Ixtaca - S - K 1300 Technical Report Summary Table 18 - 6 Ixtaca - S - K 1300 Technical Report Summary Page 291 of 326 Mining Operating Cost Summary $/tonne mined $0.16 Drilling $0.19 Blasting $0.30 Loading $0.95 Hauling $0.16 Pit Maintenance and Support $0.06 Contractor GME $0.02 Owner GME $1.84 Total 18.3.3 Processing A breakdown of process operating unit costs is presented in Table 18 - 7. Table 18 - 7 Process Initial Operating Cost Summary $/t mill feed 0.85 Labour 5.97 Reagents and Consumables 4.07 Power 0.99 Maintenance 0.35 Tailings haul from stockpile to co - disposal 12.23 Total Note: numbers may not add up due to rounding. Total process cost reduces to $10.40/ t mill feed in Year 5 after throughput increases from 7,650 tpd to 15,300 tpd. 1. Process Power Cost The annual power cost estimate is based on the power of all major equipment and a unit cost of 0.084 $/kWh based on in - house data from similar operations in Mexico. 2. Process Labour Process labour summarized in Table 18 - 8 averages 105 personnel in the initial operation. Process labour is estimated to peak at approximately 160 personnel after the throughput expansion. Labour will primarily
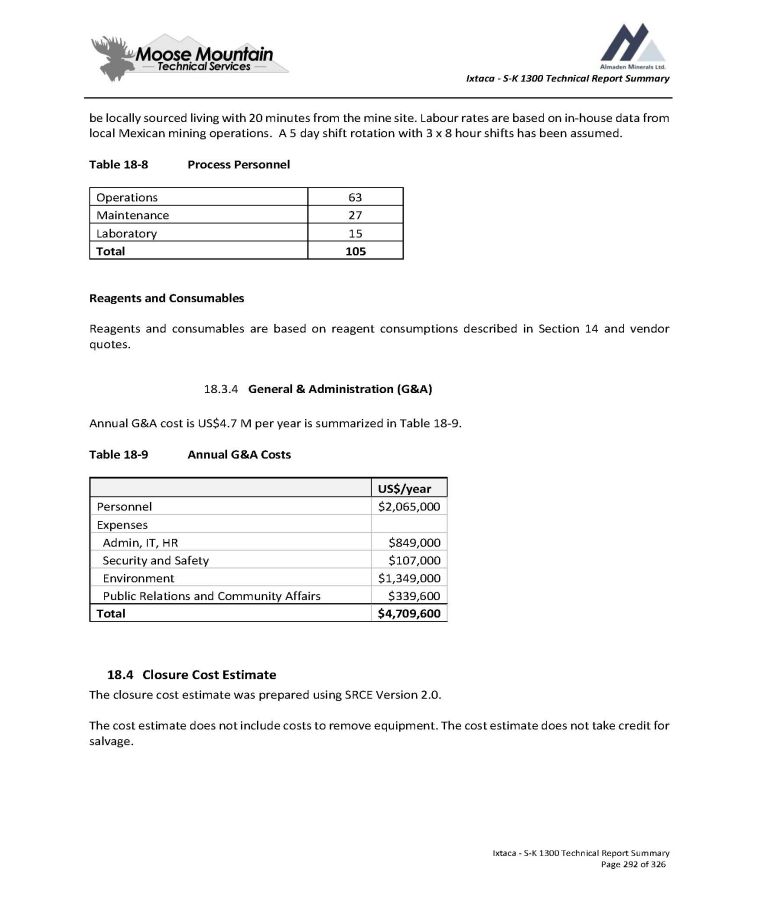
Ixtaca - S - K 1300 Technical Report Summary be locally sourced living with 20 minutes from the mine site. Labour rates are based on in - house data from local Mexican mining operations. A 5 day shift rotation with 3 x 8 hour shifts has been assumed. Table 18 - 8 Process Personnel Ixtaca - S - K 1300 Technical Report Summary Page 292 of 326 63 Operations 27 Maintenance 15 Laboratory 105 Total Reagents and Consumables Reagents and consumables are based on reagent consumptions described in Section 14 and vendor quotes. 18.3.4 General & Administration (G&A) Annual G&A cost is US$4.7 M per year is summarized in Table 18 - 9. Table 18 - 9 Annual G&A Costs US$/year $2,065,000 Personnel Expenses $849,000 Admin, IT, HR $107,000 Security and Safety $1,349,000 Environment $339,600 Public Relations and Community Affairs $4,709,600 Total 18.4 Closure Cost Estimate The closure cost estimate was prepared using SRCE Version 2.0. The cost estimate does not include costs to remove equipment. The cost estimate does not take credit for salvage.
Ixtaca - S - K 1300 Technical Report Summary 19.0 Economic Analysis The information in this section was drawn from the most recent major study prepared entitled “The Ixtaca Gold - Silver Project Puebla State, Mexico NI 43 - 101 Technical Report on the Feasibility Study” dated January 24 th 2019 and updated October 3 , 2019 . 19 . 1 Cautionary Statement The results of the economic analyses discussed in this section represent forward - looking information as defined under Canadian securities law . The results depend on inputs that are subject to a number of known and unknown risks, uncertainties and other factors that may cause actual results to differ materially from those presented here . Information that is forward - looking includes : Ixtaca - S - K 1300 Technical Report Summary Page 293 of 326 • • • • • • • Mineral Resource and Mineral Reserve estimates; Assumed commodity prices and exchange rates; Mine production plans; Projected recovery rates; Sustaining and operating cost estimates; Assumptions as to closure costs and closure requirements; Assumptions as to environmental, permitting and social risks. Additional risks to the forward - looking information include: • • • • • Changes to costs of production from what is assumed; Unrecognized environmental risks; Unanticipated reclamation expenses; Unexpected variations in quantity of mineralised material, grade, or recovery rates; Geotechnical and hydrogeological considerations during mining being different from what was assumed; Failure of plant, equipment, or processes to operate as anticipated; Accidents, labour disputes and other risks of the mining industry. • • 19.2 Assumptions The economic analysis assumes the Ixtaca Project is a 100% equity financed project. All dollar amounts in this analysis are expressed in US dollars, unless otherwise specified. The Economic analysis includes the entire project life. The valuation date on which the Net Present Value (NPV) and Internal Rate of Return (IRR) are measured is the start of Year - 1. Details of the capital and operating cost estimates are described in Section 18. The production schedule used for the economic analysis is described in Section 13. Base case prices are derived from recent common peer usage discussed in Item 19.
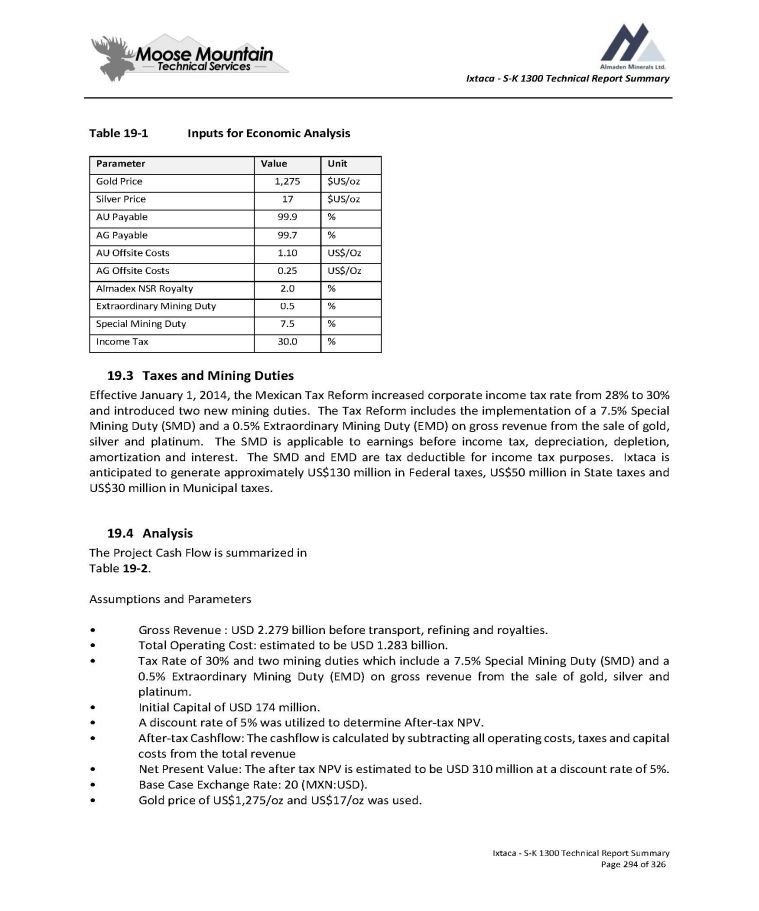
Ixtaca - S - K 1300 Technical Report Summary Table 19 - 1 Ixtaca - S - K 1300 Technical Report Summary Page 294 of 326 Inputs for Economic Analysis Unit Value Parameter $US/oz 1,275 Gold Price $US/oz 17 Silver Price % 99.9 AU Payable % 99.7 AG Payable US$/Oz 1.10 AU Offsite Costs US$/Oz 0.25 AG Offsite Costs % 2.0 Almadex NSR Royalty % 0.5 Extraordinary Mining Duty % 7.5 Special Mining Duty % 30.0 Income Tax 19 . 3 Taxes and Mining Duties Effective January 1 , 2014 , the Mexican Tax Reform increased corporate income tax rate from 28 % to 30 % and introduced two new mining duties . The Tax Reform includes the implementation of a 7 . 5 % Special Mining Duty (SMD) and a 0 . 5 % Extraordinary Mining Duty (EMD) on gross revenue from the sale of gold, silver and platinum . The SMD is applicable to earnings before income tax, depreciation, depletion, amortization and interest . The SMD and EMD are tax deductible for income tax purposes . Ixtaca is anticipated to generate approximately US $ 130 million in Federal taxes, US $ 50 million in State taxes and US $ 30 million in Municipal taxes . 19 . 4 Analysis The Project Cash Flow is summarized in Table 19 - 2 . Assumptions and Parameters • • • Gross Revenue : USD 2 . 279 billion before transport, refining and royalties . Total Operating Cost : estimated to be USD 1 . 283 billion . Tax Rate of 30 % and two mining duties which include a 7 . 5 % Special Mining Duty (SMD) and a 0 . 5 % Extraordinary Mining Duty (EMD) on gross revenue from the sale of gold, silver and platinum . Initial Capital of USD 174 million . A discount rate of 5 % was utilized to determine After - tax NPV . After - tax Cashflow : The cashflow is calculated by subtracting all operating costs, taxes and capital costs from the total revenue Net Present Value : The after tax NPV is estimated to be USD 310 million at a discount rate of 5 % . Base Case Exchange Rate : 20 (MXN : USD) . Gold price of US $ 1 , 275 /oz and US $ 17 /oz was used . • • • • • •

Ixtaca - S - K 1300 Technical Report Summary The QP considers the accuracy and contingency of cost estimates to be well within a Feasibility Study (FS) standard and sufficient for the economic analysis supporting the Mineral Reserve estimate for Ixtaca project . Ixtaca - S - K 1300 Technical Report Summary Page 295 of 326
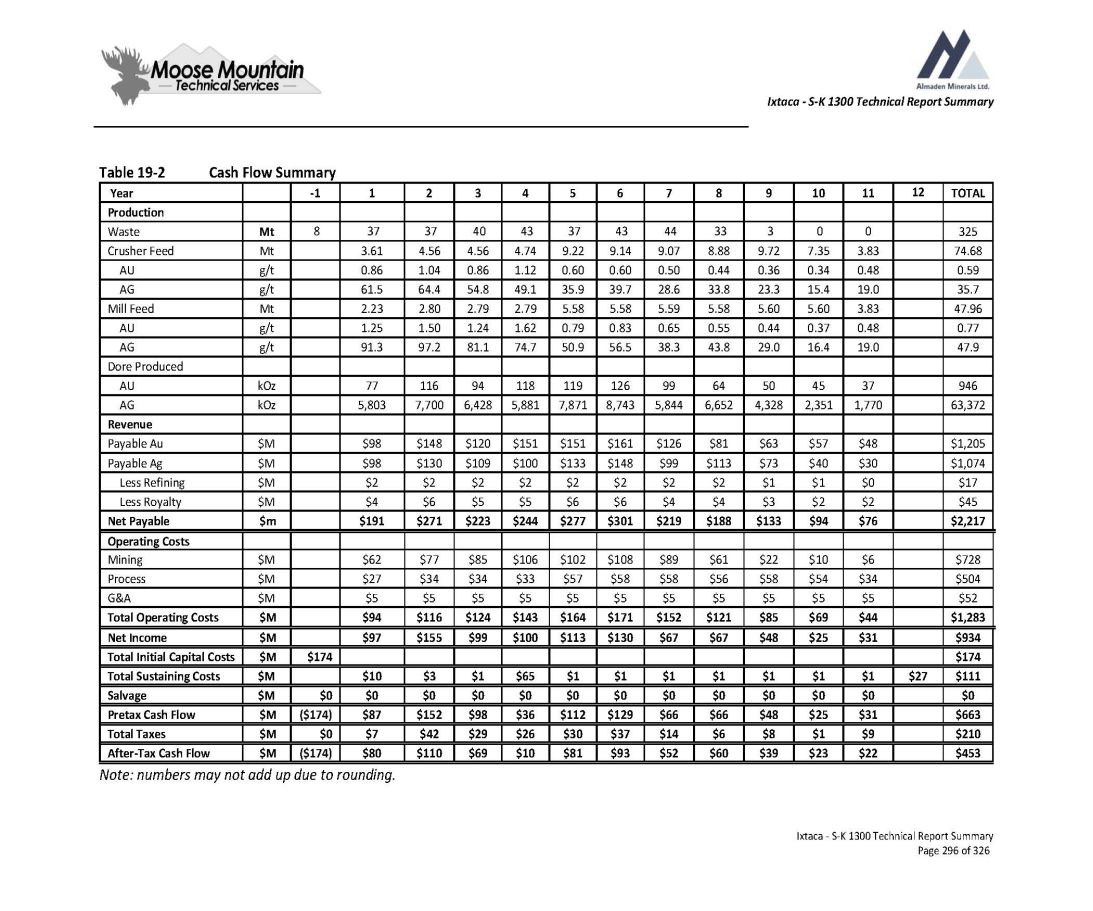
Ixtaca - S - K 1300 Technical Report Summary Ixtaca - S - K 1300 Technical Report Summary Page 296 of 326 Table 19 - 2 Cash Flow Summary TOTAL 12 11 10 9 8 7 6 5 4 3 2 1 - 1 Year Production 325 0 0 3 33 44 43 37 43 40 37 37 8 Mt Waste 74.68 3.83 7.35 9.72 8.88 9.07 9.14 9.22 4.74 4.56 4.56 3.61 Mt Crusher Feed 0.59 0.48 0.34 0.36 0.44 0.50 0.60 0.60 1.12 0.86 1.04 0.86 g/t AU 35.7 19.0 15.4 23.3 33.8 28.6 39.7 35.9 49.1 54.8 64.4 61.5 g/t AG 47.96 3.83 5.60 5.60 5.58 5.59 5.58 5.58 2.79 2.79 2.80 2.23 Mt Mill Feed 0.77 0.48 0.37 0.44 0.55 0.65 0.83 0.79 1.62 1.24 1.50 1.25 g/t AU 47.9 19.0 16.4 29.0 43.8 38.3 56.5 50.9 74.7 81.1 97.2 91.3 g/t AG Dore Produced 946 37 45 50 64 99 126 119 118 94 116 77 kOz AU 63,372 1,770 2,351 4,328 6,652 5,844 8,743 7,871 5,881 6,428 7,700 5,803 kOz AG Revenue $1,205 $48 $57 $63 $81 $126 $161 $151 $151 $120 $148 $98 $M Payable Au $1,074 $30 $40 $73 $113 $99 $148 $133 $100 $109 $130 $98 $M Payable Ag $17 $0 $1 $1 $2 $2 $2 $2 $2 $2 $2 $2 $M Less Refining $45 $2 $2 $3 $4 $4 $6 $6 $5 $5 $6 $4 $M Less Royalty $2,217 $76 $94 $133 $188 $219 $301 $277 $244 $223 $271 $191 $m Net Payable Operating Costs $728 $6 $10 $22 $61 $89 $108 $102 $106 $85 $77 $62 $M Mining $504 $34 $54 $58 $56 $58 $58 $57 $33 $34 $34 $27 $M Process $52 $5 $5 $5 $5 $5 $5 $5 $5 $5 $5 $5 $M G&A $1,283 $44 $69 $85 $121 $152 $171 $164 $143 $124 $116 $94 $M Total Operating Costs $934 $31 $25 $48 $67 $67 $130 $113 $100 $99 $155 $97 $M Net Income $174 $174 $M Total Initial Capital Costs $111 $27 $1 $1 $1 $1 $1 $1 $1 $65 $1 $3 $10 $M Total Sustaining Costs $0 $0 $0 $0 $0 $0 $0 $0 $0 $0 $0 $0 $0 $M Salvage $663 $31 $25 $48 $66 $66 $129 $112 $36 $98 $152 $87 ($174) $M Pretax Cash Flow $210 $9 $1 $8 $6 $14 $37 $30 $26 $29 $42 $7 $0 $M Total Taxes $453 $22 $23 $39 $60 $52 $93 $81 $10 $69 $110 $80 ($174) $M After - Tax Cash Flow Note: numbers may not add up due to rounding.
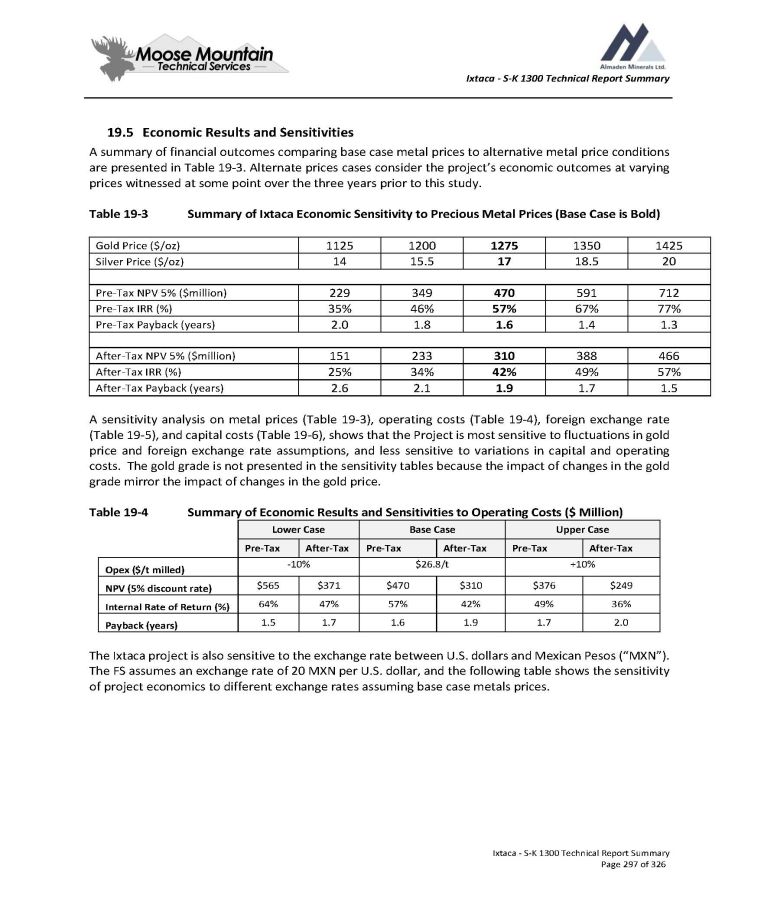
Ixtaca - S - K 1300 Technical Report Summary 19 . 5 Economic Results and Sensitivities A summary of financial outcomes comparing base case metal prices to alternative metal price conditions are presented in Table 19 - 3 . Alternate prices cases consider the project’s economic outcomes at varying prices witnessed at some point over the three years prior to this study . Table 19 - 3 Summary of Ixtaca Economic Sensitivity to Precious Metal Prices (Base Case is Bold) Ixtaca - S - K 1300 Technical Report Summary Page 297 of 326 1425 1350 1275 1200 1125 Gold Price ($/oz) 20 18.5 17 15.5 14 Silver Price ($/oz) 712 591 470 349 229 Pre - Tax NPV 5% ($million) 77% 67% 57% 46% 35% Pre - Tax IRR (%) 1.3 1.4 1.6 1.8 2.0 Pre - Tax Payback (years) 466 388 310 233 151 After - Tax NPV 5% ($million) 57% 49% 42% 34% 25% After - Tax IRR (%) 1.5 1.7 1.9 2.1 2.6 After - Tax Payback (years) A sensitivity analysis on metal prices ( Table 19 - 3 ), operating costs ( Table 19 - 4 ), foreign exchange rate ( Table 19 - 5 ), and capital costs ( Table 19 - 6 ), shows that the Project is most sensitive to fluctuations in gold price and foreign exchange rate assumptions, and less sensitive to variations in capital and operating costs . The gold grade is not presented in the sensitivity tables because the impact of changes in the gold grade mirror the impact of changes in the gold price . Table 19 - 4 Summary of Economic Results and Sensitivities to Operating Costs ( $ Million) Upper Case Base Case Lower Case After - Tax Pre - Tax After - Tax Pre - Tax After - Tax Pre - Tax +10% $26.8/t - 10% Opex ($/t milled) $249 $376 $310 $470 $371 $565 NPV (5% discount rate) 36% 49% 42% 57% 47% 64% Internal Rate of Return (%) 2.0 1.7 1.9 1.6 1.7 1.5 Payback (years) The Ixtaca project is also sensitive to the exchange rate between U . S . dollars and Mexican Pesos (“MXN”) . The FS assumes an exchange rate of 20 MXN per U . S . dollar, and the following table shows the sensitivity of project economics to different exchange rates assuming base case metals prices .
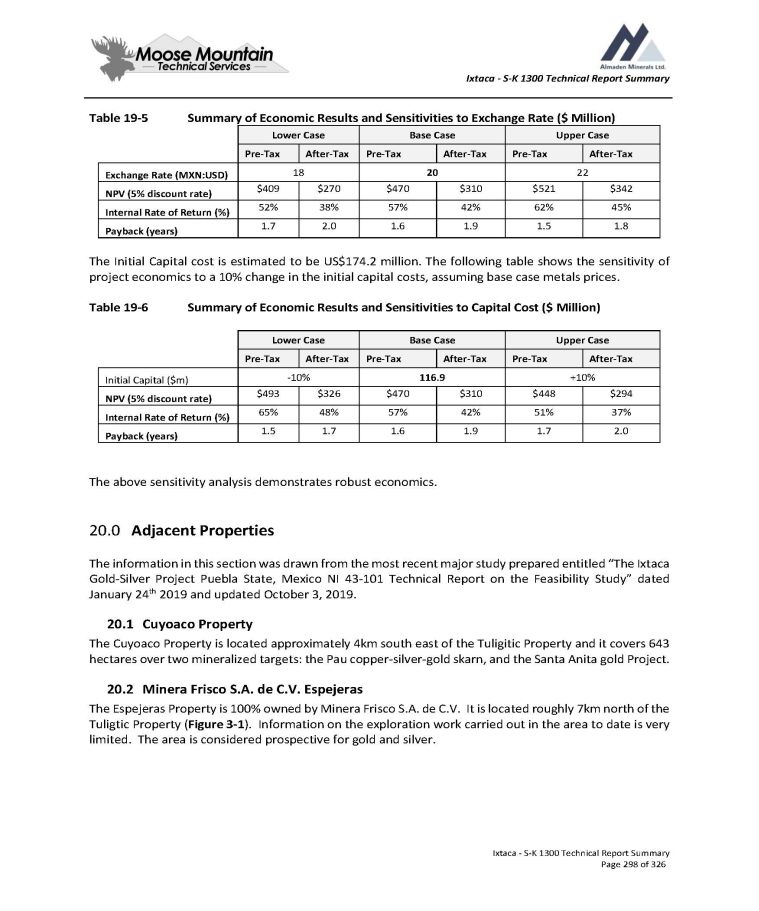
Ixtaca - S - K 1300 Technical Report Summary Table 19 - 5 Ixtaca - S - K 1300 Technical Report Summary Page 298 of 326 Summary of Economic Results and Sensitivities to Exchange Rate ($ Million) Upper Case Base Case Lower Case After - Tax Pre - Tax After - Tax Pre - Tax After - Tax Pre - Tax 22 20 18 Exchange Rate (MXN:USD) $342 $521 $310 $470 $270 $409 NPV (5% discount rate) 45% 62% 42% 57% 38% 52% Internal Rate of Return (%) 1.8 1.5 1.9 1.6 2.0 1.7 Payback (years) The Initial Capital cost is estimated to be US$174.2 million. The following table shows the sensitivity of project economics to a 10% change in the initial capital costs, assuming base case metals prices. Table 19 - 6 Summary of Economic Results and Sensitivities to Capital Cost ($ Million) Upper Case Base Case Lower Case After - Tax Pre - Tax After - Tax Pre - Tax After - Tax Pre - Tax +10% 116.9 - 10% Initial Capital ($m) $294 $448 $310 $470 $326 $493 NPV (5% discount rate) 37% 51% 42% 57% 48% 65% Internal Rate of Return (%) 2.0 1.7 1.9 1.6 1.7 1.5 Payback (years) The above sensitivity analysis demonstrates robust economics . 1. Adjacent Properties The information in this section was drawn from the most recent major study prepared entitled “The Ixtaca Gold - Silver Project Puebla State, Mexico NI 43 - 101 Technical Report on the Feasibility Study” dated January 24 th 2019 and updated October 3 , 2019 . 1. Cuyoaco Property The Cuyoaco Property is located approximately 4 km south east of the Tuligitic Property and it covers 643 hectares over two mineralized targets : the Pau copper - silver - gold skarn, and the Santa Anita gold Project . 2. Minera Frisco S . A . de C . V . Espejeras The Espejeras Property is 100 % owned by Minera Frisco S . A . de C . V . It is located roughly 7 km north of the Tuligtic Property ( Figure 3 - 1 ) . Information on the exploration work carried out in the area to date is very limited . The area is considered prospective for gold and silver .
Ixtaca - S - K 1300 Technical Report Summary 21.0 Other Relevant Data and Information The information in this section was drawn from the most recent major study prepared entitled “The Ixtaca Gold - Silver Project Puebla State, Mexico NI 43 - 101 Technical Report on the Feasibility Study” dated January 24 th 2019 and updated October 3 , 2019 . 21.1 Preliminary Development Schedule A project construction schedule and project execution plan has been developed as part of the FS . Key activities and milestones are summarized below : Permit submission during Q1 2019 Permit Approvals by Q4 2019 Ixtaca construction starts in Q4 2019 Site preparation starts in Q4 2019 Powerline construction starts in Q4 2019 Begin construction of WSD and FWD coffer dams in Q4 2019 Rock Creek plant transported to Ixtaca site end of Q1 2020 Mine preproduction starts in Q2 2020 West T/RSF Year 1 limestone buttress and foundation preparation complete by end of Q2 2021 Plant startup in Q2 2021 Ixtaca - S - K 1300 Technical Report Summary Page 299 of 326
Ixtaca - S - K 1300 Technical Report Summary 1. Interpretation and Conclusions The information in this section was drawn from the most recent major study prepared entitled “The Ixtaca Gold - Silver Project Puebla State, Mexico NI 43 - 101 Technical Report on the Feasibility Study” dated January 24 th 2019 and updated October 3 , 2019 . 1. Introduction An open pit mine plan has been evaluated for the Ixtaca Project . The QP notes the following interpretations and conclusions . 2. Mineral Tenure, Surface Rights Information from Almaden legal counsel supports that the mining tenure held is valid and is sufficient to support declaration of Mineral Resources and Mineral Reserves . The Company has informed the author that material changes to the claim size and legal status of the mineral claims since the date of the Study are provided in the Company’s public disclosure record since that time . A significant portion of surface rights in the proposed mining area has been acquired by Almaden . Additional surface rights negotiations will be required to execute the current mine plan . To the extent known, there are no other significant factors and risks that may affect access, title, or the right or ability to perform work on the property that have not been discussed in this Report . 3. Geology and Mineralization The Ixtaca deposit is an epithermal gold - silver deposit, mostly occurring as anastomosing (branching and reconnecting) vein zones hosted by limestone and shale basement rocks with a minor component of disseminated mineralisation hosted in overlying volcanic rocks . Knowledge of the deposit settings, lithologies, mineralization style and setting, and structural and alteration controls on mineralization is sufficient to support Mineral Resource and Mineral Reserve estimation . 4. Exploration, Drilling and Analytical Data Collection in Support of Mineral Resource Estimation The quantity and quality of the lithological, collar and downhole survey data collected in the exploration and infill drill programs conducted during the Ixtaca campaigns are sufficient to support Mineral Resource and Mineral Reserve estimation . Sample security procedures met industry standards at the time the samples were collected . Current sample storage procedures and storage areas are consistent with industry standards . Ixtaca - S - K 1300 Technical Report Summary Page 300 of 326
Ixtaca - S - K 1300 Technical Report Summary Data verification has been extensively conducted by Almaden, and no material issues have been identified by those programs . Data collected have been sufficiently verified that they can support Mineral Resource and Mineral Reserve estimation and be used for mine planning purposes . 22.5 Metallurgical Testwork Metallurgical testwork completed has been appropriate to the style of mineralization . There are 3 distinct metallurgical domains hosting precious metal mineralization at Ixtaca : Limestone ore contains most of the economic mineralization and contributes 75% of metal production in the FS (90% of metal production in the payback period). Volcanic ore contributes 12% of metal production in the FS. Black Shale ore contributes 13% of metal production in the FS. The testwork demonstrated that economic mineralization responds well to processing by pre - concentration with XRT ore sorting, gravity concentration, intensive leaching of gravity concentrate, flotation, flotation concentrate regrind, leaching with 24 hours Carbon - in - Leach (CIL) to complete gold leaching and 72 hours of agitated leach to complete silver leaching . The majority of economic mineralization is fine grained, requiring a primary grind P 80 of 75 μm for liberation, and regrind prior to leaching . Test work has demonstrated repeatable good overall recoveries for gold and silver in the primary Limestone ore domain . Silver over all recoveries from the volcanic and black shale domains is good . Gold recoveries in volcanic and black shale are poor due to refractory mineralization in the volcanic and preg - robbing organic carbon in the black shale . Ongoing test work indicates that gold recovery improvements in the black shale can be achieved with organic carbon rejection by carbon pre - flotation or flotation cleaning using an organic carbon depressant . Good carbon rejection and subsequent leach recovery was also achieved by ultra fine gravity concentration of black shale concentrates . The testwork results have been used to project metallurgical recovery performance by head grade and metallurgical domain . 22.6 Mineral Resource Estimates Ordinary kriging was used to estimate the Mineral Resources reported at various gold equivalent cut - off grades . Capping was completed to reduce the effect of outliers within each domain . Uniform down hole 3 meter composites were produced for each domain and used to produce semivariograms for each variable . Grades were interpolated into blocks 10 x 10 x 6 meters in dimension by ordinary kriging . Specific gravities were determined for each domain from drill core . Estimated blocks were classified as either Measured, Indicated or Inferred based on drill hole density and grade continuity using the 2014 CIM Definition Standards . Ixtaca - S - K 1300 Technical Report Summary Page 301 of 326
Ixtaca - S - K 1300 Technical Report Summary Factors that may affect the resource estimate include : metal price assumptions, changes in interpretations of mineralization geometry and continuity of mineralization zones, metallurgical recovery assumptions, operating cost assumptions, including assumptions that surface rights to allow mining infrastructure to be constructed will be forthcoming, delays or other issues in reaching agreements with local or regulatory authorities and stakeholders, and changes in land tenure requirements or in permitting requirements from those discussed in this Report . 7. Mineral Reserves Proven and Probable Mineral Reserves have been modified from Measured and Indicated Mineral Resources . Inferred Mineral Resources have been set to waste . Factors that may affect the Mineral Reserves estimates include metal prices, changes in interpretations of mineralization geometry and continuity of mineralization zones, geotechnical and hydrogeological assumptions, process plant and mining recoveries, the ability to meet and maintain permitting and environmental licence conditions, and the ability to acquire surface rights required to execute the mine plan . 8. Mine Plan Reasonable mine plans, mine production schedules, and mine costs have been developed for Mineral Reserves at Ixtaca using pit layouts and mine operations that are typical of other open pit gold operations in Mexico . Pit layouts and mine operations are typical of other open pit gold operations in Canada, and the unit operations within the developed mine operating plan are proven to be effective for these other operations ; 9. Geomechanical A geomechanical plan has been executed for the Study to determine slope design parameters . The following geomechanical risks to the project have been identified and incorporated on the project risk register : Ixtaca - S - K 1300 Technical Report Summary Page 302 of 326 • The potential for landslide and debris flow hazard in the ash tuff remains a risk to the project . Geologic observations indicate ash tuff failures and localized debris flows may occur in this terrain even without mining activity or disturbance . The recommended slope monitoring program will provide warning of ash tuff movement or debris flows . Medium slope failures may occur . These may be the result of Inter - ramp bench failures or the intersection of major structures in the pit wall . The recommended slope monitoring program will identify potential failures so that remedial action may be taken . •
Ixtaca - S - K 1300 Technical Report Summary • Ixtaca - S - K 1300 Technical Report Summary Page 303 of 326 A structural model has not been developed for the project . The development of a structural model and use for stability modeling has the opportunity to de - risk the project by identifying adverse structures prior to mining . Overflow from the Water Storage dam may occur over the life of the open - pit if a greater than 100 - year storm event occurs . The water storage dam is located upstream of the open pit . It is expected that uncontrolled water flows over the open pit walls in the volcanic tuffs and shales have the potential to create failures or debris flows entraining material . Maintenance of reservoir levels, and the recommended slope monitoring program will provide warning of potential instabilities . • Overall geomechanical risks to the project can be reduced by conducting the recommended work in Section 23 . 3 . 3 before, and as mining commences in the Ixtaca open pit . 22.10 Tailings, Rock, and Water Management Tailings and waste rock will be co - disposed in the West Tailings and Rock Storage Facility (West T/RSF) . Tailings produced by the flotation process will be sent through a filter press and then conveyed from the plant to a central point in the West Tailings and Rock Storage Facility . From this location, the tailings will be placed, spread and compacted in layers . The filtered tailings will be surrounded by a limestone waste rock buttress and will be deposited with waste rock . A stochastic daily water balance model was prepared for the Project using GoldSim . The main objectives of the site water management plan are to optimize the use of water, prevent discharge of water from the filtered tailings operational surface (West T/RSF), maximize the use of stormwater runoff as fresh water supply to the Process Plant, and to maintain a flow of water downstream of the mine for the community . Process plant demands will be met from the following sources : Stormwater runoff from the West T/RSF operating surface Fresh water will be provided from various sources including: o Groundwater inflow to the pit; o Stormwater runoff collected in the open pit; o The FWD; o The WSD; In the early years of operations (Years 1 to 5 ), the predicted groundwater inflows and stormwater in the pit and surface of Co - disposal will supply the plant water demand, with no makeup water anticipated from the FWD and WSD . In the later years of operation (Years 6 onwards), all water sources are used to meet plant demand . A portion of rainfall or groundwater inflow accumulated in the open pit will be used for dust control during the dry months . The results of the daily water balance model illustrate that the mine will operate in a water balance over a broad range of climatic conditions with the base - case parameters noted above . For startup and through mine year 5 there is a very low risk of insufficient water for plant operations . There is uncertainty in the
Ixtaca - S - K 1300 Technical Report Summary basin yield modeled in the daily water balance and associated risk that an actual CN of less than 80 may result in a plant shortfall from mine year 6 forward. The following risks to the project have been identified for the West T/RSF and South RSF foundations, FWD, WSD, and water management structures and incorporated into the project risk register. Ixtaca - S - K 1300 Technical Report Summary Page 304 of 326 • Potential for insufficient water for the project after mine year 5 because of the reliance of precipitation and run - off for operational water . This may also include insufficient water for community water commitments which could result project interruptions . Data from the upgraded site monitoring stations will continue to be monitored and analyzed through start up and during operations . This data will be used to update the water balance and if a risk of plant shortfall still exists after mine year 5 , then a contingency plan for alternative water sources should be developed . The potential for strength degradation in low strength, low - density ash foundation materials if saturated, piping under high seepage gradients and potentially brittle failure (collapse) under loading conditions in excess of pre - consolidation pressures . Additional characterization and design will be needed to further address the limitations of the existing foundation materials in the proposed facility footprints (West T/RSF, South RSF, FWD, and WSD) . The potential for deeper than anticipated colluvial/alluvial and landslide deposits necessitate deeper than anticipated foundation excavations during construction which could increase construction costs for the project . Additional geotechnical investigation within the FS footprints of the FWD, WRD, West T/RSF, and South RSF toe areas is required to further quantify and mitigate this risk . The potential for difficulties during dry - stacking operations including, filtration inefficiencies, lack of operational controls and/or excessive rate of rise leads to excess pore pressure in the compacted tailings and slope instability . These should be addressed in the operations plan developed during the detailed design . The potential for differential settlement in the WSD eastern abutment due to construction of the 60 - meter - high dam on different lithologies within the embankment footprint could cause damage to the geomembrane liner, seepage through the embankment, and release of water into the Open Pit. Additional geotechnical investigation and geologic mapping in the volcanics within the WSD footprint is required to further quantify this risk. The completion of a trade - off study for construction of the WSD with RCC versus the FS rockfill construction is also recommended. Seepage and piping through the portions of the facility footprints (West T/RSF, South RSF, FWD, and WSD) located on volcanics could impacted facility stability and groundwater chemistry. Additional geotechnical investigation in the eastern abutment would minimize this risk. In addition, Completion of a trade - off for construction of the WSD with RCC versus the FS rockfill construction is recommended. D ue to the prevalence of ash tuffs and lapilli tuff and breccias in the proposed foundation excavations of the Fresh Water Dam and Water Storage Dam as well as the borrow source areas for these facilities, there is the potential for insufficient appropriate borrow materials for construction . Designs in the FS have minimized use of these materials as construction fill for the dams however, the volcanics are still used for liner subgrade preparation within the basins . Their suitability should be further characterized during the detailed design or alternatives should be identified . • • • • • •
Ixtaca - S - K 1300 Technical Report Summary The work to address each of these risks for the West T/RSF and South RSF foundations, FWD, WSD, and water management structures has been included in the recommended work detailed in Section 23 . 2 . 11. Environmental, Permitting and Social Considerations Almaden has engaged a Mexican environmental consultant to develop an Environmental Impact Assessment (MIA), an application for change in land use (CUS) and accompanying Technical Supporting Study (ETJ) for the Ixtaca Project, with an anticipated submission in the first quarter of 2019 . Almaden has conducted extensive open, transparent communication with project stakeholders . The Company has informed the author that material changes to the claim size and legal and permitting status of the Property since the date of the Study are provided in the Company’s public disclosure record since that time . 12. Capital and Operating Cost Estimates The initial capital cost for construction of the Ixtaca Project has been estimated to be $ 174 million, and the total sustaining capital cost is estimated to be $ 111 million over the LOM . 13. Economic Analysis Project economics assume a gold price of $ 1275 /Oz, and a silver price of $ 17 /oz, and exchange rate of 1 US $ = 20 MXN Peso . The Project NPV at a 5 % discount rate is $ 310 million, with an IRR of 42 % and initial capital payback of 1 . 9 Years . NPV is discounted to the start of Year - 1 . Risks to the economic analysis include : Changes to costs of production from what is assumed; Unrecognized environmental risks; Unanticipated reclamation expenses; Unexpected variations in quantity of mineralised material, grade, or recovery rates; Geotechnical and hydrogeological considerations during mining being different from what was assumed; Failure of plant, equipment, or processes to operate as anticipated; Accidents, labour disputes and other risks of the mining industry. Ixtaca - S - K 1300 Technical Report Summary Page 305 of 326

Ixtaca - S - K 1300 Technical Report Summary 23.0 Recommendations The information in this section was drawn from the most recent major study prepared entitled “The Ixtaca Gold - Silver Project Puebla State, Mexico NI 43 - 101 Technical Report on the Feasibility Study” dated January 24 th 2019 and updated October 3 , 2019 . Pending financing and a production decision, MMTS recommends that the Ixtaca Project proceed to the detailed design phase . 23.1 Geology and Exploration The following exploration drilling is recommended: Higher resolution drilling of the starter pit area to improve the definition of start - up mill feed Step out exploration of the north high - grade limestone Step out exploration of the north east black shale potential underground mining target Additional exploration of the Tano and SE Alteration zones The exploration drilling costs are estimated to be $550,000. 23 . 2 Tailings, Rock, and Water Management Recommendations The following work is recommended for the detailed design of the West T/RSF, South RSF, Fresh Water Dam, and Water Storage Dam . Additional geotechnical characterization in the West T/RSF footprint including drilling, laboratory testing, and geophysics to refine geotechnical parameters used in the stability analysis, and the extent and depth of the shear key at the downgradient toe of the West T/RSF . Additional geotechnical characterization in the South RSF footprint including drilling, laboratory testing, and geophysics to refine geotechnical parameters used in the stability analysis . Additional geotechnical testing to confirm geotechnical properties of the compacted filtered tailings and waste rock mix including gradation, density, drainage/permeability, consolidation, and strength . Additional geotechnical characterization in the Fresh Water Dam footprint including drilling, laboratory testing, and geophysics to refine geotechnical parameters used in the stability analysis . Additional characterization via targeted geotechnical drilling and laboratory testing in the volcanics in the eastern abutment of the Water Storage Dam . Trade - off study for the Water Storage Dam to compare the FS design to a roller compacted concrete design . Update the water balance with additional years of site monitoring data for precipitation and streamflows . If needed develop a contingency plan for alternative water sources as noted in Section 22 . 10 . The completion of the above work is estimated to cost $300,000. Ixtaca - S - K 1300 Technical Report Summary Page 306 of 326
Ixtaca - S - K 1300 Technical Report Summary Detailed engineering for the West T/RSF and South RSF foundations, the FWD, WSD, and water management structures is estimated to cost approximately $ 500 , 000 . The total detailed design costs from these items is estimated to be $ 800 , 000 . These costs have been included in the cost estimate . Site - wide water management recommendations include continued monitoring and analysis of the site monitoring data, available from site via telemetry, to refine basin yield estimates . 3. Mining Recommendations 1. Open Pit Mining The pit limit, pit phase designs, mining method/equipment, and production schedule will be developed for EPCM and used to negotiate a mining contract with the chosen contract mining group . Activities involved in updating the mining section include (but are not limited to) : Optimize the production schedule through examining various stockpiling scenarios and stockpile locations as well as RSF locations Develop a short - range monthly mine plan for Years - 1, 1 and 2. Develop a more detailed mine area reclamation plan. Drill off Phase 1 and 2 in higher detail to confirm and update the geology model Total open pit mining costs estimated at $ 150 , 000 . 23 . 3 . 2 Underground Mining Potential Potential underground mining has not been considered for the FS . Contiguous mineralized high grade zones beneath the FS open pit are potential underground mining (UG) resources . Figure 23 - 1 shows an section view below the pit with 60 m wide high grade mineralization that could be amenable to long hole open stoping . Ixtaca - S - K 1300 Technical Report Summary Page 307 of 326
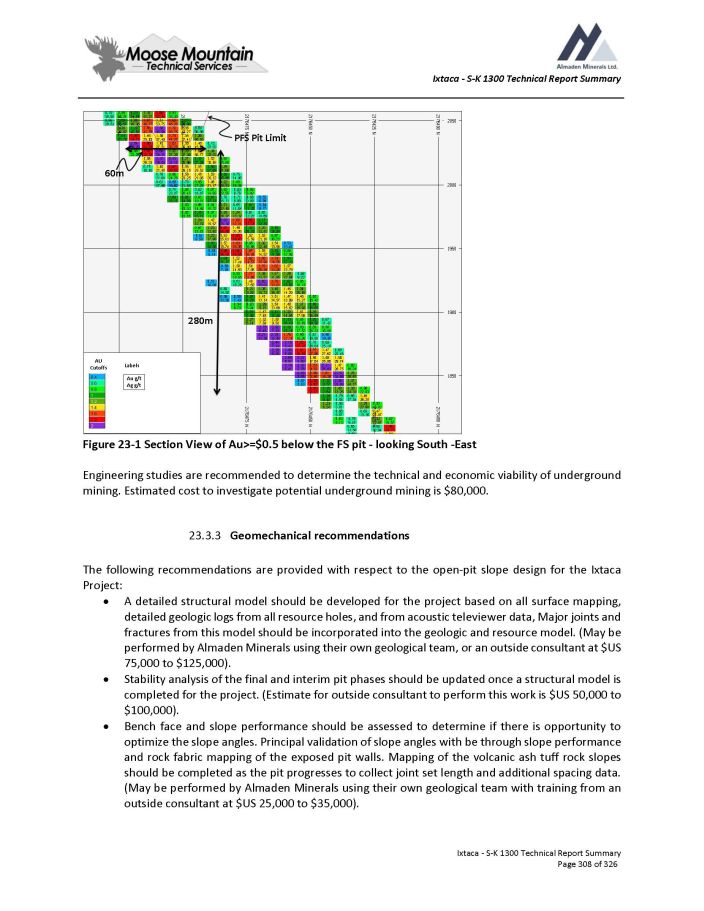
Ixtaca - S - K 1300 Technical Report Summary Figure 23 - 1 Section View of Au>= $ 0 . 5 below the FS pit - looking South - East Engineering studies are recommended to determine the technical and economic viability of underground mining . Estimated cost to investigate potential underground mining is $ 80 , 000 . 23.3.3 Geomechanical recommendations The following recommendations are provided with respect to the open - pit slope design for the Ixtaca Project : A detailed structural model should be developed for the project based on all surface mapping, detailed geologic logs from all resource holes, and from acoustic televiewer data, Major joints and fractures from this model should be incorporated into the geologic and resource model . (May be performed by Almaden Minerals using their own geological team, or an outside consultant at $ US 75 , 000 to $ 125 , 000 ) . Stability analysis of the final and interim pit phases should be updated once a structural model is completed for the project . (Estimate for outside consultant to perform this work is $ US 50 , 000 to $100,000). Bench face and slope performance should be assessed to determine if there is opportunity to optimize the slope angles . Principal validation of slope angles with be through slope performance and rock fabric mapping of the exposed pit walls . Mapping of the volcanic ash tuff rock slopes should be completed as the pit progresses to collect joint set length and additional spacing data . (May be performed by Almaden Minerals using their own geological team with training from an outside consultant at $ US 25 , 000 to $ 35 , 000 ) . Ixtaca - S - K 1300 Technical Report Summary Page 308 of 326
Ixtaca - S - K 1300 Technical Report Summary Ensure adequate drainage measures along pit benches in the volcanic ash tuff are designed and implemented in the detailed design phase of the open pit . Any tension cracks where volcanic ash tuff is exposed at the recommended inter - ramp angle of 43 Σ may be subjected to displacement, erosional, and failure mechanisms if adequate drainage is not designed and constructed on the benches . The ash tuff slopes, as designed, meet the slope acc eptance criteria at a FoS of 1 . 3 , however potential failure mechanisms may occur including gullying, piping, and erosion . (Part of normal mining design and mining costs, i . e . , road maintenance, using either graders or bulldozers) . Numerical modeling of the deepest and critical section of the open pit should be completed to assess incremental deformation and material strain softening in the weak rock mass . As mining commences, and slope monitoring deformations can be observed, numerical modeling should be completed to assess the stability of the deepest phases of the pit . (Estimate for outside consultant to perform this work is $ US 30 , 000 to $ 60 , 000 ) . 4. Metallurgy and Process Recommendations Testwork should continue on Black Shale to improve gold recovery and overcome the preg - robbing properties . This metallurgical testing work is estimated to cost $ 100 , 000 . 5. Environmental Recommendations It is recommended to continue with the long lead environmental baseline studies, including climate, hydrology, and water quality to support permitting requirements . Advanced groundwater and surface water predictive models are recommended to interpret potential impacts and better mitigate for them . Costs for ongoing environmental work are estimated at approximately $ 300 , 000 . 6. Infrastructure Recommendations A study to refine the alignment of the powerline should be completed at a cost of $ 150 , 000 . 7. Aggregate Potential A large portion of the Ixtaca Waste rock is non - mineralized limestone . Limestone waste rock is Geo - chemical and geo - mechanical tests indicate that most of the limestone waste rock is likely suitable for use as an aggregate . The high calcium content also makes it potentially suitable for agriculture . The potential to supply aggregate to the > 60 million tonne per year Mexican aggregate market should be further investigated . Estimated cost for this study is $ 20 , 000 . 8. Cement Potential Ixtaca - S - K 1300 Technical Report Summary Page 309 of 326
Ixtaca - S - K 1300 Technical Report Summary Chemical analysis of limestone flotation tailings shows high calcium content with low impurities . An investigation is recommended to determine if Ixtaca flotation tailings are a potential feedstock for a cement production process . Cost estimate to evaluate cement potential is $ 100 , 000 . 9. Risk Assessment A detailed project risk assessment is recommended. Estimated cost is $50,000. 10. Budget The costs of completing the above recommendations is broken down in Table 26 - 1. Table 23 - 1 Recommendations Budget Ixtaca - S - K 1300 Technical Report Summary Page 310 of 326 Cost ($) Item 550,000 Geology and Exploration 800,000 Tailings, Rock, and Water Management Recommendation 150,000 Open Pit Mining Studies 80,000 Underground Potential Mining Studies 320,000 Geomechanical 300,000 Environmental 150,000 Powerline 20,000 Aggregate potential 100,000 Cement potential 50,000 Risk Assessment update 2,520,000 Total
Ixtaca - S - K 1300 Technical Report Summary 24.0 References Ixtaca - S - K 1300 Technical Report Summary Page 311 of 326 Almaden Minerals Ltd. (2004): United States Securities Exchange Commission Form 20 - F. Annual Report for the Fiscal Year Ended December 31, 2004, 178 p. Almaden Minerals Ltd. (2005): United States Securities Exchange Commission Form 20 - F. Annual Report for the Fiscal Year Ended December 31, 2005, 338 p. Almaden Minerals Ltd. (2006): United States Securities Exchange Commission Form 20 - F. Annual Report for the Fiscal Year Ended December 31, 2006, 156 p. Almaden Minerals Ltd. (2007): United States Securities Exchange Commission Form 20 - F. Annual Report for the Fiscal Year Ended December 31, 2007, 218 p. Almaden Minerals Ltd. (2008): United States Securities Exchange Commission Form 20 - F. Annual Report for the Fiscal Year Ended December 31, 2008, 180 p. Almaden Minerals Ltd. (2004): United States Securities Exchange Commission Form 20 - F. Annual Report for the Fiscal Year Ended December 31, 2004, 178 p. Almaden Minerals Ltd. (2009): United States Securities Exchange Commission Form 20 - F. Annual Report for the Fiscal Year Ended December 31, 2009, 180 p. Almaden Minerals Ltd. (2011): United States Securities Exchange Commission Form 20 - F. Annual Report for the Fiscal Year Ended December 31, 2011, 140 p. Bentzen, A., and Sinclair, A.J. (1993): P - RES – A Computer Program to Aid in the Investigation of Polymetallic Ore Reserves. Technical Report MT - 9 Mineral Deposit Reach Unit, Dept. of Geological Sciences U.B.C., 55 p. Bureau Veritas Commodities Canada Ltd., Mineralogical Assessment of Two Process Stream Samples (black shale), November 06, 2017 Bureau Veritas Commodities Canada Ltd., Mineralogical Assessment of the Gravity – Flotation – Cyanidation Test Products, February 27, 2017 Bureau Veritas Commodities Canada Ltd., Mineralogical Study on Four Tailing Samples, November 19, 2015 Blue Coast Research, Almaden Ixtaca Project, PEA Metallurgical Testwork Report, March 07, 2013 Blue Coast Research, Almaden Ixtaca Project, PEA Metallurgical Testwork Report Phase 2, May 05, 2014 Carrasco - Nunez G., Gomez - Tuena A., Lozano L. (1997): Geologic Map of Cerro Grande Volcano and surrounding areas, Central Mexico. Geological Society of America, Map and Charts Series, map MCH081F, 10 p. Canadian Institute of Mining, Metallurgy and Petroleum (CIM). (2014). CIM Definition Standards – For Mineral Resources and Mineral Reserves. Chlumsky, Armbrust & Meyer (2011): NI 43 - 101 Technical Report Dolores Gold - Silver Project Chihuahua, Mexico, 92 p. Coller, D. (2011): Structure and Tectonics of the Ixtaca Epithermal Gold - Silver Vein System, Puebla, Mexico, A Preliminary Field Based Assessment, 15 p. COREVI. 2014. Monitoreo de Flora y Fauna Proyecto Ixtaca. Consultores en Ecología con Visión Integral, S.A. de C.V. May 2014 Ferrari L., Orozco - Esquivel T., Manea V., Manea M. (2011): The dynamic history of the Trans - Mexican Volcanic Belt and the Mexico Subduction Zone. Tectonophysics, V 522 - 523, p. 122 - 149. Fuentes - Peralta T., and Calderon M. C. (2008): Geological Monography of the State of Puebla, Mexico (in Spanish). Servicio Geologico Mexicano (SGM), 257 p. Garcia - Palomo A., Macias J.L., Arce J.L., Capra L., Garduno V.H., Espindola J.M. (2002): Geology of the Nevado de Toluca Volcano and surrounding areas, central Mexico. Geological Society of America, Maps and Charts Series, map MCH089X, 26 p.
Ixtaca - S - K 1300 Technical Report Summary Hedenquist J.W., and Henley R.W. (1995): The Importance of Co2 on Freezing Point Measurements of Fluid Inclusions: Evidence from Active Geothermal Systems and Implications for Epithermal Ore Deposition. Economic Geology, v. 80, 28 p. Herrington R. (2011): Ixtaca Core Samples: Preliminary SEM Analyses, 20 p. Knight Piésold Ltd. (KP). VA13 - 00708. Ixtaca Project, Mexico Preliminary Pit Slope Recommendations by Knight Piésold on March 25, 2013. Knight Piésold Ltd. (KP). VA14 - 00215. Ixtaca Project – Waste and Water Management – Updated Design and Preliminary Cost Estimate for TMF Option 5B - 150 by Knight Piésold on Feb. 19, 2014. Knight Piésold Ltd. (KP). VA14 - 01393. Updated Design and Preliminary Cost Estimate for TMF Option 5B - 130 to incorporate the addition of a Special Materials Handling Facility, Prepared for Almaden Minerals Ltd. by Knight Piésold on September 16, 2014. Knight Piésold Ltd. (KP). VA14 - 01394. Alternative 2 – Design Summary and Preliminary Cost Estimate, Prepared for Almaden Minerals Ltd. by Knight Piésold on September 16, 2014. Knight Piésold Ltd. (KP). VA201 - 415/5 - A.01,Ixtaca Project - Results of the FS Geochemical Characterization Program, Letter Prepared for Almaden Minerals Ltd. by Knight Piésold on May 25, 2015. Knight Piésold Ltd. (KP). VA201 - 415/5 - 4 Pre - Feasibility Pit Slope Design, Prepared for Almaden Minerals Ltd. by Knight Piésold on July 15, 2015. Knight Piésold Ltd. 2017. Draft Baseline Hydrogeology Report. VA201 - 415/8 - 2. April 24, 2017. Leitch, C. (2011): Petrographic Report on 22 Samples. Prepared for Almaden Minerals Ltd., p. 1 - 28. Meintjes, T., Aarsen, J.,Raffle, K., Giroux, G.H., Balasko, C., Wellman, E., (2019): Ixtaca Gold - Silver Project Puebla State, Mexico NI 43 - 101 Technical Report on the Feasibility Study McLelland Laboratories, Phase 1 Metallurgical Testing Program, July 22, 2016 McLelland Laboratories, Phase 2 Metallurgical Testing, May 03, 2017 Metsolve Laboratories, Ixtaca DGRG Tests, July 11, 2016 Morales - Ramirez J.M. (2002): Geology and metallogeny of the Au - Ag - kaolin deposit of Ixtacamaxtitlan (Puebla State, Mexico) (in Spanish). Honors Thesis, Faculty of Engineering, National University of Mexico, 153 p. Panteleyev, A. (1995): Porphyry Cu - Au alkali (L03); in Selected British Columbia Mineral Deposit Profiles Volume 1 – Metallics and Coal, Lefebure, D.V. and Ray, G.E., editors, B.C. Ministry of Energy and Mines, Paper 1995 - 20, p. 83 - 86. Raffle, K.J., Giroux, G.H. (2017): Pre - Feasibility Study of the Ixtaca Gold - Silver Project, Puebla State, Mexico Raffle, K.J., Giroux, G.H. (2016): Preliminary Economic Assessment of the Ixtaca Gold - Silver Project, Puebla State, Mexico Raffle, K.J., Giroux, G.H. (2014): Technical Report on the Tuligtic Project, Puebla State, Mexico, 101 p. Raffle, K.J., Giroux, G.H., Bamber, A. (2013): Technical Report on the Tuligtic Project, Puebla State, Mexico, 131 p. Ray, G.E. (1995): Pb - Zn Skarns, in Selected British Columbia Mineral Deposit Profiles, Volume 1 – Metallics and Coal, Lefebure, D.V. and Ray, G.E., Editors, British Columbia Ministry of Employment and Investment, Open File 1995 - 20, pages 61 - 62. Reyes - Cortes M. (1997): Geology of the Oriental basin, States of Puebla, Veracruz, and Texcala (in Spanish). SEP/INAH scientific collection, v. 71, 62 p. Sillitoe, R.H. (1993): Epithermal Models: Genetic Types, Geometric Controls and Shallow Features; in Ore Deposits Modeling, Geological Association of Canada, Special Volume 40, pages 403 - 417. Sinclair, A.J. (1974): Applications of Probability Graphs in Mineral Exploration. Spec. V. Association of Exploration Geochemists, 95 p. Staffurth N. (2012): Mineralogy and Ore Fluid Properties of the Ixtaca Epithermal Deposits, Puebla State, Mexico: What is the Cause of Gold - Rich Versus Silver - Rich Veins? Master’s Thesis, Faculty of Geology, Imperial College London, 35 p. Taylor, B . E . ( 2007 ) : Epithermal Gold Deposits, Mineral Deposits of Canada : A Synthesis of Major Deposit - Types, Distric Metallogeny, The Evolution of Geological Provinces, and Exploration Methods : Geological Association of Canada, Mineral Deposits Division, Special Publication No . 5 , p . 113 - 139 . Ixtaca - S - K 1300 Technical Report Summary Page 312 of 326
Ixtaca - S - K 1300 Technical Report Summary Tritlla J, Camprubi A., Morales - Ramirez J.M., Iriondo A., Corona - Esquivel R., Gonzalez - Partida E., Levresse G., and Carrillo - Chavez A. (2004): The Ixtacamaxtitlan kaolinite deposit and sinter (Puebla State, Mexico): a magmatic – hydrothermal system telescoped by a shallow paleoaquifer. Geofluids v. 4, 12 p. White N.C., and Hedenquist J.W. (1990): Epithermal Environments and Styles of Mineralization: Variations and Their Causes, and Guidelines for Exploration, 29 p. White N.C., and Hedenquist J.W. (1995): Epithermal Gold Deposits: Styles, Characteristics and Exploration. Society of Economic Geologists (SEG), Number 23, 6 p. 25.0 Reliance on information provided by the registrant The author has not relied on any information from the registrant for this Technical Report Summary. Ixtaca - S - K 1300 Technical Report Summary Page 313 of 326
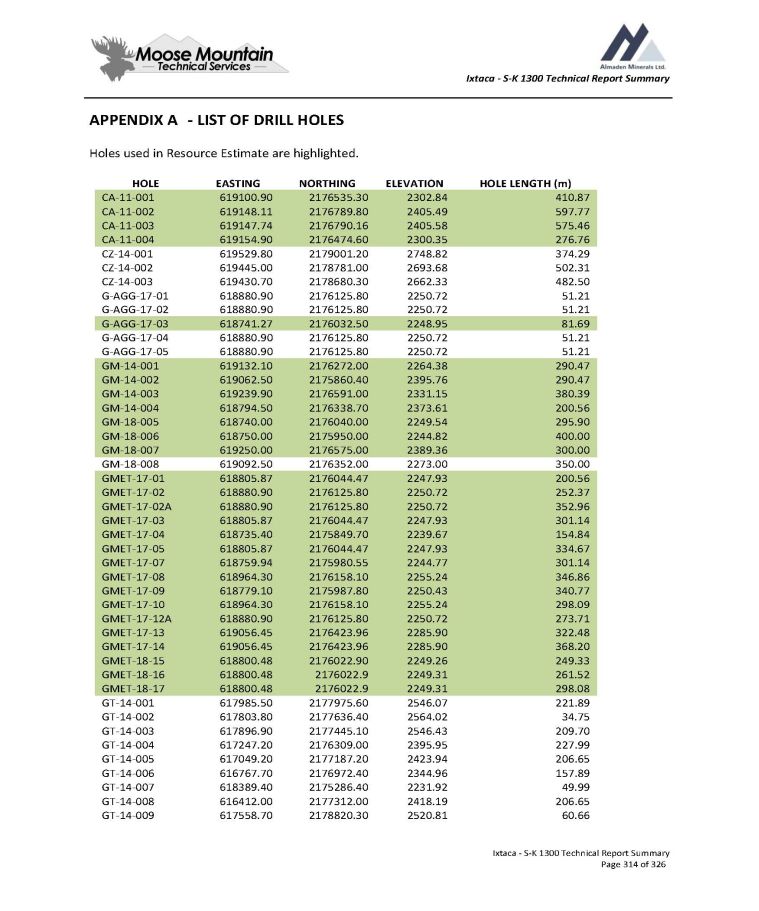
Ixtaca - S - K 1300 Technical Report Summary APPENDIX A - LIST OF DRILL HOLES Holes used in Resource Estimate are highlighted. Ixtaca - S - K 1300 Technical Report Summary Page 314 of 326 HOLE LENGTH (m) ELEVATION NORTHING EASTING HOLE 410.87 2302.84 2176535.30 619100.90 CA - 11 - 001 597.77 2405.49 2176789.80 619148.11 CA - 11 - 002 575.46 2405.58 2176790.16 619147.74 CA - 11 - 003 276.76 2300.35 2176474.60 619154.90 CA - 11 - 004 374.29 2748.82 2179001.20 619529.80 CZ - 14 - 001 502.31 2693.68 2178781.00 619445.00 CZ - 14 - 002 482.50 2662.33 2178680.30 619430.70 CZ - 14 - 003 51.21 2250.72 2176125.80 618880.90 G - AGG - 17 - 01 51.21 2250.72 2176125.80 618880.90 G - AGG - 17 - 02 81.69 2248.95 2176032.50 618741.27 G - AGG - 17 - 03 51.21 2250.72 2176125.80 618880.90 G - AGG - 17 - 04 51.21 2250.72 2176125.80 618880.90 G - AGG - 17 - 05 290.47 2264.38 2176272.00 619132.10 GM - 14 - 001 290.47 2395.76 2175860.40 619062.50 GM - 14 - 002 380.39 2331.15 2176591.00 619239.90 GM - 14 - 003 200.56 2373.61 2176338.70 618794.50 GM - 14 - 004 295.90 2249.54 2176040.00 618740.00 GM - 18 - 005 400.00 2244.82 2175950.00 618750.00 GM - 18 - 006 300.00 2389.36 2176575.00 619250.00 GM - 18 - 007 350.00 2273.00 2176352.00 619092.50 GM - 18 - 008 200.56 2247.93 2176044.47 618805.87 GMET - 17 - 01 252.37 2250.72 2176125.80 618880.90 GMET - 17 - 02 352.96 2250.72 2176125.80 618880.90 GMET - 17 - 02A 301.14 2247.93 2176044.47 618805.87 GMET - 17 - 03 154.84 2239.67 2175849.70 618735.40 GMET - 17 - 04 334.67 2247.93 2176044.47 618805.87 GMET - 17 - 05 301.14 2244.77 2175980.55 618759.94 GMET - 17 - 07 346.86 2255.24 2176158.10 618964.30 GMET - 17 - 08 340.77 2250.43 2175987.80 618779.10 GMET - 17 - 09 298.09 2255.24 2176158.10 618964.30 GMET - 17 - 10 273.71 2250.72 2176125.80 618880.90 GMET - 17 - 12A 322.48 2285.90 2176423.96 619056.45 GMET - 17 - 13 368.20 2285.90 2176423.96 619056.45 GMET - 17 - 14 249.33 2249.26 2176022.90 618800.48 GMET - 18 - 15 261.52 2249.31 2176022.9 618800.48 GMET - 18 - 16 298.08 2249.31 2176022.9 618800.48 GMET - 18 - 17 221.89 2546.07 2177975.60 617985.50 GT - 14 - 001 34.75 2564.02 2177636.40 617803.80 GT - 14 - 002 209.70 2546.43 2177445.10 617896.90 GT - 14 - 003 227.99 2395.95 2176309.00 617247.20 GT - 14 - 004 206.65 2423.94 2177187.20 617049.20 GT - 14 - 005 157.89 2344.96 2176972.40 616767.70 GT - 14 - 006 49.99 2231.92 2175286.40 618389.40 GT - 14 - 007 206.65 2418.19 2177312.00 616412.00 GT - 14 - 008 60.66 2520.81 2178820.30 617558.70 GT - 14 - 009
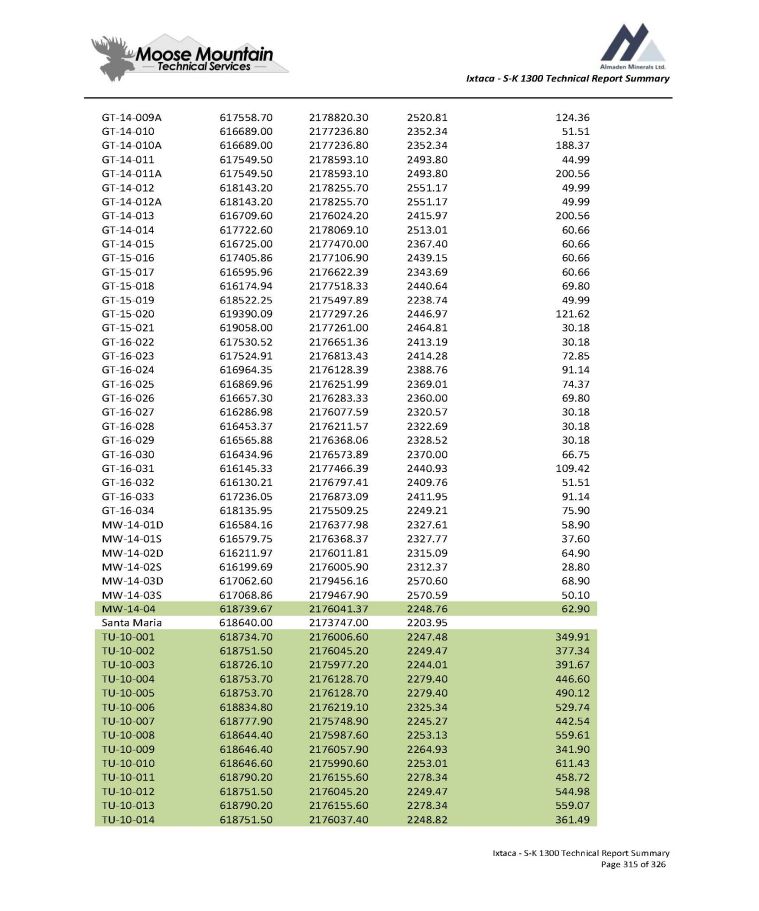
Ixtaca - S - K 1300 Technical Report Summary 124.36 2520.81 2178820.30 617558.70 GT - 14 - 009A 51.51 2352.34 2177236.80 616689.00 GT - 14 - 010 188.37 2352.34 2177236.80 616689.00 GT - 14 - 010A 44.99 2493.80 2178593.10 617549.50 GT - 14 - 011 200.56 2493.80 2178593.10 617549.50 GT - 14 - 011A 49.99 2551.17 2178255.70 618143.20 GT - 14 - 012 49.99 2551.17 2178255.70 618143.20 GT - 14 - 012A 200.56 2415.97 2176024.20 616709.60 GT - 14 - 013 60.66 2513.01 2178069.10 617722.60 GT - 14 - 014 60.66 2367.40 2177470.00 616725.00 GT - 14 - 015 60.66 2439.15 2177106.90 617405.86 GT - 15 - 016 60.66 2343.69 2176622.39 616595.96 GT - 15 - 017 69.80 2440.64 2177518.33 616174.94 GT - 15 - 018 49.99 2238.74 2175497.89 618522.25 GT - 15 - 019 121.62 2446.97 2177297.26 619390.09 GT - 15 - 020 30.18 2464.81 2177261.00 619058.00 GT - 15 - 021 30.18 2413.19 2176651.36 617530.52 GT - 16 - 022 72.85 2414.28 2176813.43 617524.91 GT - 16 - 023 91.14 2388.76 2176128.39 616964.35 GT - 16 - 024 74.37 2369.01 2176251.99 616869.96 GT - 16 - 025 69.80 2360.00 2176283.33 616657.30 GT - 16 - 026 30.18 2320.57 2176077.59 616286.98 GT - 16 - 027 30.18 2322.69 2176211.57 616453.37 GT - 16 - 028 30.18 2328.52 2176368.06 616565.88 GT - 16 - 029 66.75 2370.00 2176573.89 616434.96 GT - 16 - 030 109.42 2440.93 2177466.39 616145.33 GT - 16 - 031 51.51 2409.76 2176797.41 616130.21 GT - 16 - 032 91.14 2411.95 2176873.09 617236.05 GT - 16 - 033 75.90 2249.21 2175509.25 618135.95 GT - 16 - 034 58.90 2327.61 2176377.98 616584.16 MW - 14 - 01D 37.60 2327.77 2176368.37 616579.75 MW - 14 - 01S 64.90 2315.09 2176011.81 616211.97 MW - 14 - 02D 28.80 2312.37 2176005.90 616199.69 MW - 14 - 02S 68.90 2570.60 2179456.16 617062.60 MW - 14 - 03D 50.10 2570.59 2179467.90 617068.86 MW - 14 - 03S 62.90 2248.76 2176041.37 618739.67 MW - 14 - 04 2203.95 2173747.00 618640.00 Santa Maria 349.91 2247.48 2176006.60 618734.70 TU - 10 - 001 377.34 2249.47 2176045.20 618751.50 TU - 10 - 002 391.67 2244.01 2175977.20 618726.10 TU - 10 - 003 446.60 2279.40 2176128.70 618753.70 TU - 10 - 004 490.12 2279.40 2176128.70 618753.70 TU - 10 - 005 529.74 2325.34 2176219.10 618834.80 TU - 10 - 006 442.54 2245.27 2175748.90 618777.90 TU - 10 - 007 559.61 2253.13 2175987.60 618644.40 TU - 10 - 008 341.90 2264.93 2176057.90 618646.40 TU - 10 - 009 611.43 2253.01 2175990.60 618646.60 TU - 10 - 010 458.72 2278.34 2176155.60 618790.20 TU - 10 - 011 544.98 2249.47 2176045.20 618751.50 TU - 10 - 012 559.07 2278.34 2176155.60 618790.20 TU - 10 - 013 361.49 2248.82 2176037.40 618751.50 TU - 10 - 014 Ixtaca - S - K 1300 Technical Report Summary Page 315 of 326
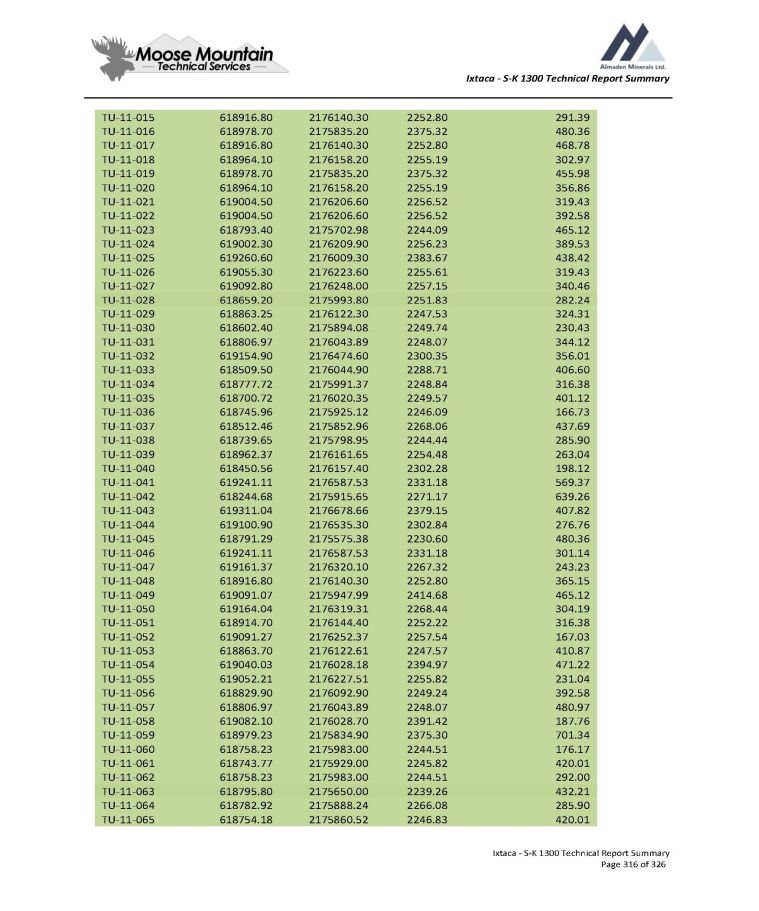
Ixtaca - S - K 1300 Technical Report Summary 291.39 2252.80 2176140.30 618916.80 TU - 11 - 015 480.36 2375.32 2175835.20 618978.70 TU - 11 - 016 468.78 2252.80 2176140.30 618916.80 TU - 11 - 017 302.97 2255.19 2176158.20 618964.10 TU - 11 - 018 455.98 2375.32 2175835.20 618978.70 TU - 11 - 019 356.86 2255.19 2176158.20 618964.10 TU - 11 - 020 319.43 2256.52 2176206.60 619004.50 TU - 11 - 021 392.58 2256.52 2176206.60 619004.50 TU - 11 - 022 465.12 2244.09 2175702.98 618793.40 TU - 11 - 023 389.53 2256.23 2176209.90 619002.30 TU - 11 - 024 438.42 2383.67 2176009.30 619260.60 TU - 11 - 025 319.43 2255.61 2176223.60 619055.30 TU - 11 - 026 340.46 2257.15 2176248.00 619092.80 TU - 11 - 027 282.24 2251.83 2175993.80 618659.20 TU - 11 - 028 324.31 2247.53 2176122.30 618863.25 TU - 11 - 029 230.43 2249.74 2175894.08 618602.40 TU - 11 - 030 344.12 2248.07 2176043.89 618806.97 TU - 11 - 031 356.01 2300.35 2176474.60 619154.90 TU - 11 - 032 406.60 2288.71 2176044.90 618509.50 TU - 11 - 033 316.38 2248.84 2175991.37 618777.72 TU - 11 - 034 401.12 2249.57 2176020.35 618700.72 TU - 11 - 035 166.73 2246.09 2175925.12 618745.96 TU - 11 - 036 437.69 2268.06 2175852.96 618512.46 TU - 11 - 037 285.90 2244.44 2175798.95 618739.65 TU - 11 - 038 263.04 2254.48 2176161.65 618962.37 TU - 11 - 039 198.12 2302.28 2176157.40 618450.56 TU - 11 - 040 569.37 2331.18 2176587.53 619241.11 TU - 11 - 041 639.26 2271.17 2175915.65 618244.68 TU - 11 - 042 407.82 2379.15 2176678.66 619311.04 TU - 11 - 043 276.76 2302.84 2176535.30 619100.90 TU - 11 - 044 480.36 2230.60 2175575.38 618791.29 TU - 11 - 045 301.14 2331.18 2176587.53 619241.11 TU - 11 - 046 243.23 2267.32 2176320.10 619161.37 TU - 11 - 047 365.15 2252.80 2176140.30 618916.80 TU - 11 - 048 465.12 2414.68 2175947.99 619091.07 TU - 11 - 049 304.19 2268.44 2176319.31 619164.04 TU - 11 - 050 316.38 2252.22 2176144.40 618914.70 TU - 11 - 051 167.03 2257.54 2176252.37 619091.27 TU - 11 - 052 410.87 2247.57 2176122.61 618863.70 TU - 11 - 053 471.22 2394.97 2176028.18 619040.03 TU - 11 - 054 231.04 2255.82 2176227.51 619052.21 TU - 11 - 055 392.58 2249.24 2176092.90 618829.90 TU - 11 - 056 480.97 2248.07 2176043.89 618806.97 TU - 11 - 057 187.76 2391.42 2176028.70 619082.10 TU - 11 - 058 701.34 2375.30 2175834.90 618979.23 TU - 11 - 059 176.17 2244.51 2175983.00 618758.23 TU - 11 - 060 420.01 2245.82 2175929.00 618743.77 TU - 11 - 061 292.00 2244.51 2175983.00 618758.23 TU - 11 - 062 432.21 2239.26 2175650.00 618795.80 TU - 11 - 063 285.90 2266.08 2175888.24 618782.92 TU - 11 - 064 420.01 2246.83 2175860.52 618754.18 TU - 11 - 065 Ixtaca - S - K 1300 Technical Report Summary Page 316 of 326
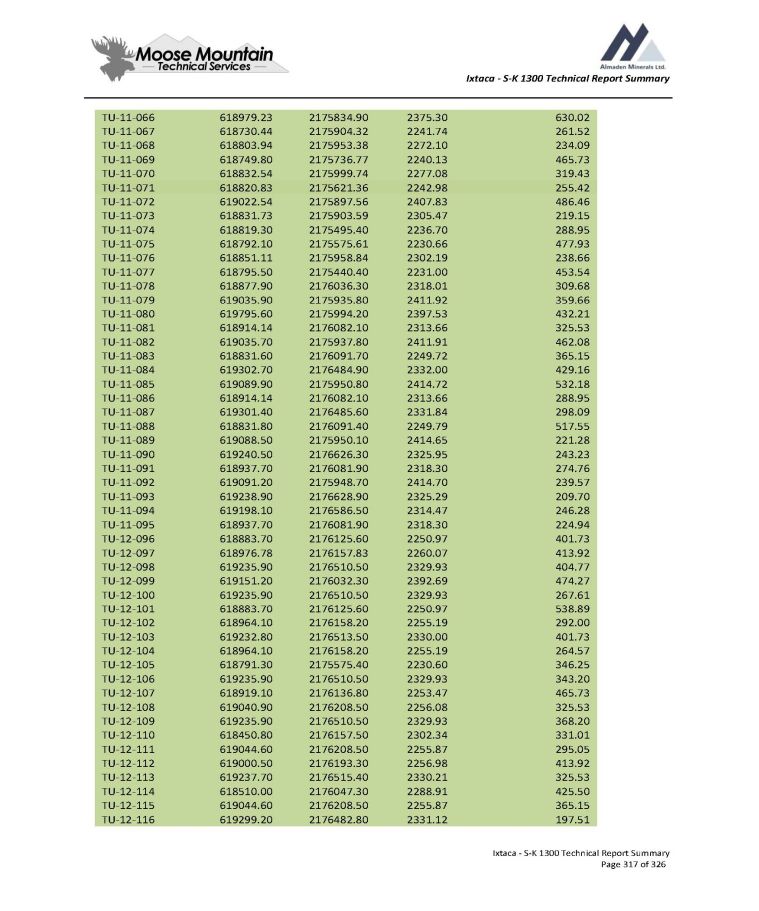
Ixtaca - S - K 1300 Technical Report Summary 630.02 2375.30 2175834.90 618979.23 TU - 11 - 066 261.52 2241.74 2175904.32 618730.44 TU - 11 - 067 234.09 2272.10 2175953.38 618803.94 TU - 11 - 068 465.73 2240.13 2175736.77 618749.80 TU - 11 - 069 319.43 2277.08 2175999.74 618832.54 TU - 11 - 070 255.42 2242.98 2175621.36 618820.83 TU - 11 - 071 486.46 2407.83 2175897.56 619022.54 TU - 11 - 072 219.15 2305.47 2175903.59 618831.73 TU - 11 - 073 288.95 2236.70 2175495.40 618819.30 TU - 11 - 074 477.93 2230.66 2175575.61 618792.10 TU - 11 - 075 238.66 2302.19 2175958.84 618851.11 TU - 11 - 076 453.54 2231.00 2175440.40 618795.50 TU - 11 - 077 309.68 2318.01 2176036.30 618877.90 TU - 11 - 078 359.66 2411.92 2175935.80 619035.90 TU - 11 - 079 432.21 2397.53 2175994.20 619795.60 TU - 11 - 080 325.53 2313.66 2176082.10 618914.14 TU - 11 - 081 462.08 2411.91 2175937.80 619035.70 TU - 11 - 082 365.15 2249.72 2176091.70 618831.60 TU - 11 - 083 429.16 2332.00 2176484.90 619302.70 TU - 11 - 084 532.18 2414.72 2175950.80 619089.90 TU - 11 - 085 288.95 2313.66 2176082.10 618914.14 TU - 11 - 086 298.09 2331.84 2176485.60 619301.40 TU - 11 - 087 517.55 2249.79 2176091.40 618831.80 TU - 11 - 088 221.28 2414.65 2175950.10 619088.50 TU - 11 - 089 243.23 2325.95 2176626.30 619240.50 TU - 11 - 090 274.76 2318.30 2176081.90 618937.70 TU - 11 - 091 239.57 2414.70 2175948.70 619091.20 TU - 11 - 092 209.70 2325.29 2176628.90 619238.90 TU - 11 - 093 246.28 2314.47 2176586.50 619198.10 TU - 11 - 094 224.94 2318.30 2176081.90 618937.70 TU - 11 - 095 401.73 2250.97 2176125.60 618883.70 TU - 12 - 096 413.92 2260.07 2176157.83 618976.78 TU - 12 - 097 404.77 2329.93 2176510.50 619235.90 TU - 12 - 098 474.27 2392.69 2176032.30 619151.20 TU - 12 - 099 267.61 2329.93 2176510.50 619235.90 TU - 12 - 100 538.89 2250.97 2176125.60 618883.70 TU - 12 - 101 292.00 2255.19 2176158.20 618964.10 TU - 12 - 102 401.73 2330.00 2176513.50 619232.80 TU - 12 - 103 264.57 2255.19 2176158.20 618964.10 TU - 12 - 104 346.25 2230.60 2175575.40 618791.30 TU - 12 - 105 343.20 2329.93 2176510.50 619235.90 TU - 12 - 106 465.73 2253.47 2176136.80 618919.10 TU - 12 - 107 325.53 2256.08 2176208.50 619040.90 TU - 12 - 108 368.20 2329.93 2176510.50 619235.90 TU - 12 - 109 331.01 2302.34 2176157.50 618450.80 TU - 12 - 110 295.05 2255.87 2176208.50 619044.60 TU - 12 - 111 413.92 2256.98 2176193.30 619000.50 TU - 12 - 112 325.53 2330.21 2176515.40 619237.70 TU - 12 - 113 425.50 2288.91 2176047.30 618510.00 TU - 12 - 114 365.15 2255.87 2176208.50 619044.60 TU - 12 - 115 197.51 2331.12 2176482.80 619299.20 TU - 12 - 116 Ixtaca - S - K 1300 Technical Report Summary Page 317 of 326
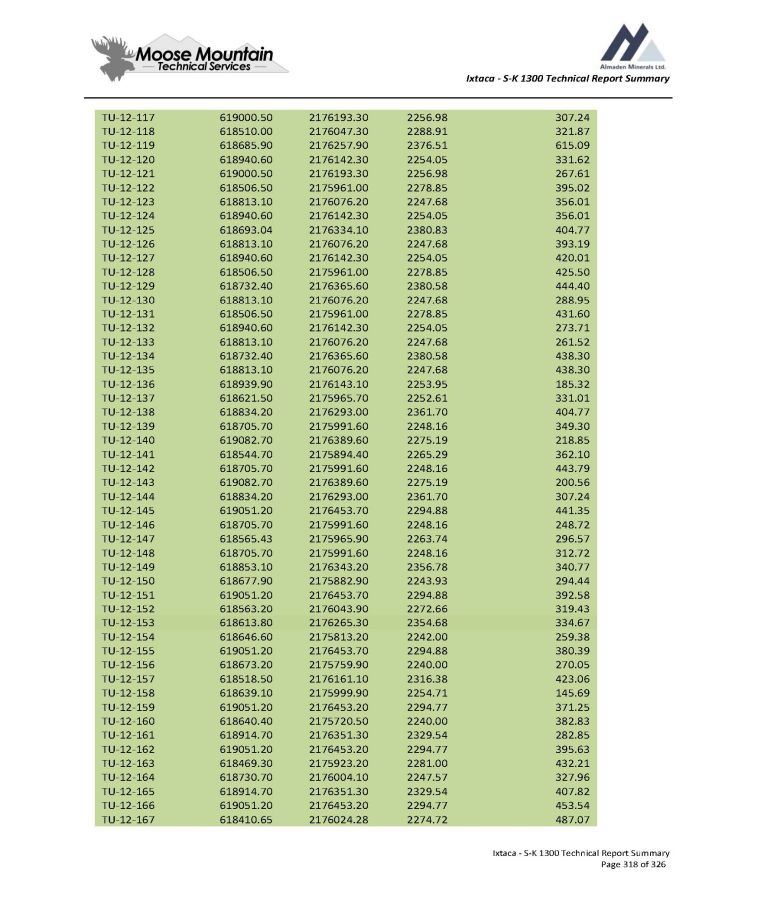
Ixtaca - S - K 1300 Technical Report Summary 307.24 2256.98 2176193.30 619000.50 TU - 12 - 117 321.87 2288.91 2176047.30 618510.00 TU - 12 - 118 615.09 2376.51 2176257.90 618685.90 TU - 12 - 119 331.62 2254.05 2176142.30 618940.60 TU - 12 - 120 267.61 2256.98 2176193.30 619000.50 TU - 12 - 121 395.02 2278.85 2175961.00 618506.50 TU - 12 - 122 356.01 2247.68 2176076.20 618813.10 TU - 12 - 123 356.01 2254.05 2176142.30 618940.60 TU - 12 - 124 404.77 2380.83 2176334.10 618693.04 TU - 12 - 125 393.19 2247.68 2176076.20 618813.10 TU - 12 - 126 420.01 2254.05 2176142.30 618940.60 TU - 12 - 127 425.50 2278.85 2175961.00 618506.50 TU - 12 - 128 444.40 2380.58 2176365.60 618732.40 TU - 12 - 129 288.95 2247.68 2176076.20 618813.10 TU - 12 - 130 431.60 2278.85 2175961.00 618506.50 TU - 12 - 131 273.71 2254.05 2176142.30 618940.60 TU - 12 - 132 261.52 2247.68 2176076.20 618813.10 TU - 12 - 133 438.30 2380.58 2176365.60 618732.40 TU - 12 - 134 438.30 2247.68 2176076.20 618813.10 TU - 12 - 135 185.32 2253.95 2176143.10 618939.90 TU - 12 - 136 331.01 2252.61 2175965.70 618621.50 TU - 12 - 137 404.77 2361.70 2176293.00 618834.20 TU - 12 - 138 349.30 2248.16 2175991.60 618705.70 TU - 12 - 139 218.85 2275.19 2176389.60 619082.70 TU - 12 - 140 362.10 2265.29 2175894.40 618544.70 TU - 12 - 141 443.79 2248.16 2175991.60 618705.70 TU - 12 - 142 200.56 2275.19 2176389.60 619082.70 TU - 12 - 143 307.24 2361.70 2176293.00 618834.20 TU - 12 - 144 441.35 2294.88 2176453.70 619051.20 TU - 12 - 145 248.72 2248.16 2175991.60 618705.70 TU - 12 - 146 296.57 2263.74 2175965.90 618565.43 TU - 12 - 147 312.72 2248.16 2175991.60 618705.70 TU - 12 - 148 340.77 2356.78 2176343.20 618853.10 TU - 12 - 149 294.44 2243.93 2175882.90 618677.90 TU - 12 - 150 392.58 2294.88 2176453.70 619051.20 TU - 12 - 151 319.43 2272.66 2176043.90 618563.20 TU - 12 - 152 334.67 2354.68 2176265.30 618613.80 TU - 12 - 153 259.38 2242.00 2175813.20 618646.60 TU - 12 - 154 380.39 2294.88 2176453.70 619051.20 TU - 12 - 155 270.05 2240.00 2175759.90 618673.20 TU - 12 - 156 423.06 2316.38 2176161.10 618518.50 TU - 12 - 157 145.69 2254.71 2175999.90 618639.10 TU - 12 - 158 371.25 2294.77 2176453.20 619051.20 TU - 12 - 159 382.83 2240.00 2175720.50 618640.40 TU - 12 - 160 282.85 2329.54 2176351.30 618914.70 TU - 12 - 161 395.63 2294.77 2176453.20 619051.20 TU - 12 - 162 432.21 2281.00 2175923.20 618469.30 TU - 12 - 163 327.96 2247.57 2176004.10 618730.70 TU - 12 - 164 407.82 2329.54 2176351.30 618914.70 TU - 12 - 165 453.54 2294.77 2176453.20 619051.20 TU - 12 - 166 487.07 2274.72 2176024.28 618410.65 TU - 12 - 167 Ixtaca - S - K 1300 Technical Report Summary Page 318 of 326
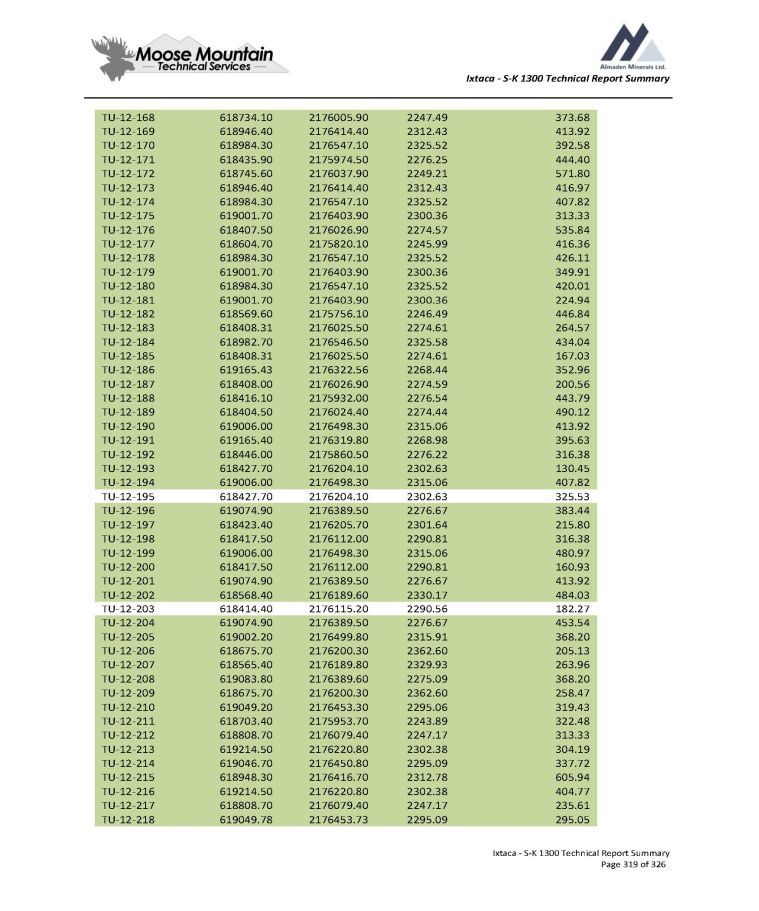
Ixtaca - S - K 1300 Technical Report Summary 373.68 2247.49 2176005.90 618734.10 TU - 12 - 168 413.92 2312.43 2176414.40 618946.40 TU - 12 - 169 392.58 2325.52 2176547.10 618984.30 TU - 12 - 170 444.40 2276.25 2175974.50 618435.90 TU - 12 - 171 571.80 2249.21 2176037.90 618745.60 TU - 12 - 172 416.97 2312.43 2176414.40 618946.40 TU - 12 - 173 407.82 2325.52 2176547.10 618984.30 TU - 12 - 174 313.33 2300.36 2176403.90 619001.70 TU - 12 - 175 535.84 2274.57 2176026.90 618407.50 TU - 12 - 176 416.36 2245.99 2175820.10 618604.70 TU - 12 - 177 426.11 2325.52 2176547.10 618984.30 TU - 12 - 178 349.91 2300.36 2176403.90 619001.70 TU - 12 - 179 420.01 2325.52 2176547.10 618984.30 TU - 12 - 180 224.94 2300.36 2176403.90 619001.70 TU - 12 - 181 446.84 2246.49 2175756.10 618569.60 TU - 12 - 182 264.57 2274.61 2176025.50 618408.31 TU - 12 - 183 434.04 2325.58 2176546.50 618982.70 TU - 12 - 184 167.03 2274.61 2176025.50 618408.31 TU - 12 - 185 352.96 2268.44 2176322.56 619165.43 TU - 12 - 186 200.56 2274.59 2176026.90 618408.00 TU - 12 - 187 443.79 2276.54 2175932.00 618416.10 TU - 12 - 188 490.12 2274.44 2176024.40 618404.50 TU - 12 - 189 413.92 2315.06 2176498.30 619006.00 TU - 12 - 190 395.63 2268.98 2176319.80 619165.40 TU - 12 - 191 316.38 2276.22 2175860.50 618446.00 TU - 12 - 192 130.45 2302.63 2176204.10 618427.70 TU - 12 - 193 407.82 2315.06 2176498.30 619006.00 TU - 12 - 194 325.53 2302.63 2176204.10 618427.70 TU - 12 - 195 383.44 2276.67 2176389.50 619074.90 TU - 12 - 196 215.80 2301.64 2176205.70 618423.40 TU - 12 - 197 316.38 2290.81 2176112.00 618417.50 TU - 12 - 198 480.97 2315.06 2176498.30 619006.00 TU - 12 - 199 160.93 2290.81 2176112.00 618417.50 TU - 12 - 200 413.92 2276.67 2176389.50 619074.90 TU - 12 - 201 484.03 2330.17 2176189.60 618568.40 TU - 12 - 202 182.27 2290.56 2176115.20 618414.40 TU - 12 - 203 453.54 2276.67 2176389.50 619074.90 TU - 12 - 204 368.20 2315.91 2176499.80 619002.20 TU - 12 - 205 205.13 2362.60 2176200.30 618675.70 TU - 12 - 206 263.96 2329.93 2176189.80 618565.40 TU - 12 - 207 368.20 2275.09 2176389.60 619083.80 TU - 12 - 208 258.47 2362.60 2176200.30 618675.70 TU - 12 - 209 319.43 2295.06 2176453.30 619049.20 TU - 12 - 210 322.48 2243.89 2175953.70 618703.40 TU - 12 - 211 313.33 2247.17 2176079.40 618808.70 TU - 12 - 212 304.19 2302.38 2176220.80 619214.50 TU - 12 - 213 337.72 2295.09 2176450.80 619046.70 TU - 12 - 214 605.94 2312.78 2176416.70 618948.30 TU - 12 - 215 404.77 2302.38 2176220.80 619214.50 TU - 12 - 216 235.61 2247.17 2176079.40 618808.70 TU - 12 - 217 295.05 2295.09 2176453.73 619049.78 TU - 12 - 218 Ixtaca - S - K 1300 Technical Report Summary Page 319 of 326

Ixtaca - S - K 1300 Technical Report Summary 203.61 2302.02 2176220.30 619211.60 TU - 12 - 219 282.85 2302.02 2176220.30 619211.60 TU - 12 - 220 548.03 2312.78 2176416.70 618948.30 TU - 12 - 221 200.56 2306.80 2176274.20 619243.40 TU - 12 - 222 377.34 2339.80 2176588.20 618943.70 TU - 12 - 223 371.25 2306.80 2176274.20 619243.40 TU - 12 - 224 176.17 2306.18 2176281.30 619240.90 TU - 12 - 225 590.70 2284.93 2176362.00 619033.90 TU - 12 - 226 197.51 2306.18 2176281.30 619240.90 TU - 12 - 227 398.68 2339.80 2176588.20 618943.70 TU - 12 - 228 420.01 2307.03 2176279.70 619243.70 TU - 12 - 229 477.93 2339.80 2176588.20 618943.70 TU - 12 - 230 209.70 2338.44 2176093.20 619295.40 TU - 12 - 231 416.97 2307.03 2176279.70 619243.70 TU - 12 - 232 264.57 2338.44 2176093.20 619295.40 TU - 12 - 233 154.84 2323.09 2176314.26 619280.30 TU - 12 - 234 499.26 2344.89 2176653.80 618899.10 TU - 12 - 235 252.37 2345.02 2176045.20 619393.90 TU - 12 - 236 279.81 2323.09 2176314.26 619280.30 TU - 12 - 237 313.33 2345.02 2176045.20 619393.90 TU - 12 - 238 145.69 2323.47 2176317.79 619278.54 TU - 12 - 239 316.38 2345.42 2176041.50 619395.80 TU - 12 - 240 203.61 2323.47 2176317.79 619278.54 TU - 12 - 241 237.13 2345.42 2176041.50 619395.80 TU - 12 - 242 218.85 2323.54 2176316.64 619280.01 TU - 12 - 243 413.92 2344.89 2176653.80 618899.10 TU - 12 - 244 221.89 2336.64 2176097.11 619292.50 TU - 12 - 245 325.53 2264.59 2176271.90 619132.90 TU - 12 - 246 148.74 2336.64 2176097.11 619292.50 TU - 12 - 247 508.41 2245.51 2175819.30 618609.90 TU - 13 - 248 343.81 2256.46 2176207.80 619005.20 TU - 13 - 249 267.61 2360.98 2176562.90 619343.10 TU - 13 - 250 392.58 2256.46 2176207.80 619005.20 TU - 13 - 251 319.43 2360.98 2176562.90 619343.10 TU - 13 - 252 159.41 2245.51 2175819.30 618609.90 TU - 13 - 253 413.92 2273.00 2176352.10 619092.50 TU - 13 - 254 237.13 2360.98 2176562.90 619343.10 TU - 13 - 255 441.35 2281.00 2175939.60 618490.60 TU - 13 - 256 383.44 2273.00 2176352.10 619092.50 TU - 13 - 257 325.53 2359.28 2176565.00 619338.60 TU - 13 - 258 426.11 2273.00 2176352.10 619092.50 TU - 13 - 259 468.78 2281.00 2175939.60 618490.60 TU - 13 - 260 257.56 2334.98 2176541.10 619294.10 TU - 13 - 261 444.40 2318.30 2176480.60 618927.30 TU - 13 - 262 334.98 2334.98 2176541.10 619294.10 TU - 13 - 263 425.20 2345.02 2176045.20 619393.90 TU - 13 - 264 593.75 2318.30 2176480.60 618927.30 TU - 13 - 265 322.48 2334.98 2176541.10 619294.10 TU - 13 - 266 234.09 2325.29 2176127.50 619212.10 TU - 13 - 267 377.34 2338.83 2176598.90 619269.80 TU - 13 - 268 261.52 2328.32 2176122.60 619213.20 TU - 13 - 269 Ixtaca - S - K 1300 Technical Report Summary Page 320 of 326
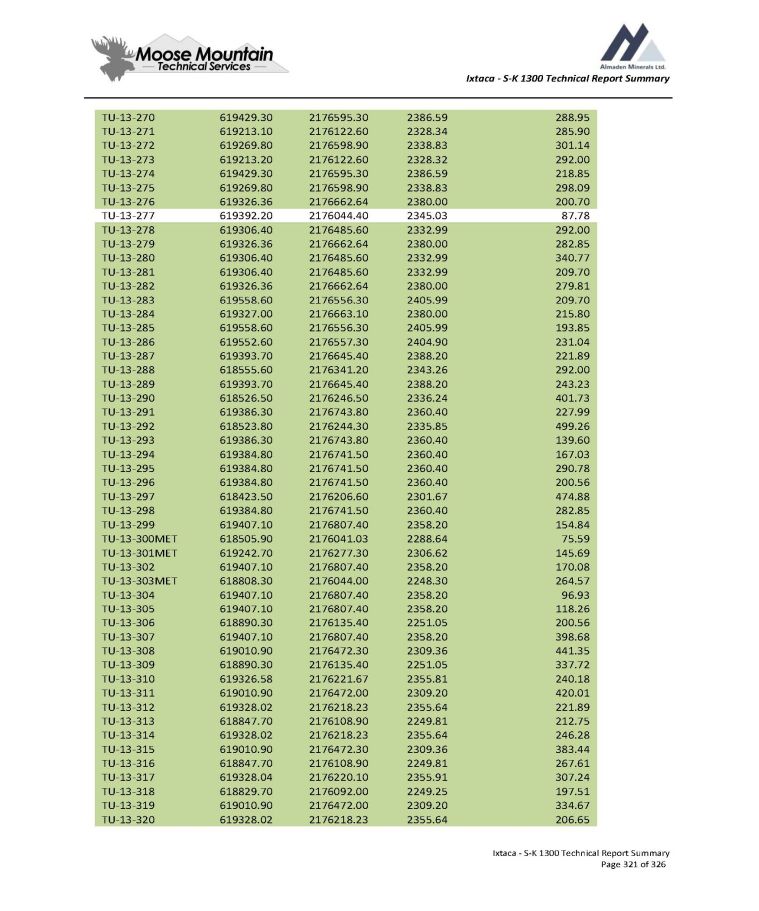
Ixtaca - S - K 1300 Technical Report Summary 288.95 2386.59 2176595.30 619429.30 TU - 13 - 270 285.90 2328.34 2176122.60 619213.10 TU - 13 - 271 301.14 2338.83 2176598.90 619269.80 TU - 13 - 272 292.00 2328.32 2176122.60 619213.20 TU - 13 - 273 218.85 2386.59 2176595.30 619429.30 TU - 13 - 274 298.09 2338.83 2176598.90 619269.80 TU - 13 - 275 200.70 2380.00 2176662.64 619326.36 TU - 13 - 276 87.78 2345.03 2176044.40 619392.20 TU - 13 - 277 292.00 2332.99 2176485.60 619306.40 TU - 13 - 278 282.85 2380.00 2176662.64 619326.36 TU - 13 - 279 340.77 2332.99 2176485.60 619306.40 TU - 13 - 280 209.70 2332.99 2176485.60 619306.40 TU - 13 - 281 279.81 2380.00 2176662.64 619326.36 TU - 13 - 282 209.70 2405.99 2176556.30 619558.60 TU - 13 - 283 215.80 2380.00 2176663.10 619327.00 TU - 13 - 284 193.85 2405.99 2176556.30 619558.60 TU - 13 - 285 231.04 2404.90 2176557.30 619552.60 TU - 13 - 286 221.89 2388.20 2176645.40 619393.70 TU - 13 - 287 292.00 2343.26 2176341.20 618555.60 TU - 13 - 288 243.23 2388.20 2176645.40 619393.70 TU - 13 - 289 401.73 2336.24 2176246.50 618526.50 TU - 13 - 290 227.99 2360.40 2176743.80 619386.30 TU - 13 - 291 499.26 2335.85 2176244.30 618523.80 TU - 13 - 292 139.60 2360.40 2176743.80 619386.30 TU - 13 - 293 167.03 2360.40 2176741.50 619384.80 TU - 13 - 294 290.78 2360.40 2176741.50 619384.80 TU - 13 - 295 200.56 2360.40 2176741.50 619384.80 TU - 13 - 296 474.88 2301.67 2176206.60 618423.50 TU - 13 - 297 282.85 2360.40 2176741.50 619384.80 TU - 13 - 298 154.84 2358.20 2176807.40 619407.10 TU - 13 - 299 75.59 2288.64 2176041.03 618505.90 TU - 13 - 300MET 145.69 2306.62 2176277.30 619242.70 TU - 13 - 301MET 170.08 2358.20 2176807.40 619407.10 TU - 13 - 302 264.57 2248.30 2176044.00 618808.30 TU - 13 - 303MET 96.93 2358.20 2176807.40 619407.10 TU - 13 - 304 118.26 2358.20 2176807.40 619407.10 TU - 13 - 305 200.56 2251.05 2176135.40 618890.30 TU - 13 - 306 398.68 2358.20 2176807.40 619407.10 TU - 13 - 307 441.35 2309.36 2176472.30 619010.90 TU - 13 - 308 337.72 2251.05 2176135.40 618890.30 TU - 13 - 309 240.18 2355.81 2176221.67 619326.58 TU - 13 - 310 420.01 2309.20 2176472.00 619010.90 TU - 13 - 311 221.89 2355.64 2176218.23 619328.02 TU - 13 - 312 212.75 2249.81 2176108.90 618847.70 TU - 13 - 313 246.28 2355.64 2176218.23 619328.02 TU - 13 - 314 383.44 2309.36 2176472.30 619010.90 TU - 13 - 315 267.61 2249.81 2176108.90 618847.70 TU - 13 - 316 307.24 2355.91 2176220.10 619328.04 TU - 13 - 317 197.51 2249.25 2176092.00 618829.70 TU - 13 - 318 334.67 2309.20 2176472.00 619010.90 TU - 13 - 319 206.65 2355.64 2176218.23 619328.02 TU - 13 - 320 Ixtaca - S - K 1300 Technical Report Summary Page 321 of 326
Ixtaca - S - K 1300 Technical Report Summary 227.99 2252.37 2176142.43 618911.97 TU - 13 - 321 191.41 2357.41 2176311.50 619338.50 TU - 13 - 322 377.34 2314.77 2176499.40 619006.80 TU - 13 - 323MET 218.85 2254.00 2176147.00 618950.00 TU - 13 - 324 243.23 2254.00 2176147.00 618950.00 TU - 13 - 325 209.70 2357.41 2176311.50 619338.50 TU - 13 - 326 185.32 2357.41 2176311.50 619338.50 TU - 13 - 327 374.29 2322.36 2176522.90 618982.60 TU - 13 - 328 209.70 2357.41 2176311.50 619338.50 TU - 13 - 329 234.09 2256.37 2176187.20 618982.30 TU - 13 - 330 197.51 2385.68 2176281.00 619387.90 TU - 13 - 331 356.01 2322.36 2176522.90 618982.60 TU - 13 - 332 267.61 2256.37 2176187.20 618982.30 TU - 13 - 333 224.94 2385.68 2176281.00 619387.90 TU - 13 - 334 231.04 2385.68 2176281.00 619387.90 TU - 13 - 335 368.20 2322.36 2176522.90 618982.60 TU - 13 - 336 200.56 2257.78 2176205.90 619019.90 TU - 13 - 337 234.09 2385.68 2176281.00 619387.90 TU - 13 - 338 246.28 2257.78 2176205.90 619019.90 TU - 13 - 339 60.35 2355.91 2176220.10 619328.04 TU - 13 - 340MET 151.79 2355.79 2176221.50 619326.60 TU - 13 - 341MET 371.25 2286.13 2176426.30 619059.40 TU - 13 - 342 231.04 2257.78 2176205.90 619019.90 TU - 13 - 343 243.23 2391.26 2176029.75 619083.42 TU - 13 - 344 206.65 2406.91 2176341.60 619408.90 TU - 13 - 345 227.99 2257.78 2176205.90 619019.90 TU - 13 - 346 365.15 2286.13 2176426.30 619059.40 TU - 13 - 347 215.80 2406.91 2176341.60 619408.90 TU - 13 - 348 259.69 2392.53 2176035.00 619134.70 TU - 13 - 349 276.76 2406.91 2176341.60 619408.90 TU - 13 - 350 279.81 2245.15 2176041.40 618771.70 TU - 13 - 351 346.86 2286.13 2176426.30 619059.40 TU - 13 - 352 199.64 2392.53 2176035.00 619134.70 TU - 13 - 353 313.33 2245.15 2176041.40 618771.70 TU - 13 - 354 349.00 2286.13 2176426.30 619059.40 TU - 13 - 355 255.42 2406.91 2176341.60 619408.90 TU - 13 - 356 310.29 2392.53 2176035.00 619134.70 TU - 13 - 357 313.33 2406.91 2176341.60 619408.90 TU - 13 - 358 200.56 2245.15 2176041.40 618771.70 TU - 13 - 359 279.81 2302.25 2176389.60 618982.90 TU - 13 - 360 298.09 2392.53 2176035.00 619134.70 TU - 13 - 361 246.28 2245.15 2176041.40 618771.70 TU - 13 - 362 212.75 2419.38 2176366.00 619456.80 TU - 13 - 363 252.37 2302.25 2176389.60 618982.90 TU - 13 - 364 243.23 2419.70 2176362.50 619457.90 TU - 13 - 365 157.58 2245.15 2176041.40 618771.70 TU - 13 - 366 322.48 2302.25 2176389.60 618982.90 TU - 13 - 367 322.48 2392.22 2176027.40 619194.10 TU - 13 - 368 362.10 2419.65 2176364.30 619457.90 TU - 13 - 369 342.29 2249.65 2176022.90 618801.10 TU - 13 - 370 346.86 2322.98 2176381.20 618918.70 TU - 13 - 371 Ixtaca - S - K 1300 Technical Report Summary Page 322 of 326

Ixtaca - S - K 1300 Technical Report Summary 288.95 2392.22 2176027.40 619194.10 TU - 13 - 372 319.43 2249.24 2176024.30 618801.00 TU - 13 - 373MET 270.66 2445.26 2176432.70 619562.90 TU - 13 - 374 258.47 2255.19 2176158.20 618964.10 TU - 13 - 375 447.45 2396.69 2175862.20 619059.20 TU - 13 - 376 316.38 2445.26 2176432.70 619562.90 TU - 13 - 377 212.75 2249.24 2176024.30 618801.00 TU - 13 - 378 151.79 2255.19 2176158.20 618964.10 TU - 13 - 379 234.09 2244.79 2175981.43 618760.35 TU - 13 - 380 182.27 2242.82 2175921.90 618698.00 TU - 13 - 381 170.08 2327.64 2176491.06 619264.17 TU - 13 - 382 151.79 2242.82 2175921.90 618698.00 TU - 13 - 383 151.79 2244.84 2175980.78 618760.80 TU - 13 - 384 285.90 2327.99 2176493.20 619261.40 TU - 13 - 385 163.98 2239.67 2175849.70 618735.40 TU - 13 - 386 298.09 2249.29 2175991.00 618778.70 TU - 13 - 387 420.01 2390.29 2175832.30 619116.80 TU - 13 - 388 151.79 2247.13 2175859.30 618755.40 TU - 13 - 389 252.37 2330.64 2176543.40 619226.40 TU - 13 - 390 142.65 2247.13 2175859.30 618755.40 TU - 13 - 391 188.37 2249.29 2175991.00 618778.70 TU - 13 - 392 204.52 2241.88 2175905.00 618731.20 TU - 13 - 393 234.09 2330.64 2176543.30 619226.40 TU - 13 - 394 234.09 2246.18 2175926.10 618746.10 TU - 13 - 395 206.65 2330.64 2176543.30 619226.40 TU - 13 - 396MET 386.49 2240.19 2175732.88 618644.05 TU - 13 - 397 383.44 2266.19 2175897.50 618542.10 TU - 13 - 398 261.52 2425.08 2175939.50 619148.90 TU - 13 - 399 240.18 2314.56 2176586.10 619198.10 TU - 13 - 400 243.23 2314.56 2176586.10 619198.10 TU - 13 - 401 401.73 2274.64 2176028.57 618409.17 TU - 13 - 402 608.99 2363.00 2176836.90 618833.60 TU - 13 - 403 270.66 2314.56 2176586.20 619198.20 TU - 13 - 404 252.37 2328.01 2176123.00 619214.15 TU - 13 - 405 197.51 2392.64 2176033.00 619149.20 TU - 13 - 406 369.72 2312.34 2175488.90 619196.60 TU - 13 - 407 426.11 2362.78 2176833.20 618834.70 TU - 13 - 408 246.28 2392.64 2176033.00 619149.20 TU - 13 - 409 288.95 2328.01 2176123.00 619214.15 TU - 13 - 410 224.94 2391.19 2176030.50 619084.10 TU - 13 - 411 325.53 2312.34 2175486.90 619199.10 TU - 13 - 412 334.67 2284.68 2176422.70 619058.35 TU - 14 - 413 343.81 2284.68 2176422.70 619058.35 TU - 14 - 414 322.48 2295.21 2176455.30 619050.94 TU - 14 - 415 209.70 2379.14 2176680.90 619313.75 TU - 14 - 416 200.56 2379.14 2176680.90 619313.75 TU - 14 - 417 304.19 2327.33 2176489.60 619261.88 TU - 14 - 418 218.85 2338.26 2176598.00 619268.19 TU - 14 - 419 231.04 2338.26 2176598.00 619268.19 TU - 14 - 420 182.27 2330.74 2176542.50 619228.24 TU - 14 - 421 276.76 2249.30 2176022.90 618800.48 TU - 14 - 422 Ixtaca - S - K 1300 Technical Report Summary Page 323 of 326
Ixtaca - S - K 1300 Technical Report Summary 156.67 2306.97 2176278.60 619244.17 TU - 14 - 423 493.17 2344.91 2176045.50 619392.60 TU - 14 - 424 310.29 2243.40 2175618.40 618824.70 TU - 14 - 425 501.70 2370.63 2175866.80 619448.70 TU - 14 - 426 252.37 2244.28 2175570.30 618841.90 TU - 14 - 427 255.42 2244.12 2175700.90 618795.00 TU - 14 - 428 501.70 2367.54 2175773.00 619214.00 TU - 14 - 429 349.91 2386.08 2176612.80 618485.00 TU - 14 - 430 349.91 2386.00 2176612.50 618483.70 TU - 14 - 431 294.44 2367.46 2175771.30 619212.10 TU - 14 - 432 502.31 2322.67 2175570.00 619126.50 TU - 14 - 433 252.37 2386.08 2176609.70 618489.80 TU - 14 - 434 322.48 2386.08 2176609.70 618489.80 TU - 14 - 435 544.98 2390.72 2175937.70 619740.20 TU - 14 - 436 543.00 2463.56 2177254.10 619002.50 TU - 14 - 437 453.54 2425.48 2175936.60 619150.40 TU - 14 - 438 520.60 2456.64 2177139.10 619077.70 TU - 14 - 439 310.29 2324.16 2175488.20 619413.10 TU - 14 - 440 351.13 2507.18 2176936.90 620322.30 TU - 14 - 441 349.91 2456.64 2177139.10 619077.70 TU - 14 - 442 154.23 2456.26 2177137.40 619076.10 TU - 14 - 443 310.29 2507.18 2176936.90 620322.30 TU - 14 - 444 395.63 2397.96 2176518.60 618662.30 TU - 14 - 445 551.08 2390.00 2176398.60 618665.20 TU - 14 - 446 279.81 2383.64 2176006.00 619263.96 TU - 14 - 447 346.86 2390.74 2175888.90 619715.20 TU - 14 - 448 328.57 2395.64 2176820.38 619082.76 TU - 14 - 449 266.70 2351.65 2176655.55 619125.32 TU - 15 - 450 274.62 2351.18 2176655.65 619124.00 TU - 15 - 451 234.09 2368.23 2176709.10 619120.11 TU - 15 - 452 301.14 2368.23 2176709.11 619120.12 TU - 15 - 453 418.89 2238.78 2175499.34 618522.43 TU - 15 - 454 316.38 2249.30 2176022.90 618800.48 TU - 15 - 455 231.04 2330.64 2176543.30 619226.40 TU - 15 - 456 261.52 2249.30 2176022.90 618800.48 TU - 15 - 457 243.23 2330.64 2176543.30 619226.40 TU - 15 - 458 179.22 2306.97 2176278.60 619244.17 TU - 15 - 459 282.85 2247.70 2176076.15 618813.24 TU - 15 - 460 151.79 2306.97 2176278.60 619244.17 TU - 15 - 461 371.25 2249.33 2176092.04 618830.12 TU - 16 - 318A 304.19 2249.48 2176092.86 618830.96 TU - 16 - 462 505.36 2249.67 2176091.92 618831.49 TU - 16 - 463 313.33 2249.27 2176092.77 618830.06 TU - 16 - 464 365.15 2249.23 2176092.44 618829.84 TU - 16 - 465 398.68 2248.41 2175993.78 618702.17 TU - 16 - 466 389.53 2251.00 2176133.89 618888.88 TU - 16 - 467 298.09 2251.00 2176133.89 618888.88 TU - 16 - 468 362.10 2251.00 2176133.89 618888.88 TU - 16 - 469 285.90 2251.00 2176133.89 618888.88 TU - 16 - 470 346.86 2249.92 2176022.00 618801.00 TU - 16 - 471 322.48 2251.00 2176133.89 618888.88 TU - 16 - 472 Ixtaca - S - K 1300 Technical Report Summary Page 324 of 326
Ixtaca - S - K 1300 Technical Report Summary 320.34 2249.92 2176022.00 618801.00 TU - 16 - 473 325.53 2249.92 2176022.00 618801.00 TU - 16 - 474 325.53 2252.80 2176140.30 618916.80 TU - 16 - 475 313.94 2252.26 2176144.01 618914.38 TU - 16 - 476 313.33 2246.74 2176077.89 618803.13 TU - 16 - 477 301.95 2253.96 2176143.07 618940.24 TU - 16 - 478 331.62 2246.74 2176077.89 618803.13 TU - 16 - 479 307.24 2253.96 2176143.07 618940.24 TU - 16 - 480 325.53 2246.74 2176077.89 618803.13 TU - 16 - 481 307.24 2255.25 2176158.12 618964.30 TU - 16 - 482 295.05 2250.40 2176099.36 618838.47 TU - 16 - 483 273.71 2256.38 2176187.10 618982.30 TU - 16 - 484 277.37 2250.40 2176099.36 618838.47 TU - 16 - 485 273.71 2256.38 2176187.10 618982.30 TU - 16 - 486 307.24 2250.97 2176125.60 618883.70 TU - 16 - 487 331.62 2256.38 2176187.10 618982.30 TU - 16 - 488 240.18 2250.72 2176125.79 618880.88 TU - 16 - 489 270.66 2256.63 2176185.09 618984.02 TU - 16 - 490 292.00 2250.72 2176125.79 618880.88 TU - 16 - 491 295.05 2256.65 2176203.54 619003.57 TU - 16 - 492 221.89 2257.16 2176210.23 619018.60 TU - 16 - 493 560.22 2380.90 2176334.38 618693.03 TU - 17 - 125A 557.17 2380.17 2176363.28 618731.30 TU - 17 - 129A 523.65 2356.86 2176344.65 618852.97 TU - 17 - 149A 267.61 2257.15 2176210.36 619018.62 TU - 17 - 494 508.41 2376.92 2176260.64 618687.30 TU - 17 - 495 215.80 2257.15 2176210.36 619018.62 TU - 17 - 496 322.48 2257.15 2176210.36 619018.62 TU - 17 - 497 179.22 2256.96 2176207.11 619041.22 TU - 17 - 498 502.31 2380.90 2176334.38 618693.03 TU - 17 - 499 26.82 2257.07 2176206.49 619042.49 TU - 17 - 500 145.39 2267.80 2175860.18 618098.27 TU - 17 - 501 499.26 2300.98 2176059.42 617946.75 TU - 17 - 502 465.73 2300.98 2176059.42 617946.75 TU - 17 - 503 465.73 2373.58 2176338.56 618794.84 TU - 17 - 504 154.84 2301.10 2176063.24 617947.60 TU - 17 - 505 292.00 2443.97 2175118.94 617210.55 TU - 17 - 506 395.63 2443.97 2175118.94 617210.55 TU - 17 - 507 529.74 2356.88 2176344.00 618852.90 TU - 17 - 508 173.13 2246.10 2175925.10 618746.00 TU - 17 - 509 434.04 2248.94 2176032.51 618741.27 TU - 17 - 510 313.33 2250.72 2176125.80 618880.90 TU - 17 - 511 490.12 2279.40 2176128.70 618753.70 TU - 17 - 512 371.25 2250.72 2176125.80 618880.90 TU - 17 - 513 441.35 2279.40 2176128.70 618753.70 TU - 17 - 514 484.02 2348.00 2175651.52 619401.46 TU - 17 - 515 502.31 2359.50 2175739.21 619434.85 TU - 17 - 516 200.56 2373.58 2176338.56 618794.84 TU - 17 - 517 203.61 2373.58 2176338.56 618794.84 TU - 17 - 518 544.98 2382.00 2175833.15 619594.88 TU - 17 - 519 200.56 2370.26 2176349.00 618820.73 TU - 17 - 520 Ixtaca - S - K 1300 Technical Report Summary Page 325 of 326
Ixtaca - S - K 1300 Technical Report Summary 200.56 2370.26 2176349.00 618820.73 TU - 17 - 521 200.56 2370.26 2176349.00 618820.73 TU - 17 - 522 502.31 2230.58 2175447.54 618788.81 TU - 17 - 523 200.56 2370.26 2176349.00 618820.73 TU - 17 - 524 200.56 2356.90 2176344.00 618852.90 TU - 17 - 525 200.56 2356.90 2176344.00 618852.90 TU - 17 - 526 438.50 2348.29 2175579.46 619474.21 TU - 17 - 527 200.56 2356.90 2176344.00 618852.90 TU - 17 - 528 395.63 2318.91 2175458.92 619415.88 TU - 17 - 529 410.87 2439.55 2175017.39 616925.98 TU - 17 - 530 274.32 2439.55 2175017.39 616925.98 TU - 17 - 531 477.93 2309.28 2176471.73 619011.80 TU - 17 - 532 234.09 2439.55 2175017.39 616925.98 TU - 17 - 533 404.77 2439.47 2175016.20 616926.00 TU - 18 - 534 560.22 2309.28 2176471.73 619011.80 TU - 18 - 535 391.97 2439.47 2175016.00 616926.04 TU - 18 - 536 377.34 2314.65 2176499.87 619007.09 TU - 18 - 537 593.75 2419.43 2174997.40 616728.67 TU - 18 - 538 352.04 2419.43 2174997.40 616728.67 TU - 18 - 539 386.49 2249.26 2176022.90 618800.48 TU - 18 - 540 587.65 2418.76 2175372.25 616870.09 TU - 18 - 541 395.63 2418.76 2175372.25 616870.09 TU - 18 - 542 194.46 2313.4 2176286.34 619265.63 TU - 18 - 543 270.66 2313.4 2176286.34 619265.63 TU - 18 - 544 103.02 2313.4 2176286.34 619265.63 TU - 18 - 545 249.33 2306.54 2176274.2 619243.4 TU - 18 - 546 246.28 2300.16 2176282.68 619219.38 TU - 18 - 547 170.08 2300.16 2176282.68 619219.38 TU - 18 - 548 157.89 2300.16 2176282.68 619219.38 TU - 18 - 549 170.08 2300.16 2176282.68 619219.38 TU - 18 - 550 349.91 2360.11 2175374.70 616201.40 TZ - 12 - 001 377.34 2360.22 2175375.30 616200.50 TZ - 12 - 002 197.51 2301.44 2174967.40 616304.20 TZ - 12 - 003 200.56 2301.31 2174966.70 616303.30 TZ - 12 - 004 249.33 2301.49 2174967.90 616304.50 TZ - 12 - 005 490.12 2360.40 2175380.66 616202.30 TZ - 16 - 006 215.80 2238.59 2175698.20 618662.40 WW - 13 - 001 407.82 2246.76 2175920.60 618659.10 WW - 13 - 002 401.73 2273.00 2176350.90 619091.80 WW - 13 - 003 401.73 2255.22 2176148.12 618958.96 WW - 13 - 004 352.96 2222.02 2174984.20 618432.80 WW - 13 - 005 151.18 2234.55 2175398.30 618549.80 WW - 13 - 006 221.89 2225.47 2175210.60 618614.10 WW - 13 - 007 Ixtaca - S - K 1300 Technical Report Summary Page 326 of 326
Almaden Minerals (AMEX:AAU)
Graphique Historique de l'Action
De Mar 2024 à Avr 2024

Almaden Minerals (AMEX:AAU)
Graphique Historique de l'Action
De Avr 2023 à Avr 2024
