The Compensation Committee, appointed by the Board, annually reviews and evaluates the compensation of the Board, including the appropriate mix of cash and equity compensation. The Compensation Committee recommends changes in compensation to the Board for approval. In June 2021, the Compensation Committee engaged Pearl Meyer & Partners LLC (“Pearl Meyer”), an independent compensation consultant, to update the review of director compensation that was performed in June 2019. The peer group used for the director compensation review was the same peer group used for the 2021 review of President and CEO and CFO compensation, which is described on page 24 under “Compensation Benchmarking and Peer Group Analysis.” The review found that total director compensation, which includes cash and equity, was at the 67th percentile of the peer group. The cash component of director compensation was at the 61st percentile of the peer group. In addition, the review found that the total Board cost was at the 76th percentile. As a result of this review, upon the recommendation of the Compensation Committee, the Board approved certain increases to the Board’s compensation, effective January 1, 2022, January 1, 2023 and January 1, 2024, as discussed further below.
During 2023, non-employee members of the Corporation’s Board each received an annual retainer of $13,125. In addition, Ms. Kelley, as Chair of the Corporation’s Compensation Committee, received an additional retainer of $5,800, Mr. Peay, as Chair of the Corporation’s Audit Committee, received an additional annual retainer of $7,200 and Mr. Olsson, as Chair of the Nominating Committee, received an additional annual retainer of $4,200. The retainers are payable in quarterly installments. Each non-employee member of the Corporation’s Board also earned a single fee of $1,260 for attendance at monthly Board, Bank Board, Bank subsidiary board, and Nominating Committee meetings, as applicable. Additionally, each member of the Audit or Compensation Committee earned a fee of $600 for attendance at each meeting of the Audit or Compensation Committee.
In addition to cash compensation, non-employee members of the Board were eligible to participate in the 2022 Stock and Incentive Compensation Plan. Under the 2022 Stock and Incentive Compensation Plan, directors were eligible to receive awards of restricted stock units, stock options, stock appreciation rights, restricted stock and other stock-based awards. On April 18, 2023, each non-employee director was granted 500 shares of restricted stock, and the fair value of the restricted stock on the grant date was $55.13 per share. Subject to accelerated vesting under certain circumstances, these shares of restricted stock vest in their entirety on April 16, 2024.
Compensation of the non-employee members of the Board for 2024 remains generally the same as it was in 2023, except that the annual retainer for Board service increased to $13,650 from $13,125, the annual retainer for the Chair of the Audit Committee increased to $7,500 from $7,200, the annual retainer for the Chair of the Compensation Committee increased to $6,050 from $5,800, the annual retainer for the Chair of the Nominating Committee increased to $4,400 from $4,200, the monthly attendance fee for Board, Bank Board, Bank subsidiary board and Nominating Committee meetings increased to $1,300 from $1,260, and the attendance fee for Audit or Compensation Committee meetings increased to $625 from $600 per meeting.
Holding Period/Stock Ownership Guidelines. Once restricted stock awards vest, non-employee members of the Board may not sell more than 50 percent of the award until a minimum level of stock ownership is achieved. Each non-employee director is required to own shares of the Corporation’s stock having an aggregate value at least equal to three times the amount of the annual Board of Directors retainer paid for regular service on the Board. At January 2, 2024, each non-employee director held an amount of the Corporation’s stock (including restricted stock) that exceeded the minimum level of stock ownership.
Shareholder Communications with the Board
The Corporation provides a process for shareholders to send communications to the Board. Shareholders who wish to contact the Board or any of its members may do so by addressing their written correspondence to C&F Financial Corporation, Board of Directors, c/o Secretary, 3600 La Grange Parkway,
Prior to 2009, the Bank offered the Virginia Bankers Association Master Defined Benefit Pension Plan for Citizens & Farmers Bank, which was a traditional pension plan and was converted to the current cash balance pension plan effective December 31, 2008. Participants with balances in the Retirement Plan that were converted from the traditional pension plan, including Mr. Cherry, may be entitled to benefits greater than the interest credits calculated under the Retirement Plan, pursuant to IRS rules for tax-qualified retirement plans. Benefits pursuant to such rules may fluctuate from year to year, due in part to changes in interest rates.
401(k) Plan. The Bank offers the State Bankers Association Master Defined Contribution Plan for Citizens and Farmers Bank (the “401(k) Plan”) as a tax qualified defined contribution plan for employees of C&F Bank and C&F Finance. During 2023, the State Bankers Association Master Defined Contribution Plan for C&F Finance Company, formerly offered by C&F Finance for its employees, was merged into the 401(k) Plan. The merger of the plans did not substantially modify the benefits offered to employees of C&F Bank or C&F Finance. A separate defined contribution plan is offered by C&F Mortgage for its employees. Our NEOs are participants in the 401(k) Plan. Under the 401(k) Plan, the Corporation makes matching contributions on voluntary deferrals by NEOs of up to five percent of each participant’s covered compensation, subject to limitations under the plan and the requirements of the Code. The 401(k) Plan also provides for discretionary employer contributions. Investments under the 401(k) Plan are directed by participants’ elections from among various investment options available under the plan, and participants’ accounts earn a return based on the actual return of those investment elections.
Nonqualified Plan. The Corporation offers the C&F Financial Corporation Non-Qualified Deferred Compensation Plan for Directors and Executives (the “Nonqualified Plan”) for senior officers and directors of the Corporation and its subsidiaries. The plan allows executive officers to make deferrals of salary or cash incentive compensation. The Corporation makes discretionary supplemental retirement (“SERP”) contributions into executive officers’ accounts under the Nonqualified Plan. Participants’ accounts under the Nonqualified Plan earn a return based on investment elections made by participants among various investment options available under the plan.
For Messrs. Cherry and Dillon, the Corporation’s discretionary SERP contributions are vested immediately in recognition of their performance and service over their careers. For Messrs. Long, Crone and Seaman, the Corporation’s discretionary SERP contributions vest generally five years from the time of each contribution, subject to earlier vesting under certain conditions, including death, disability, retirement at or after attaining age 65 or a change in control. For 2023, the Corporation made discretionary SERP contributions to the Nonqualified Plan totaling $111,065, $33,700, $25,000, $37,250 and $12,400 for Messrs. Cherry, Long, Dillon, Crone and Seaman, respectively. These contributions were made in 2024 and are reported as earned in 2023 in the Summary Compensation Table on page 43.
Perquisites and Other Benefits. The Corporation provides our NEOs with benefits that we believe are reasonable and consistent with our overall compensation program as part of a competitive compensation package for attracting and retaining talented executives. Perquisites offered to NEOs, which may include personal use of Corporation-owned automobiles, matching charitable contributions, an executive physical exam every two years, club dues, financial advisory services, and tax preparation services, are common among the Corporation’s peer financial institutions. Effective January 1, 2015, the Committee approved an additional perquisite for Mr. Dillon that provides for post-retirement medical, prescription and dental benefits for Mr. Dillon and his spouse for life. Mr. Dillon is eligible to begin receiving this perquisite upon retirement from employment. Perquisites to any individual NEO that exceeded $10,000 in a particular year are included in the Summary Compensation Table on page 43.
NEOs also participate in other benefit plans that are available to our employees generally. These plans include medical, dental, life, and disability insurance.
Corporation or a subsidiary is, was or will be a participant, the amount involved exceeds $120,000 and in which any related party had, has or will have a direct or indirect material interest. For purposes of determining whether a transaction is a related party transaction, the Audit Committee refers to Item 404 of Regulation S-K, promulgated under the Exchange Act.
A “related party” is (i) any person who is, or at any time since the beginning of our last fiscal year was, a director or executive officer of the Corporation or a nominee to become a director, (ii) any person who is known to be the beneficial owner of more than 5 percent of any class of our voting securities, (iii) any immediate family member of any of the foregoing persons, which means any child, stepchild, parent, stepparent, spouse, sibling, mother-in-law, father-in-law, son-in-law, daughter-in-law, brother-in-law, or sister-in-law and any person (other than a tenant or employee) sharing the household of any of the foregoing persons, and (iv) any firm, corporation or other entity which is owned or controlled by any of the foregoing persons or in which any of the foregoing persons has a substantial ownership interest or control of such entity.
Other Business
As of the date of this Proxy Statement, management of the Corporation has no knowledge of any matters to be presented for consideration at the Annual Meeting other than Proposal One, Proposal Two, and Proposal Three referred to above. If any other matters properly come before the Annual Meeting, the persons named in the accompanying proxy intend to vote such proxy, to the extent entitled, in accordance with their best judgment.
Householding of Proxy Materials
The SEC has adopted rules that permit companies and intermediaries (e.g., brokers) to satisfy the delivery requirements for proxy statements and annual reports with respect to two or more shareholders sharing the same address by delivering a single proxy statement and annual report addressed to those shareholders. This process, which is commonly referred to as “householding,” potentially means extra convenience for shareholders and cost savings for companies. In accordance with these rules, only one proxy statement and annual report may be delivered to multiple shareholders sharing an address unless we have received contrary instructions from one or more of the shareholders. Shareholders who currently receive multiple copies of the proxy statement and annual report at their address and would like to request “householding” of their communications should contact their broker if they are beneficial owners or, if they are shareholders of record, direct their request to American Stock Transfer & Trust LLC, the Corporation’s stock transfer agent, by telephone at (877) 864-4749.
If, at any time, you no longer wish to participate in “householding” and would prefer to receive a separate proxy statement and annual report, please notify your broker, if you are a beneficial owner or, if you are a shareholder of record, direct your written request to American Stock Transfer & Trust LLC, 6201 15th Avenue, Brooklyn, New York, 11219, or direct your request by telephone at (877) 864-4749.
If requested, we will also promptly deliver, upon oral or written request, a separate copy of the proxy statement and annual report to any shareholder residing at an address to which only one copy was mailed. Requests for additional copies should be directed to the Corporation’s Secretary, C&F Financial Corporation, 3600 La Grange Parkway, Toano, Virginia 23168, or by telephone at (804) 843-2360.
Pay vs Performance Disclosure
|
12 Months Ended |
|
Dec. 31, 2023
USD ($)
|
Dec. 31, 2022
USD ($)
|
Dec. 31, 2021
USD ($)
|
Dec. 31, 2020
USD ($)
|
| Pay vs Performance Disclosure |
|
|
|
|
| Pay vs Performance Disclosure, Table |
| | | | | | | | | | | | | | | | | | | | | | | | | | | | | | | | | | | | | | | | | Average | | | | | | | | | | | | | | | | | | | | | | | | | | | | | | | | Summary | | | Average | | | Value of Initial Fixed $100 | | | | | | | | | | | | | | | | | | | | Compensation | | | Compensation | | | Investment Based on3: | | | | | | | | | | | | | | Summary | | | | | | Table Total | | | Actually Paid | | | | | | 2023 Peer | | | 2022 Peer | | | | | | | | | | | | | | Compensation | | | Compensation | | | for Non-PEO | | | to Non-PEO | | | Total | | | Group Total | | | Group Total | | | | | | | | | | | | | | Table Total | | | Actually Paid | | | Named Executive | | | Named Executive | | | Shareholder | | | Shareholder | | | Shareholder | | | Net Income | | | Adjusted | | | Adjusted | | | | | for PEO1 | | | to PEO2 | | | Officers1 | | | Officers2 | | | Return | | | Return | | | Return | | | (in thousands) | | | ROE4 | | | ROA4 | | Year | | | ($) | | | ($) | | | ($) | | | ($) | | | ($) | | | ($) | | | ($) | | | ($) | | | (%) | | | (%) | | 2023 | | | 1,292,911 | | | 1,376,927 | | | 535,423 | | | 546,486 | | | 141.4 | | | 104.0 | | | 101.0 | | | 23,746 | | | 11.68 | | | 0.99 | | 2022 | | | 1,160,058 | | | 1,236,413 | | | 530,208 | | | 553,696 | | | 117.2 | | | 104.9 | | | 100.7 | | | 29,369 | | | 13.64 | | | 1.16 | | 2021 | | | 1,157,133 | | | 1,363,725 | | | 962,681 | | | 982,576 | | | 99.7 | | | 103.8 | | | 106.4 | | | 29,123 | | | 15.22 | | | 1.38 | | 2020 | | | 977,599 | | | 672,340 | | | 1,092,857 | | | 865,040 | | | 70.1 | | | 77.9 | | | 74.3 | | | 22,424 | | | 12.54 | | | 1.14 | |
| 1 | The amounts shown above are the amounts reported in the Summary Compensation Table on page 43 as total compensation for Mr. Cherry, who was the principal executive officer (“PEO”) for all years presented, and the average for each year of total compensation for the NEOs other than the PEO in each year, including Messrs. Long, Dillon, Crone and Seaman for 2023, and including Messrs. Long, Dillon and Crone and Bryan McKernon, President and CEO of C&F Mortgage Corporation, for years 2020-2022. |
| 2 | Compensation actually paid to Mr. Cherry represents total compensation reported in the Summary Compensation Table, with certain adjustments as described below. Compensation actually paid differs from the amount shown in the Summary Compensation Table and does not represent the total amount earned or total amount paid in any particular year. Total compensation, as reported in the Summary Compensation Table, was adjusted by (1) removing the change in pension value, which represents the actuarial increase in present value of accumulated benefits in each year under the Retirement Plan established by the Bank for Messrs. Cherry, Long, Dillon and Seaman; (2) including the amount of service cost recognized by the Corporation under ASC Topic 715, which represents the actuarial present value of benefits under the Retirement Plan attributable to services rendered in each year for Messrs. Cherry, Long, Dillon and Seaman; (3) removing the grant date fair value of stock awards granted in each year, as determined under ASC Topic 718; (4) including with respect to outstanding restricted stock awards for each year (i) the year-end fair value of any awards granted during the year that are outstanding and unvested as of the end of the year; (ii) the change in fair value as of the end of the year (from the end of the prior year) of any awards granted in prior years that are outstanding and unvested as of the end of the applicable year; and (iii) for awards granted in prior years that vested in the applicable year, the change in fair value as of the vesting date (from the end of the prior year). Total compensation as reported in the Summary Compensation Table and compensation actually paid both include the amount of dividends paid on unvested restricted stock awards. |
The amounts of the adjustments described above that were added to (or deducted from) the Summary Compensation Table total for the PEO to arrive at compensation actually paid for the PEO for 2023 are shown in the table below. | | | | | | | | | | | | | | | | | | | | | | | | | | | | Year End | | | | | | Change in | | | | | | | | | Grant Date | | | Fair Value of | | | Change in Fair Value | | | Fair Value of Stock Awards | | | Change in | | | Pension | | | Fair Value of | | | Stock Awards | | | of Outstanding and | | | Granted in Prior Years that | | | Pension Value | | | Service Cost | | | Stock Awards | | | Granted | | | Unvested Stock Awards | | | Vested in the Year | | | ($) | | | ($) | | | ($) | | | ($) | | | ($) | | | ($) | | | (70,381) | | | 33,244 | | | (249,275) | | | 288,061 | | | 75,732 | | | 6,635 | |
The amounts of the adjustments described above that were added to (or deducted from) the average Summary Compensation Table total for NEOs other than the PEO to arrive at average compensation actually paid to non-PEO NEOs for 2023 are shown in the table below. | | | | | | | | | | | | | | | | | | | | | | | | | | | | Year End | | | | | | Change in | | | | | | | | | Grant Date | | | Fair Value of | | | Change in Fair Value | | | Fair Value of Stock Awards | | | Change in | | | Pension | | | Fair Value of | | | Stock Awards | | | of Outstanding and | | | Granted in Prior Years that | | | Pension Value | | | Service Cost | | | Stock Awards | | | Granted | | | Unvested Stock Awards | | | Vested in the Year | | | ($) | | | ($) | | | ($) | | | ($) | | | ($) | | | ($) | | | (27,316) | | | 4,179 | | | (68,588) | | | 79,259 | | | 20,893 | | | 2,636 | |
| 3 | Cumulative total shareholder return is calculated assuming $100 was invested in the common stock of the Corporation or in the stock of the financial institutions included in a group of peer companies on December 31, 2019, and assumes the reinvestment of dividends. For 2023, the group of peer companies consists of the 2023 Incentive Compensation Peer Group (the “2023 Peer Group”). For more information on the financial institutions included in the 2023 Incentive Compensation Peer Group, refer to page 28 and to the stock performance graph included in Item 5. “Market for Registrant’s Common Equity, Related Stockholder Matters and Issuer Purchases of Equity Securities,” in the Corporation’s Annual Report on Form 10-K for the year ended December 31, 2023, filed with the SEC on February 27, 2024. Previously, the Corporation reported a different group of peer companies. Our prior peer group consisted of the following 23 financial institutions from our 2022 Incentive Compensation Peer Group (the “2022 Peer Group”): American National Bankshares, Inc., Blue Ridge Bankshares, Inc., CapStar Financial Holdings, Inc., Carter Bankshares, Inc., Eagle Financial Services, Inc.; F&M Bank Corporation, First Community Bankshares, Inc., First Community Corporation, First National Corporation, First United Corporation, FVCBankcorp, Inc., HomeTrust Bankshares, Inc., Limestone Bancorp, Inc., MainStreet Bancshares, Inc., National Bankshares, Inc., Old Point Financial Corporation, Peoples Bancorp of North Carolina, Inc., Primis Financial Corporation, Shore Bancshares, Inc., Southern First Bancshares, Inc., Summit Financial Group, Inc., The Community Financial Corporation, and Virginia National Bankshares Corporation. For more information on the financial institutions included in the 2022 Incentive Compensation Peer Group, refer to the Corporation’s 2023 proxy statement, filed with the SEC on March 10, 2023. In 2023, the Corporation changed the composition of the peer group used to evaluate the financial performance of the Corporation primarily by expanding the geography included in the peer group, as the factors that affect competition, financial performance, and access to capital for the Corporation and its peers are generally not unique to the state(s) in which they operate. As such, the 2023 Incentive Compensation Peer Group includes peer companies headquartered in thirteen states in the Eastern and Southern U.S. Additional information can be found in Item 5. “Market for Registrant’s Common Equity, Related Stockholder Matters and Issuer Purchases of Equity Securities,” in the Corporation’s Annual Report on Form 10-K for the year ended December 31, 2023, filed with the SEC on February 27, 2024. For purposes of the cumulative total shareholder return reported in this table, the 2023 Peer Group and the 2022 Peer Group are weighted according to the respective financial institution’s market capitalization as of December 31, 2019. |
| 4 | Adjusted ROE and adjusted ROA are financial measures that are not consistent with U.S. GAAP that are considered by the Corporation as part of its executive compensation program. Refer to Appendix A for information regarding these non-GAAP financial measures, including a reconciliation to the most directly comparable U.S. GAAP financial measures. The Committee has identified a variety of performance goals and metrics used for the purpose of awarding compensation to executive officers that are consistent with the Corporation’s overall compensation philosophy and the long-term interests of its shareholders. Among these, the Committee has identified adjusted ROE as the most important financial performance measure (that is not otherwise required to be disclosed in the table above) used by the Corporation to link compensation actually paid to its NEOs for the year ended December 31, 2023 to company performance. Adjusted ROA, which is also used by the Corporation to evaluate performance as part of its executive compensation program, is shown in the table above as a supplemental financial performance measure. |
|
|
|
|
| Company Selected Measure Name |
Adjusted ROE
|
|
|
|
| Named Executive Officers, Footnote |
| 1 | The amounts shown above are the amounts reported in the Summary Compensation Table on page 43 as total compensation for Mr. Cherry, who was the principal executive officer (“PEO”) for all years presented, and the average for each year of total compensation for the NEOs other than the PEO in each year, including Messrs. Long, Dillon, Crone and Seaman for 2023, and including Messrs. Long, Dillon and Crone and Bryan McKernon, President and CEO of C&F Mortgage Corporation, for years 2020-2022. |
|
|
|
|
| Peer Group Issuers, Footnote |
| 3 | Cumulative total shareholder return is calculated assuming $100 was invested in the common stock of the Corporation or in the stock of the financial institutions included in a group of peer companies on December 31, 2019, and assumes the reinvestment of dividends. For 2023, the group of peer companies consists of the 2023 Incentive Compensation Peer Group (the “2023 Peer Group”). For more information on the financial institutions included in the 2023 Incentive Compensation Peer Group, refer to page 28 and to the stock performance graph included in Item 5. “Market for Registrant’s Common Equity, Related Stockholder Matters and Issuer Purchases of Equity Securities,” in the Corporation’s Annual Report on Form 10-K for the year ended December 31, 2023, filed with the SEC on February 27, 2024. Previously, the Corporation reported a different group of peer companies. Our prior peer group consisted of the following 23 financial institutions from our 2022 Incentive Compensation Peer Group (the “2022 Peer Group”): American National Bankshares, Inc., Blue Ridge Bankshares, Inc., CapStar Financial Holdings, Inc., Carter Bankshares, Inc., Eagle Financial Services, Inc.; F&M Bank Corporation, First Community Bankshares, Inc., First Community Corporation, First National Corporation, First United Corporation, FVCBankcorp, Inc., HomeTrust Bankshares, Inc., Limestone Bancorp, Inc., MainStreet Bancshares, Inc., National Bankshares, Inc., Old Point Financial Corporation, Peoples Bancorp of North Carolina, Inc., Primis Financial Corporation, Shore Bancshares, Inc., Southern First Bancshares, Inc., Summit Financial Group, Inc., The Community Financial Corporation, and Virginia National Bankshares Corporation. For more information on the financial institutions included in the 2022 Incentive Compensation Peer Group, refer to the Corporation’s 2023 proxy statement, filed with the SEC on March 10, 2023. In 2023, the Corporation changed the composition of the peer group used to evaluate the financial performance of the Corporation primarily by expanding the geography included in the peer group, as the factors that affect competition, financial performance, and access to capital for the Corporation and its peers are generally not unique to the state(s) in which they operate. As such, the 2023 Incentive Compensation Peer Group includes peer companies headquartered in thirteen states in the Eastern and Southern U.S. Additional information can be found in Item 5. “Market for Registrant’s Common Equity, Related Stockholder Matters and Issuer Purchases of Equity Securities,” in the Corporation’s Annual Report on Form 10-K for the year ended December 31, 2023, filed with the SEC on February 27, 2024. For purposes of the cumulative total shareholder return reported in this table, the 2023 Peer Group and the 2022 Peer Group are weighted according to the respective financial institution’s market capitalization as of December 31, 2019. |
|
|
|
|
| PEO Total Compensation Amount |
$ 1,292,911
|
$ 1,160,058
|
$ 1,157,133
|
$ 977,599
|
| PEO Actually Paid Compensation Amount |
$ 1,376,927
|
1,236,413
|
1,363,725
|
672,340
|
| Adjustment To PEO Compensation, Footnote |
| 2 | Compensation actually paid to Mr. Cherry represents total compensation reported in the Summary Compensation Table, with certain adjustments as described below. Compensation actually paid differs from the amount shown in the Summary Compensation Table and does not represent the total amount earned or total amount paid in any particular year. Total compensation, as reported in the Summary Compensation Table, was adjusted by (1) removing the change in pension value, which represents the actuarial increase in present value of accumulated benefits in each year under the Retirement Plan established by the Bank for Messrs. Cherry, Long, Dillon and Seaman; (2) including the amount of service cost recognized by the Corporation under ASC Topic 715, which represents the actuarial present value of benefits under the Retirement Plan attributable to services rendered in each year for Messrs. Cherry, Long, Dillon and Seaman; (3) removing the grant date fair value of stock awards granted in each year, as determined under ASC Topic 718; (4) including with respect to outstanding restricted stock awards for each year (i) the year-end fair value of any awards granted during the year that are outstanding and unvested as of the end of the year; (ii) the change in fair value as of the end of the year (from the end of the prior year) of any awards granted in prior years that are outstanding and unvested as of the end of the applicable year; and (iii) for awards granted in prior years that vested in the applicable year, the change in fair value as of the vesting date (from the end of the prior year). Total compensation as reported in the Summary Compensation Table and compensation actually paid both include the amount of dividends paid on unvested restricted stock awards. |
The amounts of the adjustments described above that were added to (or deducted from) the Summary Compensation Table total for the PEO to arrive at compensation actually paid for the PEO for 2023 are shown in the table below. | | | | | | | | | | | | | | | | | | | | | | | | | | | | Year End | | | | | | Change in | | | | | | | | | Grant Date | | | Fair Value of | | | Change in Fair Value | | | Fair Value of Stock Awards | | | Change in | | | Pension | | | Fair Value of | | | Stock Awards | | | of Outstanding and | | | Granted in Prior Years that | | | Pension Value | | | Service Cost | | | Stock Awards | | | Granted | | | Unvested Stock Awards | | | Vested in the Year | | | ($) | | | ($) | | | ($) | | | ($) | | | ($) | | | ($) | | | (70,381) | | | 33,244 | | | (249,275) | | | 288,061 | | | 75,732 | | | 6,635 | |
|
|
|
|
| Non-PEO NEO Average Total Compensation Amount |
$ 535,423
|
530,208
|
962,681
|
1,092,857
|
| Non-PEO NEO Average Compensation Actually Paid Amount |
$ 546,486
|
553,696
|
982,576
|
865,040
|
| Adjustment to Non-PEO NEO Compensation Footnote |
| 2 | Compensation actually paid to Mr. Cherry represents total compensation reported in the Summary Compensation Table, with certain adjustments as described below. Compensation actually paid differs from the amount shown in the Summary Compensation Table and does not represent the total amount earned or total amount paid in any particular year. Total compensation, as reported in the Summary Compensation Table, was adjusted by (1) removing the change in pension value, which represents the actuarial increase in present value of accumulated benefits in each year under the Retirement Plan established by the Bank for Messrs. Cherry, Long, Dillon and Seaman; (2) including the amount of service cost recognized by the Corporation under ASC Topic 715, which represents the actuarial present value of benefits under the Retirement Plan attributable to services rendered in each year for Messrs. Cherry, Long, Dillon and Seaman; (3) removing the grant date fair value of stock awards granted in each year, as determined under ASC Topic 718; (4) including with respect to outstanding restricted stock awards for each year (i) the year-end fair value of any awards granted during the year that are outstanding and unvested as of the end of the year; (ii) the change in fair value as of the end of the year (from the end of the prior year) of any awards granted in prior years that are outstanding and unvested as of the end of the applicable year; and (iii) for awards granted in prior years that vested in the applicable year, the change in fair value as of the vesting date (from the end of the prior year). Total compensation as reported in the Summary Compensation Table and compensation actually paid both include the amount of dividends paid on unvested restricted stock awards. |
The amounts of the adjustments described above that were added to (or deducted from) the average Summary Compensation Table total for NEOs other than the PEO to arrive at average compensation actually paid to non-PEO NEOs for 2023 are shown in the table below. | | | | | | | | | | | | | | | | | | | | | | | | | | | | Year End | | | | | | Change in | | | | | | | | | Grant Date | | | Fair Value of | | | Change in Fair Value | | | Fair Value of Stock Awards | | | Change in | | | Pension | | | Fair Value of | | | Stock Awards | | | of Outstanding and | | | Granted in Prior Years that | | | Pension Value | | | Service Cost | | | Stock Awards | | | Granted | | | Unvested Stock Awards | | | Vested in the Year | | | ($) | | | ($) | | | ($) | | | ($) | | | ($) | | | ($) | | | (27,316) | | | 4,179 | | | (68,588) | | | 79,259 | | | 20,893 | | | 2,636 | |
|
|
|
|
| Compensation Actually Paid vs. Total Shareholder Return |
Figure 1: Compensation Actually Paid and Total Shareholder Return (TSR) 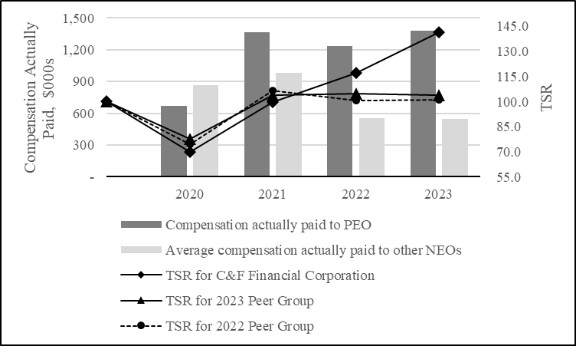
|
|
|
|
| Compensation Actually Paid vs. Net Income |
Figure 2: Compensation Actually Paid and Net Income 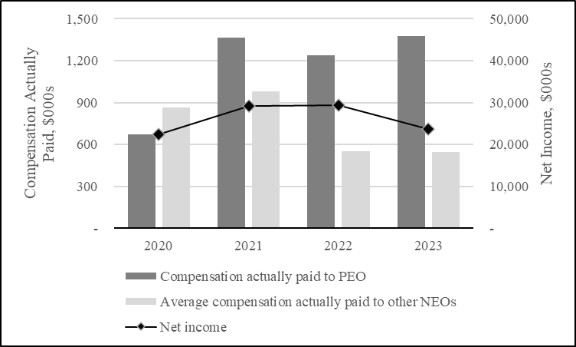
|
|
|
|
| Compensation Actually Paid vs. Company Selected Measure |
Figure 3: Compensation Actually Paid and Adjusted ROE 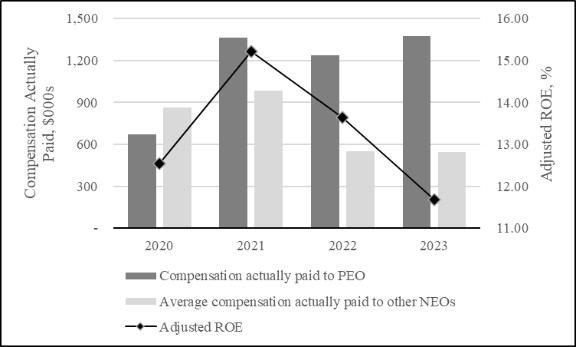
|
|
|
|
| Tabular List, Table |
The following table lists the financial performance measures determined by the Committee to be the most important financial performance measures used by the Corporation to link compensation actually paid to its NEOs for the year ended December 31, 2023 to company performance. | Financial Performance Measures Linked to Compensation of Executives | Net income | Adjusted ROE | Adjusted ROA | ROE (as defined by the Committee) | ROTCE (as defined by the Committee) | Loan delinquencies | Net charge-off ratio |
|
|
|
|
| Total Shareholder Return Amount |
$ 141.4
|
117.2
|
99.7
|
70.1
|
| Net Income (Loss) |
$ 23,746,000
|
$ 29,369,000
|
$ 29,123,000
|
$ 22,424,000
|
| Company Selected Measure Amount |
11.68
|
13.64
|
15.22
|
12.54
|
| PEO Name |
Mr. Cherry
|
|
|
|
| 2023 Peer Group Total Shareholder Return |
$ 104.0
|
$ 104.9
|
$ 103.8
|
$ 77.9
|
| 2022 Peer Group Total Shareholder Return |
$ 101.0
|
$ 100.7
|
$ 106.4
|
$ 74.3
|
| Measure:: 1 |
|
|
|
|
| Pay vs Performance Disclosure |
|
|
|
|
| Name |
Net income
|
|
|
|
| Measure:: 2 |
|
|
|
|
| Pay vs Performance Disclosure |
|
|
|
|
| Name |
Adjusted ROE
|
|
|
|
| Non-GAAP Measure Description |
| 4 | Adjusted ROE and adjusted ROA are financial measures that are not consistent with U.S. GAAP that are considered by the Corporation as part of its executive compensation program. Refer to Appendix A for information regarding these non-GAAP financial measures, including a reconciliation to the most directly comparable U.S. GAAP financial measures. The Committee has identified a variety of performance goals and metrics used for the purpose of awarding compensation to executive officers that are consistent with the Corporation’s overall compensation philosophy and the long-term interests of its shareholders. Among these, the Committee has identified adjusted ROE as the most important financial performance measure (that is not otherwise required to be disclosed in the table above) used by the Corporation to link compensation actually paid to its NEOs for the year ended December 31, 2023 to company performance. Adjusted ROA, which is also used by the Corporation to evaluate performance as part of its executive compensation program, is shown in the table above as a supplemental financial performance measure. |
|
|
|
|
| Measure:: 3 |
|
|
|
|
| Pay vs Performance Disclosure |
|
|
|
|
| Compensation Actually Paid vs. Other Measure |
Figure 4: Compensation Actually Paid and Adjusted ROA 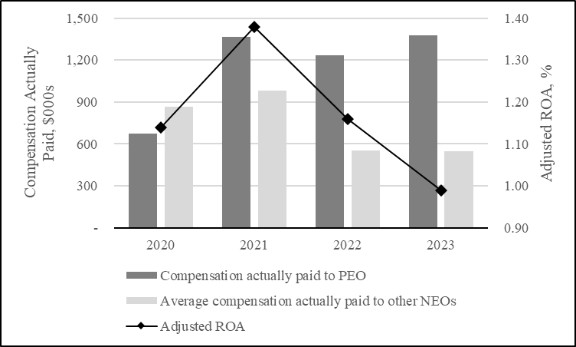
|
|
|
|
| Other Performance Measure, Amount |
0.99
|
1.16
|
1.38
|
1.14
|
| Name |
Adjusted ROA
|
|
|
|
| Non-GAAP Measure Description |
| 4 | Adjusted ROE and adjusted ROA are financial measures that are not consistent with U.S. GAAP that are considered by the Corporation as part of its executive compensation program. Refer to Appendix A for information regarding these non-GAAP financial measures, including a reconciliation to the most directly comparable U.S. GAAP financial measures. The Committee has identified a variety of performance goals and metrics used for the purpose of awarding compensation to executive officers that are consistent with the Corporation’s overall compensation philosophy and the long-term interests of its shareholders. Among these, the Committee has identified adjusted ROE as the most important financial performance measure (that is not otherwise required to be disclosed in the table above) used by the Corporation to link compensation actually paid to its NEOs for the year ended December 31, 2023 to company performance. Adjusted ROA, which is also used by the Corporation to evaluate performance as part of its executive compensation program, is shown in the table above as a supplemental financial performance measure. |
|
|
|
|
| Measure:: 4 |
|
|
|
|
| Pay vs Performance Disclosure |
|
|
|
|
| Name |
ROE (as defined by the Committee)
|
|
|
|
| Measure:: 5 |
|
|
|
|
| Pay vs Performance Disclosure |
|
|
|
|
| Name |
ROTCE (as defined by the Committee)
|
|
|
|
| Measure:: 6 |
|
|
|
|
| Pay vs Performance Disclosure |
|
|
|
|
| Name |
Loan delinquencies
|
|
|
|
| Measure:: 7 |
|
|
|
|
| Pay vs Performance Disclosure |
|
|
|
|
| Name |
Net charge-off ratio
|
|
|
|
| PEO | Change in Pension Value |
|
|
|
|
| Pay vs Performance Disclosure |
|
|
|
|
| Adjustment to Compensation, Amount |
$ (70,381)
|
|
|
|
| PEO | Pension Service Cost |
|
|
|
|
| Pay vs Performance Disclosure |
|
|
|
|
| Adjustment to Compensation, Amount |
33,244
|
|
|
|
| PEO | Grant Date Fair Value of Stock Awards |
|
|
|
|
| Pay vs Performance Disclosure |
|
|
|
|
| Adjustment to Compensation, Amount |
(249,275)
|
|
|
|
| PEO | Year End Fair Value of Stock Awards Granted |
|
|
|
|
| Pay vs Performance Disclosure |
|
|
|
|
| Adjustment to Compensation, Amount |
288,061
|
|
|
|
| PEO | Change in Fair Value of Outstanding and Unvested Stock Awards |
|
|
|
|
| Pay vs Performance Disclosure |
|
|
|
|
| Adjustment to Compensation, Amount |
75,732
|
|
|
|
| PEO | Change in Fair Value of Stock Awards Granted in Prior Years that Vested in the Year |
|
|
|
|
| Pay vs Performance Disclosure |
|
|
|
|
| Adjustment to Compensation, Amount |
6,635
|
|
|
|
| Non-PEO NEO | Change in Pension Value |
|
|
|
|
| Pay vs Performance Disclosure |
|
|
|
|
| Adjustment to Compensation, Amount |
(27,316)
|
|
|
|
| Non-PEO NEO | Pension Service Cost |
|
|
|
|
| Pay vs Performance Disclosure |
|
|
|
|
| Adjustment to Compensation, Amount |
4,179
|
|
|
|
| Non-PEO NEO | Grant Date Fair Value of Stock Awards |
|
|
|
|
| Pay vs Performance Disclosure |
|
|
|
|
| Adjustment to Compensation, Amount |
(68,588)
|
|
|
|
| Non-PEO NEO | Year End Fair Value of Stock Awards Granted |
|
|
|
|
| Pay vs Performance Disclosure |
|
|
|
|
| Adjustment to Compensation, Amount |
79,259
|
|
|
|
| Non-PEO NEO | Change in Fair Value of Outstanding and Unvested Stock Awards |
|
|
|
|
| Pay vs Performance Disclosure |
|
|
|
|
| Adjustment to Compensation, Amount |
20,893
|
|
|
|
| Non-PEO NEO | Change in Fair Value of Stock Awards Granted in Prior Years that Vested in the Year |
|
|
|
|
| Pay vs Performance Disclosure |
|
|
|
|
| Adjustment to Compensation, Amount |
$ 2,636
|
|
|
|
