false
0000763907
0000763907
2025-02-05
2025-02-05
iso4217:USD
xbrli:shares
iso4217:USD
xbrli:shares
UNITED STATES
SECURITIES AND
EXCHANGE COMMISSION
Washington, D.C.
20549
FORM 8-K
CURRENT REPORT
PURSUANT TO SECTION 13 OR 15(d) OF THE
SECURITIES EXCHANGE ACT OF 1934
Date of Report (Date of earliest event
reported): February 5, 2025
First United Corporation
(Exact name of registrant as specified in
its charter)
| Maryland |
|
0-14237 |
|
52-1380770 |
| (State or other jurisdiction of |
|
(Commission file number) |
|
(IRS Employer |
| incorporation or organization) |
|
|
|
Identification No.) |
19 South Second Street, Oakland, Maryland 21550
(Address of principal
executive offices) (Zip Code)
(301) 334-9471
(Registrant’s telephone number, including area code)
N/A
(Former Name or Former
Address, if Changed Since Last Report)
Check the appropriate box below if the Form 8-K filing is intended
to simultaneously satisfy the filing obligations of the registrant under any of the following provisions:
| ¨ |
Written communications pursuant to Rule 425 under the Securities Act (17 CFR 230.425) |
| ¨ |
Soliciting material pursuant to Rule 14a-12 under the Exchange Act (17 CFR 240.14a-12) |
| ¨ |
Pre-commencement communications pursuant to Rule 14d-2(b) under the Exchange Act (17 CFR 240.14d-2(b)) |
| ¨ |
Pre-commencement communications pursuant to Rule 13e-4(c) under the Exchange Act (17 CFR 240.13e-4(c)) |
Securities registered pursuant
to Section 12(b) of the Act:
| Title of each class |
Trading
Symbols |
Name of each exchange on which registered |
| Common Stock |
FUNC |
Nasdaq Stock Market |
Indicate by check mark whether the registrant is an emerging
growth company as defined in Rule 405 of the Securities Act of 1933 (17 CFR §230.405) or Rule 12b-2 of the Securities Exchange
Act of 1934 (17 CFR §240.12b-2).
Emerging growth company
¨
If an emerging growth company, indicate by check mark if the
registrant has elected not to use the extended transition period for complying with any new or revised financial accounting standards
provided pursuant to Section 13(a) of the Exchange Act. ¨
INFORMATION TO BE INCLUDED IN THE REPORT
Item 2.02. Results of Operation and Financial Condition.
On February 5, 2025, First United Corporation (the
“Corporation”) issued a press release describing its financial results for the three-
and twelve- months ended December 31, 2024. A copy of the press release is furnished herewith as Exhibit 99.1.
The information contained
in this Item 2.02 shall not be deemed “filed” for purposes of Section 18 of the Securities Exchange Act of 1934, as amended
(the “Exchange Act”), or incorporated by reference in any filing under the Securities Act of 1933, as amended (the “Securities
Act”), or the Exchange Act, except as shall be expressly set forth by specific reference in such a filing.
Item 7.01. Regulation FD Disclosure.
On February 5, 2025, the
Corporation published an investor presentation that discusses certain aspects of its financial results for the three- and twelve- months
ended December 31, 2024. A copy of the presentation is furnished herewith as Exhibit 99.2.
The information contained
in this Item 7.01 shall not be deemed “filed” for purposes of Section 18 of the Exchange Act or incorporated by reference
in any filing under the Securities Act or the Exchange Act, except as shall be expressly set forth by specific reference in such a filing.
Item 9.01. Financial Statements and Exhibits.
(d) Exhibits.
The exhibits filed or furnished with this report
are listed in the following Exhibit Index:
SIGNATURES
Pursuant
to the requirements of the Securities Exchange Act of 1934, the
registrant has duly caused this report to be signed on its behalf by the undersigned hereunto duly authorized.
| |
FIRST UNITED CORPORATION |
| |
|
|
| |
|
|
| Dated: February 5,
2025 |
By: |
/s/ Tonya K. Sturm |
| |
|
Tonya K. Sturm |
| |
|
Senior Vice President & CFO |
Exhibit 99.1
FIRST UNITED CORPORATION ANNOUNCES
FOURTH QUARTER 2024 FINANCIAL RESULTS
OAKLAND, MARYLAND— February 5, 2025: First
United Corporation (the “Corporation, “we”, “us”, and “our”) (NASDAQ: FUNC), a bank holding
company and the parent company of First United Bank & Trust (the “Bank”), today announced financial results for the three-
and 12-month periods ended December 31, 2024. Consolidated net income was $6.2 million for the fourth quarter of 2024, or $0.95 per diluted
share, compared to $1.8 million, or $0.26 per diluted share, for the fourth quarter of 2023 and $5.8 million, or $0.89 per diluted share,
for the third quarter of 2024. For the year ended December 31, 2024, net income was $20.6 million, or $3.15 per diluted share, compared
to $15.1 million, or $2.25 per diluted share, for the year ended December 31, 2023.
According to Carissa Rodeheaver, Chairman, President
and CEO, “We are proud to announce another strong quarter to conclude the 2024 year. Loan growth was robust during the quarter
as we were able to close a few loans that had been in the pipeline for several months. Our wealth department was a large contributor
to our success during the year as they continue to establish new and grow existing customer relationships. Throughout 2024 we maintained
our pricing and expense discipline ending the year with a strong margin, despite the intense competition in our markets, and a solid efficiency
ratio. Our teams collaborated and demonstrated the First United values as they worked to customize financial solutions for our customers
and to support the communities that we serve. We are excited to enter 2025 with a focus on investing additional resources to grow
our loan and deposit market share and increase our wealth presence.”
Financial Highlights:
| · | Net interest margin, on a non-GAAP, fully tax equivalent (“FTE”) basis, was 3.48% for the
fourth quarter of 2024 |
| · | Loan production was strong, with $72.2 million in commercial loan originations and $23.3 million in residential
mortgage originations in the fourth quarter |
| · | Provision expense increased in the fourth quarter due to loan growth, partially offset by stable asset
quality and qualitative factors |
| · | Deposits increased by $34.4 million due to seasonal fluctuations in municipal deposit balances, partially
offset by runoff of retail certificates of deposit due to competitive pricing |
| · | Operating
income, including net gains, was stable compared to the linked quarter |
| · | Operating
expenses decreased by $0.2 million when compared to the linked quarter |
| · | A cash dividend of $0.22 per common share was declared in the fourth quarter |
Income Statement Overview
On
a GAAP basis, net income for the fourth quarter of 2024 was $6.2 million. This compares to $5.8 million for the third quarter of
2024 and $1.8 million for the fourth quarter of 2023.
| | |
Q4 2024 | | |
Q3 2024 | | |
Q4 2023 | |
| Net Income, non-GAAP (millions) | |
$ | 6.2 | | |
$ | 5.8 | | |
$ | 5.5 | |
| Net Income, GAAP (millions) | |
$ | 6.2 | | |
$ | 5.8 | | |
$ | 1.8 | |
| Diluted net income per share, non-GAAP | |
$ | 0.95 | | |
$ | 0.89 | | |
$ | 0.82 | |
| Diluted net income per share, GAAP | |
$ | 0.95 | | |
$ | 0.89 | | |
$ | 0.26 | |
The $4.4 million increase in quarterly net income
year over year was primarily driven by a restructuring of the investment portfolio leading to the recognition of a $3.3 million loss,
net of tax, and $0.5 million, net of tax, in accelerated depreciation and lease termination expenses related to branch closures in the
fourth quarter of 2023. Net interest income increased by $1.5 million year-over-year driven by a $2.0 million increase in interest and
fees on loans resulting from new loans booked at higher rates, the repricing of adjustable-rate loans, and growth in our loan portfolio
during 2024. Interest expense was stable when comparing year-over-year quarterly expense. Comparing the fourth quarter of 2024 to the
same period of 2023, other operating income was stable and other operating expenses decreased by $0.2 million as a result of a $1.0 million
reduction in occupancy and equipment expense related to the accelerated depreciation and lease expenses for the branch closures in the
fourth quarter of 2023 and decreased marketing and professional services expenses. These decreases were partially offset by a $0.4 million
increase in net other real estate owned (“OREO”) expenses related to gains on sales recognized in 2023 and a $0.3 million
increase in data processing expenses due to timing of invoices.
Compared to the linked quarter, net income increased
by $0.4 million due primarily to a $0.5 million increase in net interest income driven by a $0.3 million increase in interest and fees
on loans as interest expense remained stable. Additionally, salaries and employee benefits decreased by $0.7 million due to reduced incentive
pay and health insurance claims. Occupancy and equipment expenses decreased by $0.3 million. These decreases were partially offset by
a $0.3 million increase in provision for credit losses related primarily to growth in our loan portfolio, a $0.4 million increase in data
processing expenses as a result of increased costs for the core processing system, and timing of invoices for software agreements. We
also experienced a $0.4 million increase in other expenses driven primarily by loan workout costs that we deemed to be uncollectible through
collateral liquidation.
For the year ended December 31, 2024, net income
increased by $5.5 million when compared to the year ended December 31, 2023. Net interest income increased by $3.1 million driven by a
$12.2 million increase in interest and fees on loans, partially offset by a $0.9 million decrease in interest income on investments and
a $7.7 million increase in interest expense resulting from continued pricing pressure on deposits and our use of the Bank Term Funding
Program (“BTFP”). Operating income, including net gains/(losses), increased by $5.4 million due primarily to the $4.2 million
loss recognized in 2023 related to the investment portfolio restructuring mentioned above and a $1.1 million increase in wealth management
income. Operating expenses decreased by $0.6 million as occupancy and equipment expenses decreased by $1.0 million and other miscellaneous
expenses decreased by $0.4 million due primarily to reduced check fraud expenses. These decreases were partially offset by a $0.5 million
increase in salaries and employee benefits, a $0.4 million increase in data processing expenses, and a $0.4 million increase in net OREO
expenses due to gains on sales of OREO properties recognized in 2023.
Net Interest Income and Net Interest Margin
Net interest income, on a non-GAAP, FTE basis,
increased by $1.5 million for the fourth quarter of 2024 when compared to the fourth quarter of 2023. This increase was driven by a $1.5
million increase in interest income. Interest income on loans increased by $2.0 million due to the increase in average balances of $53.9
million and a 36-basis point increase in the overall yield on the loan portfolio as new loans booked at higher rates as well as adjustable-rate
loans repricing in correlation to the elevated rate environment. Investment income decreased by $0.2 million due to a decrease of $58.1
million in average balances related to the balance sheet restructuring of our investment portfolio in the fourth quarter of 2023 and the
maturity of $37.5 million in U.S. Treasury bonds in the first four months of 2024. We also experienced principal paydowns and maturities
in our municipal and mortgage-backed securities (“MBS”) portfolios. The overall yield on the investment portfolio increased
by 23 basis points primarily driven by the increased rate on the trust preferred portfolio and the maturity and sale of lower rate investments.
Interest expense was stable year over year while increases in interest on demand deposits and money markets were offset by a decrease
in interest on brokered certificates of deposit. The average deposit balances increased by $2.6 million when compared to the fourth quarter
of 2023. The average balance of interest-bearing demand deposits increased by $22.0 million and retail money market accounts increased
by $80.8 million. Average savings deposit balances decreased by $24.4 million and retail time deposits decreased by $19.8 million. Average
brokered time deposits decreased by $56.0 million compared to 2023 due to the maturity and repayment of brokered certificates of deposit
during 2024.
Comparing the fourth quarter of 2024 to the third
quarter of 2024, net interest income, on a non-GAAP, FTE basis, increased by $0.5 million. Interest income increased by $0.5 million during
the quarter, primarily due to a $0.3 million increase in interest and fees on loans related to an $18.8 million increase in average balances
during the fourth quarter. Interest income on cash balances increased by $0.2 million related to increased balances of $23.2 million,
which was partially offset by a 96-basis point decrease in rate in conjunction with rate cuts made by the Federal Reserve to the overnight
Federal Funds rate. Interest expense remained stable when comparing the two quarters. During the fourth quarter of 2024, average deposit
balances increased by $31.3 million and the cost of deposits decreased by 6 basis points.
Comparing the year ended December 31, 2024 to
the year ended December 31, 2023, net interest income, on a non-GAAP, FTE basis, increased by $2.7 million. Interest income increased
by $10.4 million. Average loan balances increased by $87.2 million and the overall yield increased by 53 basis points in correlation with
the elevated rate environment as new loans were booked at higher rates as well as the repricing of adjustable-rate loans. Interest expense
on deposits increased by $6.6 million while the average deposit balances increased by $19.4 million, driven by increases of $6.7 million
in demand deposits and $80.1 million in money market balances, partially offset by decreases in savings balances of $39.1 million and
brokered time deposits of $33.5 million. Interest expense on short-term borrowings increased by $1.3 million due to the Bank’s utilization
of the BTFP program in 2024. The increased interest expense resulted in an overall increase of 56 basis points on the cost of interest-bearing
liabilities. The net interest margin was 3.38% and 3.26% for the years ended December 31, 2024 and 2023, respectively.
Non-Interest Income
Other operating income, including net gains/(losses),
for the fourth quarter of 2024 increased by $4.4 million when compared to the same period of 2023. The Corporation recognized $4.2 million
in losses related to the investment portfolio restructuring in the fourth quarter of 2023 to reinvest lower-yielding securities to fund
higher-yielding loan production. Gains on sales of residential mortgages increased by $0.1 million and wealth management increased by
$0.2 million when compared to the same period in 2023.
On a linked quarter basis, other operating income,
including net gains, was stable. Debit card income increased by $0.1 million due to an annual commission received in the fourth quarter.
Miscellaneous income decreased by $0.1 million due to a $0.1 million cash incentive received in the third quarter in connection with check
fees.
For the year ended December 31, 2024, other operating
income increased by $5.4 million when compared to the same period of 2023. Net gains/(losses) increased by $4.3 million primarily due
to the loss recognized in 2023 on the investment portfolio restructuring. Wealth management income increased by $1.1 million due to improving
market conditions, increased annuity sales and growth in new and existing customer relationships. Service charge and debit card income
was stable when comparing 2024 to 2023.
Non-Interest Expense
Operating expenses decreased by $0.2 million in
the fourth quarter of 2024 when compared to the fourth quarter of 2023. Occupancy and equipment expenses decreased by $1.0 million related
to depreciation and lease termination expenses recognized in conjunction with announced branch closures in the final quarter of 2023.
Marketing and professional services decreased by $0.1 million. These decreases were partially offset by a $0.3 million increase in data
processing expenses related to new technology agreements, a $0.4 million increase in net OREO related expenses due to gains from sales
of OREO recognized during 2023, and by a $0.1 million increase in salaries and benefits.
Operating expenses decreased by $0.2 million when
compared to the linked quarter. Salaries and employee benefits decreased by $0.7 million driven by decreases in incentive pay and life
and health insurance expenses due to decreased claims. Equipment and occupancy expenses decreased by $0.3 million when comparing the linked
quarters. These decreases were partially offset by a $0.4 million increase in data processing expenses related to increased costs for
the core processing system and timing of invoices for software agreements. We also experienced a $0.4 million increase in other expenses
driven primarily by loan workout costs that we deemed to be uncollectible through collateral liquidation.
For
the year ended December 31, 2024, operating expenses decreased by $0.6 million when compared to the year ended December 31, 2023. The
decrease was primarily attributable to a $1.0 million decrease in occupancy and equipment expenses related primarily to the branch closures
announced in 2023, a $0.2 million decrease in marketing, and a $0.2 million decrease in professional services expenses. Other miscellaneous
expenses decreased by $0.4 million driven by a $0.5 million decrease in check fraud expenses. These decreases were partially offset by
$0.5 million in increased salaries and employee benefits related to increased incentives, 401(k) expenses, wellness expenses, and reduced
offsets related to loan origination, which were partially offset by reductions in life and health insurance costs. Net OREO costs increased
$0.4 million due to gains on the sale of OREO recognized in 2023, and $0.4 million in increased data processing expenses.
The effective income tax rates as a percentage
of income for the years ended December 31, 2024 and December 31, 2023 were 24.5% and 22.7%, respectively.
Balance Sheet Overview
Total
assets at December 31, 2024 were $2.0 billion, representing a $67.2 million increase since December 31, 2023. During 2024, cash and interest-bearing
deposits in other banks increased by $28.6 million. The investment portfolio decreased by $41.5 million due to the maturities of $37.5
million of U.S. Treasury bonds during the year and normal principal amortization and maturities of our MBS and municipal portfolios. Cash
proceeds from investments were shifted to gross loans, which increased by $74.1 million. OREO decreased by $1.4 million due to
sales of properties. Pension assets increased by $6.6 million resulting from increased market values and deferred tax assets decreased
by $2.0 million as we experienced increased fair market values on available for sale (“AFS”) securities and pension assets
when compared to December 31, 2023.
Total liabilities at December 31, 2024 were $1.8
billion, representing a $49.7 million increase since December 31, 2023. Total deposits increased by $23.9 million when compared to December
31, 2023 related to increases in interest-bearing demand deposits of $35.9 million and money markets of $61.5 million, partially offset
by the decrease of savings deposits by $20.3 million, retail time deposits of $22.4 million, and the repayment of $30.0 million in brokered
certificates of deposits. Short-term borrowings increased by $20.0 million since December 31, 2023, which were comprised of $50.0 million
in overnight borrowings from the Federal Reserve offset by a shift of approximately $22.0 million from overnight investment sweep balances
to FDIC insured accounts as a result of management’s strategy to release pledging of investment securities for municipalities in
order to allow those securities to be available for liquidity. The overnight borrowings were replaced with brokered certificates of deposit
in January 2025. Long-term borrowings increased by $10.0 million in 2024. Maturities of Federal Home Loan Bank (“FHLB”) advances
of $40.0 million in March and $40.0 million in September were fully repaid. During the third quarter and after the Federal Reserve’s
announcement that rates would be reduced by 50 basis points, management made the strategic decision to lock in borrowing costs by placing
$90.0 million in FHLB advances with maturities of 12- and 18-months at a weighted average rate of 3.89%. Of this amount, $41.1 million
was utilized to prepay the principal and accrued interest of the BTFP borrowings at a rate of 4.87% that was scheduled to mature in January
of 2025 and approximately $30.0 million was utilized to repay overnight borrowings related to the repayment of the $40.0 million FHLB
advance that matured in September at a rate of 4.53%. The remainder was used to fund loan growth in the fourth quarter of 2024.
Total AFS and held-to-maturity (“HTM”)
securities totaled $270.0 million at December 31, 2024, representing a $41.5 million decrease when compared to December 31, 2023. In 2024,
$37.5 million in U.S. Treasury bonds matured and the proceeds were used to repay the $40.0 million FHLB advance that matured in March.
Additionally, there were $4.0 million of maturities in our municipal portfolio and $11.0 million of other principal amortizations in our
MBS portfolio. $11.2 million of new investment purchases were made during 2024 to meet our community reinvestment act obligations and
to add increased yield to the portfolio. Management intends to hold the portfolio relatively stable in 2025 by reinvesting proceeds from
amortization and maturities into new higher yielding securities. The investment portfolio is primarily utilized for liquidity purposes,
management of interest sensitivity and collateralization needs.
Outstanding loans of $1.5 billion at December
31, 2024 reflected growth of $32.9 million since September 30, 2024 and $74.1 million since December 31, 2023.
Loan Type
(in millions) |
|
Change since
September 30, 2024 |
|
|
Change since
December 31, 2023 |
|
| Commercial |
|
$ |
35.5 |
|
|
$ |
63.8 |
|
| Residential Mortgages |
|
$ |
(0.4 |
) |
|
$ |
18.9 |
|
| Consumer |
|
$ |
(2.2 |
) |
|
$ |
(8.6 |
) |
| Gross Loans |
|
$ |
32.9 |
|
|
$ |
74.1 |
|
Since December 31, 2023, commercial real estate
loans increased by $32.6 million, acquisition and development loans increased by $18.3 million, commercial and industrial loans increased
by $12.9 million, residential mortgage loans increased $18.9 million, and consumer loans decreased by $8.6 million.
New commercial loan production for the three months
ended December 31, 2024 was approximately $72.2 million. The pipeline of commercial loans at December 31, 2024 was $11.5 million.
At December 31, 2024, unfunded, committed commercial construction loans totaled approximately $5.6 million. Commercial amortization and
payoffs were approximately $114.1 million through December 31, 2024, due primarily to pay-offs of short-term commercial loans as well
as normal amortizations of the commercial loan portfolio.
New consumer mortgage loan production for the
fourth quarter of 2024 was approximately $23.3 million, with most of this production comprised of mortgages to be held on balance sheet.
The pipeline of in-house, portfolio loans as of December 31, 2024 was $5.3 million. The residential mortgage production level decreased
in the fourth quarter of 2024 due to the seasonality of this line of business, particularly construction lending. Unfunded commitments
related to residential construction loans totaled $13.1 million at December 31, 2024.
Total deposits at December 31, 2024 increased
by $23.9 million when compared to December 31, 2023.
Deposit Type
(in millions) |
|
Change since
September 30, 2024 |
|
|
Change since
December 31, 2023 |
|
| Non-Interest-Bearing |
|
$ |
7.3 |
|
|
$ |
(0.9 |
) |
| Interest-Bearing Demand |
|
$ |
4.4 |
|
|
$ |
35.9 |
|
| Savings and Money Market |
|
$ |
21.4 |
|
|
$ |
41.2 |
|
| Time Deposits |
|
$ |
1.3 |
|
|
$ |
(52.3 |
) |
| Total Deposits |
|
$ |
34.4 |
|
|
$ |
23.9 |
|
Interest-bearing demand deposits increased by
$35.9 million in 2024, which included the shift of approximately $22.0 million from overnight investment sweep balances to FDIC insured
accounts due to management’s strategy to release pledging of investment securities for municipalities to provide additional liquidity.
Money market accounts increased by $61.5 million due primarily to the expansion of current and new relationships throughout the year and
a shift from certificates of deposit. Traditional savings accounts decreased by $20.3 million and time deposits decreased by $52.3 million.
The decrease in time deposits was due to a decrease of $22.4 million in retail CDs related to maturities of a nine-month special CD promotion
in 2023 and the maturity and repayment of $30.0 million in brokered CDs during the year. The Bank has worked closely with customers as
these retail CDs mature to transition them to other deposit and wealth management products offered by the Bank.
Short-term borrowings increased by $20.0 million
when compared to December 31, 2023 due to an increase of $50.0 million in overnight borrowings from the Federal Reserve offset by a shift
of approximately $22.0 million in overnight investment sweep balances into FDIC insured accounts due to management’s strategy to
release pledging of investment securities for municipalities to provide additional liquidity. The overnight borrowings were replaced with
brokered certificates of deposit in January 2025. Long-term borrowings increased by $10.0 million when compared to December 31, 2023.
Maturities of FHLB advances of $40.0 million in March and $40.0 million in September were fully repaid. During the third quarter and after
the Federal Reserve’s announcement that rates would be reduced by 50 basis points, management made the strategic decision to lock
in borrowing costs by placing $90.0 million in FHLB advances with maturities of 12- and 18-months and a weighted average rate of 3.89%.
Of this amount, $41.1 million was utilized to prepay the principal and accrued interest of the BTFP borrowing at a rate of 4.87% that
was scheduled to mature in January of 2025 and approximately $30.0 million was utilized to repay overnight borrowings related to the repayment
of the September $40.0 million maturity at a rate of 4.53%. The remainder was used to fund loan growth in the fourth quarter of 2024.
The
book value of the Corporation’s common stock was $27.71 per basic share at December 31, 2024 compared to $24.38 per share at December
31, 2023. At December 31, 2024, there were 6,471,096 of basic outstanding shares and 6,485,119 of diluted outstanding shares of common
stock. In 2024, the Company purchased and retired 201,800 shares of First United Corporation common stock as part of its previously announced
stock repurchase plan at an average price of $19.99 per share. The increase in the book value at December 31, 2024 was due to the undistributed
net income of $15.1 million and a $5.6 million decrease in accumulated other comprehensive loss in 2024.
Asset Quality
The
allowance for credit losses (“ACL”) was $18.2 million at December 31, 2024 compared to $17.5 million at December 31, 2023.
The provision for credit losses was $0.5 million for the quarter ended December 31, 2024 compared to $0.4 million for the quarter ended
December 31, 2023 and $0.3 million for the third quarter of 2024. The increased provision expense recorded year to date in 2024
was primarily related to $1.3 million in net charge-offs related to one non-accrual commercial loan relationship and growth in our loan
portfolio, partially offset by improving qualitative risk factors. Net charge-offs of $0.4 million and $0.2 million were recorded for
the quarter ended December 31, 2024 and December 31, 2023, respectively. The ratio of the ACL to loans outstanding was 1.23% at December
31, 2024, which compares to 1.24% at both September 30, 2024 and December 31, 2023.
The ratio of year-to-date net charge offs to average
loans was 0.16% for year ended December 31, 2024, and 0.07% for the year ended December 31, 2023. The commercial and industrial portfolio
had net charge offs of 0.50% for the year ended December 31, 2024 compared to net charge offs of 0.09% for the year ended December 31,
2023. This increase was due primarily to charge offs of equipment loan balances on one non-accrual commercial relationship during 2024.
The consumer portfolio had net charge offs of 1.76% for the year ended December 31, 2024 compared to net charge offs of 1.04% for the
year ended December 31, 2023. The increase in net charge offs in consumer loans in 2024 was primarily driven by approximately $0.4 million
in charge offs of overdrawn demand deposit balances during the first quarter of 2024 and $0.1 million in charge offs of student loan accounts
in the second quarter. Details of the ratios, by loan type, are shown below. Our special assets team continues to actively collect on
charged-off loans, resulting in overall low net charge-off ratios.
| Ratio of Net (Charge Offs)/Recoveries to Average Loans |
| Loan Type |
|
|
12/31/2024
(Charge Off) / Recovery |
|
|
|
12/31/2023
(Charge Off) / Recovery |
|
| Commercial Real Estate |
|
|
0.02 |
% |
|
|
(0.02 |
)% |
| Acquisition & Development |
|
|
0.06 |
% |
|
|
0.01 |
% |
| Commercial & Industrial |
|
|
(0.50 |
)% |
|
|
(0.09 |
)% |
| Residential Mortgage |
|
|
0.01 |
% |
|
|
0.00 |
% |
| Consumer |
|
|
(1.76 |
)% |
|
|
(1.04 |
)% |
| Total Net (Charge Offs)/Recoveries |
|
|
(0.16 |
)% |
|
|
(0.07 |
)% |
Non-accrual
loans totaled $4.9 million at December 31, 2024 compared to $4.0 million at December 31, 2023. The increase in non-accrual balances
at December 31, 2024 was related to two commercial and industrial loan relationships totaling $12.1 million that were moved to non-accrual
during the first quarter of 2024. Subsequent to being moved to non-accrual, one of the borrowers liquidated collateral and reduced the
balances by $5.5 million. Additionally, a total of $2.8 million in collateral was moved to repossessed assets in the fourth quarter of
2024. $1.3 million in net charge-offs and $3.0 million in principal reduction related to the liquidation of collateral at depressed prices
were recognized on the other commercial credit during 2024. The Bank continues to liquidate collateral on both loan relationships.
Non-accrual
loans that have been subject to partial charge-offs totaled $0.7 million at December 31, 2024 and $0.1 million at December 31, 2023.
Loans secured by 1-4 family residential real estate properties in the process of foreclosure totaled $1.6 million at December 31,
2024 and $1.8 million at December 31, 2023. As a percentage of the loan portfolio, accruing loans past due 30 days or more was 0.32% at
December 31, 2024 compared to 0.24% at December 31, 2023.
ABOUT FIRST UNITED CORPORATION
First
United Corporation is a Maryland corporation chartered in 1985 and a financial holding company registered with the Board of Governors
of the Federal Reserve System under the Bank Holding Company Act of 1956, as amended, that elected financial holding company status in
2021. The Corporation’s primary business is serving as the parent company of the Bank, First United Statutory Trust I (“Trust
I”) and First United Statutory Trust II (together with Trust I, “the Trusts”), both Connecticut statutory business trusts.
The Trusts were formed for the purpose of selling trust preferred securities that qualified as Tier 1 capital. The Bank has two consumer
finance company subsidiaries- Oak First Loan Center, Inc., a West Virginia corporation, and OakFirst Loan Center, LLC, a Maryland limited
liability company – and two subsidiaries that it uses to hold real estate acquired through foreclosure or by deed in lieu of foreclosure
– First OREO Trust, a Maryland statutory trust, and FUBT OREO I, LLC, a Maryland limited liability company. In addition, the Bank
owns 99.9% of the limited partnership interests in Liberty Mews Limited Partnership, a Maryland limited partnership formed for the purpose
of acquiring, developing and operating low-income housing units in Garrett County, Maryland, and a 99.9% non-voting membership interest
in MCC FUBT Fund, LLC, an Ohio limited liability company formed for the purpose of acquiring, developing and operating low-income housing
units in Allegany County, Maryland. The Corporation’s website is www.mybank.com.
FORWARD-LOOKING STATEMENTS
This press release contains forward-looking statements
as defined by the Private Securities Litigation Reform Act of 1995. Forward-looking statements do not represent historical facts,
but are statements about management's beliefs, plans and objectives about the future, as well as its assumptions and judgments concerning
such beliefs, plans and objectives. These statements are evidenced by terms such as "anticipate," "estimate,"
"should," "expect," "believe," "intend," and similar expressions. Although these statements
reflect management's good faith beliefs and projections, they are not guarantees of future performance and they may not prove true.
The beliefs, plans and objectives on which forward-looking statements are based involve risks and uncertainties that could cause actual
results to differ materially from those addressed in the forward-looking statements. For a discussion of these risks and uncertainties,
see the section of the periodic reports that First United Corporation files with the Securities and Exchange Commission entitled "Risk
Factors". In addition, investors should understand that the Corporation is required under generally accepted accounting principles
to evaluate subsequent events through the filing of the consolidated financial statements included in its Annual Report on Form 10-K for
the year ended December 31, 2024 and the impact that any such events have on our critical accounting assumptions and estimates made as
of December 31, 2024, which could require us to make adjustments to the amounts reflected in this press release.
FIRST UNITED CORPORATION
Oakland, MD
Stock Symbol : FUNC
Financial Highlights - Unaudited
(Dollars in thousands, except per share data)
| | |
Three Months Ended | | |
Twelve Months Ended | |
| | |
December 31, | | |
December 31, | | |
December 31, | | |
December 31, | |
| | |
2024 | | |
2023 | | |
2024 | | |
2023 | |
| Results of Operations: | |
| | |
| | |
| | |
| |
| Interest income | |
$ | 23,725 | | |
$ | 22,191 | | |
$ | 91,993 | | |
$ | 81,156 | |
| Interest expense | |
| 8,025 | | |
| 7,997 | | |
| 32,015 | | |
| 24,286 | |
| Net interest income | |
| 15,700 | | |
| 14,194 | | |
| 59,978 | | |
| 56,870 | |
| Provision for credit losses | |
| 529 | | |
| 419 | | |
| 2,933 | | |
| 1,620 | |
| Other operating income | |
| 4,924 | | |
| 4,793 | | |
| 19,411 | | |
| 18,331 | |
| Net gains/(losses) | |
| 132 | | |
| (4,184 | ) | |
| 414 | | |
| (3,862 | ) |
| Other operating expense | |
| 12,081 | | |
| 12,309 | | |
| 49,640 | | |
| 50,243 | |
| Income before taxes | |
$ | 8,146 | | |
$ | 2,075 | | |
$ | 27,230 | | |
$ | 19,476 | |
| Income tax expense | |
| 1,960 | | |
| 317 | | |
| 6,661 | | |
| 4,416 | |
| Net income | |
$ | 6,186 | | |
$ | 1,758 | | |
$ | 20,569 | | |
$ | 15,060 | |
| | |
| | | |
| | | |
| | | |
| | |
| Per share data: | |
| | | |
| | | |
| | | |
| | |
| Basic net income per share | |
$ | 0.95 | | |
$ | 0.26 | | |
$ | 3.15 | | |
$ | 2.25 | |
| Diluted net income per share | |
$ | 0.95 | | |
$ | 0.26 | | |
$ | 3.15 | | |
$ | 2.24 | |
| Adjusted Basic net income (1) | |
$ | 0.95 | | |
$ | 0.82 | | |
$ | 3.21 | | |
$ | 2.81 | |
| Adjusted Diluted net income (1) | |
$ | 0.95 | | |
$ | 0.82 | | |
$ | 3.21 | | |
$ | 2.80 | |
| Dividends declared per share | |
$ | 0.22 | | |
$ | 0.20 | | |
$ | 0.84 | | |
$ | 0.80 | |
| Book value | |
$ | 27.71 | | |
$ | 24.38 | | |
| | | |
| | |
| Diluted book value | |
$ | 27.65 | | |
$ | 24.33 | | |
| | | |
| | |
| Tangible book value per share | |
$ | 25.89 | | |
$ | 22.56 | | |
| | | |
| | |
| Diluted Tangible book value per share | |
$ | 25.83 | | |
$ | 22.51 | | |
| | | |
| | |
| | |
| | | |
| | | |
| | | |
| | |
| Closing market value | |
$ | 33.71 | | |
$ | 23.51 | | |
| | | |
| | |
| Market Range: | |
| | | |
| | | |
| | | |
| | |
| High | |
$ | 36.17 | | |
$ | 23.51 | | |
| | | |
| | |
| Low | |
$ | 29.63 | | |
$ | 16.12 | | |
| | | |
| | |
| | |
| | | |
| | | |
| | | |
| | |
| Shares outstanding at period end: Basic | |
| 6,471,096 | | |
| 6,639,888 | | |
| | | |
| | |
| Shares outstanding at period end: Diluted | |
| 6,485,119 | | |
| 6,653,200 | | |
| | | |
| | |
| | |
| | | |
| | | |
| | | |
| | |
| Performance ratios: (Year to Date Period End, annualized) | |
| | | |
| | | |
| | | |
| | |
| Return on average assets | |
| 1.06 | % | |
| 0.78 | % | |
| | | |
| | |
| Adjusted return on average assets (1) | |
| 1.08 | % | |
| 0.97 | % | |
| | | |
| | |
| Return on average shareholders' equity | |
| 12.16 | % | |
| 9.68 | % | |
| | | |
| | |
| Adjusted return on average shareholders' equity (1) | |
| 12.42 | % | |
| 12.08 | % | |
| | | |
| | |
| Net interest margin (Non-GAAP), includes tax exempt income of $229 and $626 | |
| 3.38 | % | |
| 3.26 | % | |
| | | |
| | |
| Net interest margin GAAP | |
| 3.36 | % | |
| 3.22 | % | |
| | | |
| | |
| Efficiency ratio - non-GAAP (2) | |
| 61.31 | % | |
| 65.12 | % | |
| | | |
| | |
(1) See reconciliation of this non-GAAP financial
measure provided elsewhere herein.
(2) Efficiency ratio is a
non-GAAP measure calculated by dividing total operating expenses by the sum of tax equivalent net interest income and other operating
income, less gains/(losses) on sales of securities and/or fixed assets.
| | |
December 31, | | |
December 31, | |
| | |
2024 | | |
2023 | |
| Financial Condition at period end: | |
| | | |
| | |
| Assets | |
$ | 1,973,022 | | |
$ | 1,905,860 | |
| Earning assets | |
$ | 1,758,665 | | |
$ | 1,725,236 | |
| Gross loans | |
$ | 1,480,793 | | |
$ | 1,406,667 | |
| Commercial Real Estate | |
$ | 526,364 | | |
$ | 493,703 | |
| Acquisition and Development | |
$ | 95,314 | | |
$ | 77,060 | |
| Commercial and Industrial | |
$ | 287,534 | | |
$ | 274,604 | |
| Residential Mortgage | |
$ | 518,815 | | |
$ | 499,871 | |
| Consumer | |
$ | 52,766 | | |
$ | 61,429 | |
| Investment securities | |
$ | 269,991 | | |
$ | 311,466 | |
| Total deposits | |
$ | 1,574,829 | | |
$ | 1,550,977 | |
| Noninterest bearing | |
$ | 426,737 | | |
$ | 427,670 | |
| Interest bearing | |
$ | 1,148,092 | | |
$ | 1,123,307 | |
| Shareholders' equity | |
$ | 179,295 | | |
$ | 161,873 | |
| | |
| | | |
| . | |
| Capital ratios: | |
| | | |
| | |
| | |
| | | |
| | |
| Tier 1 to risk weighted assets | |
| 14.70 | % | |
| 14.42 | % |
| Common Equity Tier 1 to risk weighted assets | |
| 12.79 | % | |
| 12.44 | % |
| Tier 1 Leverage | |
| 11.88 | % | |
| 11.30 | % |
| Total risk based capital | |
| 15.92 | % | |
| 15.64 | % |
| | |
| | | |
| | |
| Asset quality: | |
| | | |
| | |
| | |
| | | |
| | |
| Net charge-offs for the quarter | |
$ | (362 | ) | |
$ | (195 | ) |
| Nonperforming assets: (Period End) | |
| | | |
| | |
| Nonaccrual loans | |
$ | 4,931 | | |
$ | 3,956 | |
| Loans 90 days past due and accruing | |
| 918 | | |
| 543 | |
| | |
| | | |
| | |
| Total nonperforming loans and 90 day past due | |
$ | 5,849 | | |
$ | 4,499 | |
| | |
| | | |
| | |
| Other real estate owned | |
$ | 3,062 | | |
$ | 4,493 | |
| Other repossessed assets | |
$ | 2,802 | | |
$ | 55 | |
| Modified loans | |
$ | 1,006 | | |
$ | - | |
| | |
| | | |
| | |
| Allowance for credit losses to gross loans | |
| 1.23 | % | |
| 1.24 | % |
| Allowance for credit losses to non-accrual loans | |
| 368.49 | % | |
| 441.86 | % |
| Allowance for credit losses to non-performing assets | |
| 155.13 | % | |
| 193.21 | % |
| Non-performing and 90 day past due loans to total loans | |
| 0.39 | % | |
| 0.32 | % |
| Non-performing loans and 90 day past due loans to total assets | |
| 0.30 | % | |
| 0.24 | % |
| Non-accrual loans to total loans | |
| 0.33 | % | |
| 0.28 | % |
| Non-performing assets to total assets | |
| 0.59 | % | |
| 0.47 | % |
FIRST UNITED CORPORATION
Oakland, MD
Stock Symbol : FUNC
Financial Highlights - Unaudited
| | |
December
31, | | |
September
30, | | |
June
30, | | |
March
31, | | |
December
31, | | |
September
30, | | |
June
30, | | |
March
31, | |
| (Dollars in thousands,
except per share data) | |
2024 | | |
2024 | | |
2024 | | |
2024 | | |
2023 | | |
2023 | | |
2023 | | |
2023 | |
| Results of Operations: | |
| | | |
| | | |
| | | |
| | | |
| | | |
| | | |
| | | |
| | |
| Interest income | |
$ | 23,725 | | |
$ | 23,257 | | |
$ | 23,113 | | |
$ | 21,898 | | |
$ | 22,191 | | |
$ | 21,164 | | |
$ | 19,972 | | |
$ | 17,829 | |
| Interest
expense | |
| 8,025 | | |
| 8,029 | | |
| 7,875 | | |
| 8,086 | | |
| 7,997 | | |
| 7,180 | | |
| 5,798 | | |
| 3,311 | |
| Net interest income | |
| 15,700 | | |
| 15,228 | | |
| 15,238 | | |
| 13,812 | | |
| 14,194 | | |
| 13,984 | | |
| 14,174 | | |
| 14,518 | |
| Provision for credit losses | |
| 529 | | |
| 264 | | |
| 1,194 | | |
| 946 | | |
| 419 | | |
| 263 | | |
| 395 | | |
| 543 | |
| Other operating income | |
| 4,924 | | |
| 4,912 | | |
| 4,782 | | |
| 4,793 | | |
| 4,793 | | |
| 4,716 | | |
| 4,483 | | |
| 4,339 | |
| Net gains/(losses) | |
| 132 | | |
| 141 | | |
| 59 | | |
| 82 | | |
| (4,184 | ) | |
| 182 | | |
| 86 | | |
| 54 | |
| Other operating
expense | |
| 12,081 | | |
| 12,314 | | |
| 12,364 | | |
| 12,881 | | |
| 12,309 | | |
| 12,785 | | |
| 12,511 | | |
| 12,638 | |
| Income before taxes | |
$ | 8,146 | | |
$ | 7,703 | | |
$ | 6,521 | | |
$ | 4,860 | | |
$ | 2,075 | | |
$ | 5,834 | | |
$ | 5,837 | | |
$ | 5,730 | |
| Income tax
expense | |
| 1,960 | | |
| 1,932 | | |
| 1,607 | | |
| 1,162 | | |
| 317 | | |
| 1,321 | | |
| 1,423 | | |
| 1,355 | |
| Net income | |
$ | 6,186 | | |
$ | 5,771 | | |
$ | 4,914 | | |
$ | 3,698 | | |
$ | 1,758 | | |
$ | 4,513 | | |
$ | 4,414 | | |
$ | 4,375 | |
| | |
| | | |
| | | |
| | | |
| | | |
| | | |
| | | |
| | | |
| | |
| Per share data: | |
| | | |
| | | |
| | | |
| | | |
| | | |
| | | |
| | | |
| | |
| Basic net income per share | |
$ | 0.95 | | |
$ | 0.89 | | |
$ | 0.75 | | |
$ | 0.56 | | |
$ | 0.26 | | |
$ | 0.67 | | |
$ | 0.66 | | |
$ | 0.66 | |
| Diluted net income per share | |
$ | 0.95 | | |
$ | 0.89 | | |
$ | 0.75 | | |
$ | 0.56 | | |
$ | 0.26 | | |
$ | 0.67 | | |
$ | 0.66 | | |
$ | 0.65 | |
| Adjusted basic net income (1) | |
$ | 0.95 | | |
$ | 0.89 | | |
$ | 0.75 | | |
$ | 0.62 | | |
$ | 0.82 | | |
$ | 0.67 | | |
$ | 0.66 | | |
$ | 0.66 | |
| Adjusted diluted net income (1) | |
$ | 0.95 | | |
$ | 0.89 | | |
$ | 0.75 | | |
$ | 0.62 | | |
$ | 0.82 | | |
$ | 0.67 | | |
$ | 0.66 | | |
$ | 0.65 | |
| Dividends declared per share | |
$ | 0.22 | | |
$ | 0.22 | | |
$ | 0.22 | | |
$ | 0.20 | | |
$ | 0.20 | | |
$ | 0.20 | | |
$ | 0.62 | | |
$ | 0.20 | |
| Book value | |
$ | 27.71 | | |
$ | 26.90 | | |
$ | 25.39 | | |
$ | 24.89 | | |
$ | 24.38 | | |
$ | 23.08 | | |
$ | 23.12 | | |
$ | 22.85 | |
| Diluted book value | |
$ | 27.65 | | |
$ | 26.84 | | |
$ | 25.34 | | |
$ | 24.86 | | |
$ | 24.33 | | |
$ | 23.03 | | |
$ | 23.07 | | |
$ | 22.81 | |
| Tangible book value per share | |
$ | 25.89 | | |
$ | 25.06 | | |
$ | 23.55 | | |
$ | 23.08 | | |
$ | 22.56 | | |
$ | 21.27 | | |
$ | 21.29 | | |
$ | 21.01 | |
| Diluted Tangible book value per share | |
$ | 25.83 | | |
$ | 25.01 | | |
$ | 23.49 | | |
$ | 23.05 | | |
$ | 22.51 | | |
$ | 21.22 | | |
$ | 21.25 | | |
$ | 20.96 | |
| | |
| | | |
| | | |
| | | |
| | | |
| | | |
| | | |
| | | |
| | |
| Closing market value | |
$ | 33.71 | | |
$ | 29.84 | | |
$ | 20.42 | | |
$ | 22.91 | | |
$ | 23.51 | | |
$ | 16.23 | | |
$ | 14.26 | | |
$ | 16.89 | |
| Market Range: | |
| | | |
| | | |
| | | |
| | | |
| | | |
| | | |
| | | |
| | |
| High | |
$ | 36.17 | | |
$ | 30.77 | | |
$ | 22.88 | | |
$ | 23.85 | | |
$ | 23.51 | | |
$ | 17.34 | | |
$ | 17.01 | | |
$ | 20.41 | |
| Low | |
$ | 29.63 | | |
$ | 20.40 | | |
$ | 19.40 | | |
$ | 21.21 | | |
$ | 16.12 | | |
$ | 13.70 | | |
$ | 12.56 | | |
$ | 16.75 | |
| | |
| | | |
| | | |
| | | |
| | | |
| | | |
| | | |
| | | |
| | |
| Shares outstanding at period end:
Basic | |
| 6,471,096 | | |
| 6,468,625 | | |
| 6,465,601 | | |
| 6,648,645 | | |
| 6,639,888 | | |
| 6,715,170 | | |
| 6,711,422 | | |
| 6,688,710 | |
| Shares outstanding at period end:
Diluted | |
| 6,485,119 | | |
| 6,482,648 | | |
| 6,479,624 | | |
| 6,657,239 | | |
| 6,653,200 | | |
| 6,728,482 | | |
| 6,724,734 | | |
| 6,703,252 | |
| | |
| | | |
| | | |
| | | |
| | | |
| | | |
| | | |
| | | |
| | |
| Performance ratios: (Year
to Date Period End, annualized) | |
| | | |
| | | |
| | | |
| | | |
| | | |
| | | |
| | | |
| | |
| Return on average assets | |
| 1.06 | % | |
| 0.99 | % | |
| 0.89 | % | |
| 0.76 | % | |
| 0.78 | % | |
| 0.93 | % | |
| 0.95 | % | |
| 0.94 | % |
| Adjusted return on average assets
(1) | |
| 1.08 | % | |
| 1.01 | % | |
| 0.98 | % | |
| 0.85 | % | |
| 0.94 | % | |
| 0.93 | % | |
| 0.95 | % | |
| 0.94 | % |
| Return on average shareholders'
equity | |
| 12.16 | % | |
| 11.52 | % | |
| 10.48 | % | |
| 9.07 | % | |
| 9.68 | % | |
| 11.44 | % | |
| 11.43 | % | |
| 11.87 | % |
| Adjusted return on average shareholders'
equity (1) | |
| 12.42 | % | |
| 11.78 | % | |
| 11.52 | % | |
| 10.11 | % | |
| 11.87 | % | |
| 11.44 | % | |
| 11.43 | % | |
| 11.87 | % |
| Net interest margin (Non-GAAP),
includes tax exempt income of $53 and $76 | |
| 3.38 | % | |
| 3.34 | % | |
| 3.31 | % | |
| 3.12 | % | |
| 3.26 | % | |
| 3.30 | % | |
| 3.39 | % | |
| 3.53 | % |
| Net interest margin GAAP | |
| 3.36 | % | |
| 3.32 | % | |
| 3.29 | % | |
| 3.10 | % | |
| 3.22 | % | |
| 3.25 | % | |
| 3.34 | % | |
| 3.48 | % |
| Efficiency ratio - non-GAAP (1) | |
| 61.31 | % | |
| 62.46 | % | |
| 63.48 | % | |
| 65.71 | % | |
| 65.12 | % | |
| 66.41 | % | |
| 66.00 | % | |
| 67.02 | % |
(1) Efficiency ratio is a non-GAAP measure calculated by dividing total operating expenses by the sum of tax equivalent net interest income and other operating income, less gains/(losses) on sales of securities and/or fixed assets.
| | |
December
31, | | |
September
30, | | |
June
30, | | |
March
31, | | |
December
31, | | |
September
30, | | |
June
30, | | |
March
31, | |
| | |
2024 | | |
2024 | | |
2024 | | |
2024 | | |
2023 | | |
2023 | | |
2023 | | |
2023 | |
| Financial Condition at period
end: | |
| | | |
| | | |
| | | |
| | | |
| | | |
| | | |
| | | |
| | |
| Assets | |
$ | 1,973,022 | | |
$ | 1,916,126 | | |
$ | 1,868,599 | | |
$ | 1,912,953 | | |
$ | 1,905,860 | | |
$ | 1,928,201 | | |
$ | 1,928,393 | | |
$ | 1,937,442 | |
| Earning assets | |
$ | 1,758,665 | | |
$ | 1,722,346 | | |
$ | 1,695,425 | | |
$ | 1,695,962 | | |
$ | 1,725,236 | | |
$ | 1,717,244 | | |
$ | 1,707,522 | | |
$ | 1,652,688 | |
| Gross loans | |
$ | 1,480,793 | | |
$ | 1,447,883 | | |
$ | 1,422,975 | | |
$ | 1,412,327 | | |
$ | 1,406,667 | | |
$ | 1,380,019 | | |
$ | 1,350,038 | | |
$ | 1,289,080 | |
| Commercial Real Estate | |
$ | 526,364 | | |
$ | 502,828 | | |
$ | 506,273 | | |
$ | 492,819 | | |
$ | 493,703 | | |
$ | 491,284 | | |
$ | 483,485 | | |
$ | 453,356 | |
| Acquisition and Development | |
$ | 95,314 | | |
$ | 92,909 | | |
$ | 88,215 | | |
$ | 83,424 | | |
$ | 77,060 | | |
$ | 79,796 | | |
$ | 79,003 | | |
$ | 76,980 | |
| Commercial and Industrial | |
$ | 287,534 | | |
$ | 277,994 | | |
$ | 260,168 | | |
$ | 274,722 | | |
$ | 274,604 | | |
$ | 254,650 | | |
$ | 249,683 | | |
$ | 241,959 | |
| Residential Mortgage | |
$ | 518,815 | | |
$ | 519,168 | | |
$ | 511,354 | | |
$ | 501,990 | | |
$ | 499,871 | | |
$ | 491,686 | | |
$ | 475,540 | | |
$ | 456,198 | |
| Consumer | |
$ | 52,766 | | |
$ | 54,984 | | |
$ | 56,965 | | |
$ | 59,372 | | |
$ | 61,429 | | |
$ | 62,603 | | |
$ | 62,327 | | |
$ | 60,587 | |
| Investment securities | |
$ | 269,991 | | |
$ | 267,214 | | |
$ | 267,151 | | |
$ | 278,716 | | |
$ | 311,466 | | |
$ | 330,053 | | |
$ | 350,844 | | |
$ | 357,061 | |
| Total deposits | |
$ | 1,574,829 | | |
$ | 1,540,395 | | |
$ | 1,537,071 | | |
$ | 1,563,453 | | |
$ | 1,550,977 | | |
$ | 1,575,069 | | |
$ | 1,579,959 | | |
$ | 1,591,285 | |
| Noninterest bearing | |
$ | 426,737 | | |
$ | 419,437 | | |
$ | 423,970 | | |
$ | 422,759 | | |
$ | 427,670 | | |
$ | 429,691 | | |
$ | 466,628 | | |
$ | 468,554 | |
| Interest bearing | |
$ | 1,148,092 | | |
$ | 1,120,958 | | |
$ | 1,113,101 | | |
$ | 1,140,694 | | |
$ | 1,123,307 | | |
$ | 1,145,378 | | |
$ | 1,113,331 | | |
$ | 1,122,731 | |
| Shareholders' equity | |
$ | 179,295 | | |
$ | 173,979 | | |
$ | 164,177 | | |
$ | 165,481 | | |
$ | 161,873 | | |
$ | 154,990 | | |
$ | 155,156 | | |
$ | 152,868 | |
| | |
| | | |
| | | |
| | | |
| | | |
| | | |
| | | |
| | | |
| | |
| Capital ratios: | |
| | | |
| | | |
| | | |
| | | |
| | | |
| | | |
| | | |
| | |
| | |
| | | |
| | | |
| | | |
| | | |
| | | |
| | | |
| | | |
| | |
| Tier 1 to risk weighted assets | |
| 14.70 | % | |
| 14.61 | % | |
| 14.51 | % | |
| 14.58 | % | |
| 14.42 | % | |
| 14.60 | % | |
| 14.40 | % | |
| 14.90 | % |
| Common Equity Tier 1 to risk
weighted assets | |
| 12.79 | % | |
| 12.66 | % | |
| 12.54 | % | |
| 12.60 | % | |
| 12.44 | % | |
| 12.60 | % | |
| 12.40 | % | |
| 12.82 | % |
| Tier 1 Leverage | |
| 11.88 | % | |
| 11.88 | % | |
| 11.69 | % | |
| 11.48 | % | |
| 11.30 | % | |
| 11.25 | % | |
| 11.25 | % | |
| 11.47 | % |
| Total risk based capital | |
| 15.92 | % | |
| 15.83 | % | |
| 15.75 | % | |
| 15.83 | % | |
| 15.64 | % | |
| 15.81 | % | |
| 15.60 | % | |
| 16.15 | % |
| | |
| | | |
| | | |
| | | |
| | | |
| | | |
| | | |
| | | |
| | |
| Asset quality: | |
| | | |
| | | |
| | | |
| | | |
| | | |
| | | |
| | | |
| | |
| | |
| | | |
| | | |
| | | |
| | | |
| | | |
| | | |
| | | |
| | |
| Net (charge-offs)/recoveries
for the quarter | |
$ | (362 | ) | |
$ | (109 | ) | |
$ | (1,309 | ) | |
$ | (459 | ) | |
$ | (195 | ) | |
$ | (83 | ) | |
$ | (398 | ) | |
$ | (245 | ) |
| Nonperforming assets: (Period
End) | |
| | | |
| | | |
| | | |
| | | |
| | | |
| | | |
| | | |
| | |
| Nonaccrual loans | |
$ | 4,931 | | |
$ | 8,073 | | |
$ | 9,438 | | |
$ | 16,007 | | |
$ | 3,956 | | |
$ | 3,479 | | |
$ | 2,972 | | |
$ | 3,258 | |
| Loans 90
days past due and accruing | |
| 918 | | |
| 538 | | |
| 526 | | |
| 120 | | |
| 543 | | |
| 145 | | |
| 160 | | |
| 87 | |
| Total
nonperforming loans and 90 day past due | |
$ | 5,849 | | |
$ | 8,611 | | |
$ | 9,964 | | |
$ | 16,127 | | |
$ | 4,499 | | |
$ | 3,624 | | |
$ | 3,132 | | |
$ | 3,345 | |
| | |
| | | |
| | | |
| | | |
| | | |
| | | |
| | | |
| | | |
| | |
| Other real estate owned | |
$ | 3,062 | | |
$ | 2,860 | | |
$ | 2,978 | | |
$ | 4,402 | | |
$ | 4,493 | | |
$ | 4,878 | | |
$ | 4,482 | | |
$ | 4,598 | |
| Other repossessed assets | |
$ | 2,802 | | |
$ | 42 | | |
$ | 32 | | |
$ | 68 | | |
$ | 55 | | |
$ | 41 | | |
$ | - | | |
$ | 8 | |
| Modified loans | |
$ | 1,006 | | |
$ | 1,016 | | |
$ | 893 | | |
$ | - | | |
$ | - | | |
$ | - | | |
$ | - | | |
$ | - | |
| | |
| | | |
| | | |
| | | |
| | | |
| | | |
| | | |
| | | |
| | |
| Allowance for credit losses to
gross loans | |
| 1.23 | % | |
| 1.24 | % | |
| 1.26 | % | |
| 1.27 | % | |
| 1.24 | % | |
| 1.24 | % | |
| 1.25 | % | |
| 1.31 | % |
| Allowance for credit losses to
non-accrual loans | |
| 368.49 | % | |
| 223.09 | % | |
| 189.90 | % | |
| 112.34 | % | |
| 441.86 | % | |
| 492.84 | % | |
| 568.81 | % | |
| 517.83 | % |
| Allowance for credit losses to
non-performing assets | |
| 155.13 | % | |
| 157.00 | % | |
| 138.49 | % | |
| 87.59 | % | |
| 193.21 | % | |
| 473.12 | % | |
| 539.79 | % | |
| 212.40 | % |
| Non-performing and 90 day past
due loans to total loans | |
| 0.39 | % | |
| 0.59 | % | |
| 0.70 | % | |
| 1.14 | % | |
| 0.32 | % | |
| 0.26 | % | |
| 0.23 | % | |
| 0.26 | % |
| Non-performing loans and 90 day
past due loans to total assets | |
| 0.30 | % | |
| 0.45 | % | |
| 0.53 | % | |
| 0.84 | % | |
| 0.24 | % | |
| 0.19 | % | |
| 0.16 | % | |
| 0.17 | % |
| Non-accrual loans to total loans | |
| 0.33 | % | |
| 0.56 | % | |
| 0.66 | % | |
| 1.13 | % | |
| 0.28 | % | |
| 0.25 | % | |
| 0.22 | % | |
| 0.25 | % |
| Non-performing assets to total
assets | |
| 0.59 | % | |
| 0.60 | % | |
| 0.69 | % | |
| 1.07 | % | |
| 0.47 | % | |
| 0.44 | % | |
| 0.39 | % | |
| 0.41 | % |
| (Dollars in thousands - Unaudited) | |
December 31,
2024 | | |
September 30,
2024 | | |
June 30,
2024 | | |
March 31,
2024 | | |
December 31,
2023 | |
| Assets | |
| | | |
| | | |
| | | |
| | | |
| | |
| Cash and due from banks | |
$ | 77,020 | | |
$ | 61,140 | | |
$ | 43,635 | | |
$ | 85,578 | | |
$ | 48,343 | |
| Interest bearing deposits in banks | |
| 1,307 | | |
| 1,252 | | |
| 1,457 | | |
| 1,354 | | |
| 1,410 | |
| Cash and cash equivalents | |
| 78,327 | | |
| 62,392 | | |
| 45,092 | | |
| 86,932 | | |
| 49,753 | |
| Investment securities – available for sale (at fair value) | |
| 94,494 | | |
| 93,160 | | |
| 92,954 | | |
| 95,580 | | |
| 97,169 | |
| Investment securities – held to maturity (at cost) | |
| 175,497 | | |
| 174,054 | | |
| 174,197 | | |
| 183,136 | | |
| 214,297 | |
| Restricted investment in bank stock, at cost | |
| 5,768 | | |
| 5,765 | | |
| 3,395 | | |
| 3,390 | | |
| 5,250 | |
| Loans held for sale | |
| 806 | | |
| 232 | | |
| 447 | | |
| 175 | | |
| 443 | |
| Loans | |
| 1,480,793 | | |
| 1,447,883 | | |
| 1,422,975 | | |
| 1,412,327 | | |
| 1,406,667 | |
| Unearned fees | |
| (442 | ) | |
| (333 | ) | |
| (306 | ) | |
| (314 | ) | |
| (340 | ) |
| Allowance for credit losses | |
| (18,170 | ) | |
| (18,010 | ) | |
| (17,923 | ) | |
| (17,982 | ) | |
| (17,480 | ) |
| Net loans | |
| 1,462,181 | | |
| 1,429,540 | | |
| 1,404,746 | | |
| 1,394,031 | | |
| 1,388,847 | |
| Premises and equipment, net | |
| 30,081 | | |
| 30,704 | | |
| 29,688 | | |
| 30,268 | | |
| 31,459 | |
| Goodwill and other intangible assets | |
| 11,773 | | |
| 11,856 | | |
| 11,938 | | |
| 12,021 | | |
| 12,103 | |
| Bank owned life insurance | |
| 48,952 | | |
| 48,608 | | |
| 48,267 | | |
| 47,933 | | |
| 47,607 | |
| Deferred tax assets | |
| 9,989 | | |
| 9,357 | | |
| 11,214 | | |
| 10,736 | | |
| 11,948 | |
| Other real estate owned, net | |
| 3,062 | | |
| 2,860 | | |
| 2,978 | | |
| 4,402 | | |
| 4,493 | |
| Operating lease asset | |
| 1,204 | | |
| 1,163 | | |
| 1,230 | | |
| 1,299 | | |
| 1,367 | |
| Pension asset | |
| 17,824 | | |
| 16,268 | | |
| 12,850 | | |
| 13,022 | | |
| 11,208 | |
| Accrued interest receivable and other assets | |
| 33,064 | | |
| 30,167 | | |
| 29,603 | | |
| 30,028 | | |
| 29,916 | |
| Total Assets | |
$ | 1,973,022 | | |
$ | 1,916,126 | | |
$ | 1,868,599 | | |
$ | 1,912,953 | | |
$ | 1,905,860 | |
| Liabilities and Shareholders’ Equity | |
| | | |
| | | |
| | | |
| | | |
| | |
| Liabilities: | |
| | | |
| | | |
| | | |
| | | |
| | |
| Non-interest bearing deposits | |
$ | 426,737 | | |
$ | 419,437 | | |
$ | 423,970 | | |
$ | 422,759 | | |
$ | 427,670 | |
| Interest bearing deposits | |
| 1,148,092 | | |
| 1,120,958 | | |
| 1,113,101 | | |
| 1,140,694 | | |
| 1,123,307 | |
| Total deposits | |
| 1,574,829 | | |
| 1,540,395 | | |
| 1,537,071 | | |
| 1,563,453 | | |
| 1,550,977 | |
| Short-term borrowings | |
| 65,409 | | |
| 50,206 | | |
| 62,564 | | |
| 79,494 | | |
| 45,418 | |
| Long-term borrowings | |
| 120,929 | | |
| 120,929 | | |
| 70,929 | | |
| 70,929 | | |
| 110,929 | |
| Operating lease liability | |
| 1,384 | | |
| 1,343 | | |
| 1,412 | | |
| 1,484 | | |
| 1,556 | |
| Allowance for credit loss on off balance sheet exposures | |
| 863 | | |
| 856 | | |
| 801 | | |
| 858 | | |
| 873 | |
| Accrued interest payable and other liabilities | |
| 28,889 | | |
| 26,994 | | |
| 30,352 | | |
| 29,925 | | |
| 32,904 | |
| Dividends payable | |
| 1,424 | | |
| 1,424 | | |
| 1,293 | | |
| 1,329 | | |
| 1,330 | |
| Total Liabilities | |
| 1,793,727 | | |
| 1,742,147 | | |
| 1,704,422 | | |
$ | 1,747,472 | | |
| 1,743,987 | |
| Shareholders’ Equity: | |
| | | |
| | | |
| | | |
| | | |
| | |
| Common Stock – par value $0.01 per share; Authorized 25,000,000 shares; issued and outstanding 6,471,096 shares at December 31, 2024 and 6,639,888 at December 31, 2023 | |
| 65 | | |
| 65 | | |
| 65 | | |
| 66 | | |
| 66 | |
| Surplus | |
| 20,476 | | |
| 20,288 | | |
| 20,280 | | |
| 23,865 | | |
| 23,734 | |
| Retained earnings | |
| 189,002 | | |
| 184,239 | | |
| 179,892 | | |
| 176,272 | | |
| 173,900 | |
| Accumulated other comprehensive loss | |
| (30,248 | ) | |
| (30,613 | ) | |
| (36,060 | ) | |
| (34,722 | ) | |
| (35,827 | ) |
| Total Shareholders’ Equity | |
| 179,295 | | |
| 173,979 | | |
| 164,177 | | |
| 165,481 | | |
| 161,873 | |
| Total Liabilities and Shareholders’ Equity | |
$ | 1,973,022 | | |
$ | 1,916,126 | | |
$ | 1,868,599 | | |
$ | 1,912,953 | | |
$ | 1,905,860 | |
| | |
| | |
2024 | | |
| | |
2023 | |
| | |
Year
to Date | | |
Q4 | | |
Q3 | | |
Q2 | | |
Q1 | | |
Year
to Date | | |
Q4 | | |
Q3 | | |
Q2 | | |
Q1 | |
| In thousands | |
(Unaudited) | |
| Interest income | |
| | | |
| | | |
| | | |
| | | |
| | | |
| | | |
| | | |
| | | |
| | | |
| | |
| Interest and fees on loans | |
$ | 81,756 | | |
$ | 21,299 | | |
$ | 21,018 | | |
$ | 20,221 | | |
$ | 19,218 | | |
$ | 69,569 | | |
$ | 19,290 | | |
$ | 18,055 | | |
$ | 16,780 | | |
$ | 15,444 | |
| Interest on investment securities | |
| | | |
| | | |
| | | |
| | | |
| | | |
| — | | |
| | | |
| | | |
| | | |
| | |
| Taxable | |
| 6,760 | | |
| 1,672 | | |
| 1,647 | | |
| 1,697 | | |
| 1,744 | | |
| 7,173 | | |
| 1,834 | | |
| 1,792 | | |
| 1,779 | | |
| 1,768 | |
| Exempt from
federal income tax | |
| 209 | | |
| 47 | | |
| 56 | | |
| 53 | | |
| 53 | | |
| 714 | | |
| 53 | | |
| 123 | | |
| 268 | | |
| 270 | |
| Total investment income | |
| 6,969 | | |
| 1,719 | | |
| 1,703 | | |
| 1,750 | | |
| 1,797 | | |
| 7,887 | | |
| 1,887 | | |
| 1,915 | | |
| 2,047 | | |
| 2,038 | |
| Other | |
| 3,268 | | |
| 707 | | |
| 536 | | |
| 1,142 | | |
| 883 | | |
| 3,700 | | |
| 1,014 | | |
| 1,194 | | |
| 1,145 | | |
| 347 | |
| Total interest
income | |
| 91,993 | | |
| 23,725 | | |
| 23,257 | | |
| 23,113 | | |
| 21,898 | | |
| 81,156 | | |
| 22,191 | | |
| 21,164 | | |
| 19,972 | | |
| 17,829 | |
| Interest expense | |
| | | |
| | | |
| | | |
| | | |
| | | |
| | | |
| | | |
| | | |
| | | |
| | |
| Interest on deposits | |
| 25,828 | | |
| 6,585 | | |
| 6,579 | | |
| 6,398 | | |
| 6,266 | | |
| 19,198 | | |
| 6,498 | | |
| 5,672 | | |
| 4,350 | | |
| 2,678 | |
| Interest on short-term borrowings | |
| 1,477 | | |
| 40 | | |
| 467 | | |
| 509 | | |
| 461 | | |
| 147 | | |
| 54 | | |
| 33 | | |
| 29 | | |
| 31 | |
| Interest
on long-term borrowings | |
| 4,710 | | |
| 1,400 | | |
| 983 | | |
| 968 | | |
| 1,359 | | |
| 4,941 | | |
| 1,445 | | |
| 1,475 | | |
| 1,419 | | |
| 602 | |
| Total interest
expense | |
| 32,015 | | |
| 8,025 | | |
| 8,029 | | |
| 7,875 | | |
| 8,086 | | |
| 24,286 | | |
| 7,997 | | |
| 7,180 | | |
| 5,798 | | |
| 3,311 | |
| Net interest income | |
| 59,978 | | |
| 15,700 | | |
| 15,228 | | |
| 15,238 | | |
| 13,812 | | |
| 56,870 | | |
| 14,194 | | |
| 13,984 | | |
| 14,174 | | |
| 14,518 | |
| Credit loss expense/(credit) | |
| | | |
| | | |
| | | |
| | | |
| | | |
| | | |
| | | |
| | | |
| | | |
| | |
| Loans | |
| 2,929 | | |
| 522 | | |
| 195 | | |
| 1,251 | | |
| 961 | | |
| 1,700 | | |
| 530 | | |
| 322 | | |
| 434 | | |
| 414 | |
| Debt securities held to maturity | |
| 14 | | |
| — | | |
| 14 | | |
| — | | |
| — | | |
| 45 | | |
| — | | |
| 45 | | |
| — | | |
| — | |
| Off balance
sheet credit exposures | |
| (10 | ) | |
| 7 | | |
| 55 | | |
| (57 | ) | |
| (15 | ) | |
| (125 | ) | |
| (111 | ) | |
| (104 | ) | |
| (39 | ) | |
| 129 | |
| Provision
for credit losses | |
| 2,933 | | |
| 529 | | |
| 264 | | |
| 1,194 | | |
| 946 | | |
| 1,620 | | |
| 419 | | |
| 263 | | |
| 395 | | |
| 543 | |
| Net interest
income after provision for credit losses | |
| 57,045 | | |
| 15,171 | | |
| 14,964 | | |
| 14,044 | | |
| 12,866 | | |
| 55,250 | | |
| 13,775 | | |
| 13,721 | | |
| 13,779 | | |
| 13,975 | |
| Other operating income | |
| | | |
| | | |
| | | |
| | | |
| | | |
| | | |
| | | |
| | | |
| | | |
| | |
| Net losses on investments, available
for sale | |
| — | | |
| — | | |
| — | | |
| — | | |
| — | | |
| (4,214 | ) | |
| (4,214 | ) | |
| — | | |
| — | | |
| — | |
| Gains on sale of residential
mortgage loans | |
| 414 | | |
| 132 | | |
| 141 | | |
| 59 | | |
| 82 | | |
| 381 | | |
| 59 | | |
| 182 | | |
| 86 | | |
| 54 | |
| Losses on
disposal of fixed assets | |
| — | | |
| — | | |
| — | | |
| — | | |
| — | | |
| (29 | ) | |
| (29 | ) | |
| — | | |
| — | | |
| — | |
| Net gains/(losses) | |
| 414 | | |
| 132 | | |
| 141 | | |
| 59 | | |
| 82 | | |
| (3,862 | ) | |
| (4,184 | ) | |
| 182 | | |
| 86 | | |
| 54 | |
| Other Income | |
| | | |
| | | |
| | | |
| | | |
| | | |
| | | |
| | | |
| | | |
| | | |
| | |
| Service charges on deposit accounts | |
| 2,220 | | |
| 553 | | |
| 555 | | |
| 556 | | |
| 556 | | |
| 2,198 | | |
| 567 | | |
| 569 | | |
| 546 | | |
| 516 | |
| Other service charges | |
| 887 | | |
| 211 | | |
| 236 | | |
| 225 | | |
| 215 | | |
| 929 | | |
| 223 | | |
| 230 | | |
| 244 | | |
| 232 | |
| Trust department | |
| 9,094 | | |
| 2,323 | | |
| 2,328 | | |
| 2,255 | | |
| 2,188 | | |
| 8,282 | | |
| 2,148 | | |
| 2,139 | | |
| 2,025 | | |
| 1,970 | |
| Debit card income | |
| 4,065 | | |
| 1,134 | | |
| 1,000 | | |
| 999 | | |
| 932 | | |
| 4,101 | | |
| 1,120 | | |
| 995 | | |
| 1,031 | | |
| 955 | |
| Bank owned life insurance | |
| 1,345 | | |
| 345 | | |
| 340 | | |
| 334 | | |
| 326 | | |
| 1,261 | | |
| 325 | | |
| 320 | | |
| 311 | | |
| 305 | |
| Brokerage commissions | |
| 1,449 | | |
| 295 | | |
| 297 | | |
| 362 | | |
| 495 | | |
| 1,160 | | |
| 360 | | |
| 245 | | |
| 258 | | |
| 297 | |
| Other | |
| 351 | | |
| 63 | | |
| 156 | | |
| 51 | | |
| 81 | | |
| 400 | | |
| 50 | | |
| 218 | | |
| 68 | | |
| 64 | |
| Total other
income | |
| 19,411 | | |
| 4,924 | | |
| 4,912 | | |
| 4,782 | | |
| 4,793 | | |
| 18,331 | | |
| 4,793 | | |
| 4,716 | | |
| 4,483 | | |
| 4,339 | |
| Total
other operating income | |
| 19,825 | | |
| 5,056 | | |
| 5,053 | | |
| 4,841 | | |
| 4,875 | | |
| 14,469 | | |
| 609 | | |
| 4,898 | | |
| 4,569 | | |
| 4,393 | |
| Other operating expenses | |
| | | |
| | | |
| | | |
| | | |
| | | |
| | | |
| | | |
| | | |
| | | |
| | |
| Salaries and employee benefits | |
| 28,029 | | |
| 6,456 | | |
| 7,160 | | |
| 7,256 | | |
| 7,157 | | |
| 27,520 | | |
| 6,390 | | |
| 6,964 | | |
| 6,870 | | |
| 7,296 | |
| FDIC premiums | |
| 1,070 | | |
| 260 | | |
| 256 | | |
| 285 | | |
| 269 | | |
| 992 | | |
| 268 | | |
| 254 | | |
| 277 | | |
| 193 | |
| Equipment | |
| 2,675 | | |
| 490 | | |
| 627 | | |
| 635 | | |
| 923 | | |
| 3,157 | | |
| 912 | | |
| 718 | | |
| 747 | | |
| 780 | |
| Occupancy | |
| 2,878 | | |
| 563 | | |
| 709 | | |
| 652 | | |
| 954 | | |
| 3,441 | | |
| 1,169 | | |
| 745 | | |
| 742 | | |
| 785 | |
| Data processing | |
| 5,761 | | |
| 1,688 | | |
| 1,333 | | |
| 1,422 | | |
| 1,318 | | |
| 5,384 | | |
| 1,384 | | |
| 1,388 | | |
| 1,306 | | |
| 1,306 | |
| Marketing | |
| 674 | | |
| 205 | | |
| 151 | | |
| 184 | | |
| 134 | | |
| 833 | | |
| 311 | | |
| 242 | | |
| 160 | | |
| 120 | |
| Professional services | |
| 1,948 | | |
| 536 | | |
| 477 | | |
| 449 | | |
| 486 | | |
| 2,133 | | |
| 631 | | |
| 488 | | |
| 520 | | |
| 494 | |
| Contract labor | |
| 597 | | |
| 181 | | |
| 149 | | |
| 84 | | |
| 183 | | |
| 616 | | |
| 170 | | |
| 155 | | |
| 157 | | |
| 134 | |
| Telephone | |
| 408 | | |
| 99 | | |
| 97 | | |
| 103 | | |
| 109 | | |
| 466 | | |
| 125 | | |
| 115 | | |
| 116 | | |
| 110 | |
| Other real estate owned | |
| 271 | | |
| 47 | | |
| 124 | | |
| 14 | | |
| 86 | | |
| (89 | ) | |
| (370 | ) | |
| 139 | | |
| 18 | | |
| 124 | |
| Investor relations | |
| 293 | | |
| 65 | | |
| 84 | | |
| 91 | | |
| 53 | | |
| 345 | | |
| 65 | | |
| 74 | | |
| 123 | | |
| 83 | |
| Contributions | |
| 234 | | |
| 53 | | |
| 65 | | |
| 66 | | |
| 50 | | |
| 229 | | |
| 12 | | |
| 74 | | |
| 79 | | |
| 64 | |
| Other | |
| 4,802 | | |
| 1,438 | | |
| 1,082 | | |
| 1,123 | | |
| 1,159 | | |
| 5,216 | | |
| 1,242 | | |
| 1,429 | | |
| 1,396 | | |
| 1,149 | |
| Total
other operating expenses | |
| 49,640 | | |
| 12,081 | | |
| 12,314 | | |
| 12,364 | | |
| 12,881 | | |
| 50,243 | | |
| 12,309 | | |
| 12,785 | | |
| 12,511 | | |
| 12,638 | |
| Income before income tax expense | |
| 27,230 | | |
| 8,146 | | |
| 7,703 | | |
| 6,521 | | |
| 4,860 | | |
| 19,476 | | |
| 2,075 | | |
| 5,834 | | |
| 5,837 | | |
| 5,730 | |
| Provision
for income tax expense | |
| 6,661 | | |
| 1,960 | | |
| 1,932 | | |
| 1,607 | | |
| 1,162 | | |
| 4,416 | | |
| 317 | | |
| 1,321 | | |
| 1,423 | | |
| 1,355 | |
| Net
Income | |
$ | 20,569 | | |
$ | 6,186 | | |
$ | 5,771 | | |
$ | 4,914 | | |
$ | 3,698 | | |
$ | 15,060 | | |
$ | 1,758 | | |
$ | 4,513 | | |
$ | 4,414 | | |
$ | 4,375 | |
| Basic net income per common share | |
$ | 3.15 | | |
$ | 0.95 | | |
$ | 0.89 | | |
$ | 0.75 | | |
$ | 0.56 | | |
$ | 2.25 | | |
$ | 0.26 | | |
$ | 0.67 | | |
$ | 0.66 | | |
$ | 0.66 | |
| Diluted net income per common
share | |
$ | 3.15 | | |
$ | 0.95 | | |
$ | 0.89 | | |
$ | 0.75 | | |
$ | 0.56 | | |
$ | 2.24 | | |
$ | 0.26 | | |
$ | 0.67 | | |
$ | 0.66 | | |
$ | 0.65 | |
| Weighted average number of basic shares outstanding | |
| 6,527 | | |
| 6,470 | | |
| 6,468 | | |
| 6,527 | | |
| 6,642 | | |
| 6,649 | | |
| 6,649 | | |
| 6,714 | | |
| 6,704 | | |
| 6,675 | |
| Weighted average number of diluted shares outstanding | |
| 6,540 | | |
| 6,484 | | |
| 6,482 | | |
| 6,537 | | |
| 6,655 | | |
| 6,663 | | |
| 6,663 | | |
| 6,728 | | |
| 6,718 | | |
| 6,697 | |
| Dividends declared per common share | |
$ | 0.84 | | |
$ | 0.22 | | |
$ | 0.22 | | |
$ | 0.20 | | |
$ | 0.20 | | |
$ | 0.80 | | |
$ | 0.20 | | |
$ | 0.20 | | |
$ | 0.20 | | |
$ | 0.20 | |
Non-GAAP Financial Measures (unaudited)
Reconciliation of as reported (GAAP) and non-GAAP financial measures
The following tables below provide a reconciliation of certain financial measures calculated under generally accepted accounting principles ("GAAP") (as reported) and non-GAAP. A non-GAAP financial measure is a numerical measure of historical or future financial performance, financial position or cash flows that excludes or includes amounts that are required to be disclosed in the most directly comparable measure calculated and presented in accordance with GAAP in the United States. The Company’s management believes the presentation of non-GAAP financial measures provide investors with a greater understanding of the Company’s operating results in addition to the results measured in accordance with GAAP. While management uses these non-GAAP measures in its analysis of the Company’s performance, this information should not be viewed as a substitute for financial results determined in accordance with GAAP or considered to be more important than financial results determined in accordance with GAAP.
The following non-GAAP financial measures exclude losses on the sale of Available for Sale Securities and accelerated depreciation expenses related to the branch closures.
| | |
Three months ended
December 31, | | |
Twelve months ended
December 31, | |
| | |
2024 | | |
2023 | | |
2024 | | |
2023 | |
| (in thousands, except for per share amount) | |
| | |
| | |
| | |
| |
| Net income - as reported | |
$ | 6,186 | | |
$ | 1,758 | | |
$ | 20,569 | | |
$ | 15,060 | |
| Adjustments: | |
| | | |
| | | |
| | | |
| | |
| | |
| - | | |
| 4,214 | | |
| - | | |
| 4,214 | |
| Accelerated depreciation expenses | |
| — | | |
| 623 | | |
| 562 | | |
| 623 | |
| Income tax effect of adjustments | |
| — | | |
| (1,097 | ) | |
| (137 | ) | |
| (1,097 | ) |
| Adjusted net income (non-GAAP) | |
$ | 6,186 | | |
$ | 5,498 | | |
$ | 20,994 | | |
$ | 18,800 | |
| | |
| | | |
| | | |
| | | |
| | |
| Diluted earnings per share - as reported | |
$ | 0.95 | | |
$ | 0.26 | | |
$ | 3.15 | | |
$ | 2.24 | |
| Adjustments: | |
| | | |
| | | |
| | | |
| | |
| Loss on sale of securities | |
| — | | |
| 0.63 | | |
| — | | |
| 0.63 | |
| Accelerated depreciation expenses | |
| — | | |
| 0.09 | | |
| 0.08 | | |
| 0.09 | |
| Income tax effect of adjustments | |
| — | | |
| (0.16 | ) | |
| (0.02 | ) | |
| (0.16 | ) |
| Adjusted diluted earnings per share (non-GAAP) | |
$ | 0.95 | | |
$ | 0.82 | | |
$ | 3.21 | | |
$ | 2.80 | |
| | |
As of or for the three months ended | | |
As of or for the twelve months ended | |
| | |
December 31, | | |
December 31, | |
| (in thousands, except per share data) | |
2024 | | |
2023 | | |
2024 | | |
2023 | |
| Per Share Data | |
| | |
| | |
| | |
| |
| Basic net income per share (1) - as reported | |
$ | 0.95 | | |
$ | 0.26 | | |
$ | 3.15 | | |
$ | 2.25 | |
| Basic net income per share (1) - non-GAAP | |
| 0.95 | | |
| 0.82 | | |
| 3.21 | | |
| 2.81 | |
| Diluted net income per share (1) - as reported | |
$ | 0.95 | | |
$ | 0.26 | | |
$ | 3.15 | | |
$ | 2.24 | |
| Diluted net income per share (1) - non-GAAP | |
| 0.95 | | |
| 0.82 | | |
| 3.21 | | |
| 2.80 | |
| Basic book value per share | |
$ | 27.71 | | |
$ | 24.38 | | |
| | | |
| | |
| Diluted book value per share | |
$ | 27.65 | | |
$ | 24.33 | | |
| | | |
| | |
| Significant Ratios: | |
As of or for the twelve months ended | |
| | |
December 31, | |
| Return on Average Assets (1) - as reported | |
| 1.06 | % | |
| 0.78 | % |
| Loss on sale of securities | |
| - | % | |
| 0.22 | % |
| Accelerated depreciation expenses | |
| 0.03 | % | |
| 0.03 | % |
| Income tax effect of adjustments | |
| (0.01 | )% | |
| (0.06 | )% |
| Adjusted Return on Average Assets (1) (non-GAAP) | |
| 1.08 | % | |
| 0.97 | % |
| | |
| | | |
| | |
| Return on Average Equity (1) - as reported | |
| 12.16 | % | |
| 9.68 | % |
| Loss on sale of securities | |
| - | % | |
| 2.71 | % |
| Accelerated depreciation expenses | |
| 0.34 | % | |
| 0.40 | % |
| Income tax effect of adjustments | |
| (0.08 | )% | |
| (0.71 | )% |
| Adjusted Return on Average Equity (1) (non-GAAP) | |
| 12.42 | % | |
| 12.08 | % |
(1) See reconcilation of this non-GAAP financial measure provided elsewhere herein.
| | |
Three Months Ended | |
| | |
December 31 | |
| | |
2024 | | |
2023 | |
| (dollars in thousands) | |
Average
Balance | | |
Interest | | |
Average
Yield/Rate | | |
Average
Balance | | |
Interest | | |
Average
Yield/Rate | |
| Assets | |
| | |
| | |
| | |
| | |
| | |
| |
| Loans | |
$ | 1,452,332 | | |
$ | 21,313 | | |
| 5.84 | % | |
$ | 1,398,393 | | |
$ | 19,308 | | |
| 5.48 | % |
| Investment Securities: | |
| | | |
| | | |
| | | |
| | | |
| | | |
| | |
| Taxable | |
| 275,785 | | |
| 1,672 | | |
| 2.41 | % | |
| 332,545 | | |
| 1,834 | | |
| 2.19 | % |
| Non taxable | |
| 6,758 | | |
| 86 | | |
| 5.06 | % | |
| 8,107 | | |
| 96 | | |
| 4.70 | % |
| Total | |
| 282,543 | | |
| 1,758 | | |
| 2.48 | % | |
| 340,652 | | |
| 1,930 | | |
| 2.25 | % |
| Federal funds sold | |
| 56,552 | | |
| 628 | | |
| 4.42 | % | |
| 60,400 | | |
| 907 | | |
| 5.96 | % |
| Interest-bearing deposits with other banks | |
| 3,138 | | |
| 16 | | |
| 2.03 | % | |
| 1,867 | | |
| 22 | | |
| 4.68 | % |
| Other interest earning assets | |
| 5,767 | | |
| 63 | | |
| 4.35 | % | |
| 5,251 | | |
| 85 | | |
| 6.42 | % |
| Total earning assets | |
| 1,800,332 | | |
| 23,778 | | |
| 5.25 | % | |
| 1,806,563 | | |
| 22,252 | | |
| 4.89 | % |
| Allowance for credit losses | |
| (18,199 | ) | |
| | | |
| | | |
| (17,304 | ) | |
| | | |
| | |
| Non-earning assets | |
| 162,438 | | |
| | | |
| | | |
| 194,309 | | |
| | | |
| | |
| Total Assets | |
$ | 1,944,571 | | |
| | | |
| | | |
$ | 1,983,568 | | |
| | | |
| | |
| Liabilities and Shareholders’ Equity | |
| | | |
| | | |
| | | |
| | | |
| | | |
| | |
| Interest-bearing demand deposits | |
$ | 388,451 | | |
$ | 1,747 | | |
| 1.79 | % | |
$ | 366,450 | | |
$ | 1,440 | | |
| 1.56 | % |
| Interest-bearing money markets - retail | |
| 446,230 | | |
| 3,721 | | |
| 3.32 | % | |
| 365,439 | | |
| 3,135 | | |
| 3.40 | % |
| Interest-bearing money markets - brokered | |
| 110 | | |
| 1 | | |
| 3.62 | % | |
| — | | |
| — | | |
| — | % |
| Savings deposits | |
| 172,342 | | |
| 45 | | |
| 0.10 | % | |
| 196,777 | | |
| 51 | | |
| 0.10 | % |
| Time deposits - retail | |
| 143,424 | | |
| 1,071 | | |
| 2.97 | % | |
| 163,253 | | |
| 1,122 | | |
| 2.73 | % |
| Time deposits - brokered | |
| — | | |
| — | | |
| — | % | |
| 56,006 | | |
| 751 | | |
| 5.32 | % |
| Short-term borrowings | |
| 12,797 | | |
| 40 | | |
| 1.24 | % | |
| 43,693 | | |
| 55 | | |
| 0.50 | % |
| Long-term borrowings | |
| 120,928 | | |
| 1,400 | | |
| 4.61 | % | |
| 110,929 | | |
| 1,445 | | |
| 5.17 | % |
| Total interest-bearing liabilities | |
| 1,284,282 | | |
| 8,025 | | |
| 2.49 | % | |
| 1,302,547 | | |
| 7,999 | | |
| 2.44 | % |
| Non-interest-bearing deposits | |
| 449,878 | | |
| | | |
| | | |
| 487,012 | | |
| | | |
| | |
| Other liabilities | |
| 33,904 | | |
| | | |
| | | |
| 35,957 | | |
| | | |
| | |
| Shareholders’ Equity | |
| 176,507 | | |
| | | |
| | | |
| 158,052 | | |
| | | |
| | |
| Total Liabilities and Shareholders’ Equity | |
$ | 1,944,571 | | |
| | | |
| | | |
$ | 1,983,568 | | |
| | | |
| | |
| Net interest income and spread | |
| | | |
$ | 15,753 | | |
| 2.76 | % | |
| | | |
$ | 14,253 | | |
| 2.45 | % |
| Net interest margin | |
| | | |
| | | |
| 3.48 | % | |
| | | |
| | | |
| 3.13 | % |
| | |
Twelve Months Ended | |
| | |
December 31, | |
| | |
2024 | | |
2023 | |
| (dollars in thousands) | |
Average
Balance | | |
Interest | | |
Average
Yield/
Rate | | |
Average
Balance | | |
Interest | | |
Average
Yield/
Rate | |
| Assets | |
| | |
| | |
| | |
| | |
| | |
| |
| Loans | |
$ | 1,427,351 | | |
$ | 81,819 | | |
| 5.73 | % | |
$ | 1,340,118 | | |
$ | 69,631 | | |
| 5.20 | % |
| Investment Securities: | |
| | | |
| | | |
| | | |
| | | |
| | | |
| | |
| Taxable | |
| 285,661 | | |
| 6,760 | | |
| 2.37 | % | |
| 335,888 | | |
| 7,173 | | |
| 2.14 | % |
| Non taxable | |
| 7,538 | | |
| 375 | | |
| 4.97 | % | |
| 18,471 | | |
| 1,279 | | |
| 6.92 | % |
| Total | |
| 293,199 | | |
| 7,135 | | |
| 2.43 | % | |
| 354,359 | | |
| 8,452 | | |
| 2.39 | % |
| Federal funds sold | |
| 55,117 | | |
| 2,874 | | |
| 5.21 | % | |
| 65,131 | | |
| 3,409 | | |
| 5.23 | % |
| Interest-bearing deposits with other banks | |
| 2,009 | | |
| 91 | | |
| 4.53 | % | |
| 2,585 | | |
| 93 | | |
| 3.60 | % |
| Other interest earning assets | |
| 4,565 | | |
| 303 | | |
| 6.64 | % | |
| 4,048 | | |
| 198 | | |
| 4.89 | % |
| Total earning assets | |
| 1,782,241 | | |
| 92,222 | | |
| 5.17 | % | |
| 1,766,241 | | |
| 81,782 | | |
| 4.63 | % |
| Allowance for loan losses | |
| (18,064 | ) | |
| | | |
| | | |
| (16,561 | ) | |
| | | |
| | |
| Non-earning assets | |
| 182,548 | | |
| | | |
| | | |
| 199,474 | | |
| | | |
| | |
| Total Assets | |
$ | 1,946,725 | | |
| | | |
| | | |
$ | 1,949,154 | | |
| | | |
| | |
| Liabilities and Shareholders’ Equity | |
| | | |
| | | |
| | | |
| | | |
| | | |
| | |
| Interest-bearing demand deposits | |
$ | 368,725 | | |
| 6,288 | | |
| 1.71 | % | |
$ | 362,070 | | |
$ | 4,814 | | |
| 1.33 | % |
| Interest-bearing money markets - retail | |
| 413,353 | | |
| 14,287 | | |
| 3.46 | % | |
| 333,274 | | |
| 8,672 | | |
| 2.60 | % |
| Interest-bearing money markets - brokered | |
| 55 | | |
| 3 | | |
| 5.45 | % | |
| — | | |
| — | | |
| — | % |
| Savings deposits | |
| 180,393 | | |
| 183 | | |
| 0.10 | % | |
| 219,516 | | |
| 240 | | |
| 0.11 | % |
| Time deposits - retail | |
| 147,193 | | |
| 4,226 | | |
| 2.87 | % | |
| 141,921 | | |
| 2,872 | | |
| 2.02 | % |
| Time deposits - brokered | |
| 15,697 | | |
| 841 | | |
| 5.36 | % | |
| 49,209 | | |
| 2,600 | | |
| 5.28 | % |
| Short-term borrowings | |
| 58,444 | | |
| 1,477 | | |
| 2.53 | % | |
| 47,968 | | |
| 147 | | |
| 0.31 | % |
| Long-term borrowings | |
| 92,213 | | |
| 4,710 | | |
| 5.11 | % | |
| 94,271 | | |
| 4,941 | | |
| 5.24 | % |
| Total interest-bearing liabilities | |
| 1,276,073 | | |
| 32,015 | | |
| 2.51 | % | |
| 1,248,229 | | |
| 24,286 | | |
| 1.95 | % |
| Non-interest-bearing deposits | |
| 468,137 | | |
| | | |
| | | |
| 512,496 | | |
| | | |
| | |
| Other liabilities | |
| 33,326 | | |
| | | |
| | | |
| 32,320 | | |
| | | |
| | |
| Shareholders’ Equity | |
| 169,189 | | |
| | | |
| | | |
| 156,109 | | |
| | | |
| | |
| Total Liabilities and Shareholders’ Equity | |
$ | 1,946,725 | | |
| | | |
| | | |
$ | 1,949,154 | | |
| | | |
| | |
| Net interest income and spread | |
| | | |
$ | 60,207 | | |
| 2.66 | % | |
| | | |
$ | 57,496 | | |
| 2.68 | % |
| Net interest margin | |
| | | |
| | | |
| 3.38 | % | |
| | | |
| | | |
| 3.26 | % |
Exhibit 99.2

INVESTOR PRESENTATION Fourth Quarter 2024 MyBank.com
2 Forward looking statements This presentation contains forward - looking statements as defined by the Private Securities Litigation Reform Act of 1995 . Forward - looking statements do not represent historical facts, but are statements about management's beliefs, plans and objectives about the future, as well as its assumptions and judgments concerning such beliefs, plans and objectives . These statements are evidenced by terms such as "anticipate," "estimate," "should," "expect," "believe," "intend," and similar expressions . Although these statements reflect management's good faith beliefs and projections, they are not guarantees of future performance and they may not prove true . The beliefs, plans and objectives on which forward - looking statements are based involve risks and uncertainties that could cause actual results to differ materially from those addressed in the forward - looking statements . For a discussion of these risks and uncertainties, see the section of the periodic reports that First United Corporation files with the Securities and Exchange Commission entitled "Risk Factors . Whether actual results will conform to expectations and predictions is subject to known and unknown risks and uncertainties . Actual results could be materially different from management’s expectations . This presentation should be read in conjunction with our Annual Report on Form 10 - K, as amended, for the year ended December 31 , 2023 , including the sections of the report entitled “Risk Factors”, as well as the reports and other documents that we subsequently file with the Securities and Exchange Commission (“SEC”), which are available on the SEC’s website at www . sec . gov or at our website at www . mybank . com . Except as required by law, we do not intend to publish updates or revisions of any forward - looking statements we make to reflect new information, future events or otherwise .
3 Table of Contents I. II. III. Corporate Overview Financial Performance Appendices Pg. 4 Pg. 10 Pg. 32
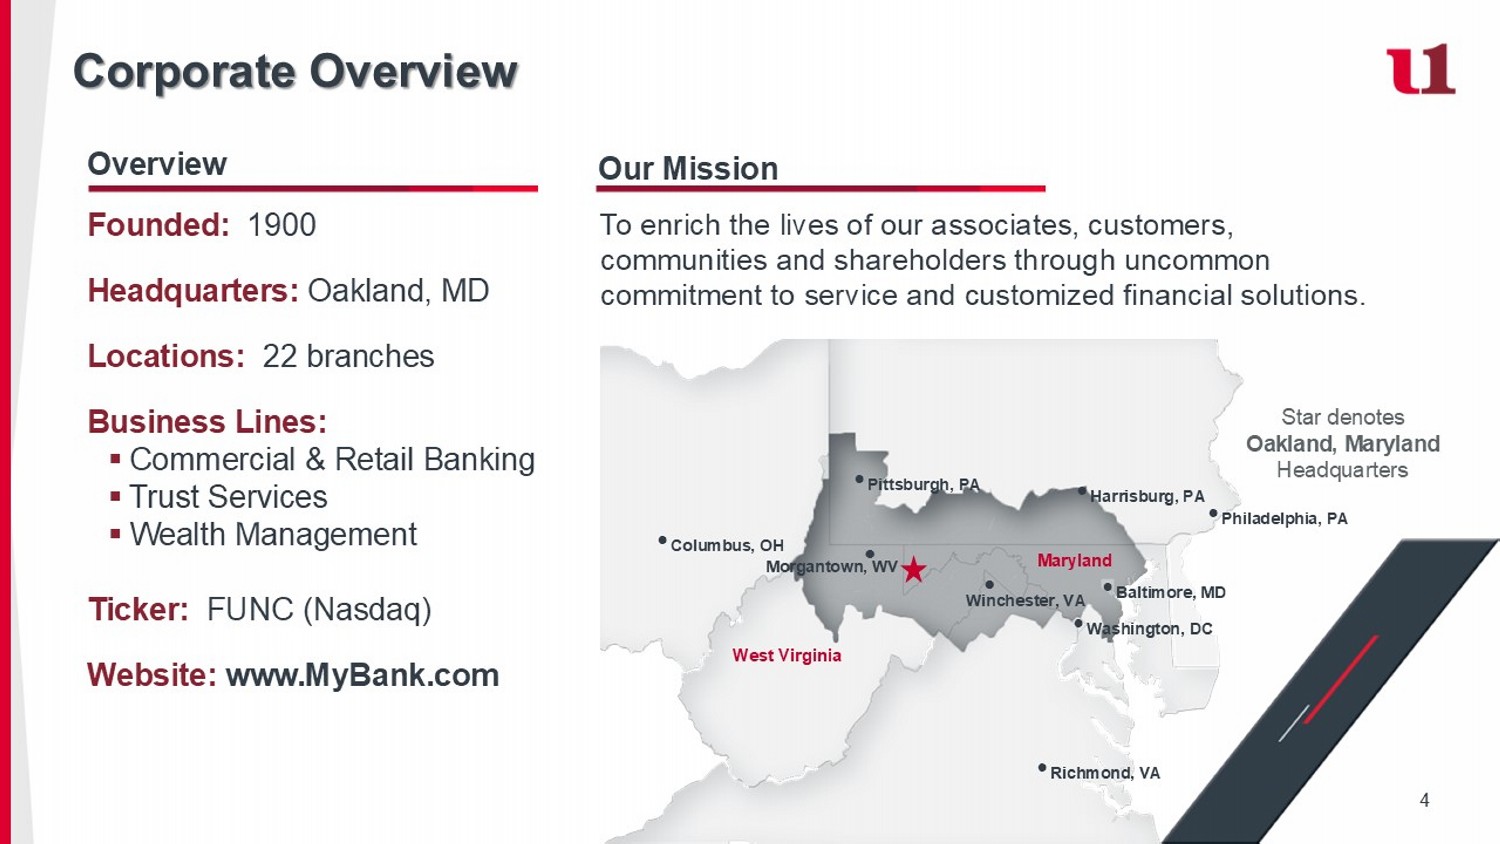
4 Our Mission To enrich the lives of our associates, customers, communities and shareholders through uncommon commitment to service and customized financial solutions. Corporate Overview Founded: 1900 Headquarters: Oakland, MD Locations: 22 branches Business Lines: ▪ Commercial & Retail Banking ▪ Trust Services ▪ Wealth Management Ticker: FUNC (Nasdaq) Website: www.MyBank.com Overview West Virginia Maryland • Pittsburgh, PA • Washington, DC • Columbus, OH • Baltimore, MD • Richmond, VA Morgantown, WV භ • Philadelphia, PA • Harrisburg, PA Winchester, VA භ Star denotes Oakland, Maryland Headquarters
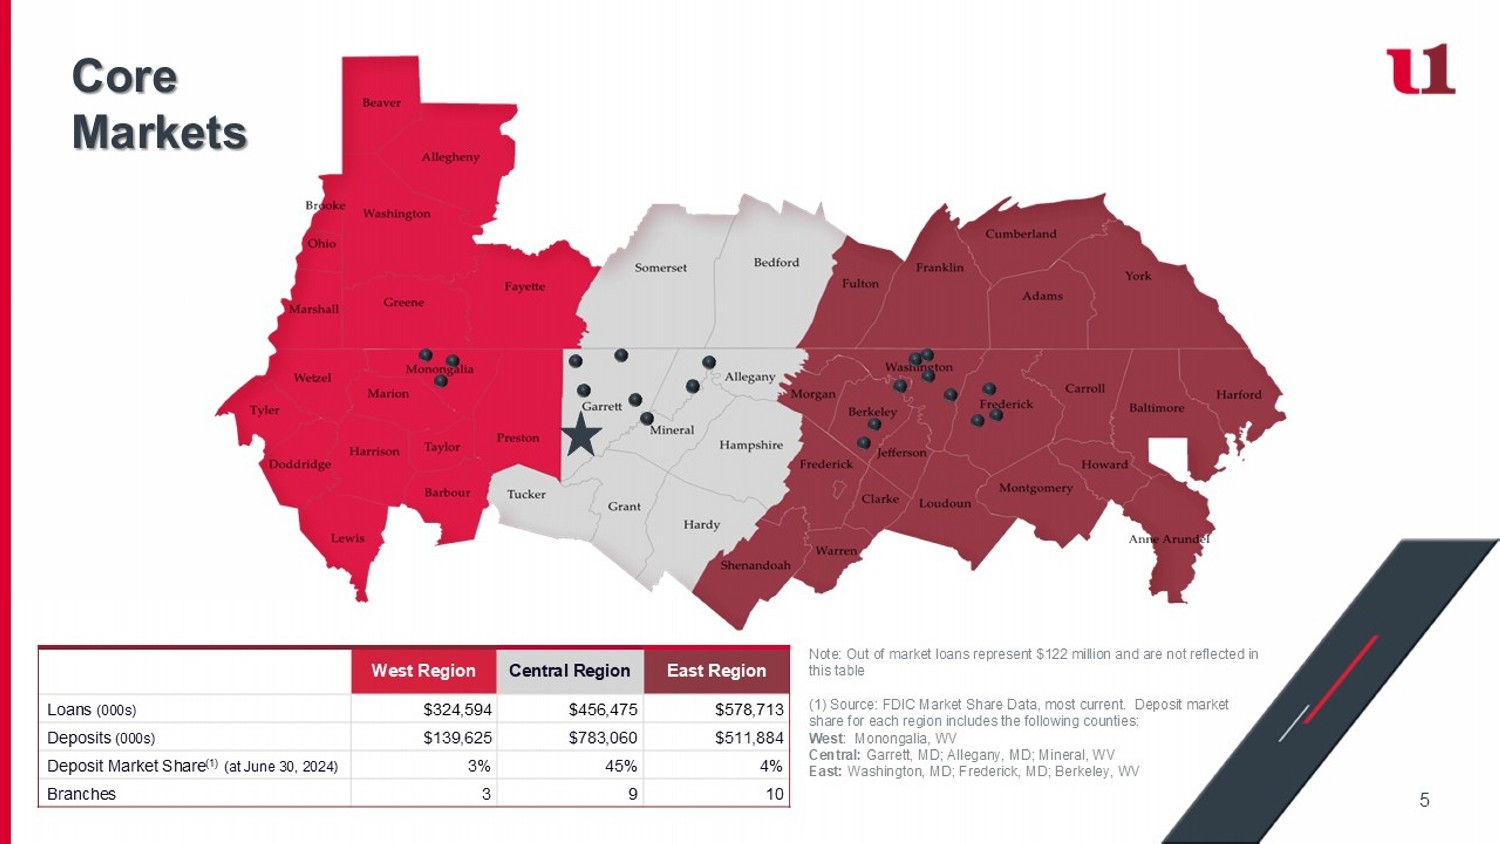
5 East Region Central Region West Region $578,713 $456,475 $324,594 Loans (000s) $511,884 $783,060 $139,625 Deposits (000s) 4% 45% 3% Deposit Market Share (1) (at June 30, 2024) 10 9 3 Branches Note: Out of market loans represent $122 million and are not reflected in this table (1) Source: FDIC Market Share Data, most current. Deposit market share for each region includes the following counties: West : Monongalia, WV Central: Garrett, MD; Allegany, MD; Mineral, WV East: Washington, MD; Frederick, MD; Berkeley, WV Core Markets
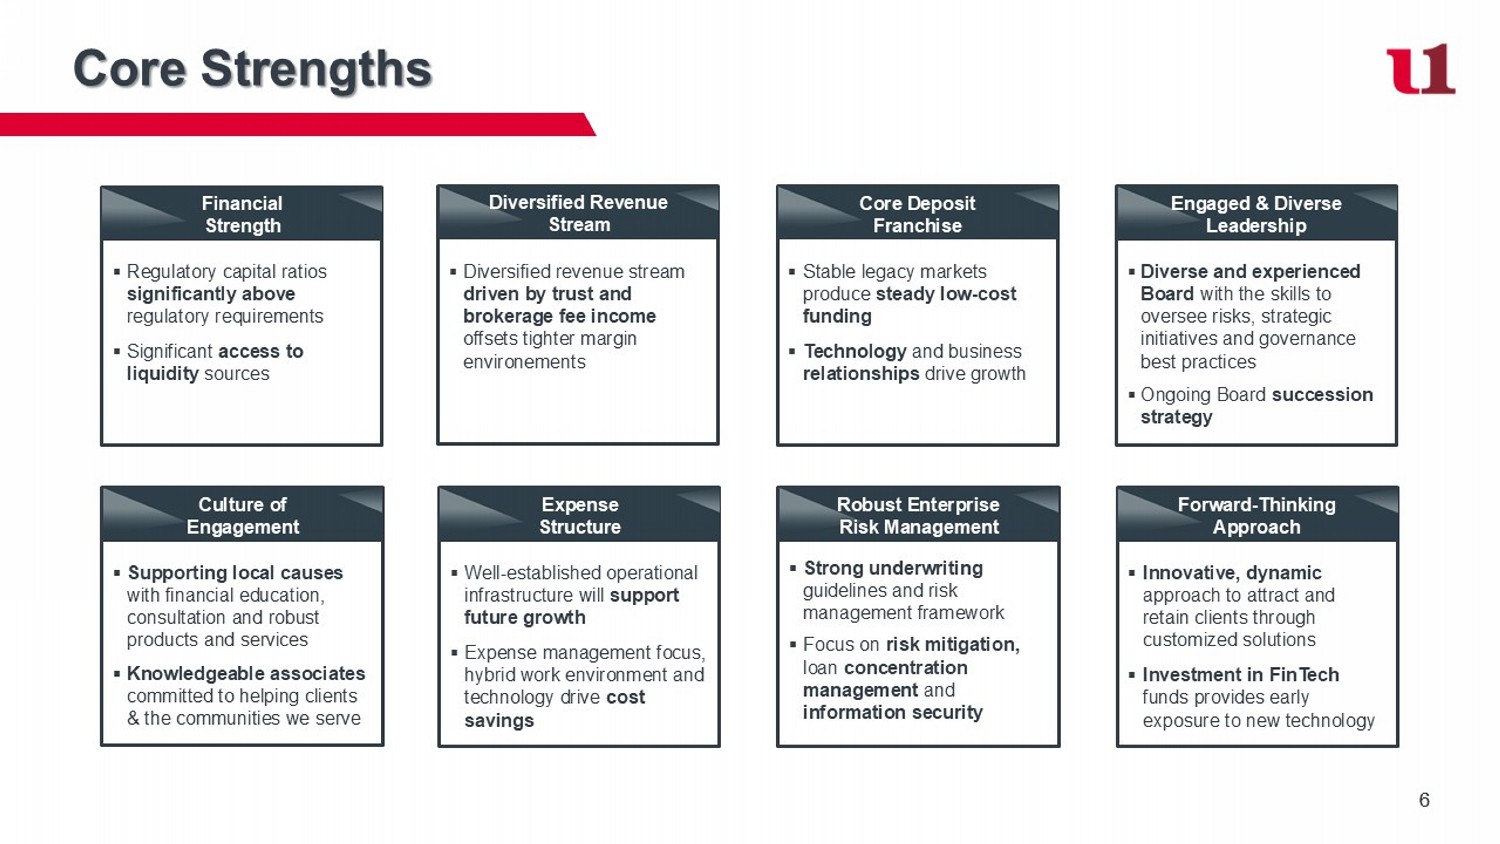
6 6 Core Strengths ▪ Diversified revenue stream driven by trust and brokerage fee income offsets tighter margin environements Diversified Revenue Stream ▪ Stable legacy markets produce steady low - cost funding ▪ Technology and business relationships drive growth Core Deposit Franchise ▪ Diverse and experienced Board with the skills to oversee risks, strategic initiatives and governance best practices ▪ Ongoing Board succession strategy Engaged & Diverse Leadership ▪ Supporting local causes with financial education, consultation and robust products and services ▪ Knowledgeable associates committed to helping clients & the communities we serve Culture of Engagement ▪ Well - established operational infrastructure will support future growth ▪ Expense management focus, hybrid work environment and technology drive cost savings Expense Structure ▪ Strong underwriting guidelines and risk management framework ▪ Focus on risk mitigation, loan concentration management and information security Robust Enterprise Risk Management ▪ Innovative, dynamic approach to attract and retain clients through customized solutions ▪ Investment in FinTech funds provides early exposure to new technology Forward - Thinking Approach ▪ Regulatory capital ratios significantly above regulatory requirements ▪ Significant access to liquidity sources Financial Strength
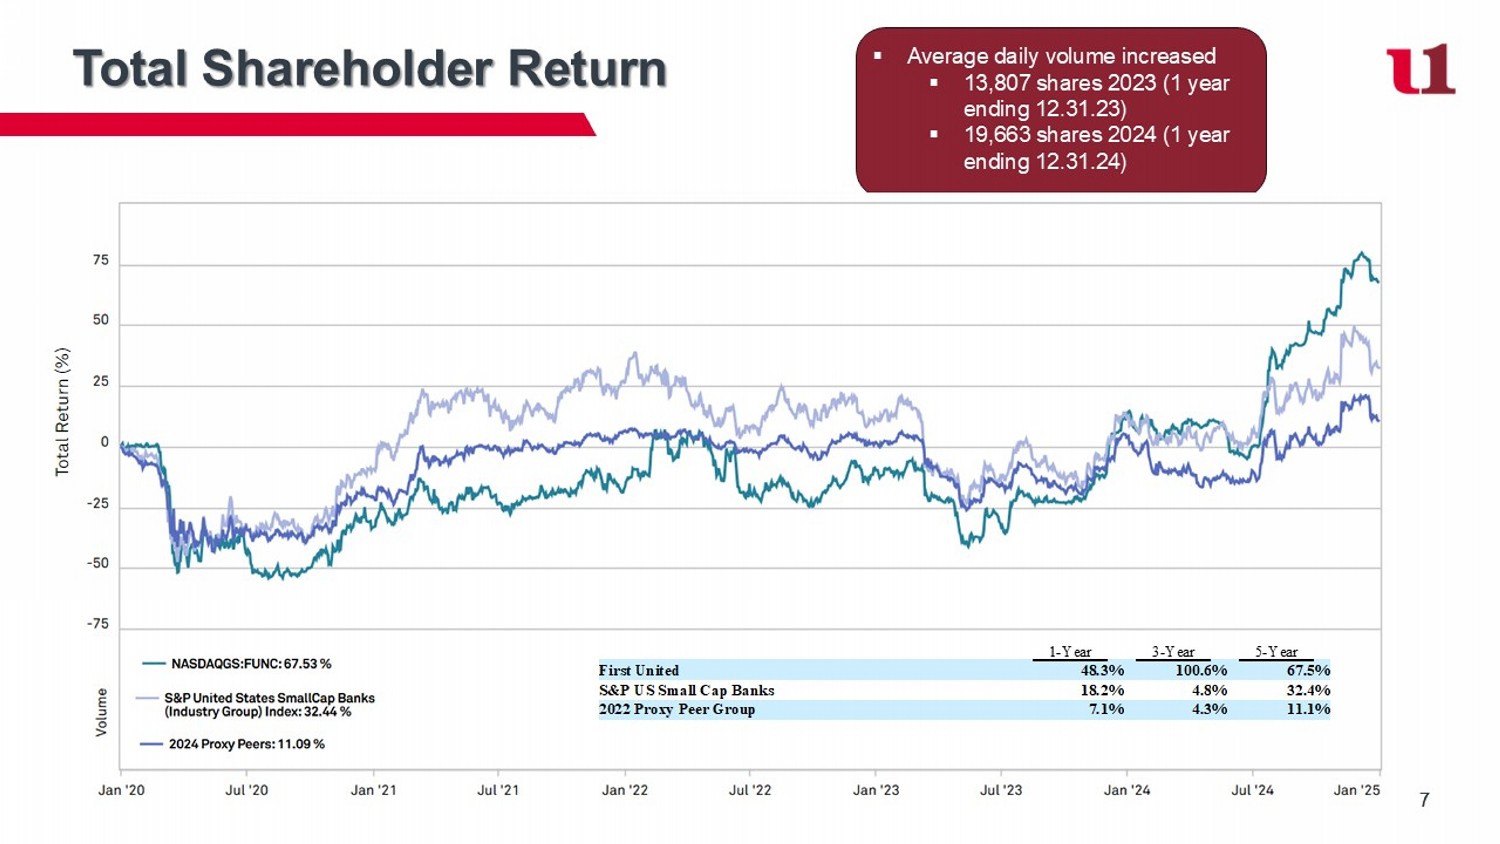
7 7 Total Shareholder Return ▪ Average daily volume increased ▪ 13,807 shares 2023 (1 year ending 12.31.23) ▪ 19,663 shares 2024 (1 year ending 12.31.24) 1-Year 3-Year 5-Year First United 48.3 % 100.6 % 67.5 % S&P US Small Cap Banks 18.2 % 4.8 % 32.4 % 2022 Proxy Peer Group 7.1 % 4.3 % 11.1 %
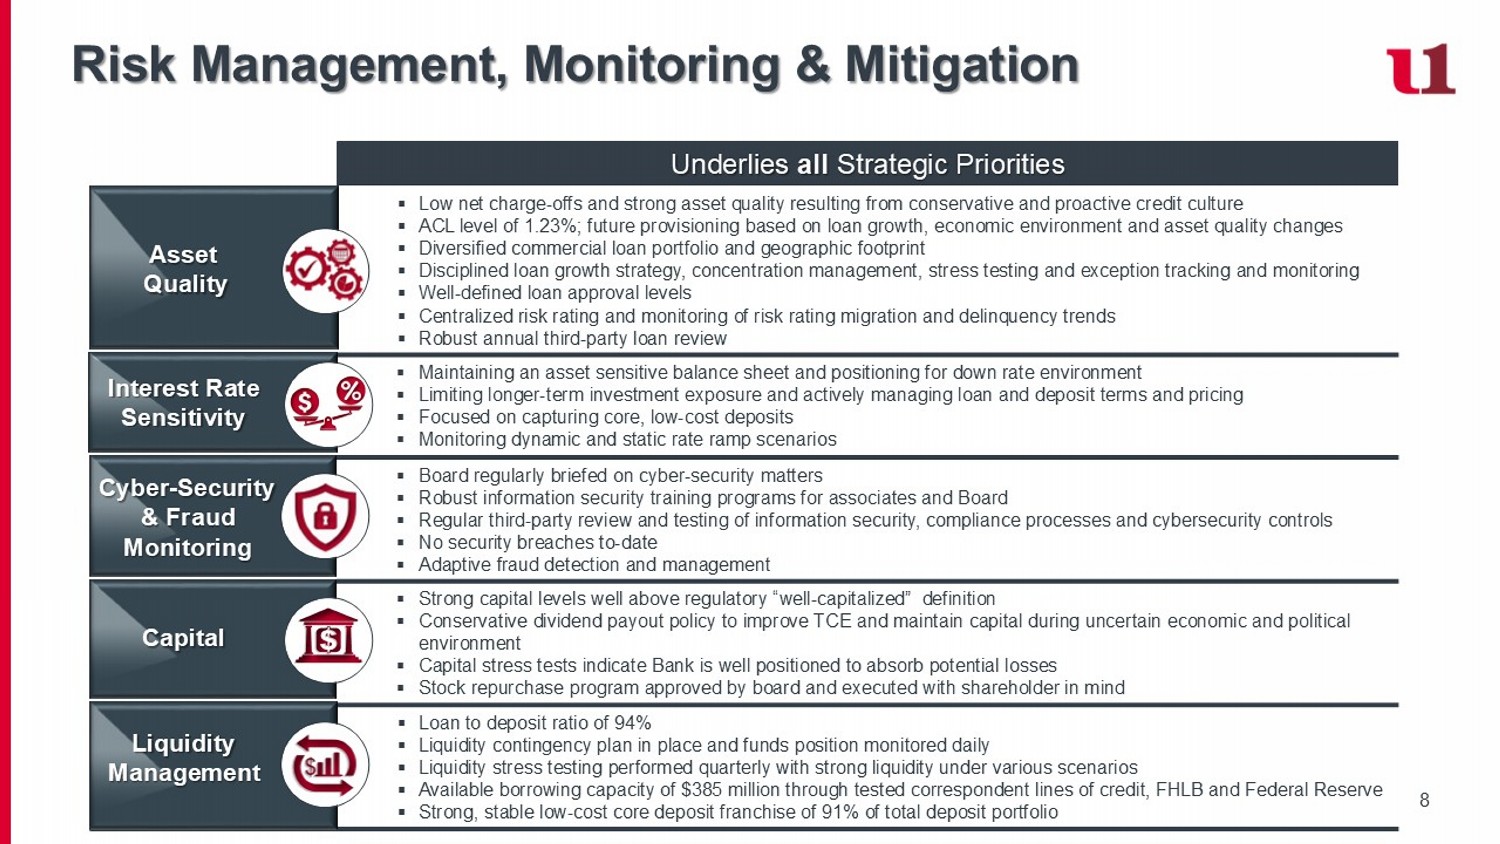
8 Risk Management, Monitoring & Mitigation Underlies all Strategic Priorities ▪ Low net charge - offs and strong asset quality resulting from conservative and proactive credit culture ▪ ACL level of 1.23%; future provisioning based on loan growth, economic environment and asset quality changes ▪ Diversified commercial loan portfolio and geographic footprint ▪ Disciplined loan growth strategy, concentration management, stress testing and exception tracking and monitoring ▪ Well - defined loan approval levels ▪ Centralized risk rating and monitoring of risk rating migration and delinquency trends ▪ Robust annual third - party loan review ▪ Maintaining an asset sensitive balance sheet and positioning for down rate environment ▪ Limiting longer - term investment exposure and actively managing loan and deposit terms and pricing ▪ Focused on capturing core, low - cost deposits ▪ Monitoring dynamic and static rate ramp scenarios ▪ Board regularly briefed on cyber - security matters ▪ Robust information security training programs for associates and Board ▪ Regular third - party review and testing of information security, compliance processes and cybersecurity controls ▪ No security breaches to - date ▪ Adaptive fraud detection and management ▪ Strong capital levels well above regulatory “well - capitalized” definition ▪ Conservative dividend payout policy to improve TCE and maintain capital during uncertain economic and political environment ▪ Capital stress tests indicate Bank is well positioned to absorb potential losses ▪ Stock repurchase program approved by board and executed with shareholder in mind ▪ Loan to deposit ratio of 94% ▪ Liquidity contingency plan in place and funds position monitored daily ▪ Liquidity stress testing performed quarterly with strong liquidity under various scenarios ▪ Available borrowing capacity of $385 million through tested correspondent lines of credit, FHLB and Federal Reserve ▪ Strong, stable low - cost core deposit franchise of 91% of total deposit portfolio Cyber - Security & Fraud Monitoring Asset Quality Capital Liquidity Management Interest Rate Sensitivity
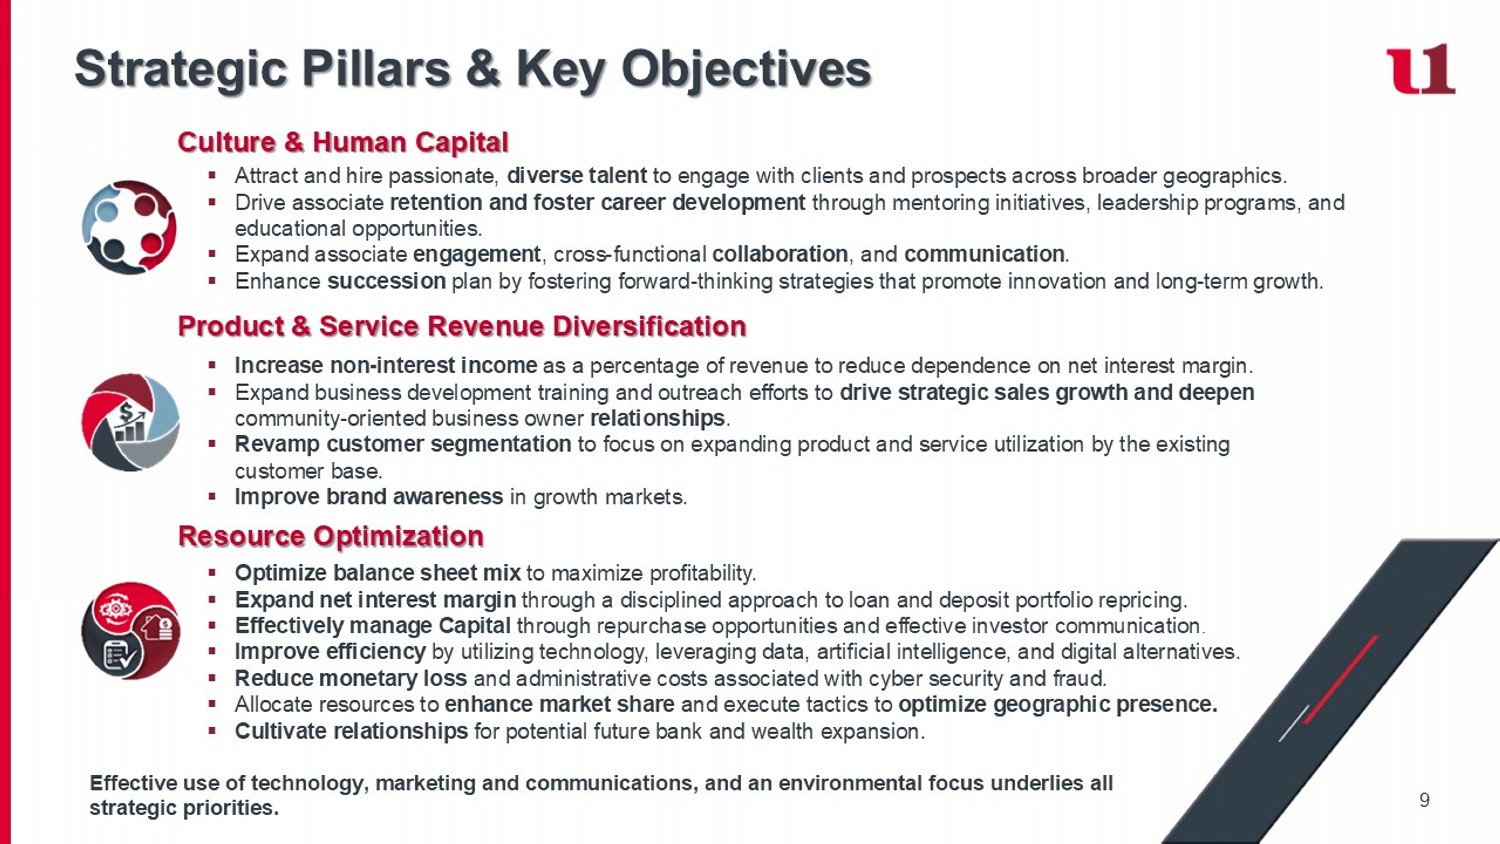
9 Strategic Pillars & Key Objectives Culture & Human Capital ▪ Attract and hire passionate, diverse talent to engage with clients and prospects across broader geographics. ▪ Drive associate retention and foster career development through mentoring initiatives, leadership programs, and educational opportunities. ▪ Expand associate engagement , cross - functional collaboration , and communication . ▪ Enhance succession plan by fostering forward - thinking strategies that promote innovation and long - term growth. Product & Service Revenue Diversification ▪ Increase non - interest income as a percentage of revenue to reduce dependence on net interest margin. ▪ Expand business development training and outreach efforts to drive strategic sales growth and deepen community - oriented business owner relationships . ▪ Revamp customer segmentation to focus on expanding product and service utilization by the existing customer base. ▪ Improve brand awareness in growth markets. Resource Optimization ▪ Optimize balance sheet mix to maximize profitability. ▪ Expand net interest margin through a disciplined approach to loan and deposit portfolio repricing. ▪ Effectively manage Capital through repurchase opportunities and effective investor communication . ▪ Improve efficiency by utilizing technology, leveraging data, artificial intelligence, and digital alternatives. ▪ Reduce monetary loss and administrative costs associated with cyber security and fraud. ▪ Allocate resources to enhance market share and execute tactics to optimize geographic presence. ▪ Cultivate relationships for potential future bank and wealth expansion. Effective use of technology, marketing and communications, and an environmental focus underlies all strategic priorities.
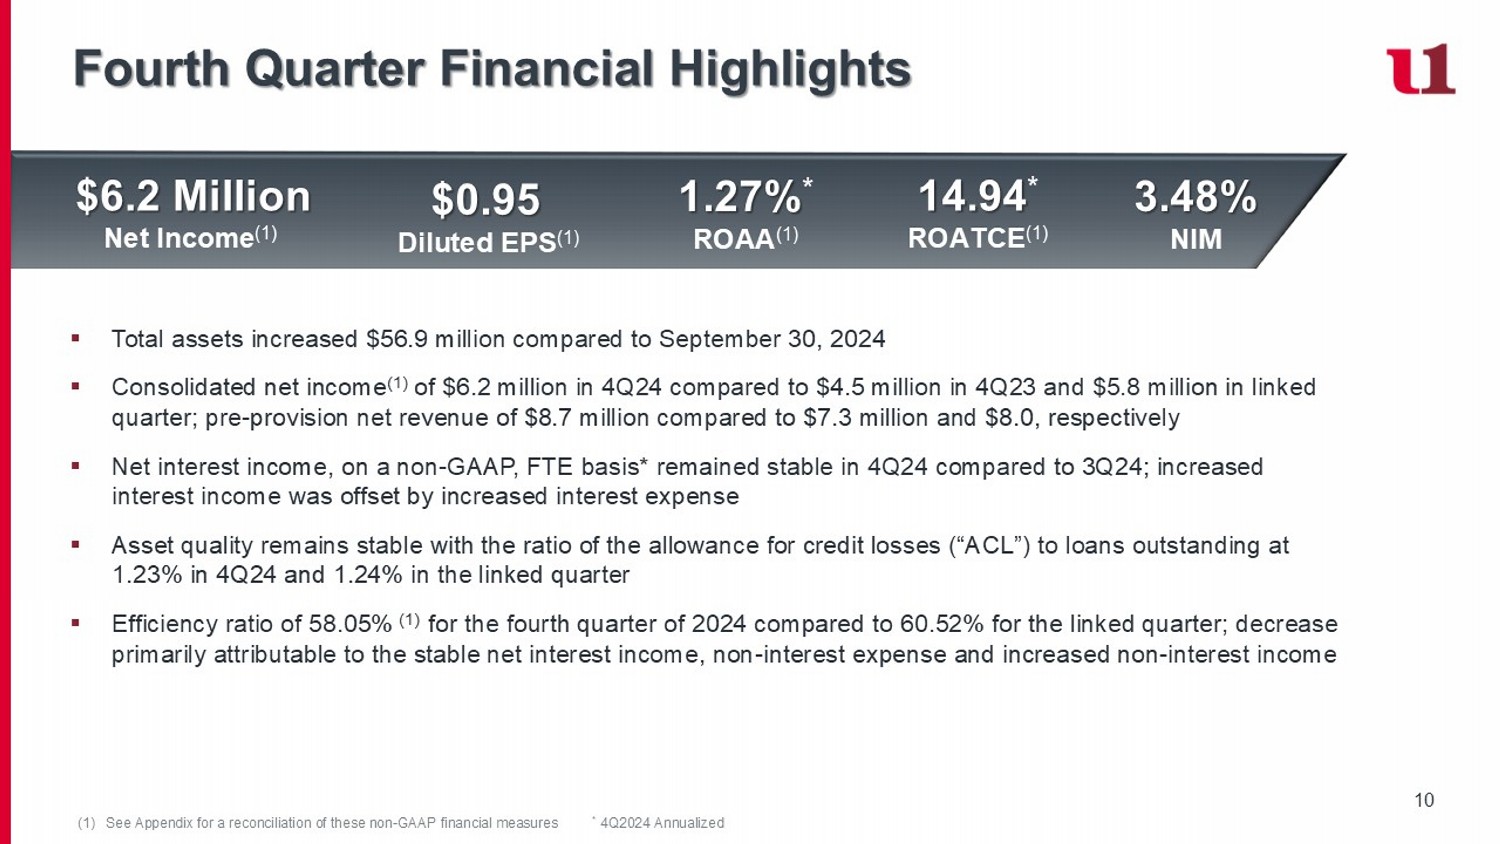
10 Fourth Quarter Financial Highlights $6.2 Million Net Income (1) $0.95 Diluted EPS (1) 1.27% * ROAA (1) 14.94 * ROATCE (1) 3.48% NIM ▪ Total assets increased $56.9 million compared to September 30, 2024 ▪ Consolidated net income (1) of $6.2 million in 4Q24 compared to $4.5 million in 4Q23 and $5.8 million in linked quarter; pre - provision net revenue of $8.7 million compared to $7.3 million and $8.0, respectively ▪ Net interest income, on a non - GAAP, FTE basis* remained stable in 4Q24 compared to 3Q24; increased interest income was offset by increased interest expense ▪ Asset quality remains stable with the ratio of the allowance for credit losses (“ACL”) to loans outstanding at 1.23% in 4Q24 and 1.24% in the linked quarter ▪ Efficiency ratio of 58.05% (1) for the fourth quarter of 2024 compared to 60.52% for the linked quarter; decrease primarily attributable to the stable net interest income, non - interest expense and increased non - interest income (1) See Appendix for a reconciliation of these non - GAAP financial measures * 4Q2024 Annualized
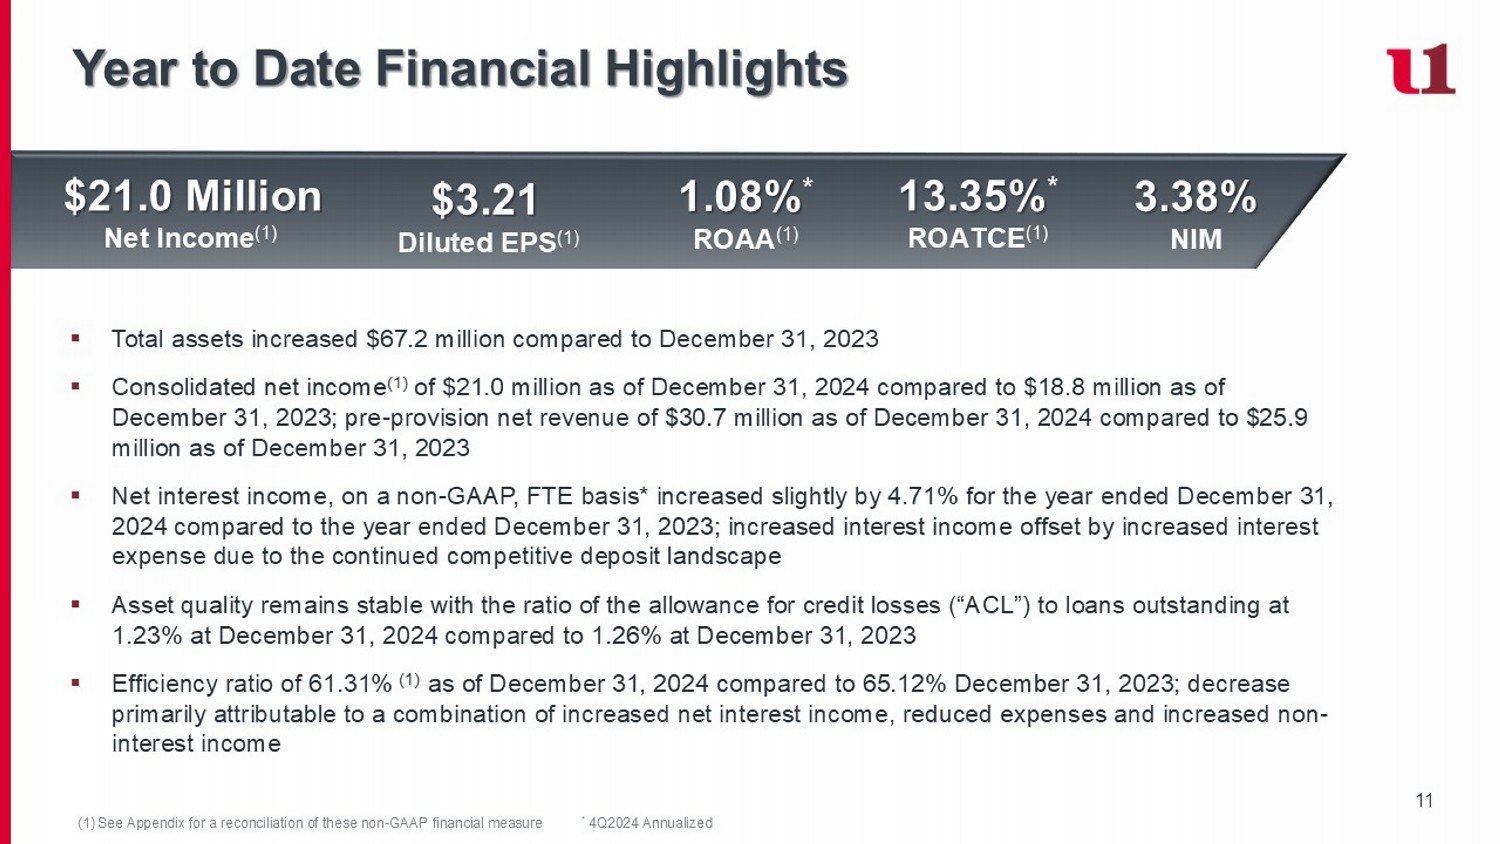
11 Year to Date Financial Highlights $21.0 Million Net Income (1) $3.21 Diluted EPS (1) 1.08% * ROAA (1) 13.35% * ROATCE (1) 3.38% NIM ▪ Total assets increased $67.2 million compared to December 31, 2023 ▪ Consolidated net income (1) of $21.0 million as of December 31, 2024 compared to $18.8 million as of December 31, 2023; pre - provision net revenue of $30.7 million as of December 31, 2024 compared to $25.9 million as of December 31, 2023 ▪ Net interest income, on a non - GAAP, FTE basis* increased slightly by 4.71% for the year ended December 31, 2024 compared to the year ended December 31, 2023; increased interest income o ffset by increased interest expense due to the continued competitive deposit landscape ▪ Asset quality remains stable with the ratio of the allowance for credit losses (“ACL”) to loans outstanding at 1.23% at December 31 , 2024 compared to 1.26% at December 31, 2023 ▪ Efficiency ratio of 61.31% (1) as of December 31, 2024 compared to 65.12% December 31, 2023; decrease primarily attributable to a combination of increased net interest income, reduced expenses and increased non - interest income (1) See Appendix for a reconciliation of these non - GAAP financial measure * 4Q2024 Annualized
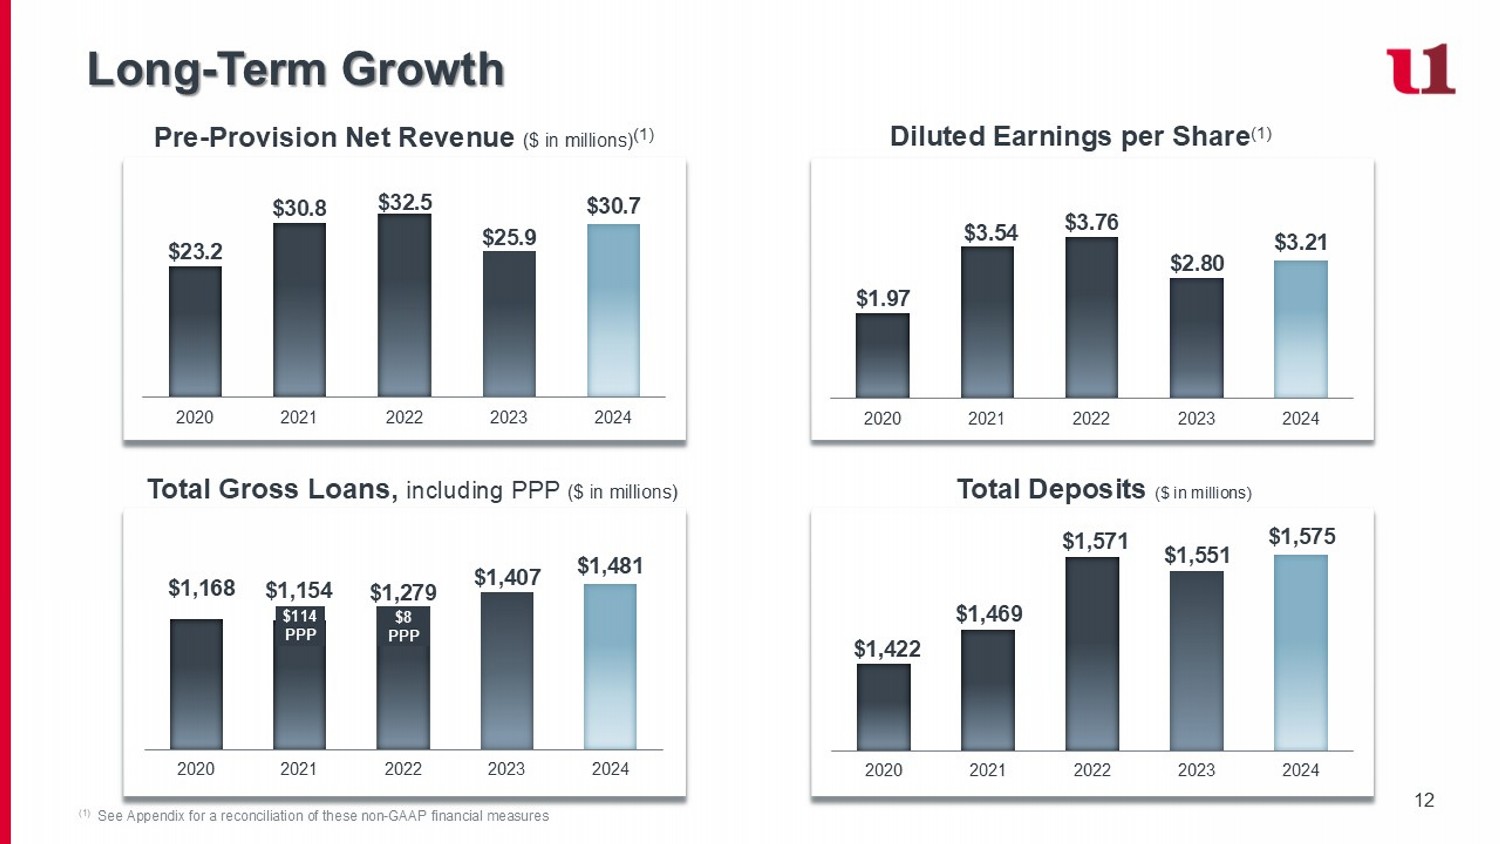
12 Long - Term Growth Pre - Provision Net Revenue ($ in millions) (1) $23.2 $30.8 $32.5 $25.9 $30.7 2020 2021 2022 2023 2024 (1) See Appendix for a reconciliation of these non - GAAP financial measures $1.97 $3.54 $3.76 $2.80 $3.21 2020 2021 2022 2023 2024 Diluted Earnings per Share (1) Total Deposits ($ in millions) $1,422 $1,469 $1,571 $1,551 $1,575 2020 2021 2022 2023 2024 Total Gross Loans, including PPP ($ in millions) $1,168 $1,154 $1,279 $1,407 $1,481 2020 2021 2022 2023 2024 $114 PPP $8 PPP
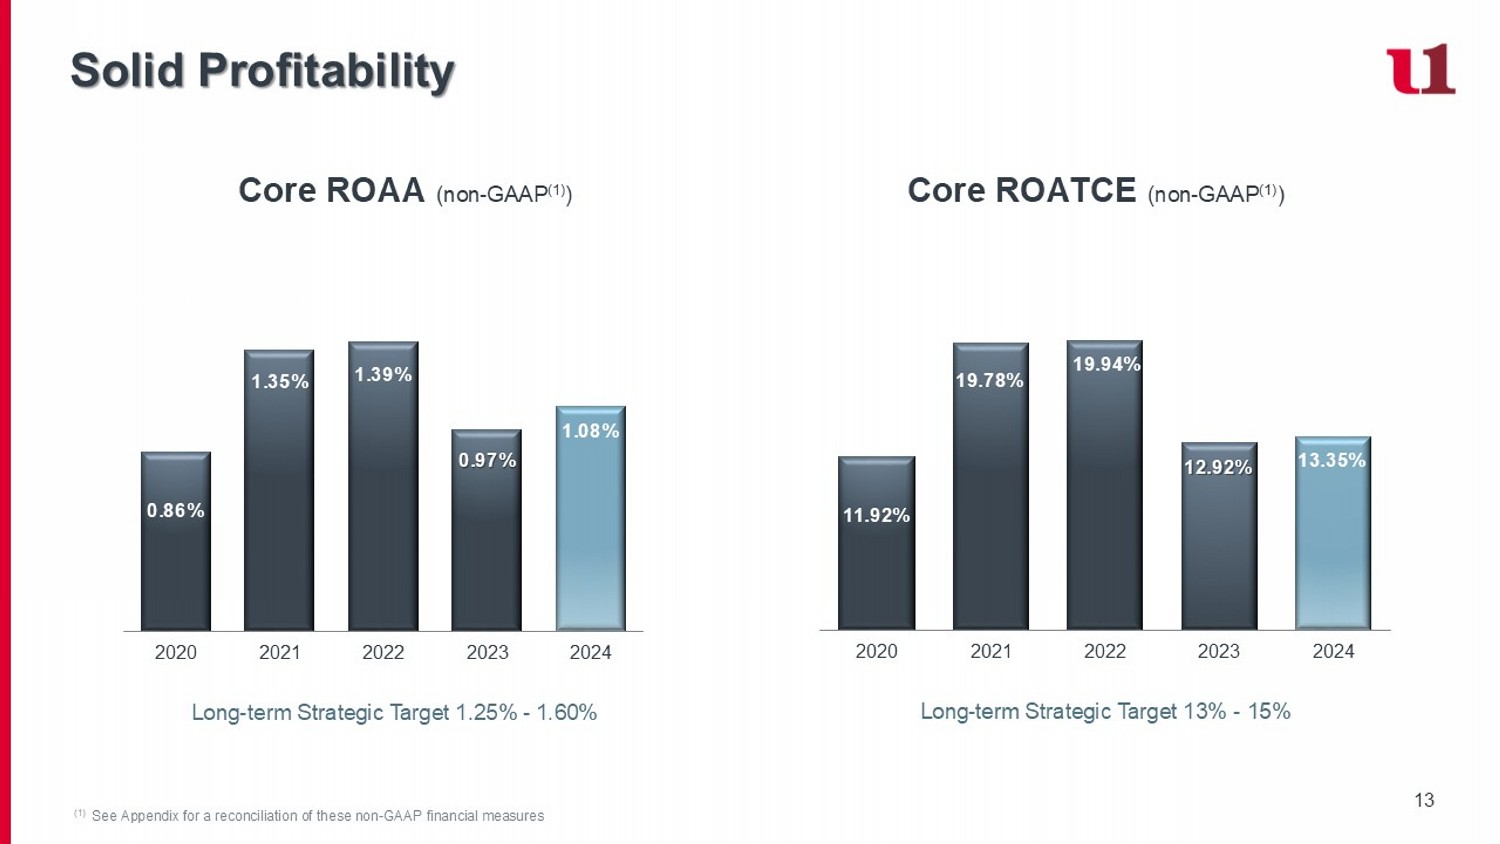
13 Solid Profitability (1) See Appendix for a reconciliation of these non - GAAP financial measures Long - term Strategic Target 13% - 15% Long - term Strategic Target 1.25% - 1.60% Core ROAA (non - GAAP (1) ) Core ROATCE (non - GAAP (1) ) 0.86% 1.35% 1.39% 0.97% 1.08% 2020 2021 2022 2023 2024 11.92% 19.78% 19.94% 12.92% 13.35% 2020 2021 2022 2023 2024
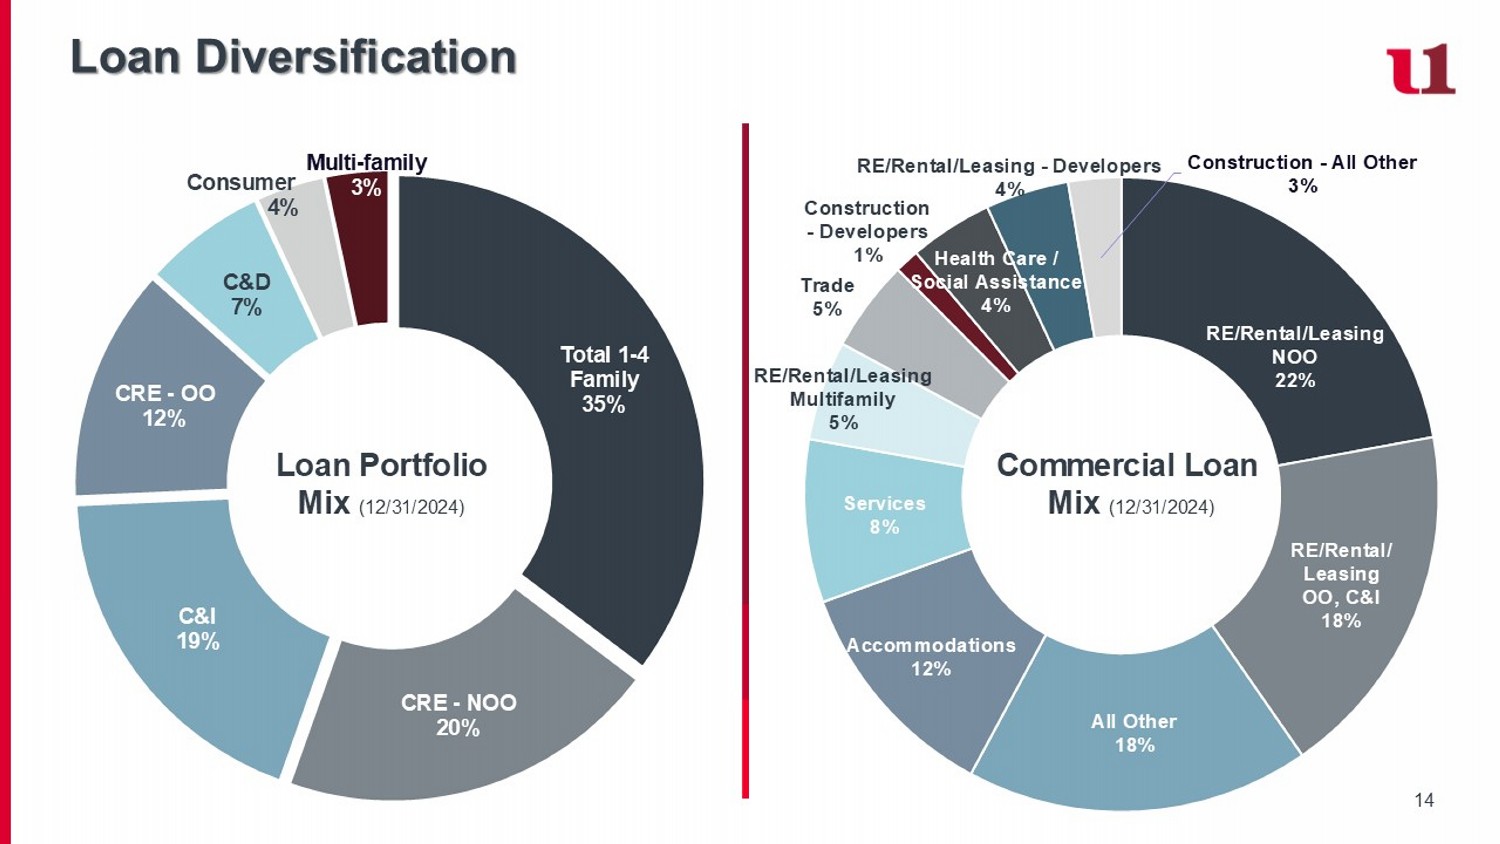
14 Total 1 - 4 Family 35% CRE - NOO 20% C&I 19% CRE - OO 12% C&D 7% Consumer 4% Multi - family 3% Loan Diversification Loan Portfolio Mix (12/31/2024) RE/Rental/Leasing NOO 22% RE/Rental/ Leasing OO, C&I 18% All Other 18% Accommodations 12% Services 8% RE/Rental/Leasing Multifamily 5% Trade 5% Construction - Developers 1% Health Care / Social Assistance 4% RE/Rental/Leasing - Developers 4% Construction - All Other 3% Commercial Loan Mix (12/31/2024)
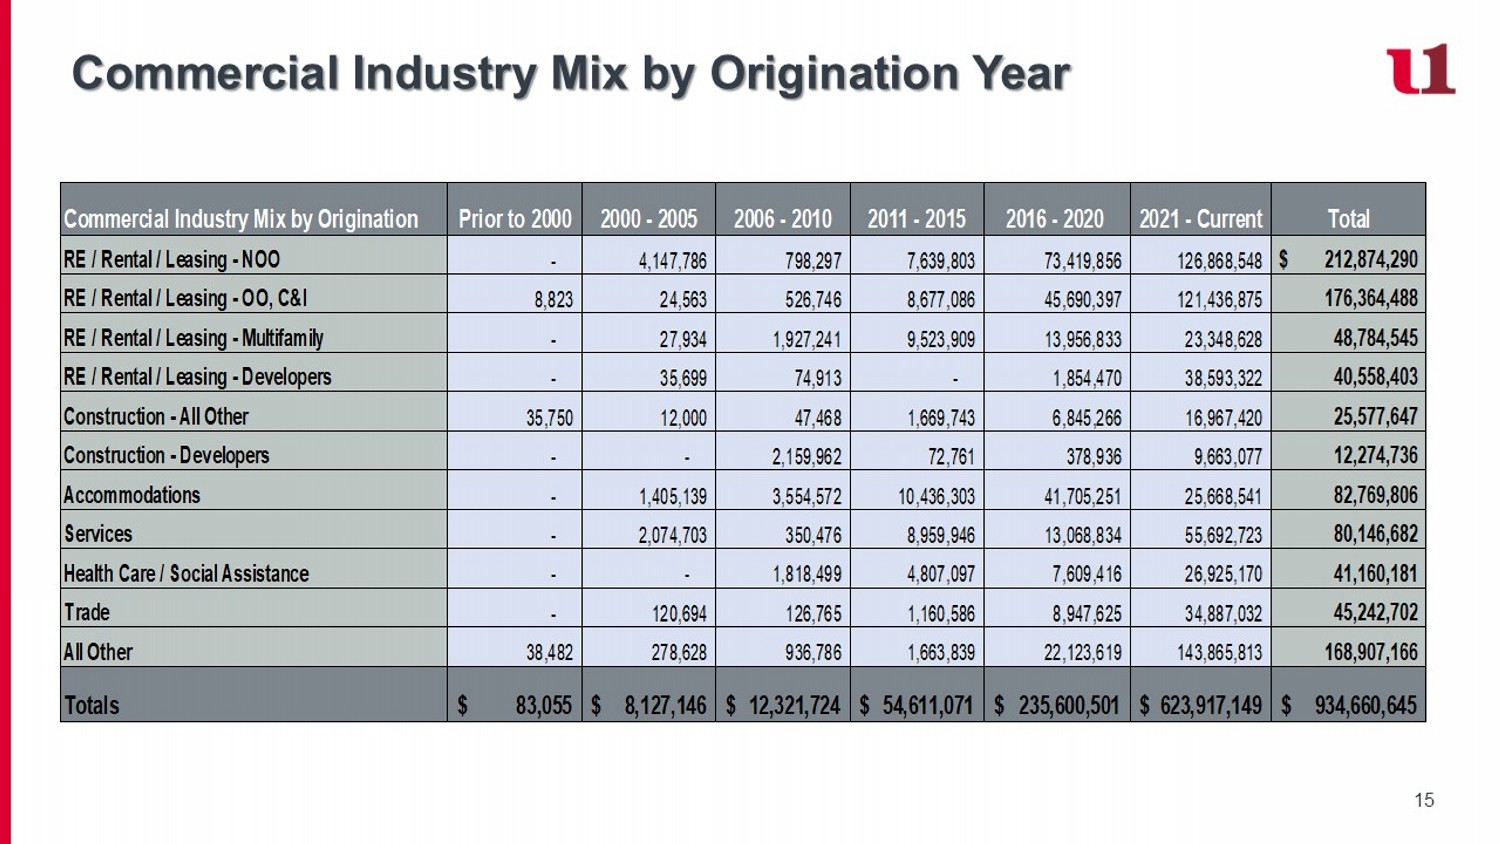
15 Commercial Industry Mix by Origination Year Commercial Industry Mix by Origination Prior to 2000 2000 - 2005 2006 - 2010 2011 - 2015 2016 - 2020 2021 - Current Total RE / Rental / Leasing - NOO - 4,147,786 798,297 7,639,803 73,419,856 126,868,548 212,874,290$ RE / Rental / Leasing - OO, C&I 8,823 24,563 526,746 8,677,086 45,690,397 121,436,875 176,364,488 RE / Rental / Leasing - Multifamily - 27,934 1,927,241 9,523,909 13,956,833 23,348,628 48,784,545 RE / Rental / Leasing - Developers - 35,699 74,913 - 1,854,470 38,593,322 40,558,403 Construction - All Other 35,750 12,000 47,468 1,669,743 6,845,266 16,967,420 25,577,647 Construction - Developers - - 2,159,962 72,761 378,936 9,663,077 12,274,736 Accommodations - 1,405,139 3,554,572 10,436,303 41,705,251 25,668,541 82,769,806 Services - 2,074,703 350,476 8,959,946 13,068,834 55,692,723 80,146,682 Health Care / Social Assistance - - 1,818,499 4,807,097 7,609,416 26,925,170 41,160,181 Trade - 120,694 126,765 1,160,586 8,947,625 34,887,032 45,242,702 All Other 38,482 278,628 936,786 1,663,839 22,123,619 143,865,813 168,907,166 Totals 83,055$ 8,127,146$ 12,321,724$ 54,611,071$ 235,600,501$ 623,917,149$ 934,660,645$
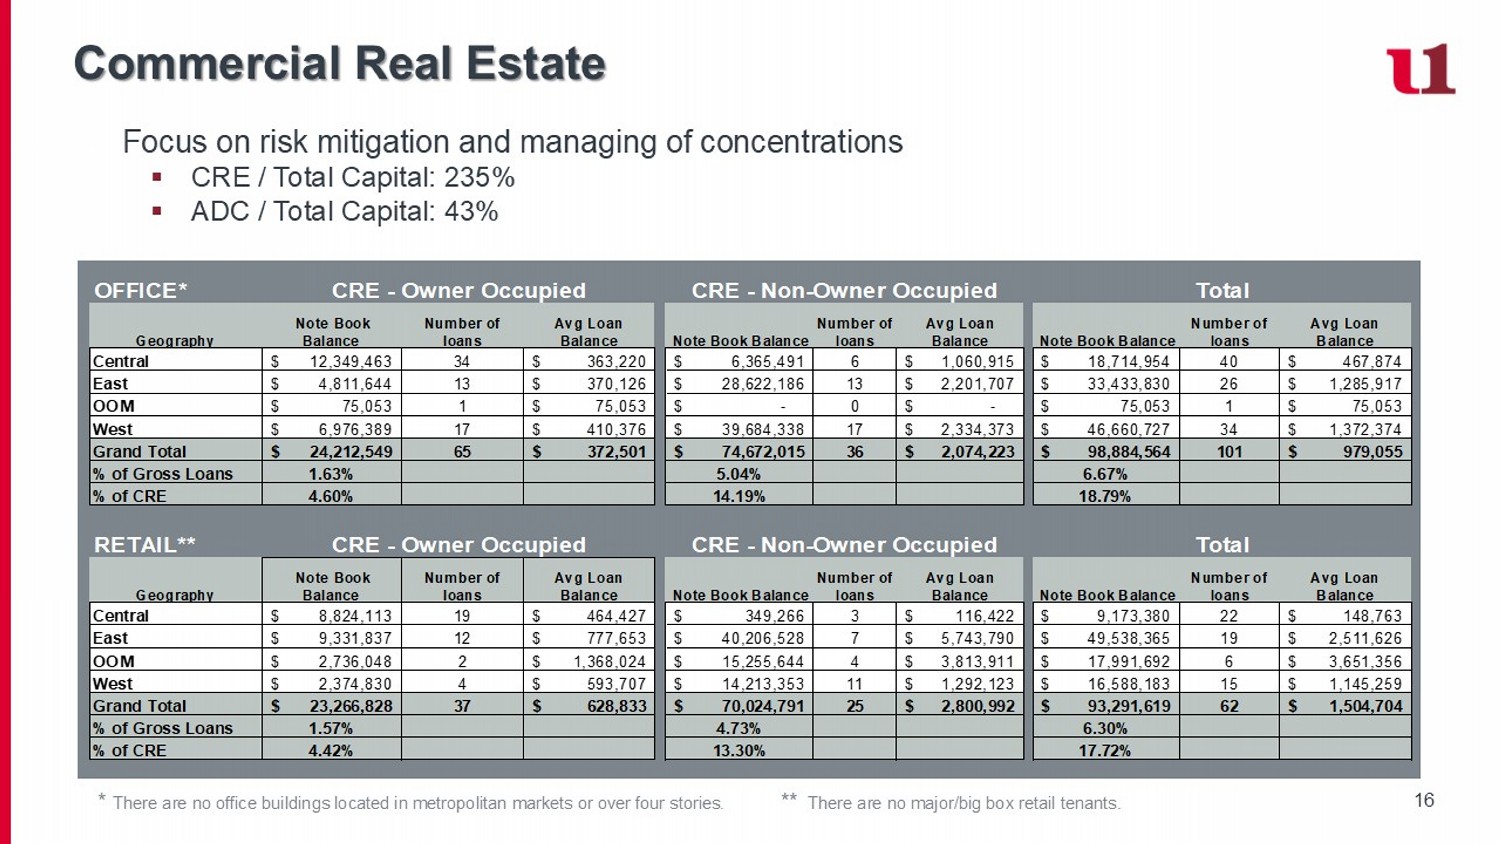
16 Commercial Real Estate Focus on risk mitigation and managing of concentrations ▪ CRE / Total Capital: 235% ▪ ADC / Total Capital: 43% * There are no office buildings located in metropolitan markets or over four stories. ** There are no major/big box retail tenants. OFFICE* Geography Note Book Balance Number of loans Avg Loan Balance Note Book Balance Number of loans Avg Loan Balance Note Book Balance Number of loans Avg Loan Balance Central 12,349,463$ 34 363,220$ 6,365,491$ 6 1,060,915$ 18,714,954$ 40 467,874$ East 4,811,644$ 13 370,126$ 28,622,186$ 13 2,201,707$ 33,433,830$ 26 1,285,917$ OOM 75,053$ 1 75,053$ -$ 0 -$ 75,053$ 1 75,053$ West 6,976,389$ 17 410,376$ 39,684,338$ 17 2,334,373$ 46,660,727$ 34 1,372,374$ Grand Total 24,212,549$ 65 372,501$ 74,672,015$ 36 2,074,223$ 98,884,564$ 101 979,055$ % of Gross Loans 1.63% 5.04% 6.67% % of CRE 4.60% 14.19% 18.79% RETAIL** Geography Note Book Balance Number of loans Avg Loan Balance Note Book Balance Number of loans Avg Loan Balance Note Book Balance Number of loans Avg Loan Balance Central 8,824,113$ 19 464,427$ 349,266$ 3 116,422$ 9,173,380$ 22 148,763$ East 9,331,837$ 12 777,653$ 40,206,528$ 7 5,743,790$ 49,538,365$ 19 2,511,626$ OOM 2,736,048$ 2 1,368,024$ 15,255,644$ 4 3,813,911$ 17,991,692$ 6 3,651,356$ West 2,374,830$ 4 593,707$ 14,213,353$ 11 1,292,123$ 16,588,183$ 15 1,145,259$ Grand Total 23,266,828$ 37 628,833$ 70,024,791$ 25 2,800,992$ 93,291,619$ 62 1,504,704$ % of Gross Loans 1.57% 4.73% 6.30% % of CRE 4.42% 13.30% 17.72% CRE - Owner Occupied CRE - Non-Owner Occupied Total CRE - Owner Occupied CRE - Non-Owner Occupied Total
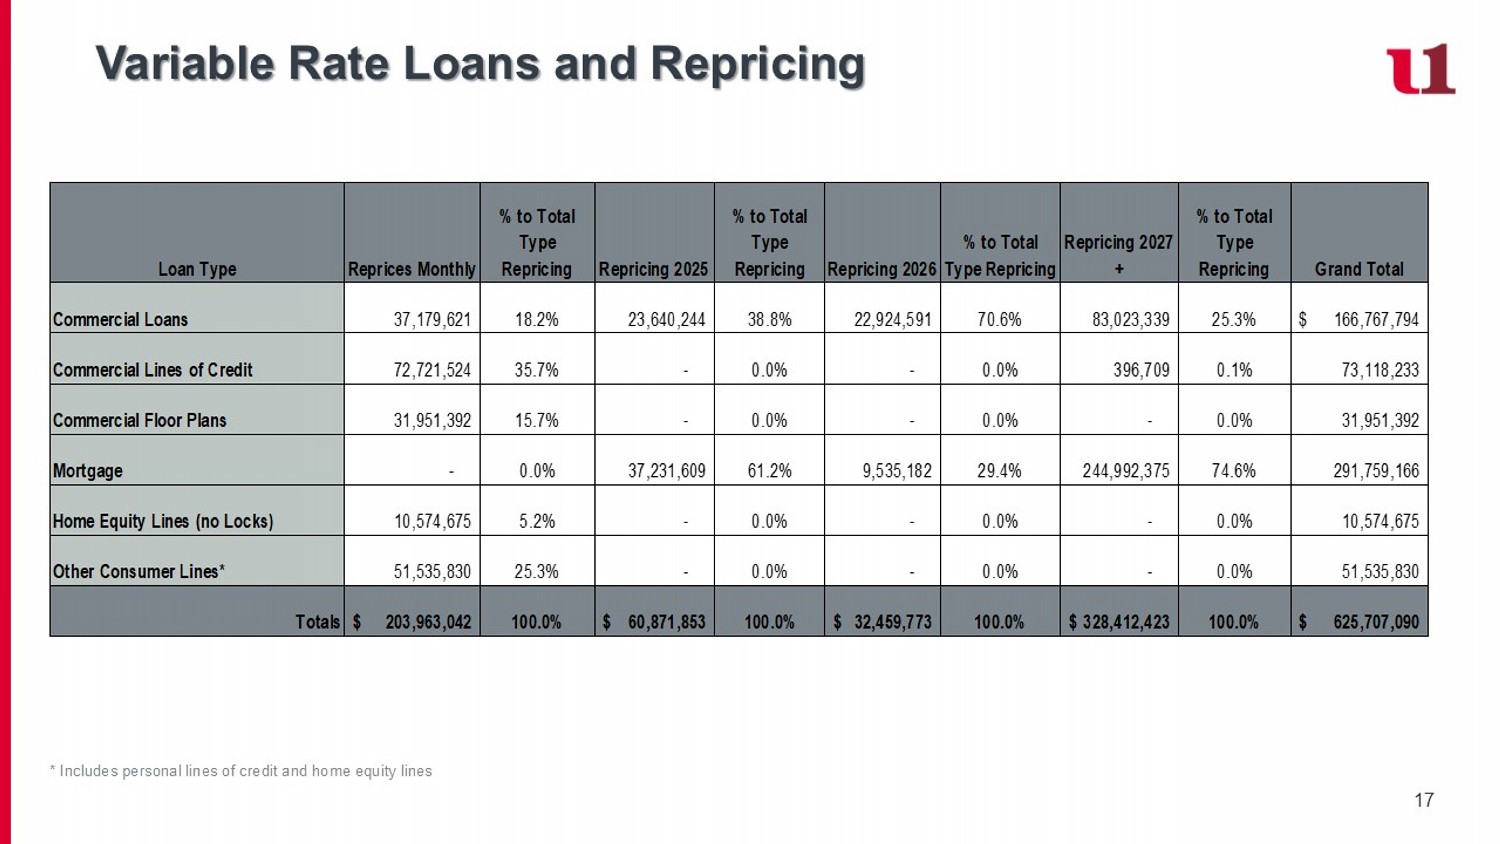
17 Variable Rate Loans and Repricing * Includes personal lines of credit and home equity lines Loan Type Reprices Monthly % to Total Type Repricing Repricing 2025 % to Total Type Repricing Repricing 2026 % to Total Type Repricing Repricing 2027 + % to Total Type Repricing Grand Total Commercial Loans 37,179,621 18.2% 23,640,244 38.8% 22,924,591 70.6% 83,023,339 25.3% 166,767,794$ Commercial Lines of Credit 72,721,524 35.7% - 0.0% - 0.0% 396,709 0.1% 73,118,233 Commercial Floor Plans 31,951,392 15.7% - 0.0% - 0.0% - 0.0% 31,951,392 Mortgage - 0.0% 37,231,609 61.2% 9,535,182 29.4% 244,992,375 74.6% 291,759,166 Home Equity Lines (no Locks) 10,574,675 5.2% - 0.0% - 0.0% - 0.0% 10,574,675 Other Consumer Lines* 51,535,830 25.3% - 0.0% - 0.0% - 0.0% 51,535,830 Totals 203,963,042$ 100.0% 60,871,853$ 100.0% 32,459,773$ 100.0% 328,412,423$ 100.0% 625,707,090$
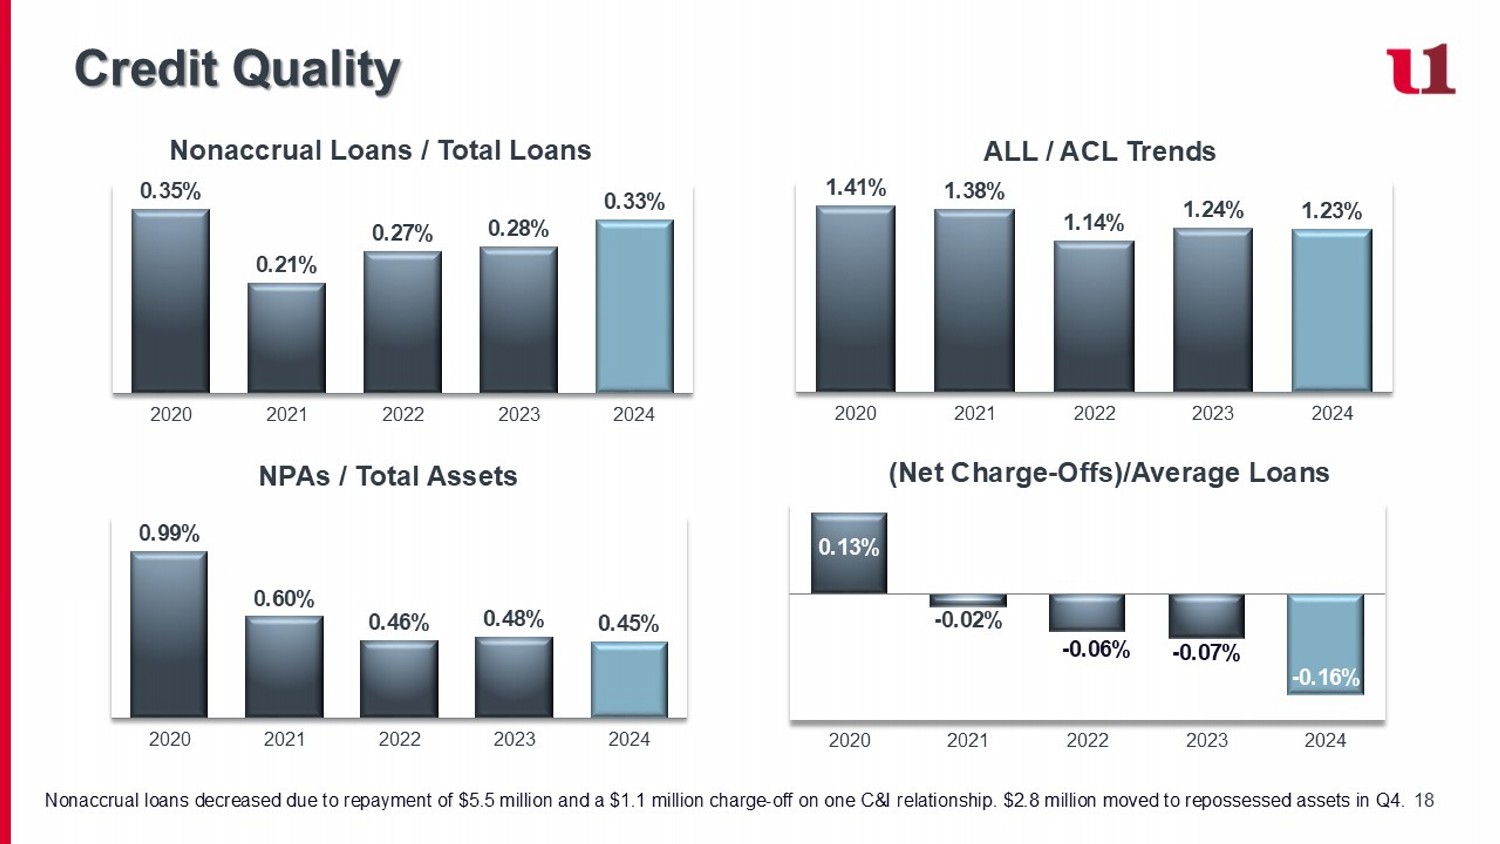
18 Credit Quality ALL / ACL Trends (Net Charge - Offs)/Average Loans Nonaccrual Loans / Total Loans NPAs / Total Assets 0.35% 0.21% 0.27% 0.28% 0.33% 2020 2021 2022 2023 2024 0.99% 0.60% 0.46% 0.48% 0.45% 2020 2021 2022 2023 2024 1.41% 1.38% 1.14% 1.24% 1.23% 2020 2021 2022 2023 2024 0.13% - 0.02% --- - 0.06% - 0.07% - 0.16% 2020 2021 2022 2023 2024 Nonaccrual loans decreased due to repayment of $5.5 million and a $1.1 million charge - off on one C&I relationship. $2.8 million moved to repossessed assets in Q4.
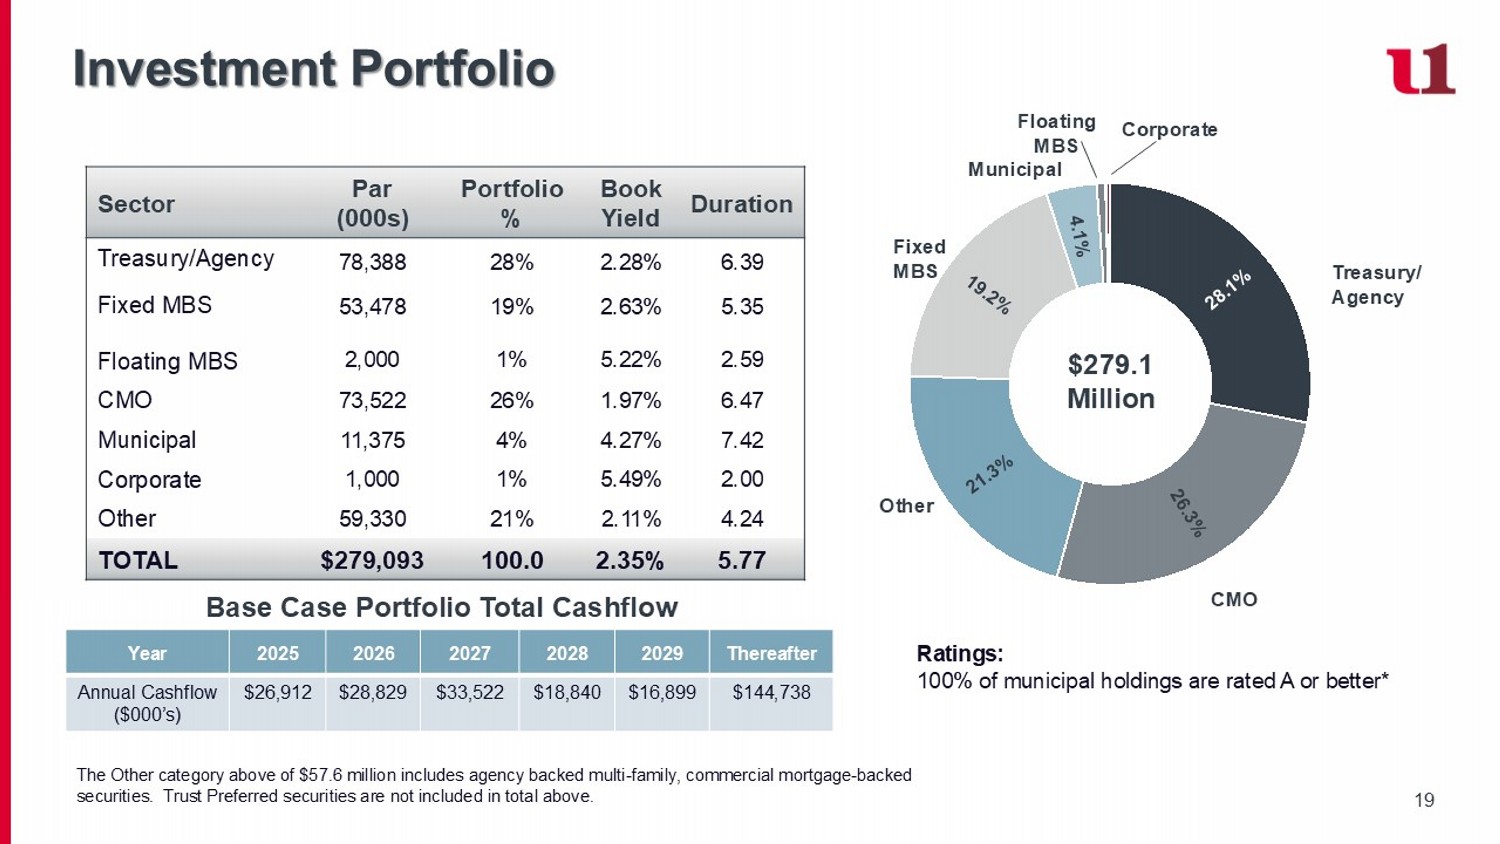
19 Investment Portfolio Duration Book Yield Portfolio % Par (000s) Sector 6.39 2.28% 28% 78,388 Treasury/Agency 5.35 2.59 2.63% 5.22% 19% 1% 53,478 2,000 Fixed MBS Floating MBS 6.47 1.97% 26% 73,522 CMO 7.42 4.27% 4% 11,375 Municipal 2.00 5.49% 1% 1,000 Corporate 4.24 2.11% 21% 59,330 Other 5.77 2.35% 100.0 $279,093 TOTAL Ratings: 100% of municipal holdings are rated A or better* $279.1 Million Thereafter 2029 2028 2027 2026 2025 Year $144,738 $16,899 $18,840 $33,522 $28,829 $26,912 Annual Cashflow ($000’s) Base Case Portfolio Total Cashflow Treasury/ Agency CMO Fixed MBS Other Municipal Corporate The Other category above of $57.6 million includes agency backed multi - family, commercial mortgage - backed securities. Trust Preferred securities are not included in total above. Floating MBS
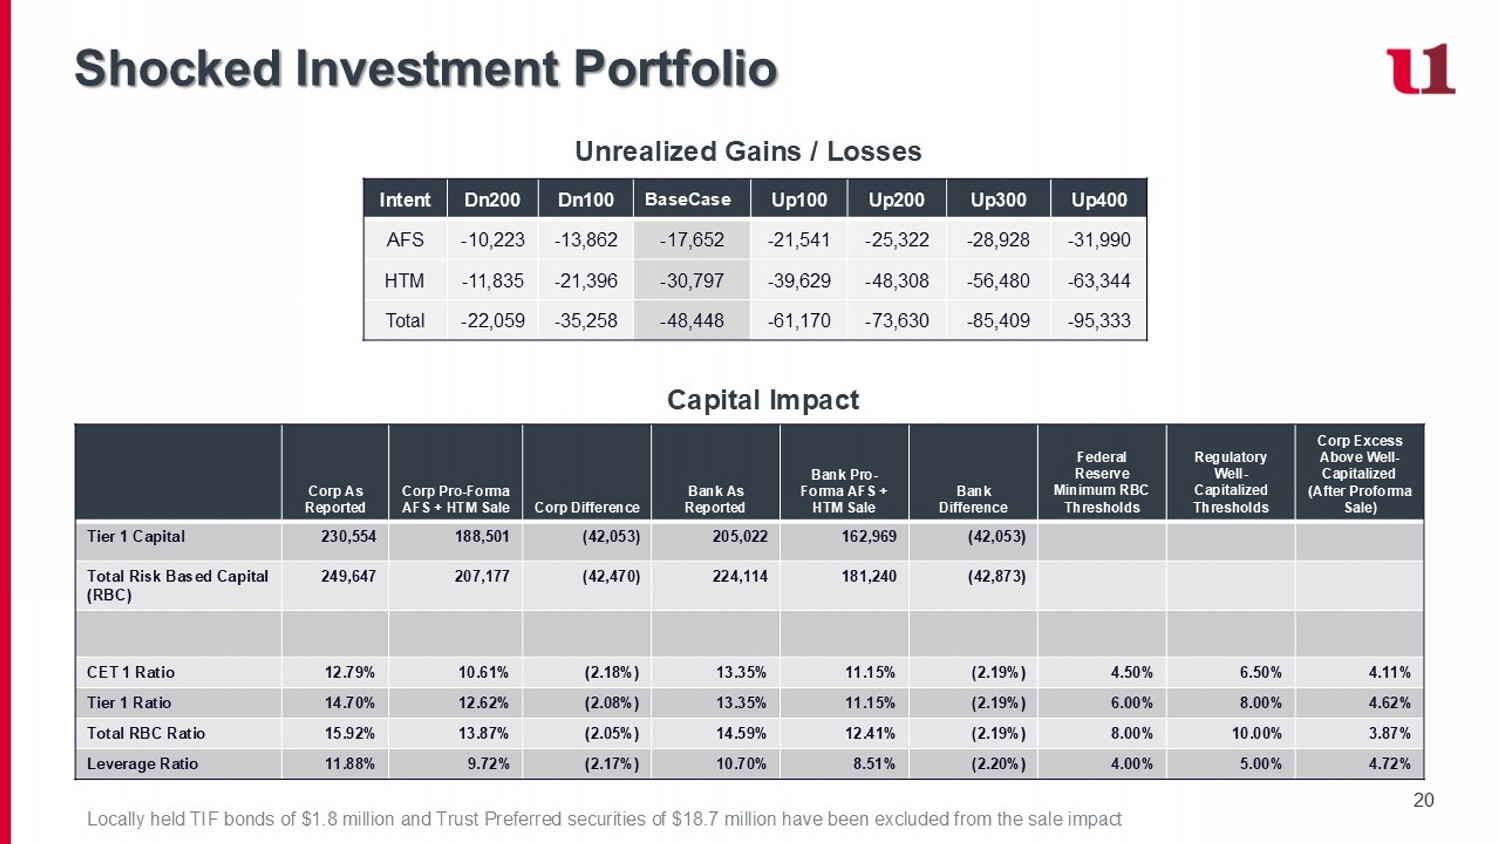
20 Shocked Investment Portfolio Unrealized Gains / Losses Capital Impact Up400 Up300 Up200 Up100 BaseCase Dn100 Dn200 Intent - 31,990 - 28,928 - 25,322 - 21,541 - 17,652 - 13,862 - 10,223 AFS - 63,344 - 56,480 - 48,308 - 39,629 - 30,797 - 21,396 - 11,835 HTM - 95,333 - 85,409 - 73,630 - 61,170 - 48,448 - 35,258 - 22,059 Total Corp Excess Above Well - Capitalized (After Proforma Sale) Regulatory Well - Capitalized Thresholds Federal Reserve Minimum RBC Thresholds Bank Difference Bank Pro - Forma AFS + HTM Sale Bank As Reported Corp Difference Corp Pro - Forma AFS + HTM Sale Corp As Reported (42,053) 162,969 205,022 (42,053) 188,501 230,554 Tier 1 Capital (42,873) 181,240 224,114 (42,470) 207,177 249,647 Total Risk Based Capital (RBC) 4.11% 6.50% 4.50% (2.19%) 11.15% 13.35% (2.18%) 10.61% 12.79% CET 1 Ratio 4.62% 8.00% 6.00% (2.19%) 11.15% 13.35% (2.08%) 12.62% 14.70% Tier 1 Ratio 3.87% 10.00% 8.00% (2.19%) 12.41% 14.59% (2.05%) 13.87% 15.92% Total RBC Ratio 4.72% 5.00% 4.00% (2.20%) 8.51% 10.70% (2.17%) 9.72% 11.88% Leverage Ratio Locally held TIF bonds of $1.8 million and Trust Preferred securities of $18.7 million have been excluded from the sale impac t
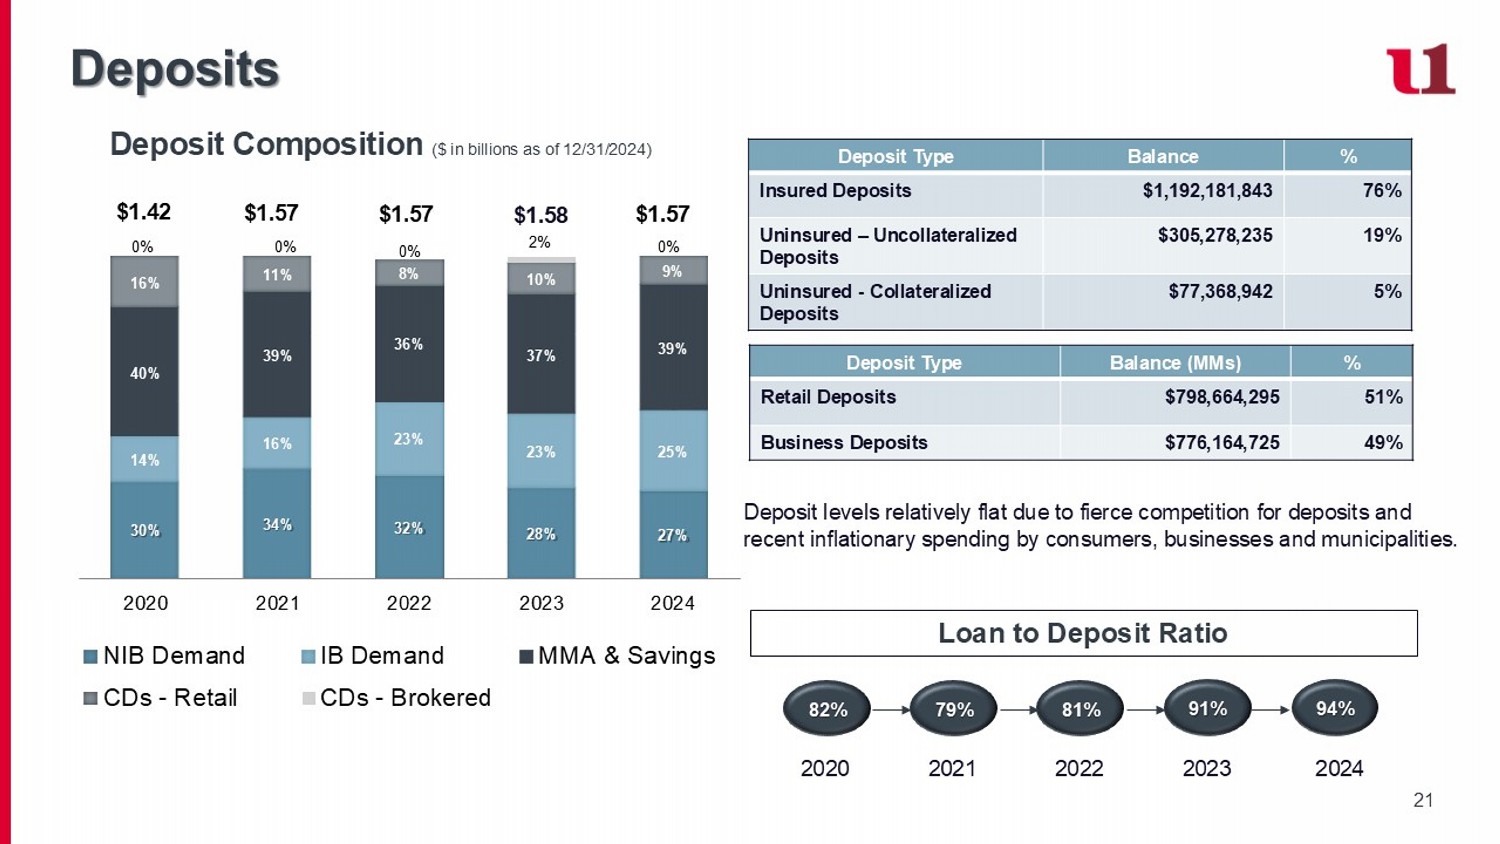
21 Deposits 30% 34% 32% 28% 27% 14% 16% 23% 23% 25% 40% 39% 36% 37% 39% 16% 11% 8% 10% 9% 0% 0% 0% 2% 0% 2020 2021 2022 2023 2024 NIB Demand IB Demand MMA & Savings CDs - Retail CDs - Brokered $1.57 $1.42 $1.57 $1.57 $1.58 Deposit Composition ($ in billions as of 12/31/2024) 82% 79% 81% 91% 94% Loan to Deposit Ratio 2020 2021 2022 2023 2024 Deposit levels relatively flat due to fierce competition for deposits and recent inflationary spending by consumers, businesses and municipalities. % Balance Deposit Type 76% $1,192,181,843 Insured Deposits 19% $305,278,235 Uninsured – Uncollateralized Deposits 5% $77,368,942 Uninsured - Collateralized Deposits % Balance (MMs) Deposit Type 51% $798,664,295 Retail Deposits 49% $776,164,725 Business Deposits
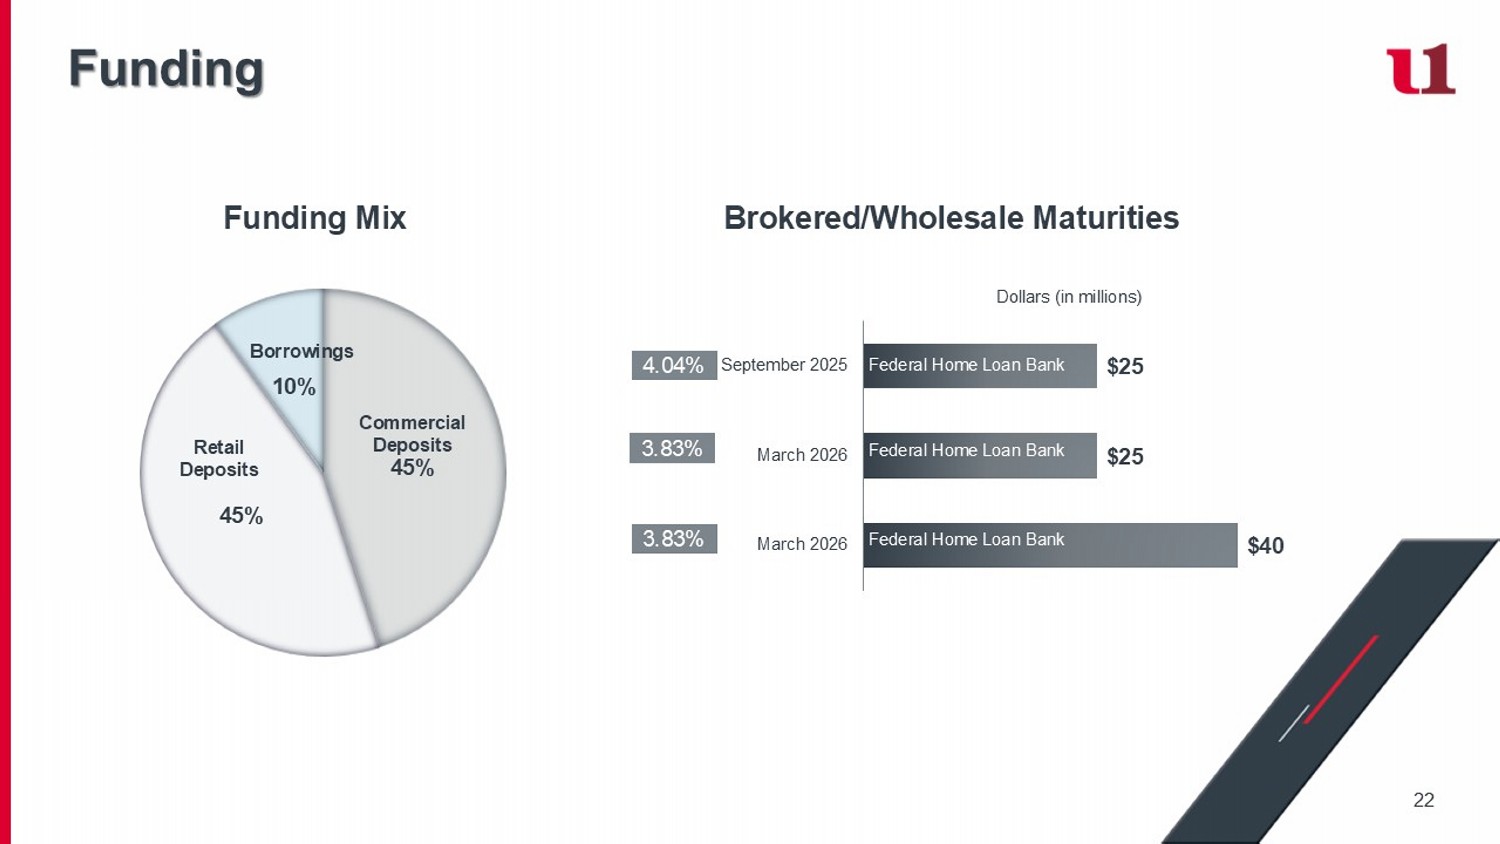
22 Funding 45% 45% 10% Commercial Deposits Retail Deposits Borrowings Funding Mix Brokered/Wholesale Maturities $40 $25 $25 March 2026 March 2026 September 2025 Dollars (in millions) FHLB Advance FHLB Advance 3.83% Federal Home Loan Bank 4.04% 3.83% Brokered CD Federal Home Loan Bank Federal Home Loan Bank Federal Home Loan Bank
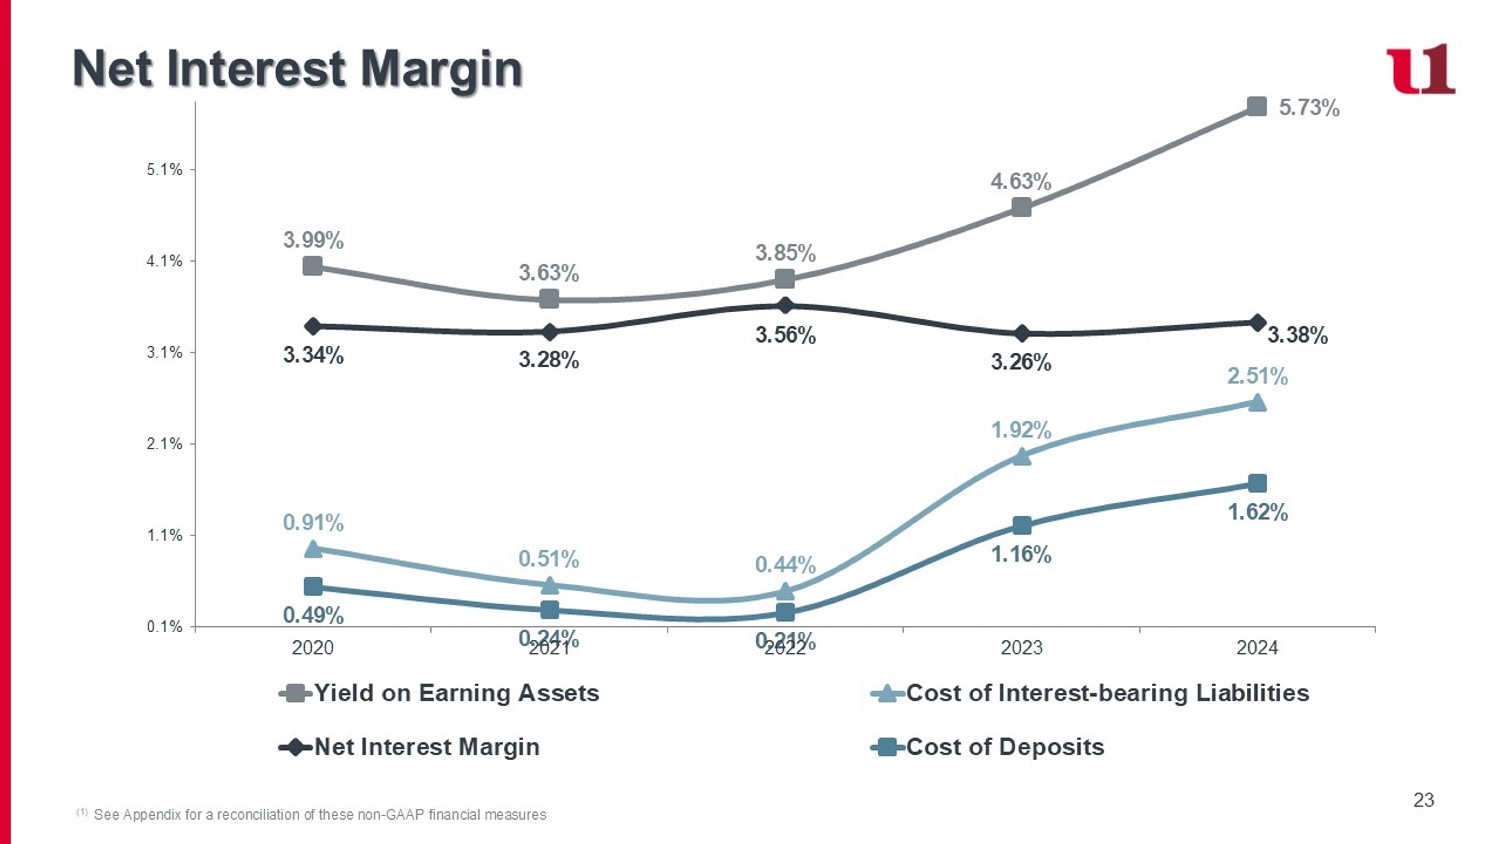
23 Net Interest Margin (1) See Appendix for a reconciliation of these non - GAAP financial measures 3.99% 3.63% 3.85% 4.63% 5.73% 0.91% 0.51% 0.44% 1.92% 2.51% 3.34% 3.28% 3.56% 3.26% 3.38% 0.49% 0.24% 0.21% 1.16% 1.62% 0.1% 1.1% 2.1% 3.1% 4.1% 5.1% 2020 2021 2022 2023 2024 Yield on Earning Assets Cost of Interest-bearing Liabilities Net Interest Margin Cost of Deposits
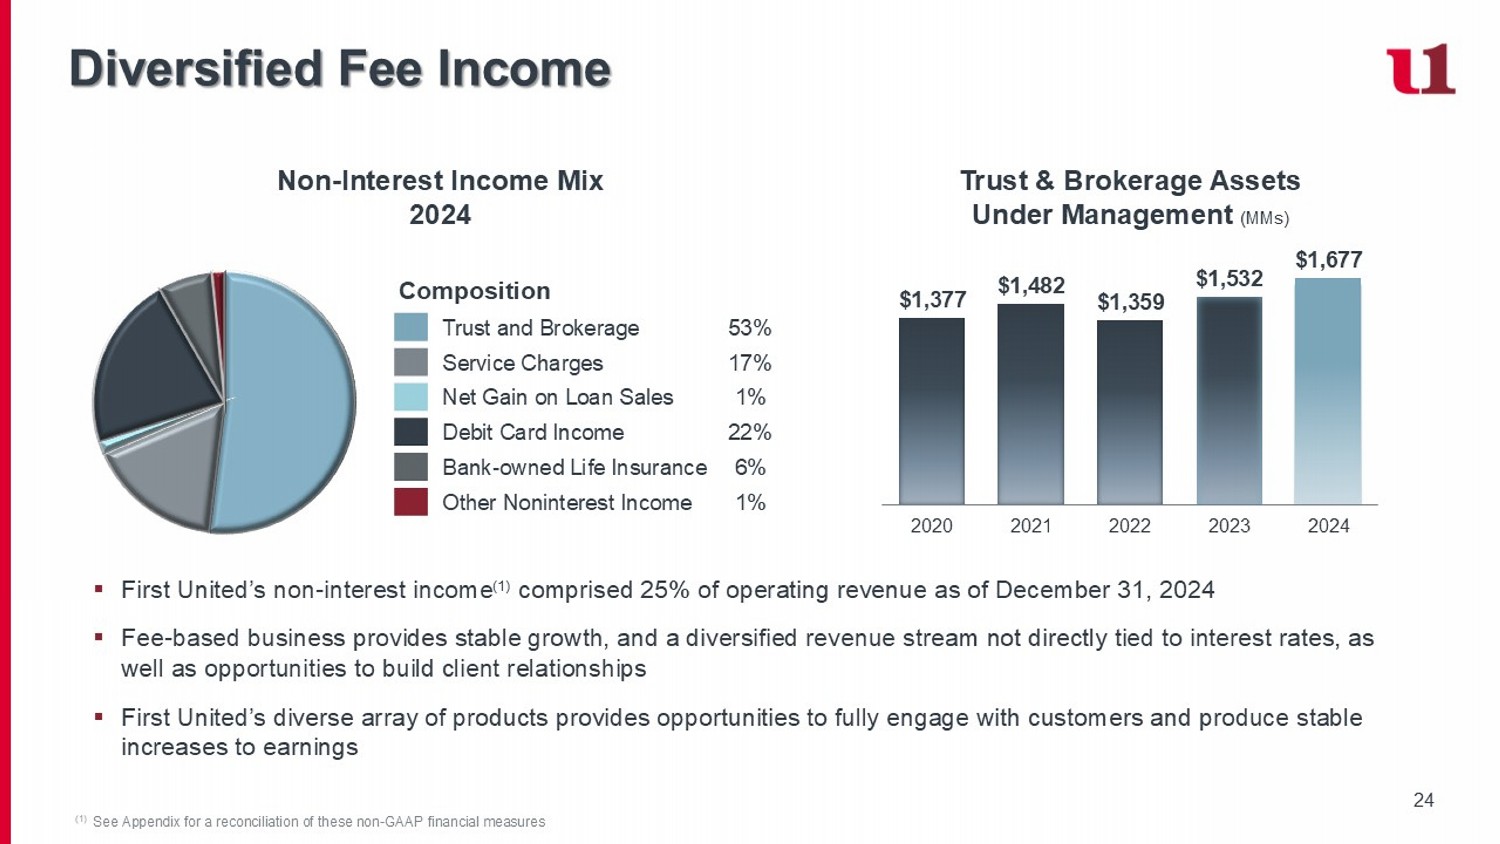
24 Diversified Fee Income (1) See Appendix for a reconciliation of these non - GAAP financial measures Composition 53% Trust and Brokerage 17% Service Charges 1% Net Gain on Loan Sales 22% Debit Card Income 6% Bank - owned Life Insurance 1% Other Noninterest Income Non - Interest Income Mix 2024 Trust & Brokerage Assets Under Management (MMs) ▪ First United’s non - interest income (1) comprised 25% of operating revenue as of December 31, 2024 ▪ Fee - based business provides stable growth, and a diversified revenue stream not directly tied to interest rates, as well as opportunities to build client relationships ▪ First United’s diverse array of products provides opportunities to fully engage with customers and produce stable increases to earnings $1,377 $1,482 $1,359 $1,532 $1,677 2020 2021 2022 2023 2024
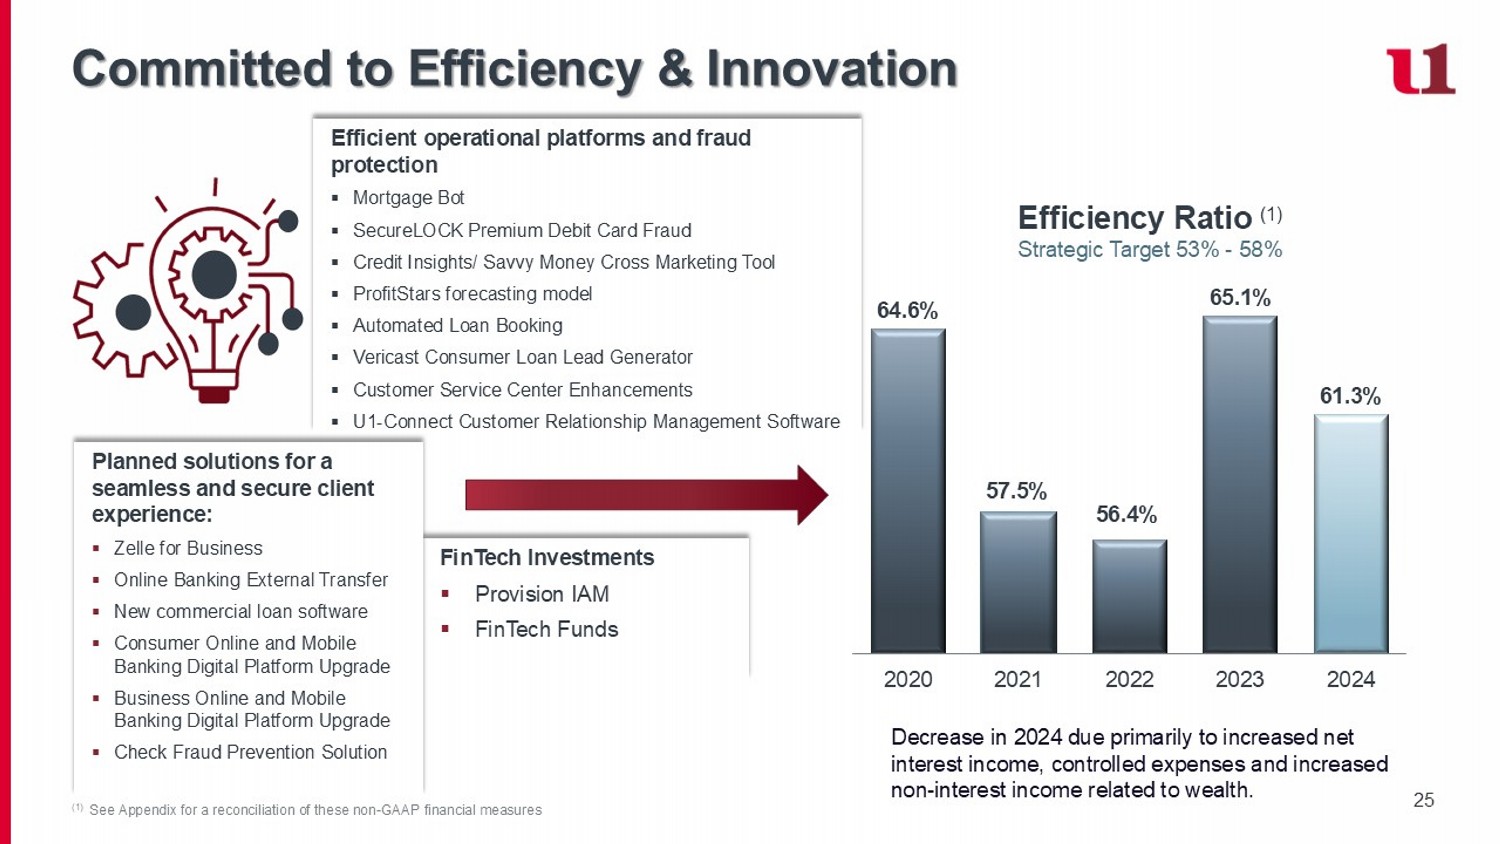
25 Committed to Efficiency & Innovation (1) See Appendix for a reconciliation of these non - GAAP financial measures Efficient operational platforms and fraud protection ▪ Mortgage Bot ▪ SecureLOCK Premium Debit Card Fraud ▪ Credit Insights/ Savvy Money Cross Marketing Tool ▪ ProfitStars forecasting model ▪ Automated Loan Booking ▪ Vericast Consumer Loan Lead Generator ▪ Customer Service Center Enhancements ▪ U1 - Connect Customer Relationship Management Software Efficiency Ratio (1) Strategic Target 53% - 58% FinTech Investments ▪ Provision IAM ▪ FinTech Funds Planned solutions for a seamless and secure client experience: ▪ Zelle for Business ▪ Online Banking External Transfer ▪ New commercial loan software ▪ Consumer Online and Mobile Banking Digital Platform Upgrade ▪ Business Online and Mobile Banking Digital Platform Upgrade ▪ Check Fraud Prevention Solution Decrease in 2024 due primarily to increased net interest income, controlled expenses and increased non - interest income related to wealth. 64.6% 57.5% 56.4% 65.1% 61.3% 2020 2021 2022 2023 2024
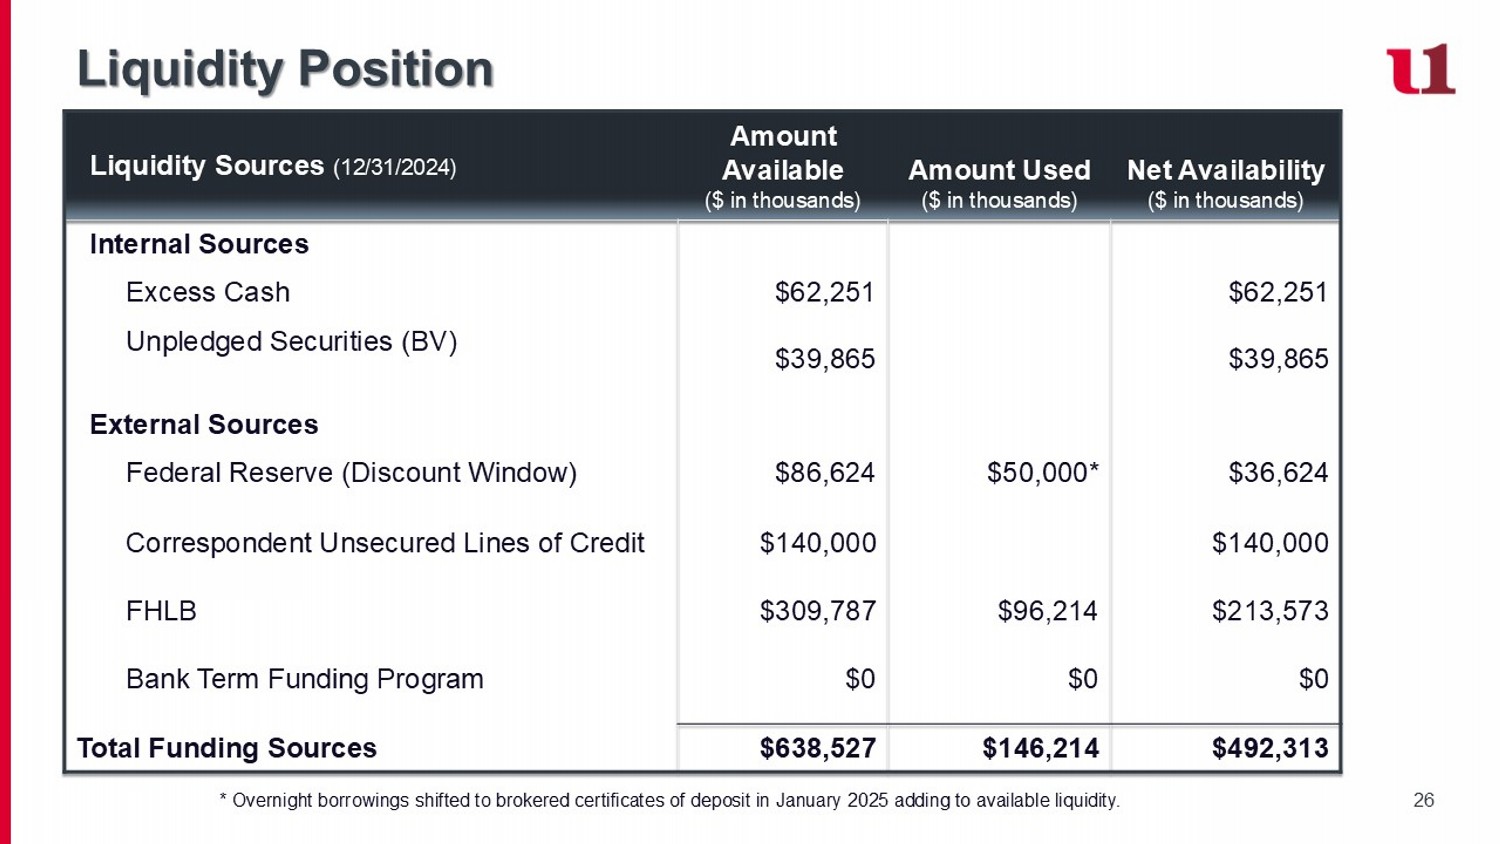
26 Liquidity Position Net Availability ($ in thousands) Amount Used ($ in thousands) Amount Available ($ in thousands) Liquidity Sources (12/31/2024) Internal Sources $62,251 $62,251 Excess Cash $39,865 $39,865 Unpledged Securities (BV) External Sources $36,624 $50,000* $86,624 Federal Reserve (Discount Window) $140,000 $213,573 $0 $96,214 $0 $140,000 $309,787 $0 Correspondent Unsecured Lines of Credit FHLB Bank Term Funding Program $492,313 $146,214 $638,527 Total Funding Sources * Overnight borrowings shifted to brokered certificates of deposit in January 2025 adding to available liquidity.

27 Interest Rate Risk (1) Standard Model Assumptions Interest Rate Risk Sensitivity ▪ The Bank’s interest rate risk position is stress tested under three interest rate ramp scenarios to determine the impact on net interest income, net income and capital under dynamic and static balance sheet conditions. ▪ The Bank’s net interest income position at a slightly asset sensitive position. ▪ The Bank’s largest risk from an interest rate risk perspective is falling rate scenarios. ▪ Assumptions regarding offering rates, loan and investment prepayment speeds, beta and decay rates are reviewed and adjusted on a quarterly basis. Management Outlook & Strategy ▪ Disciplined loan pricing ▪ Manage deposit pricing on relationship and exception basis ▪ Deposit acquisition through short - term CD promotions and adjustable - rate money market products for businesses, municipalities and consumers ▪ Actively reducing deposit rates concurrent with market adjustments ▪ $25 million FHLB advance maturing in September 2025 ▪ $25 million FHLB advance maturing in March 2026 ▪ $40 million FHLB advance maturing in March 2026 +400 +300 +200 +100 Flat - 100 - 200 - 300 - 400 8.5% 7.9% 6.3% 3.5% (4.2%) (8.0%) (12.0%) (16.5%) Net Interest Income (12/31/24) 7.4% 7.5% 6.3% 3.7% (3.8%) (7.7%) (11.9%) (15.6%) Net Interest Income (09/30/24) (17.8%) (11.6%) (6.3%) (2.2%) (0.1%) (3.3%) (10.4%) (20.9%) EVE (09/30/24) 12 Month Sensitivity Shock
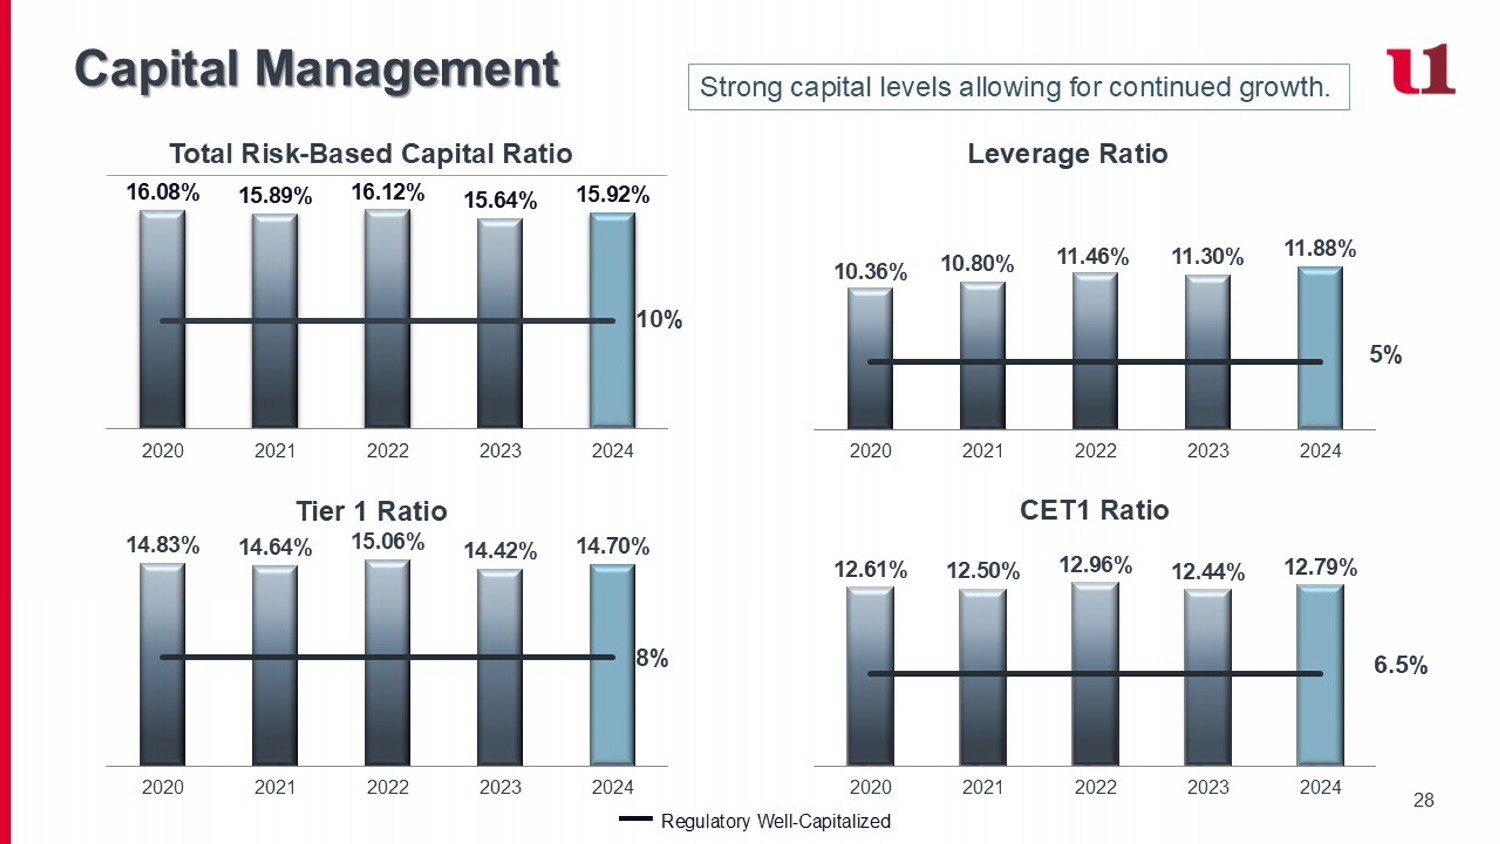
28 Capital Management CET1 Ratio Leverage Ratio Tier 1 Ratio Total Risk - Based Capital Ratio Regulatory Well - Capitalized 10% 5% 8% 6.5% 14.83% 14.64% 15.06% 14.42% 14.70% 2020 2021 2022 2023 2024 16.08% 15.89% 16.12% 15.64% 15.92% 2020 2021 2022 2023 2024 10.36% 10.80% 11.46% 11.30% 11.88% 2020 2021 2022 2023 2024 12.61% 12.50% 12.96% 12.44% 12.79% 2020 2021 2022 2023 2024 Strong capital levels allowing for continued growth.
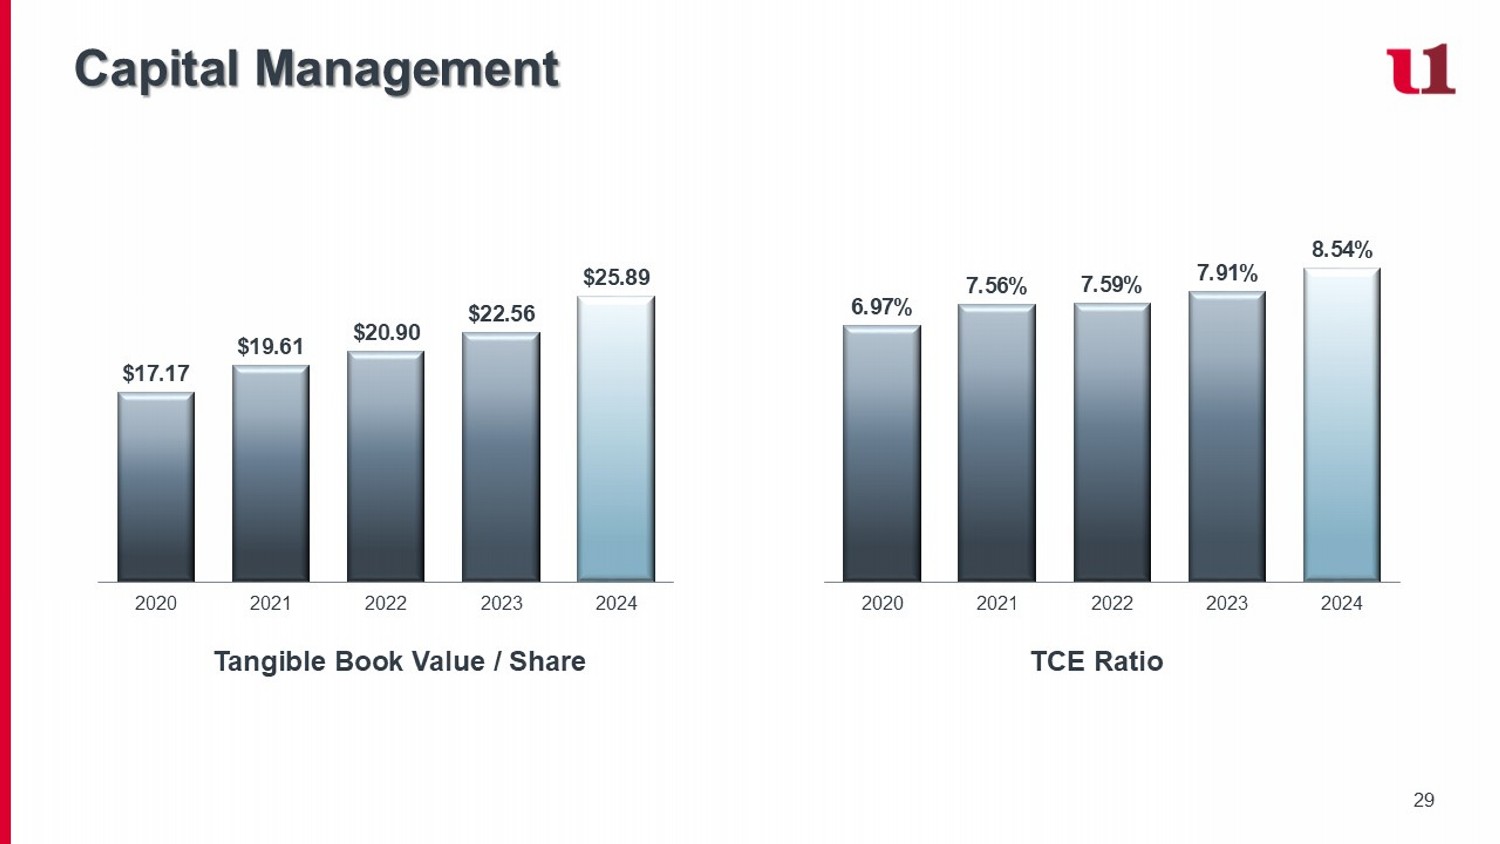
29 Capital Management Tangible Book Value / Share TCE Ratio $17.17 $19.61 $20.90 $22.56 $25.89 2020 2021 2022 2023 2024 6.97% 7.56% 7.59% 7.91% 8.54% 2020 2021 2022 2023 2024
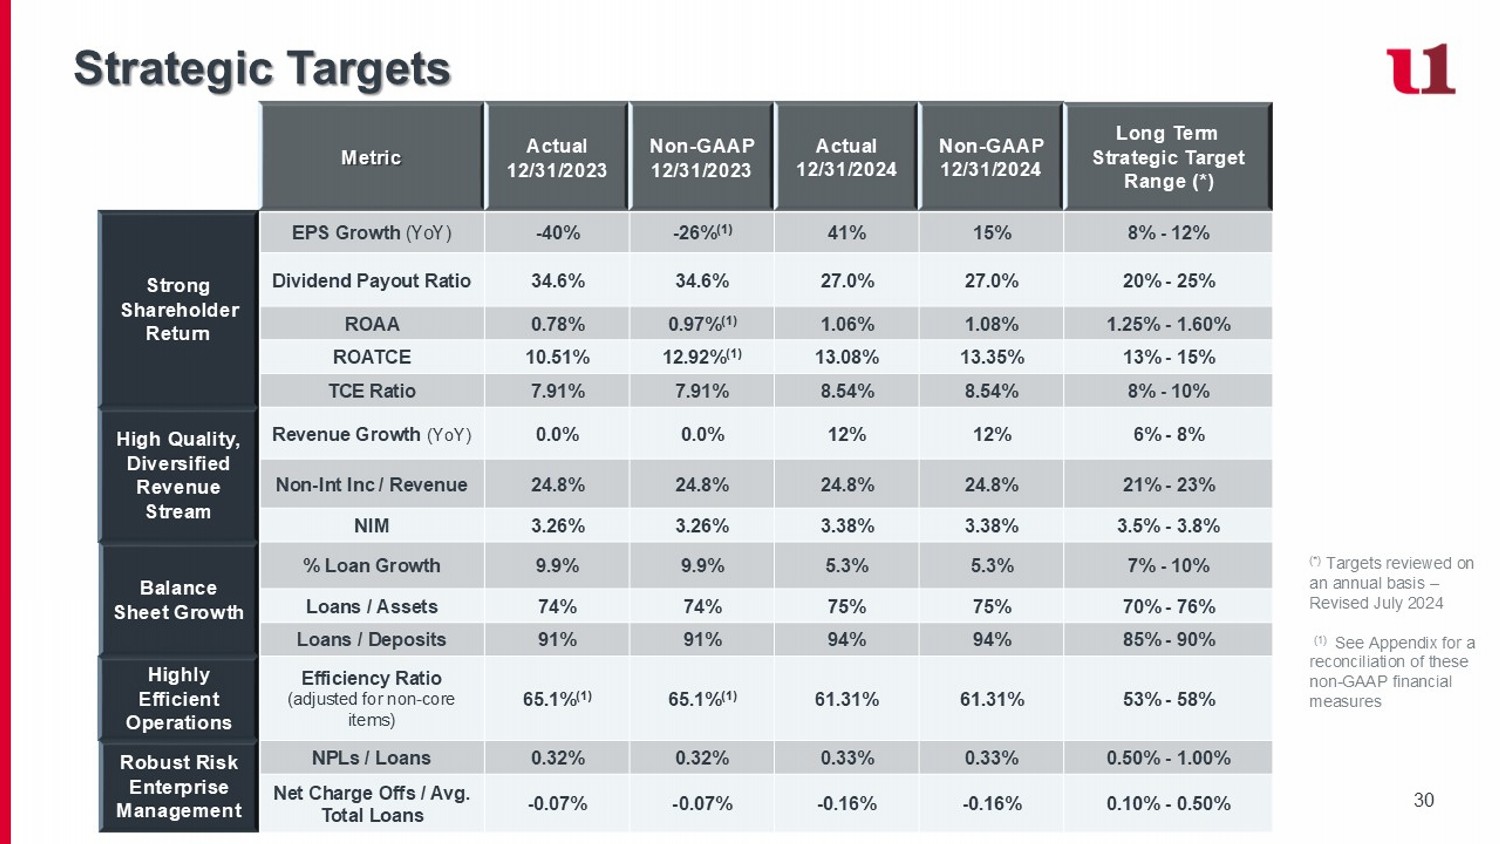
30 Strategic Targets Long Term Strategic Target Range (*) Non - GAAP 12/31/2024 Actual 12/31/2024 Non - GAAP 12/31/2023 Actual 12/31/2023 Metric 8% - 12% 15% 41% - 26% (1) - 40% EPS Growth (YoY) Strong Shareholder Return 20% - 25% 27.0% 27.0% 34.6% 34.6% Dividend Payout Ratio 1.25% - 1.60% 1.08% 1.06% 0.97% (1) 0.78% ROAA 13% - 15% 13.35% 13.08% 12.92% (1) 10.51% ROATCE 8% - 10% 8.54% 8.54% 7.91% 7.91% TCE Ratio 6% - 8% 12% 12% 0.0% 0.0% Revenue Growth (YoY) High Quality, Diversified Revenue Stream 21% - 23% 24.8% 24.8% 24.8% 24.8% Non - Int Inc / Revenue 3.5% - 3.8% 3.38% 3.38% 3.26% 3.26% N IM 7% - 10% 5.3% 5.3% 9.9% 9.9% % Loan Growth Balance Sheet Growth 70% - 76% 75% 75% 74% 74% Loans / Assets 85% - 90% 94% 94% 91% 91% Loans / Deposits 53% - 58% 61.31% 61.31% 65.1% (1) 65.1% (1) Efficiency Ratio (adjusted for non - core items) Highly Efficient Operations 0.50% - 1.00% 0.33% 0.33% 0.32% 0.32% NPLs / Loans Robust Risk Enterprise Management 0.10% - 0.50% - 0.16% - 0.16% - 0.07% - 0.07% Net Charge Offs / Avg. Total Loans (*) Targets reviewed on an annual basis – Revised July 2024 (1) See Appendix for a reconciliation of these non - GAAP financial measures

31 Strong Investor Relations & Shareholder Engagement Members of the Board and senior management routinely engage with shareholders and other stakeholders, and management regularly updates the Board in the context of ongoing investor discussions. These engagements help the Board and management gather feedback on a variety of topics, including strategic and financial performance, ESG disclosure, executive compensation, Board composition, and leadership structure. Clear long - term strategic plan with performance targets x Dedicated Investor Relations contact x Investor conferences and prospective investor engagement x Investor presentations and periodic outreach to institutional and retail shareholders x How to contact your Board: Shareholders and interested parties wishing to contact our Board may send a letter to First United Co rporation Board of Directors, c/o Tonya K. Sturm, Secretary, First United Corporation, 19 South Second Street, Oakland, Maryland, 21550 - 00 09 or by e - mail at tsturm@mybank.com. The Secretary will deliver all shareholder communications directly to the Board for consideratio n.

32 I. II. III. IV. Management Team Board of Directors ESG Journey & Statistics Non - GAAP Reconciliation Pg. 33 Pg. 34 Pg. 37 Pg. 39 Appendices

33 Management Team Carissa L. Rodeheaver Chairman of the Board, President & CEO 33+ years career with First United with in - depth industry, wealth management, financial and operational experience Jason B. Rush SVP & Chief Operating Officer 30+ years with in - depth industry, retail, risk and compliance and operations experience Tonya K. Sturm SVP & Chief Financial Officer, Corp. Secretary & Treasurer 35+ years of banking, audit, credit, retail, risk and compliance and financial and operational experience R.L. Fisher SVP & Chief Revenue Officer 25+years with in - depth industry, retail, commercial and mortgage banking experience Keith R. Sanders SVP & Chief Wealth Officer 30+ years specializing in wealth management, estate planning, trust administration and financial planning Our leadership team reflects the diversity of thought from the communities we serve, executes on our strategy and drives shareholder returns. Julie W. Peterson SVP & Chief Credit Officer 30+ years with in - depth industry, commercial banking, and credit experience

34 34 John F. Barr Independent Director Chairman of the Board, Ellsworth Electric, Inc. Sanu Chadha Independent Director Managing Partner, M&S Consulting Christy DiPietro Independent Director, Audit Chair Chartered Financial Analyst, Hidden Cove Advisory Patricia Milon Independent Director Principal, Milford Advisory Group, LLC I. Robert Rudy Independent Director President, I.R. Rudy’s, Inc. H. Andrew Walls, III Independent Director President, MPB Print & Sign Superstore Member, MEGBA, LLC Beth E. Moran Independent Director, The Law Offices of Beth E. Moran Brian Boal Lead Independent Director, Nomination & Governance Chair Boal & Associates, PC Carissa L. Rodeheaver Chairman of the Board, President & CEO First United Corporation and First United Bank & Trust Board of Directors Kevin Hessler Independent Director , Principal, LSWG, Inc.
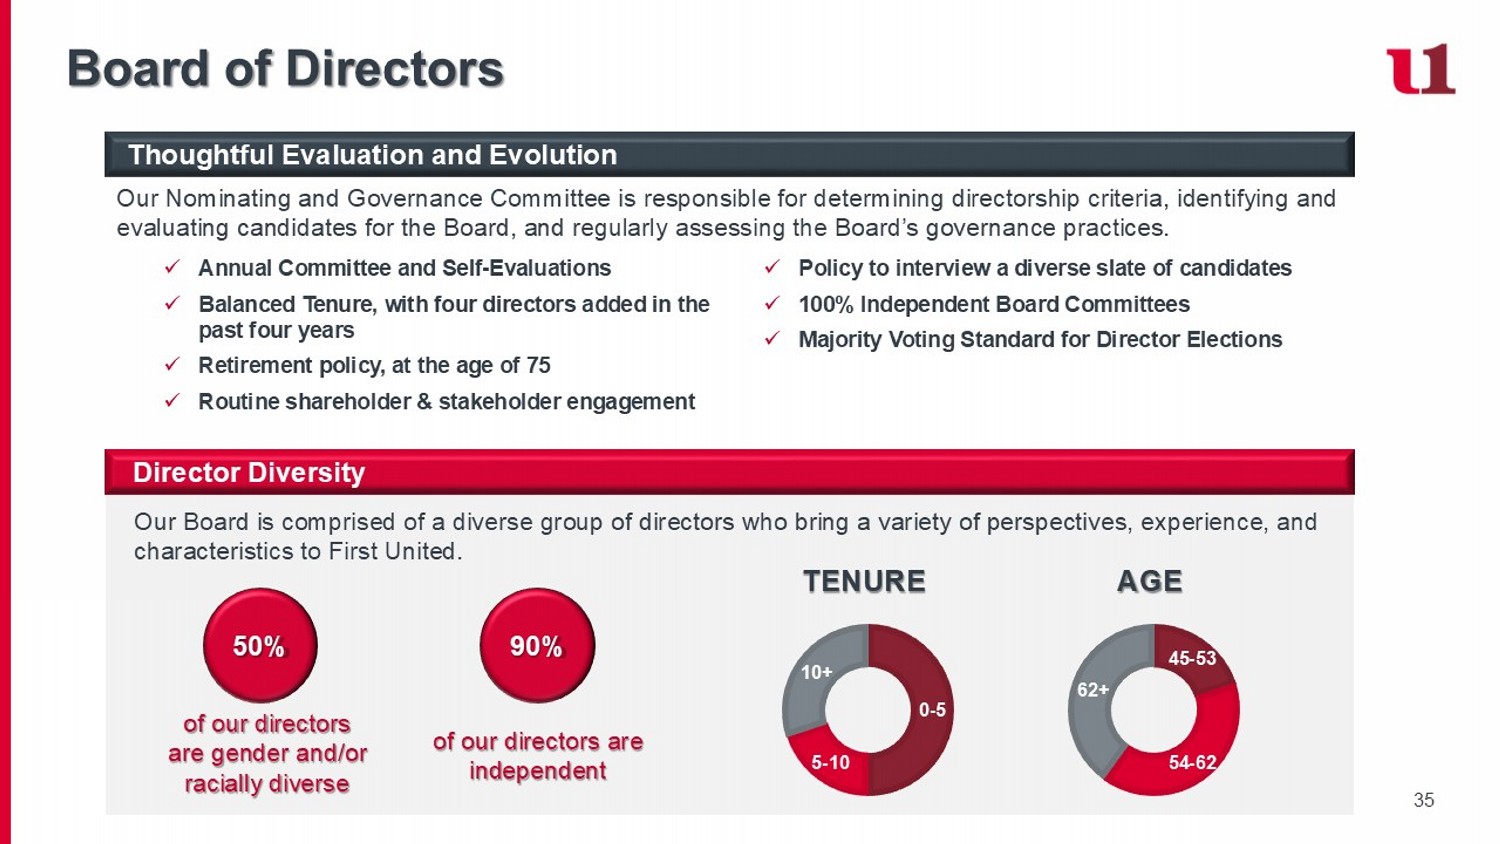
35 Board of Directors Thoughtful Evaluation and Evolution Our Board is comprised of a diverse group of directors who bring a variety of perspectives, experience, and characteristics to First United. Director Diversity 50% 90% of our directors are gender and/or racially diverse of our directors are independent Our Nominating and Governance Committee is responsible for determining directorship criteria, identifying and evaluating candidates for the Board, and regularly assessing the Board’s governance practices. x Policy to interview a diverse slate of candidates x 100% Independent Board Committees x Majority Voting Standard for Director Elections x Annual Committee and Self - Evaluations x Balanced Tenure, with four directors added in the past four years x Retirement policy, at the age of 75 x Routine shareholder & stakeholder engagement 0 - 5 5 - 10 10+ TENURE 45 - 53 54 - 62 62+ AGE
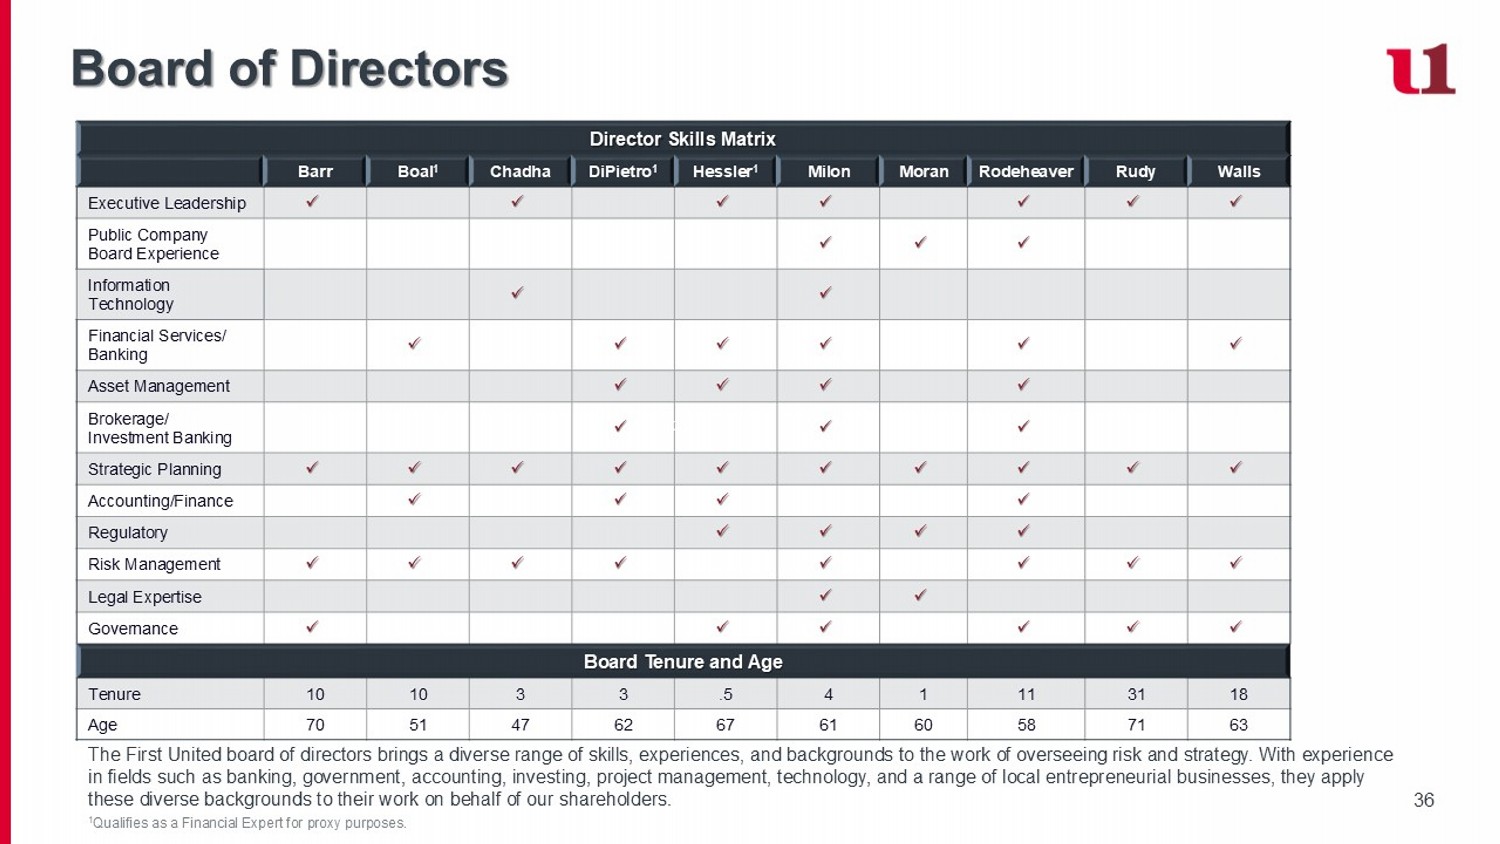
36 Board of Directors The First United board of directors brings a diverse range of skills, experiences, and backgrounds to the work of overseeing ris k and strategy. With experience in fields such as banking, government, accounting, investing, project management, technology, and a range of local entreprene uri al businesses, they apply these diverse backgrounds to their work on behalf of our shareholders. Director Skills Matrix Walls Rudy Rodeheaver Moran Milon Hessler 1 DiPietro 1 Chadha Boal 1 Barr x x x x x x x Executive Leadership x x x Public Company Board Experience x x Information Technology x x x x x x Financial Services/ Banking x x x x Asset Management x x x Brokerage/ Investment Banking x x x x x x x x x x Strategic Planning x x x x Accounting/Finance x x x x Regulatory x x x x x x x x Risk Management x x Legal Expertise x x x x x x Governance Board Tenure and Age 18 31 11 1 4 .5 3 3 10 10 Tenure 63 71 58 60 61 67 62 47 51 70 Age 1 Qualifies as a Financial Expert for proxy purposes. Brokered CD
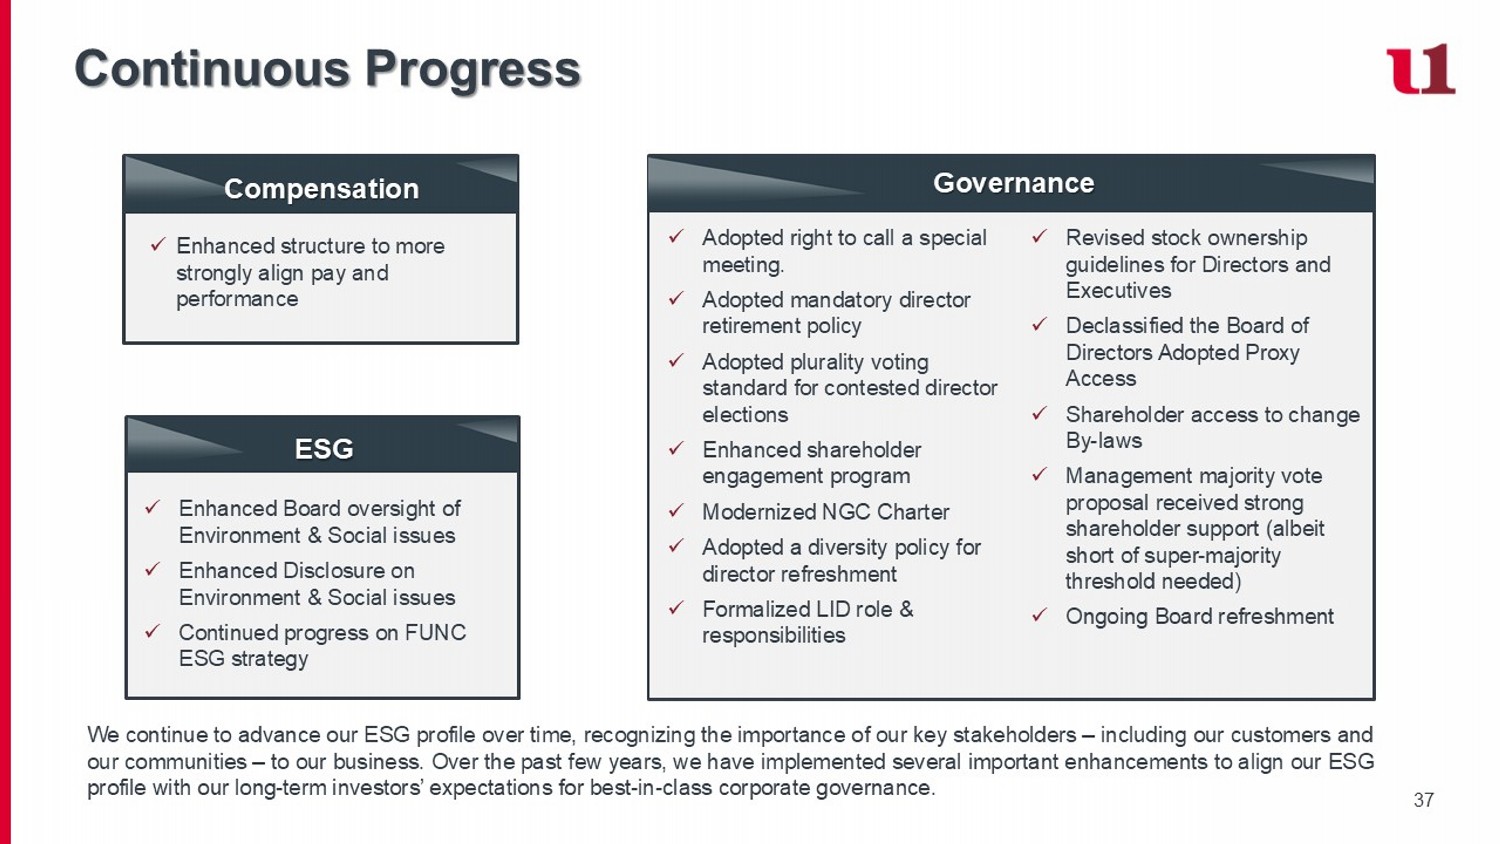
37 Continuous Progress We continue to advance our ESG profile over time, recognizing the importance of our key stakeholders – including our customers a nd our communities – to our business. Over the past few years, we have implemented several important enhancements to align our ESG profile with our long - term investors’ expectations for best - in - class corporate governance. x Enhanced structure to more strongly align pay and performance Compensation x Enhanced Board oversight of Environment & Social issues x Enhanced Disclosure on Environment & Social issues x Continued progress on FUNC ESG strategy ESG Governance x Revised stock ownership guidelines for Directors and Executives x Declassified the Board of Directors Adopted Proxy Access x Shareholder access to change By - laws x Management majority vote proposal received strong shareholder support (albeit short of super - majority threshold needed) x Ongoing Board refreshment x Adopted right to call a special meeting. x Adopted mandatory director retirement policy x Adopted plurality voting standard for contested director elections x Enhanced shareholder engagement program x Modernized NGC Charter x Adopted a diversity policy for director refreshment x Formalized LID role & responsibilities
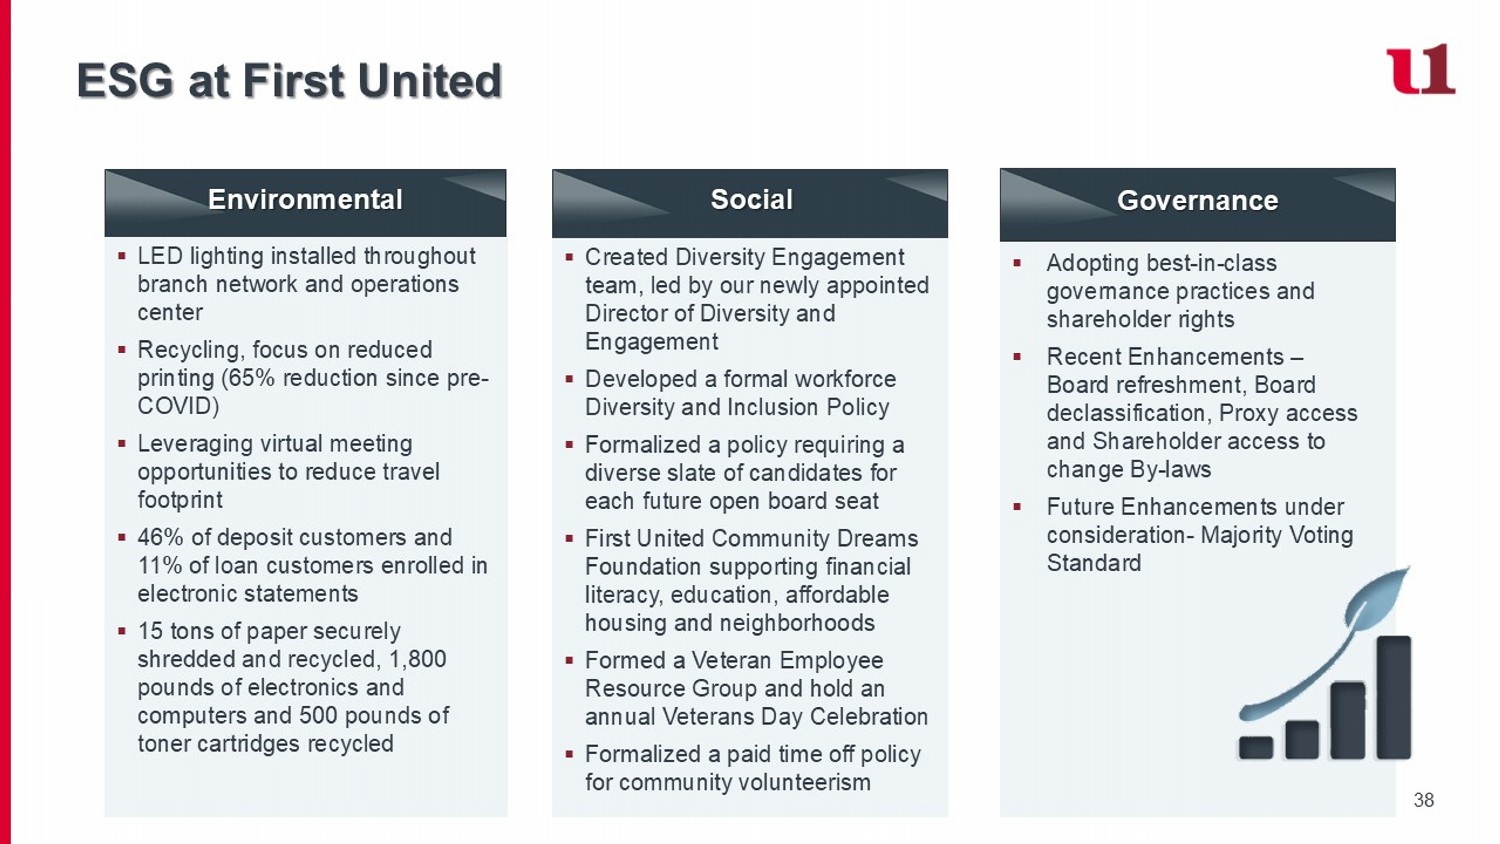
38 ESG at First United ▪ LED lighting installed throughout branch network and operations center ▪ Recycling, focus on reduced printing (65% reduction since pre - COVID) ▪ Leveraging virtual meeting opportunities to reduce travel footprint ▪ 46% of deposit customers and 11% of loan customers enrolled in electronic statements ▪ 15 tons of paper securely shredded and recycled, 1,800 pounds of electronics and computers and 500 pounds of toner cartridges recycled Environmental ▪ Created Diversity Engagement team, led by our newly appointed Director of Diversity and Engagement ▪ Developed a formal workforce Diversity and Inclusion Policy ▪ Formalized a policy requiring a diverse slate of candidates for each future open board seat ▪ First United Community Dreams Foundation supporting financial literacy, education, affordable housing and neighborhoods ▪ Formed a Veteran Employee Resource Group and hold an annual Veterans Day Celebration ▪ Formalized a paid time off policy for community volunteerism Social ▪ Adopting best - in - class governance practices and shareholder rights ▪ Recent Enhancements – Board refreshment, Board declassification, Proxy access and Shareholder access to change By - laws ▪ Future Enhancements under consideration - Majority Voting Standard Governance
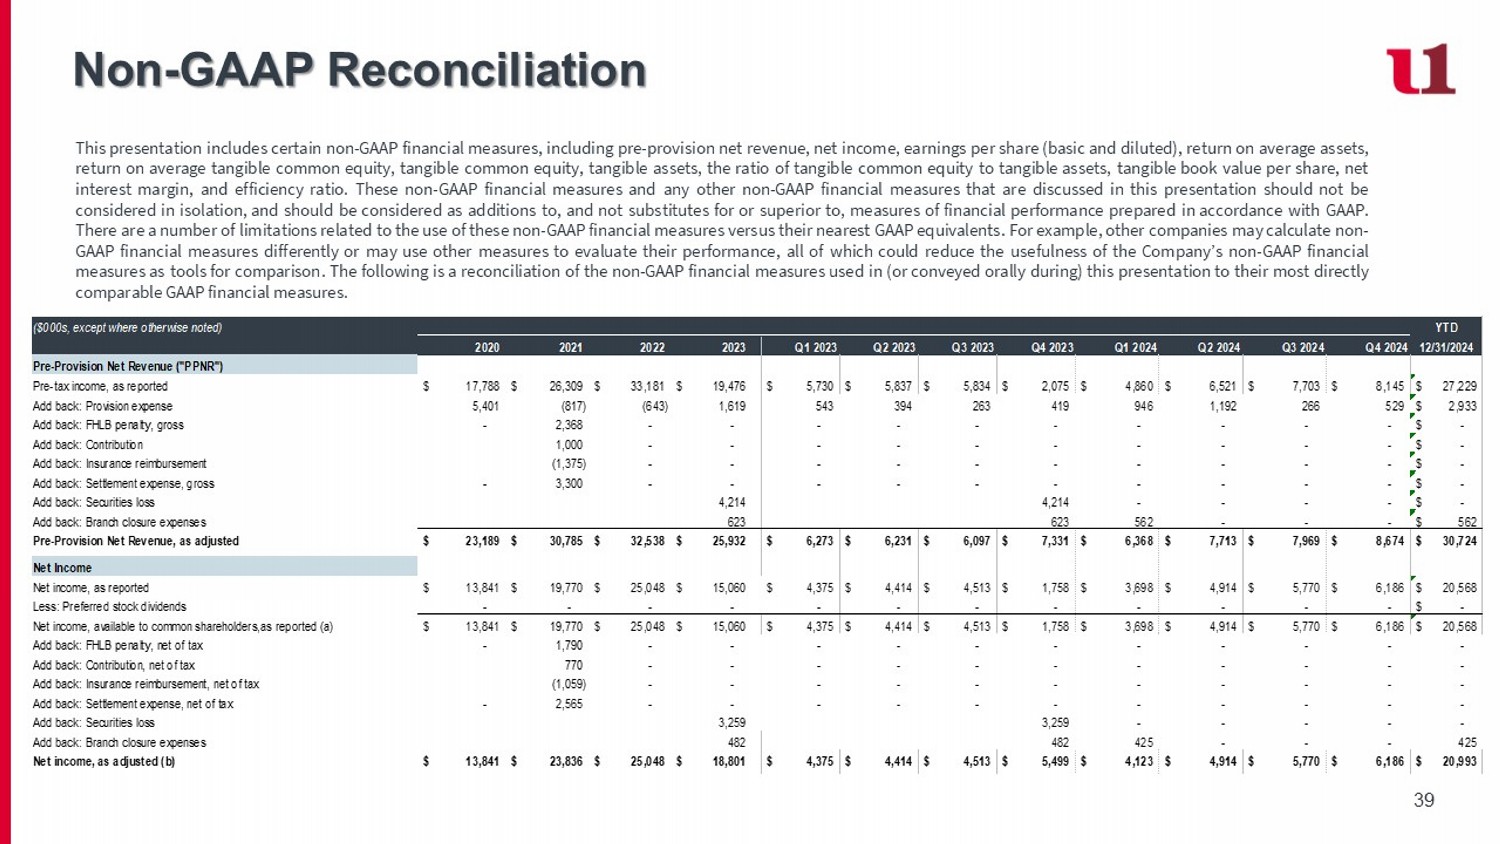
39 This presentation includes certain non - GAAP financial measures, including pre - provision net revenue, net income, earnings per share (basic and diluted), return on average assets, return on average tangible common equity, tangible common equity, tangible assets, the ratio of tangible common equity to tangible assets, tangible book value per share, net interest margin, and efficiency ratio . These non - GAAP financial measures and any other non - GAAP financial measures that are discussed in this presentation should not be considered in isolation, and should be considered as additions to, and not substitutes for or superior to, measures of financial performance prepared in accordance with GAAP . There are a number of limitations related to the use of these non - GAAP financial measures versus their nearest GAAP equivalents . For example, other companies may calculate non - GAAP financial measures differently or may use other measures to evaluate their performance, all of which could reduce the usefulness of the Company’s non - GAAP financial measures as tools for comparison . The following is a reconciliation of the non - GAAP financial measures used in (or conveyed orally during) this presentation to their most directly comparable GAAP financial measures . Non - GAAP Reconciliation ($000s, except where otherwise noted) YTD 2020 2021 2022 2023 Q1 2023 Q2 2023 Q3 2023 Q4 2023 Q1 2024 Q2 2024 Q3 2024 Q4 2024 12/31/2024 Pre-Provision Net Revenue ("PPNR") Pre-tax income, as reported 17,788$ 26,309$ 33,181$ 19,476$ 5,730$ 5,837$ 5,834$ 2,075$ 4,860$ 6,521$ 7,703$ 8,145$ 27,229$ Add back: Provision expense 5,401 (817) (643) 1,619 543 394 263 419 946 1,192 266 529 2,933$ Add back: FHLB penalty, gross - 2,368 - - - - - - - - - - -$ Add back: Contribution 1,000 - - - - - - - - - - -$ Add back: Insurance reimbursement (1,375) - - - - - - - - - - -$ Add back: Settlement expense, gross - 3,300 - - - - - - - - - - -$ Add back: Securities loss 4,214 4,214 - - - - -$ Add back: Branch closure expenses 623 623 562 - - - 562$ Pre-Provision Net Revenue, as adjusted 23,189$ 30,785$ 32,538$ 25,932$ 6,273$ 6,231$ 6,097$ 7,331$ 6,368$ 7,713$ 7,969$ 8,674$ 30,724$ Net Income Net income, as reported 13,841$ 19,770$ 25,048$ 15,060$ 4,375$ 4,414$ 4,513$ 1,758$ 3,698$ 4,914$ 5,770$ 6,186$ 20,568$ Less: Preferred stock dividends - - - - - - - - - - - - -$ Net income, available to common shareholders,as reported (a) 13,841$ 19,770$ 25,048$ 15,060$ 4,375$ 4,414$ 4,513$ 1,758$ 3,698$ 4,914$ 5,770$ 6,186$ 20,568$ Add back: FHLB penalty, net of tax - 1,790 - - - - - - - - - - - Add back: Contribution, net of tax 770 - - - - - - - - - - - Add back: Insurance reimbursement, net of tax (1,059) - - - - - - - - - - - Add back: Settlement expense, net of tax - 2,565 - - - - - - - - - - - Add back: Securities loss 3,259 3,259 - - - - - Add back: Branch closure expenses 482 482 425 - - - 425 Net income, as adjusted (b) 13,841$ 23,836$ 25,048$ 18,801$ 4,375$ 4,414$ 4,513$ 5,499$ 4,123$ 4,914$ 5,770$ 6,186$ 20,993$
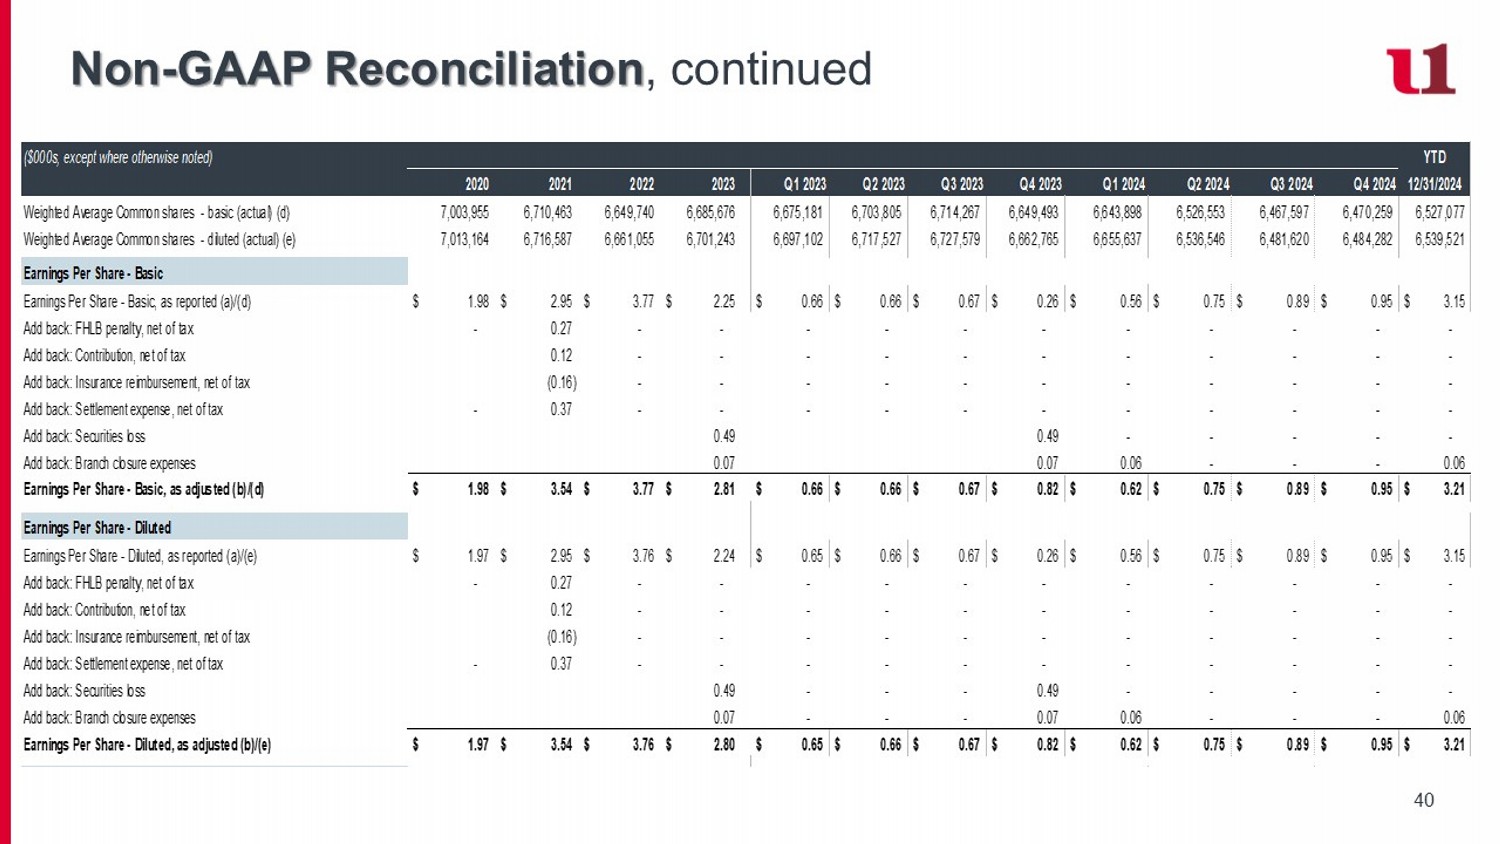
40 Non - GAAP Reconciliation , continued ($000s, except where otherwise noted) YTD 2020 2021 2022 2023 Q1 2023 Q2 2023 Q3 2023 Q4 2023 Q1 2024 Q2 2024 Q3 2024 Q4 2024 12/31/2024 Weighted Average Common shares - basic (actual) (d) 7,003,955 6,710,463 6,649,740 6,685,676 6,675,181 6,703,805 6,714,267 6,649,493 6,643,898 6,526,553 6,467,597 6,470,259 6,527,077 Weighted Average Common shares - diluted (actual) (e) 7,013,164 6,716,587 6,661,055 6,701,243 6,697,102 6,717,527 6,727,579 6,662,765 6,655,637 6,536,546 6,481,620 6,484,282 6,539,521 Earnings Per Share - Basic Earnings Per Share - Basic, as reported (a)/(d) 1.98$ 2.95$ 3.77$ 2.25$ 0.66$ 0.66$ 0.67$ 0.26$ 0.56$ 0.75$ 0.89$ 0.95$ 3.15$ Add back: FHLB penalty, net of tax - 0.27 - - - - - - - - - - - Add back: Contribution, net of tax 0.12 - - - - - - - - - - - Add back: Insurance reimbursement, net of tax (0.16) - - - - - - - - - - - Add back: Settlement expense, net of tax - 0.37 - - - - - - - - - - - Add back: Securities loss 0.49 0.49 - - - - - Add back: Branch closure expenses 0.07 0.07 0.06 - - - 0.06 Earnings Per Share - Basic, as adjusted (b)/(d) 1.98$ 3.54$ 3.77$ 2.81$ 0.66$ 0.66$ 0.67$ 0.82$ 0.62$ 0.75$ 0.89$ 0.95$ 3.21$ Earnings Per Share - Diluted Earnings Per Share - Diluted, as reported (a)/(e) 1.97$ 2.95$ 3.76$ 2.24$ 0.65$ 0.66$ 0.67$ 0.26$ 0.56$ 0.75$ 0.89$ 0.95$ 3.15$ Add back: FHLB penalty, net of tax - 0.27 - - - - - - - - - - - Add back: Contribution, net of tax 0.12 - - - - - - - - - - - Add back: Insurance reimbursement, net of tax (0.16) - - - - - - - - - - - Add back: Settlement expense, net of tax - 0.37 - - - - - - - - - - - Add back: Securities loss 0.49 - - - 0.49 - - - - - Add back: Branch closure expenses 0.07 - - - 0.07 0.06 - - - 0.06 Earnings Per Share - Diluted, as adjusted (b)/(e) 1.97$ 3.54$ 3.76$ 2.80$ 0.65$ 0.66$ 0.67$ 0.82$ 0.62$ 0.75$ 0.89$ 0.95$ 3.21$
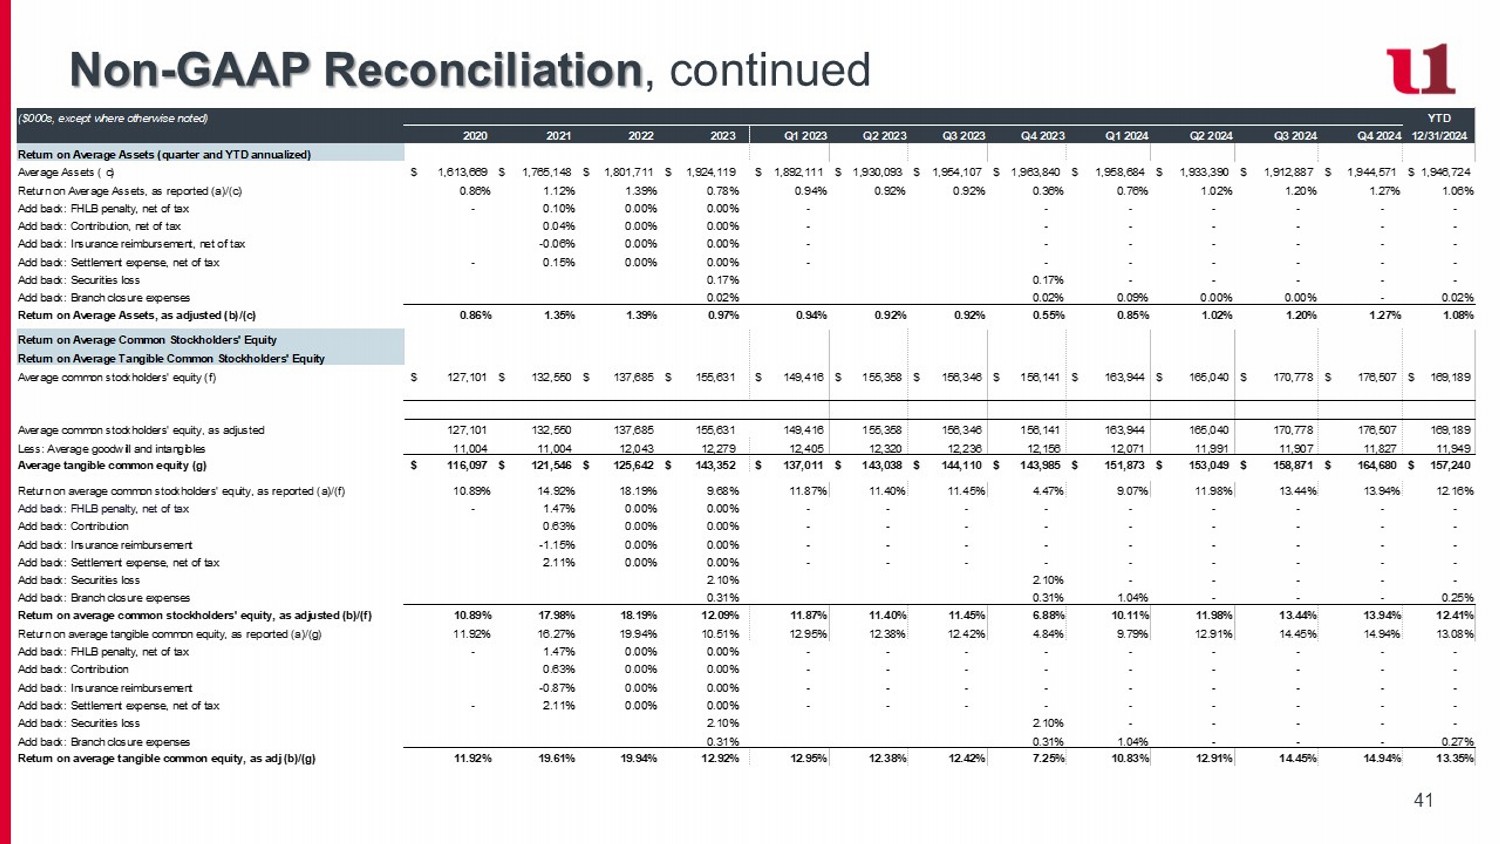
41 Non - GAAP Reconciliation , continued ($000s, except where otherwise noted) YTD 2020 2021 2022 2023 Q1 2023 Q2 2023 Q3 2023 Q4 2023 Q1 2024 Q2 2024 Q3 2024 Q4 2024 12/31/2024 Return on Average Assets (quarter and YTD annualized) Average Assets ( c) 1,613,669$ 1,765,148$ 1,801,711$ 1,924,119$ 1,892,111$ 1,930,093$ 1,954,107$ 1,963,840$ 1,958,684$ 1,933,390$ 1,912,887$ 1,944,571$ 1,946,724$ Return on Average Assets, as reported (a)/(c) 0.86% 1.12% 1.39% 0.78% 0.94% 0.92% 0.92% 0.36% 0.76% 1.02% 1.20% 1.27% 1.06% Add back: FHLB penalty, net of tax - 0.10% 0.00% 0.00% - - - - - - - Add back: Contribution, net of tax 0.04% 0.00% 0.00% - - - - - - - Add back: Insurance reimbursement, net of tax -0.06% 0.00% 0.00% - - - - - - - Add back: Settlement expense, net of tax - 0.15% 0.00% 0.00% - - - - - - - Add back: Securities loss 0.17% 0.17% - - - - - Add back: Branch closure expenses 0.02% 0.02% 0.09% 0.00% 0.00% - 0.02% Return on Average Assets, as adjusted (b)/(c) 0.86% 1.35% 1.39% 0.97% 0.94% 0.92% 0.92% 0.55% 0.85% 1.02% 1.20% 1.27% 1.08% Return on Average Common Stockholders' Equity Return on Average Tangible Common Stockholders' Equity Average common stockholders' equity (f) 127,101$ 132,550$ 137,685$ 155,631$ 149,416$ 155,358$ 156,346$ 156,141$ 163,944$ 165,040$ 170,778$ 176,507$ 169,189$ Average common stockholders' equity, as adjusted 127,101 132,550 137,685 155,631 149,416 155,358 156,346 156,141 163,944 165,040 170,778 176,507 169,189 Less: Average goodwill and intangibles 11,004 11,004 12,043 12,279 12,405 12,320 12,236 12,156 12,071 11,991 11,907 11,827 11,949 Average tangible common equity (g) 116,097$ 121,546$ 125,642$ 143,352$ 137,011$ 143,038$ 144,110$ 143,985$ 151,873$ 153,049$ 158,871$ 164,680$ 157,240$ Return on average common stockholders' equity, as reported (a)/(f) 10.89% 14.92% 18.19% 9.68% 11.87% 11.40% 11.45% 4.47% 9.07% 11.98% 13.44% 13.94% 12.16% Add back: FHLB penalty, net of tax - 1.47% 0.00% 0.00% - - - - - - - - - Add back: Contribution 0.63% 0.00% 0.00% - - - - - - - - - Add back: Insurance reimbursement -1.15% 0.00% 0.00% - - - - - - - - - Add back: Settlement expense, net of tax 2.11% 0.00% 0.00% - - - - - - - - - Add back: Securities loss 2.10% 2.10% - - - - - Add back: Branch closure expenses 0.31% 0.31% 1.04% - - - 0.25% Return on average common stockholders' equity, as adjusted (b)/(f) 10.89% 17.98% 18.19% 12.09% 11.87% 11.40% 11.45% 6.88% 10.11% 11.98% 13.44% 13.94% 12.41% Return on average tangible common equity, as reported (a)/(g) 11.92% 16.27% 19.94% 10.51% 12.95% 12.38% 12.42% 4.84% 9.79% 12.91% 14.45% 14.94% 13.08% Add back: FHLB penalty, net of tax - 1.47% 0.00% 0.00% - - - - - - - - - Add back: Contribution 0.63% 0.00% 0.00% - - - - - - - - - Add back: Insurance reimbursement -0.87% 0.00% 0.00% - - - - - - - - - Add back: Settlement expense, net of tax - 2.11% 0.00% 0.00% - - - - - - - - - Add back: Securities loss 2.10% 2.10% - - - - - Add back: Branch closure expenses 0.31% 0.31% 1.04% - - - 0.27% Return on average tangible common equity, as adj (b)/(g) 11.92% 19.61% 19.94% 12.92% 12.95% 12.38% 12.42% 7.25% 10.83% 12.91% 14.45% 14.94% 13.35%
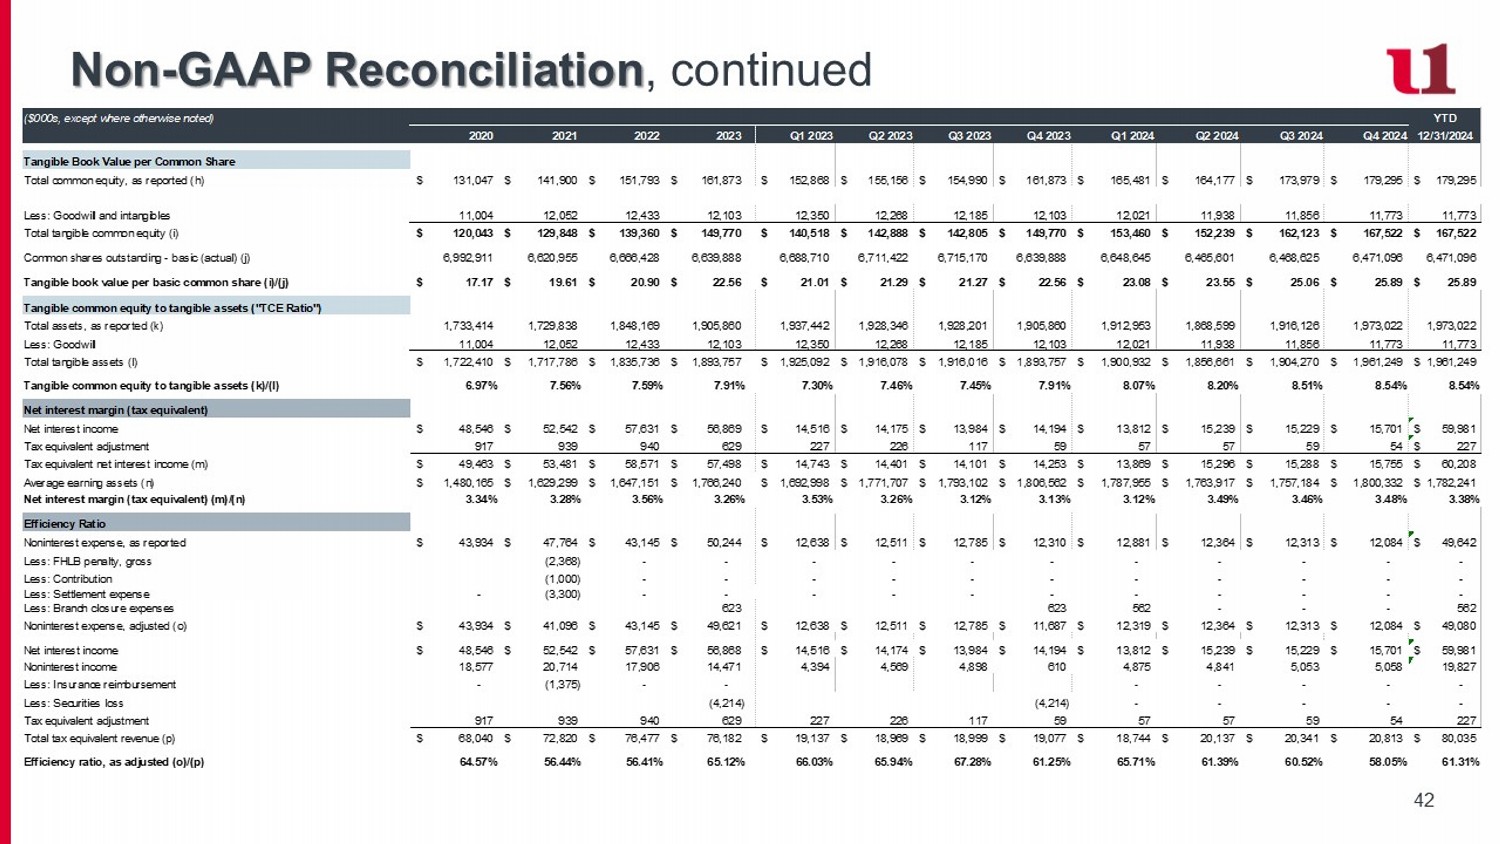
42 Non - GAAP Reconciliation , continued ($000s, except where otherwise noted) YTD 2020 2021 2022 2023 Q1 2023 Q2 2023 Q3 2023 Q4 2023 Q1 2024 Q2 2024 Q3 2024 Q4 2024 12/31/2024 Tangible Book Value per Common Share Total common equity, as reported (h) 131,047$ 141,900$ 151,793$ 161,873$ 152,868$ 155,156$ 154,990$ 161,873$ 165,481$ 164,177$ 173,979$ 179,295$ 179,295$ Less: Goodwill and intangibles 11,004 12,052 12,433 12,103 12,350 12,268 12,185 12,103 12,021 11,938 11,856 11,773 11,773 Total tangible common equity (i) 120,043$ 129,848$ 139,360$ 149,770$ 140,518$ 142,888$ 142,805$ 149,770$ 153,460$ 152,239$ 162,123$ 167,522$ 167,522$ Common shares outstanding - basic (actual) (j) 6,992,911 6,620,955 6,666,428 6,639,888 6,688,710 6,711,422 6,715,170 6,639,888 6,648,645 6,465,601 6,468,625 6,471,096 6,471,096 Tangible book value per basic common share (i)/(j) 17.17$ 19.61$ 20.90$ 22.56$ 21.01$ 21.29$ 21.27$ 22.56$ 23.08$ 23.55$ 25.06$ 25.89$ 25.89$ Tangible common equity to tangible assets ("TCE Ratio") Total assets, as reported (k) 1,733,414 1,729,838 1,848,169 1,905,860 1,937,442 1,928,346 1,928,201 1,905,860 1,912,953 1,868,599 1,916,126 1,973,022 1,973,022 Less: Goodwill 11,004 12,052 12,433 12,103 12,350 12,268 12,185 12,103 12,021 11,938 11,856 11,773 11,773 Total tangible assets (l) 1,722,410$ 1,717,786$ 1,835,736$ 1,893,757$ 1,925,092$ 1,916,078$ 1,916,016$ 1,893,757$ 1,900,932$ 1,856,661$ 1,904,270$ 1,961,249$ 1,961,249$ Tangible common equity to tangible assets (k)/(l) 6.97% 7.56% 7.59% 7.91% 7.30% 7.46% 7.45% 7.91% 8.07% 8.20% 8.51% 8.54% 8.54% Net interest margin (tax equivalent) Net interest income 48,546$ 52,542$ 57,631$ 56,869$ 14,516$ 14,175$ 13,984$ 14,194$ 13,812$ 15,239$ 15,229$ 15,701$ 59,981$ Tax equivalent adjustment 917 939 940 629 227 226 117 59 57 57 59 54 227$ Tax equivalent net interest income (m) 49,463$ 53,481$ 58,571$ 57,498$ 14,743$ 14,401$ 14,101$ 14,253$ 13,869$ 15,296$ 15,288$ 15,755$ 60,208$ Average earning assets (n) 1,480,165$ 1,629,299$ 1,647,151$ 1,766,240$ 1,692,998$ 1,771,707$ 1,793,102$ 1,806,562$ 1,787,955$ 1,763,917$ 1,757,184$ 1,800,332$ 1,782,241$ Net interest margin (tax equivalent) (m)/(n) 3.34% 3.28% 3.56% 3.26% 3.53% 3.26% 3.12% 3.13% 3.12% 3.49% 3.46% 3.48% 3.38% Efficiency Ratio Noninterest expense, as reported 43,934$ 47,764$ 43,145$ 50,244$ 12,638$ 12,511$ 12,785$ 12,310$ 12,881$ 12,364$ 12,313$ 12,084$ 49,642$ Less: FHLB penalty, gross (2,368) - - - - - - - - - - - Less: Contribution (1,000) - - - - - - - - - - - Less: Settlement expense - (3,300) - - - - - - - - - - - Less: Branch closure expenses 623 623 562 - - - 562 Noninterest expense, adjusted (o) 43,934$ 41,096$ 43,145$ 49,621$ 12,638$ 12,511$ 12,785$ 11,687$ 12,319$ 12,364$ 12,313$ 12,084$ 49,080$ Net interest income 48,546$ 52,542$ 57,631$ 56,868$ 14,516$ 14,174$ 13,984$ 14,194$ 13,812$ 15,239$ 15,229$ 15,701$ 59,981$ Noninterest income 18,577 20,714 17,906 14,471 4,394 4,569 4,898 610 4,875 4,841 5,053 5,058 19,827 Less: Insurance reimbursement - (1,375) - - - - - - - Less: Securities loss (4,214) (4,214) - - - - - Tax equivalent adjustment 917 939 940 629 227 226 117 59 57 57 59 54 227 Total tax equivalent revenue (p) 68,040$ 72,820$ 76,477$ 76,182$ 19,137$ 18,969$ 18,999$ 19,077$ 18,744$ 20,137$ 20,341$ 20,813$ 80,035$ Efficiency ratio, as adjusted (o)/(p) 64.57% 56.44% 56.41% 65.12% 66.03% 65.94% 67.28% 61.25% 65.71% 61.39% 60.52% 58.05% 61.31%
v3.25.0.1
| X |
- DefinitionBoolean flag that is true when the XBRL content amends previously-filed or accepted submission.
| Name: |
dei_AmendmentFlag |
| Namespace Prefix: |
dei_ |
| Data Type: |
xbrli:booleanItemType |
| Balance Type: |
na |
| Period Type: |
duration |
|
| X |
- DefinitionFor the EDGAR submission types of Form 8-K: the date of the report, the date of the earliest event reported; for the EDGAR submission types of Form N-1A: the filing date; for all other submission types: the end of the reporting or transition period. The format of the date is YYYY-MM-DD.
| Name: |
dei_DocumentPeriodEndDate |
| Namespace Prefix: |
dei_ |
| Data Type: |
xbrli:dateItemType |
| Balance Type: |
na |
| Period Type: |
duration |
|
| X |
- DefinitionThe type of document being provided (such as 10-K, 10-Q, 485BPOS, etc). The document type is limited to the same value as the supporting SEC submission type, or the word 'Other'.
| Name: |
dei_DocumentType |
| Namespace Prefix: |
dei_ |
| Data Type: |
dei:submissionTypeItemType |
| Balance Type: |
na |
| Period Type: |
duration |
|
| X |
- DefinitionAddress Line 1 such as Attn, Building Name, Street Name
| Name: |
dei_EntityAddressAddressLine1 |
| Namespace Prefix: |
dei_ |
| Data Type: |
xbrli:normalizedStringItemType |
| Balance Type: |
na |
| Period Type: |
duration |
|
| X |
- Definition
+ References
+ Details
| Name: |
dei_EntityAddressCityOrTown |
| Namespace Prefix: |
dei_ |
| Data Type: |
xbrli:normalizedStringItemType |
| Balance Type: |
na |
| Period Type: |
duration |
|
| X |
- DefinitionCode for the postal or zip code
| Name: |
dei_EntityAddressPostalZipCode |
| Namespace Prefix: |
dei_ |
| Data Type: |
xbrli:normalizedStringItemType |
| Balance Type: |
na |
| Period Type: |
duration |
|
| X |
- DefinitionName of the state or province.
| Name: |
dei_EntityAddressStateOrProvince |
| Namespace Prefix: |
dei_ |
| Data Type: |
dei:stateOrProvinceItemType |
| Balance Type: |
na |
| Period Type: |
duration |
|
| X |
- DefinitionA unique 10-digit SEC-issued value to identify entities that have filed disclosures with the SEC. It is commonly abbreviated as CIK. Reference 1: http://www.xbrl.org/2003/role/presentationRef
-Publisher SEC
-Name Exchange Act
-Number 240
-Section 12
-Subsection b-2
| Name: |
dei_EntityCentralIndexKey |
| Namespace Prefix: |
dei_ |
| Data Type: |
dei:centralIndexKeyItemType |
| Balance Type: |
na |
| Period Type: |
duration |
|
| X |
- DefinitionIndicate if registrant meets the emerging growth company criteria. Reference 1: http://www.xbrl.org/2003/role/presentationRef
-Publisher SEC
-Name Exchange Act
-Number 240
-Section 12
-Subsection b-2
| Name: |
dei_EntityEmergingGrowthCompany |
| Namespace Prefix: |
dei_ |
| Data Type: |
xbrli:booleanItemType |
| Balance Type: |
na |
| Period Type: |
duration |
|
| X |
- DefinitionCommission file number. The field allows up to 17 characters. The prefix may contain 1-3 digits, the sequence number may contain 1-8 digits, the optional suffix may contain 1-4 characters, and the fields are separated with a hyphen.
| Name: |
dei_EntityFileNumber |
| Namespace Prefix: |
dei_ |
| Data Type: |
dei:fileNumberItemType |
| Balance Type: |
na |
| Period Type: |
duration |
|
| X |
- DefinitionTwo-character EDGAR code representing the state or country of incorporation.
| Name: |
dei_EntityIncorporationStateCountryCode |
| Namespace Prefix: |
dei_ |
| Data Type: |
dei:edgarStateCountryItemType |
| Balance Type: |
na |
| Period Type: |
duration |
|
| X |
- DefinitionThe exact name of the entity filing the report as specified in its charter, which is required by forms filed with the SEC. Reference 1: http://www.xbrl.org/2003/role/presentationRef
-Publisher SEC
-Name Exchange Act
-Number 240
-Section 12
-Subsection b-2
| Name: |
dei_EntityRegistrantName |
| Namespace Prefix: |
dei_ |
| Data Type: |
xbrli:normalizedStringItemType |
| Balance Type: |
na |
| Period Type: |
duration |
|
| X |
- DefinitionThe Tax Identification Number (TIN), also known as an Employer Identification Number (EIN), is a unique 9-digit value assigned by the IRS. Reference 1: http://www.xbrl.org/2003/role/presentationRef
-Publisher SEC
-Name Exchange Act
-Number 240
-Section 12
-Subsection b-2
| Name: |
dei_EntityTaxIdentificationNumber |
| Namespace Prefix: |
dei_ |
| Data Type: |
dei:employerIdItemType |
| Balance Type: |
na |
| Period Type: |
duration |
|
| X |
- DefinitionLocal phone number for entity.
| Name: |
dei_LocalPhoneNumber |
| Namespace Prefix: |
dei_ |
| Data Type: |
xbrli:normalizedStringItemType |
| Balance Type: |
na |
| Period Type: |
duration |
|
| X |
- DefinitionBoolean flag that is true when the Form 8-K filing is intended to satisfy the filing obligation of the registrant as pre-commencement communications pursuant to Rule 13e-4(c) under the Exchange Act. Reference 1: http://www.xbrl.org/2003/role/presentationRef
-Publisher SEC
-Name Exchange Act
-Number 240
-Section 13e
-Subsection 4c
| Name: |
dei_PreCommencementIssuerTenderOffer |
| Namespace Prefix: |
dei_ |
| Data Type: |
xbrli:booleanItemType |
| Balance Type: |
na |
| Period Type: |
duration |
|
| X |
- DefinitionBoolean flag that is true when the Form 8-K filing is intended to satisfy the filing obligation of the registrant as pre-commencement communications pursuant to Rule 14d-2(b) under the Exchange Act. Reference 1: http://www.xbrl.org/2003/role/presentationRef
-Publisher SEC
-Name Exchange Act
-Number 240
-Section 14d
-Subsection 2b
| Name: |
dei_PreCommencementTenderOffer |
| Namespace Prefix: |
dei_ |
| Data Type: |
xbrli:booleanItemType |
| Balance Type: |
na |
| Period Type: |
duration |
|
| X |
- DefinitionTitle of a 12(b) registered security. Reference 1: http://www.xbrl.org/2003/role/presentationRef
-Publisher SEC
-Name Exchange Act
-Number 240
-Section 12
-Subsection b
| Name: |
dei_Security12bTitle |
| Namespace Prefix: |
dei_ |
| Data Type: |
dei:securityTitleItemType |
| Balance Type: |
na |
| Period Type: |
duration |
|
| X |
- DefinitionName of the Exchange on which a security is registered. Reference 1: http://www.xbrl.org/2003/role/presentationRef
-Publisher SEC
-Name Exchange Act
-Number 240
-Section 12
-Subsection d1-1
| Name: |
dei_SecurityExchangeName |
| Namespace Prefix: |
dei_ |
| Data Type: |
dei:edgarExchangeCodeItemType |
| Balance Type: |
na |
| Period Type: |
duration |
|
| X |
- DefinitionBoolean flag that is true when the Form 8-K filing is intended to satisfy the filing obligation of the registrant as soliciting material pursuant to Rule 14a-12 under the Exchange Act. Reference 1: http://www.xbrl.org/2003/role/presentationRef
-Publisher SEC
-Name Exchange Act
-Section 14a
-Number 240
-Subsection 12
| Name: |
dei_SolicitingMaterial |
| Namespace Prefix: |
dei_ |
| Data Type: |
xbrli:booleanItemType |
| Balance Type: |
na |
| Period Type: |
duration |
|
| X |
- DefinitionTrading symbol of an instrument as listed on an exchange.
| Name: |
dei_TradingSymbol |
| Namespace Prefix: |
dei_ |
| Data Type: |
dei:tradingSymbolItemType |
| Balance Type: |
na |
| Period Type: |
duration |
|
| X |
- DefinitionBoolean flag that is true when the Form 8-K filing is intended to satisfy the filing obligation of the registrant as written communications pursuant to Rule 425 under the Securities Act. Reference 1: http://www.xbrl.org/2003/role/presentationRef
-Publisher SEC
-Name Securities Act
-Number 230
-Section 425
| Name: |
dei_WrittenCommunications |
| Namespace Prefix: |
dei_ |
| Data Type: |
xbrli:booleanItemType |
| Balance Type: |
na |
| Period Type: |
duration |
|
First United (NASDAQ:FUNC)
Graphique Historique de l'Action
De Jan 2025 à Fév 2025

First United (NASDAQ:FUNC)
Graphique Historique de l'Action
De Fév 2024 à Fév 2025

