Pay vs Performance Disclosure - USD ($)
|
12 Months Ended |
Dec. 31, 2024 |
Dec. 31, 2023 |
Dec. 31, 2022 |
Dec. 31, 2021 |
Dec. 31, 2020 |
| Pay vs Performance Disclosure |
|
|
|
|
|
| Pay vs Performance Disclosure, Table |
| | | | | | | | | | | | | | | | | | | | | | | | | | | Value of Initial Fixed $100 | | | | | | | | | | | Average Summary | | | | | | | | | | | | | Summary | | | | Compensation | | Average | | | | Peer Group | | | | | | | Compensation | | Compensation | | Table Total for | | Compensation | | Total | | Total | | | | | Fiscal | | Table Total For | | Actually Paid | | Non-PEO NEOs | | Actually Paid Non- | | Shareholder | | Shareholder | | Net Income | | EBITDA(6) | Year | | PEO ($)(1) | | to PEO ($)(2) | | ($)(3) | | PEO NEOs ($)(4) | | Return (TSR) | | Return(5) | | ($ in millions) | | ($ in millions) | (a) | | (b) | | (c) | | (d) | | (e) | | (f) | | (g) | | (h) | | (i) | 2020 | | 5,477,333 | | 15,959,815 | | 1,966,849 | | 4,478,273 | | 143 | | 112 | | 193.1 | | 423.7 | 2021 | | 5,957,058 | | 18,441,621 | | 2,131,642 | | 5,339,084 | | 229 | | 151 | | 927.4 | | 1,350.3 | 2022 | | 6,027,870 | | 838,314 | | 2,076,267 | | 719,551 | | 162 | | 108 | | 1,063.9 | | 1,526.2 | 2023 | | 6,165,815 | | 18,796,575 | | 2,080,781 | | 5,304,691 | | 288 | | 136 | | 297.1 | | 516.7 | 2024 | | 6,146,934 | | 12,582,624 | | 2,147,773 | | 3,712,399 | | 358 | | 143 | | 476.4 | | 738.9 |
(1) | The dollar amounts reported are the amounts of total compensation reported in the Summary Compensation Table (“SCT”) for our CEO (“Principal Executive Officer” or “PEO”). |
(2) | The dollar amounts reported represent the amount of CAP for the PEO, as computed in accordance with SEC rules. The dollar amounts do not reflect the actual amount of compensation earned by or paid to an executive during the applicable year. CAP includes year-over-year changes in the value of unvested equity awards, and therefore may not reflect the value ultimately realized upon vesting of the awards. In accordance with SEC rules, the following adjustments were made to total compensation to determine the CAP: |
| | | | | | | | | | | | | | | | | Less SCT | | Less SCT | | Plus CAP | | Plus CAP | | | | | SCT | | Stock | | Pension | | Equity | | Pension | | Compensation | | | Total | | Awards | | Value | | Adjustment | | Adjustment | | Actually Paid | Year | | ($) | | ($)(a) | | ($)(b) | | ($)(c) | | ($)(d) | | ($) | 2020 | | 5,477,333 | | 2,662,521 | | 362,244 | | 13,411,142 | | 96,105 | | 15,959,815 | 2021 | | 5,957,058 | | 3,184,092 | | 112,142 | | 15,679,416 | | 101,381 | | 18,441,621 | 2022 | | 6,027,870 | | 3,341,181 | | — | | (1,978,185) | | 129,810 | | 838,314 | 2023 | | 6,165,815 | | 3,237,822 | | 196,171 | | 15,988,677 | | 76,076 | | 18,796,575 | 2024 | | 6,146,934 | | 3,299,485 | | 52,827 | | 9,670,679 | | 117,323 | | 12,582,624 |
| (a) | The grant date fair value of equity awards represents the total of the amounts reported in the “Stock Awards” column in the Summary Compensation Table for the applicable year. |
| (b) | Represents change in actuarial present value of defined benefit retirement plans for the covered fiscal year. |
| (c) | The equity award adjustments for each applicable year include the addition (or subtraction, as applicable) of the following: (i) the year-end fair value of any equity awards granted in the applicable year that are outstanding and unvested as of the end of the year; (ii) the amount of change as of the end of the applicable year (from the end of the prior fiscal year) in fair value of any awards granted in prior years that are outstanding and unvested as of the end of the applicable year; and (iii) for awards granted in prior years that vest in the applicable year, the amount equal to the change as of the vesting date (from the end of the prior fiscal year) in fair value. For 2024, continued share price appreciation drove a positive equity award adjustment. The amounts deducted or added in calculating the equity award adjustments are as follows: |
| | | | | | | | | | | Year-End | | Year Over Year Change in | | Change | | | | | Fair Value of | | Fair Value of Outstanding | | in Fair Value of Equity | | | | | Equity Awards | | and Unvested | | Awards Granted in | | Total Equity | | | Granted | | Equity Awards | | Prior Years that Vested | | Award | | | During the Year | | Granted in Prior Years | | in the Year(e) | | Adjustments | Year | | ($) | | ($) | | ($) | | ($) | 2020 | | 6,279,437 | | 7,257,784 | | (126,079) | | 13,411,142 | 2021 | | 6,804,516 | | 7,725,233 | | 1,149,667 | | 15,679,416 | 2022 | | 1,981,115 | | (4,447,058) | | 487,758 | | (1,978,185) | 2023 | | 8,918,914 | | 7,009,449 | | 60,314 | | 15,988,677 | 2024 | | 5,789,183 | | 3,493,546 | | 387,950 | | 9,670,679 |
| (d) | Represents defined benefit retirement plan service cost attributed to services rendered during the covered fiscal year. |
| (e) | Represents change in fair value from prior year end to vesting date. |
(3) | The dollar amounts reported represent the average of the amounts reported for the Company’s NEOs as a group (excluding our CEO) in the “Total” column of the SCT in each applicable year. The names of each of the NEOs (excluding our CEO) included for purposes of calculating the average amounts in each applicable year are as follows: (i) for 2022, 2023 and 2024, Joel M. Wine, Peter T. Heilmann, John P. Lauer, and Rusty K. Rolfe; and (ii) for 2021 and 2020, Joel M. Wine, Ronald J. Forest, Peter T. Heilmann, and John P. Lauer. |
(4) | The dollar amounts reported represent the average amount of CAP for the NEOs as a group (excluding our CEO), as computed in accordance with SEC rules. The dollar amounts do not reflect the actual average amount of compensation earned by or paid to the NEOs as a group (excluding our CEO) during the applicable year. CAP includes year-over-year changes in the value of unvested equity awards, and therefore may not reflect the value ultimately realized upon vesting of the awards. In accordance with SEC rules, the following adjustments were made to average total compensation for the NEOs as a group (excluding our CEO) for each year to determine the CAP: |
| | | | | | | | | | | | | | | | | Less SCT | | Less SCT | | Plus CAP | | Plus CAP | | | | | SCT | | Stock | | Pension | | Equity | | Pension | | Compensation | | | Total | | Awards | | Value | | Adjustment | | Adjustment | | Actually Paid | Year | | ($) | | ($)(a) | | ($)(b) | | ($)(c) | | ($)(d) | | ($) | 2020 | | 1,966,849 | | 753,591 | | 83,785 | | 3,311,416 | | 37,384 | | 4,478,273 | 2021 | | 2,131,642 | | 878,384 | | 28,243 | | 4,075,589 | | 38,480 | | 5,339,084 | 2022 | | 2,076,267 | | 891,106 | | — | | (512,818) | | 47,208 | | 719,551 | 2023 | | 2,080,781 | | 809,446 | | 86,829 | | 4,087,803 | | 32,383 | | 5,304,691 | 2024 | | 2,147,773 | | 825,046 | | 103,743 | | 2,443,887 | | 49,528 | | 3,712,399 |
| (a) | The grant date fair value of equity awards represents the total of the amounts reported in the “Stock Awards” column in the Summary Compensation Table for the applicable year. |
| (b) | Represents change in actuarial present value of defined benefit retirement plans for the covered fiscal year. |
| (c) | The equity award adjustments for each applicable year include the addition (or subtraction, as applicable) of the following: (i) the year-end fair value of any equity awards granted in the applicable year that are outstanding and unvested as of the end of the year; (ii) the amount of change as of the end of the applicable year (from the end of the prior fiscal year) in fair value of any awards granted in prior years that are outstanding and unvested as of the end of the applicable year; and (iii) for awards granted in prior years that vest in the applicable year, the amount equal to the change as of the vesting date (from the end of the prior fiscal year) in fair value. For 2024, continued share price appreciation drove a positive equity award adjustment. The amounts deducted or added in calculating the equity award adjustments are as follows: |
| | | | | | | | | | | Year-End | | Year Over Year Change in | | Change in | | | | | Fair Value of | | Fair Value of Outstanding | | Fair Value of Equity | | | | | Equity Awards | | and Unvested | | Awards Granted in | | Total Equity | | | Granted | | Equity Awards | | Prior Years that Vested | | Award | | | During the Year | | Granted in Prior Years | | in the Year(e) | | Adjustments | Year | | ($) | | ($) | | ($) | | ($) | 2020 | | 1,777,310 | | 1,596,777 | | (62,671) | | 3,311,416 | 2021 | | 1,877,186 | | 1,937,980 | | 260,423 | | 4,075,589 | 2022 | | 528,368 | | (1,140,610) | | 99,424 | | (512,818) | 2023 | | 2,229,738 | | 1,842,615 | | 15,450 | | 4,087,803 | 2024 | | 1,447,645 | | 896,160 | | 100,082 | | 2,443,887 |
| (d) | Represents defined benefit retirement plan service cost attributed to services rendered during the covered fiscal year. |
| (e) | Represents change in fair value from prior year end to vesting date. |
(5) | S&P Transportation Select Industry Index |
(6) | See Exhibit B for a reconciliation of net income to EBITDA. |
|
|
|
|
|
| Company Selected Measure Name |
EBITDA(6)
|
|
|
|
|
| Named Executive Officers, Footnote |
(3) | The dollar amounts reported represent the average of the amounts reported for the Company’s NEOs as a group (excluding our CEO) in the “Total” column of the SCT in each applicable year. The names of each of the NEOs (excluding our CEO) included for purposes of calculating the average amounts in each applicable year are as follows: (i) for 2022, 2023 and 2024, Joel M. Wine, Peter T. Heilmann, John P. Lauer, and Rusty K. Rolfe; and (ii) for 2021 and 2020, Joel M. Wine, Ronald J. Forest, Peter T. Heilmann, and John P. Lauer. |
|
|
|
|
|
| Peer Group Issuers, Footnote |
(5) | S&P Transportation Select Industry Index |
|
|
|
|
|
| PEO Total Compensation Amount |
$ 6,146,934
|
$ 6,165,815
|
$ 6,027,870
|
$ 5,957,058
|
$ 5,477,333
|
| PEO Actually Paid Compensation Amount |
$ 12,582,624
|
18,796,575
|
838,314
|
18,441,621
|
15,959,815
|
| Adjustment To PEO Compensation, Footnote |
(2) | The dollar amounts reported represent the amount of CAP for the PEO, as computed in accordance with SEC rules. The dollar amounts do not reflect the actual amount of compensation earned by or paid to an executive during the applicable year. CAP includes year-over-year changes in the value of unvested equity awards, and therefore may not reflect the value ultimately realized upon vesting of the awards. In accordance with SEC rules, the following adjustments were made to total compensation to determine the CAP: |
| | | | | | | | | | | | | | | | | Less SCT | | Less SCT | | Plus CAP | | Plus CAP | | | | | SCT | | Stock | | Pension | | Equity | | Pension | | Compensation | | | Total | | Awards | | Value | | Adjustment | | Adjustment | | Actually Paid | Year | | ($) | | ($)(a) | | ($)(b) | | ($)(c) | | ($)(d) | | ($) | 2020 | | 5,477,333 | | 2,662,521 | | 362,244 | | 13,411,142 | | 96,105 | | 15,959,815 | 2021 | | 5,957,058 | | 3,184,092 | | 112,142 | | 15,679,416 | | 101,381 | | 18,441,621 | 2022 | | 6,027,870 | | 3,341,181 | | — | | (1,978,185) | | 129,810 | | 838,314 | 2023 | | 6,165,815 | | 3,237,822 | | 196,171 | | 15,988,677 | | 76,076 | | 18,796,575 | 2024 | | 6,146,934 | | 3,299,485 | | 52,827 | | 9,670,679 | | 117,323 | | 12,582,624 |
| (a) | The grant date fair value of equity awards represents the total of the amounts reported in the “Stock Awards” column in the Summary Compensation Table for the applicable year. |
| (b) | Represents change in actuarial present value of defined benefit retirement plans for the covered fiscal year. |
| (c) | The equity award adjustments for each applicable year include the addition (or subtraction, as applicable) of the following: (i) the year-end fair value of any equity awards granted in the applicable year that are outstanding and unvested as of the end of the year; (ii) the amount of change as of the end of the applicable year (from the end of the prior fiscal year) in fair value of any awards granted in prior years that are outstanding and unvested as of the end of the applicable year; and (iii) for awards granted in prior years that vest in the applicable year, the amount equal to the change as of the vesting date (from the end of the prior fiscal year) in fair value. For 2024, continued share price appreciation drove a positive equity award adjustment. The amounts deducted or added in calculating the equity award adjustments are as follows: |
| | | | | | | | | | | Year-End | | Year Over Year Change in | | Change | | | | | Fair Value of | | Fair Value of Outstanding | | in Fair Value of Equity | | | | | Equity Awards | | and Unvested | | Awards Granted in | | Total Equity | | | Granted | | Equity Awards | | Prior Years that Vested | | Award | | | During the Year | | Granted in Prior Years | | in the Year(e) | | Adjustments | Year | | ($) | | ($) | | ($) | | ($) | 2020 | | 6,279,437 | | 7,257,784 | | (126,079) | | 13,411,142 | 2021 | | 6,804,516 | | 7,725,233 | | 1,149,667 | | 15,679,416 | 2022 | | 1,981,115 | | (4,447,058) | | 487,758 | | (1,978,185) | 2023 | | 8,918,914 | | 7,009,449 | | 60,314 | | 15,988,677 | 2024 | | 5,789,183 | | 3,493,546 | | 387,950 | | 9,670,679 |
| (d) | Represents defined benefit retirement plan service cost attributed to services rendered during the covered fiscal year. |
| (e) | Represents change in fair value from prior year end to vesting date. |
|
|
|
|
|
| Non-PEO NEO Average Total Compensation Amount |
$ 2,147,773
|
2,080,781
|
2,076,267
|
2,131,642
|
1,966,849
|
| Non-PEO NEO Average Compensation Actually Paid Amount |
$ 3,712,399
|
5,304,691
|
719,551
|
5,339,084
|
4,478,273
|
| Adjustment to Non-PEO NEO Compensation Footnote |
(4) | The dollar amounts reported represent the average amount of CAP for the NEOs as a group (excluding our CEO), as computed in accordance with SEC rules. The dollar amounts do not reflect the actual average amount of compensation earned by or paid to the NEOs as a group (excluding our CEO) during the applicable year. CAP includes year-over-year changes in the value of unvested equity awards, and therefore may not reflect the value ultimately realized upon vesting of the awards. In accordance with SEC rules, the following adjustments were made to average total compensation for the NEOs as a group (excluding our CEO) for each year to determine the CAP: |
| | | | | | | | | | | | | | | | | Less SCT | | Less SCT | | Plus CAP | | Plus CAP | | | | | SCT | | Stock | | Pension | | Equity | | Pension | | Compensation | | | Total | | Awards | | Value | | Adjustment | | Adjustment | | Actually Paid | Year | | ($) | | ($)(a) | | ($)(b) | | ($)(c) | | ($)(d) | | ($) | 2020 | | 1,966,849 | | 753,591 | | 83,785 | | 3,311,416 | | 37,384 | | 4,478,273 | 2021 | | 2,131,642 | | 878,384 | | 28,243 | | 4,075,589 | | 38,480 | | 5,339,084 | 2022 | | 2,076,267 | | 891,106 | | — | | (512,818) | | 47,208 | | 719,551 | 2023 | | 2,080,781 | | 809,446 | | 86,829 | | 4,087,803 | | 32,383 | | 5,304,691 | 2024 | | 2,147,773 | | 825,046 | | 103,743 | | 2,443,887 | | 49,528 | | 3,712,399 |
| (a) | The grant date fair value of equity awards represents the total of the amounts reported in the “Stock Awards” column in the Summary Compensation Table for the applicable year. |
| (b) | Represents change in actuarial present value of defined benefit retirement plans for the covered fiscal year. |
| (c) | The equity award adjustments for each applicable year include the addition (or subtraction, as applicable) of the following: (i) the year-end fair value of any equity awards granted in the applicable year that are outstanding and unvested as of the end of the year; (ii) the amount of change as of the end of the applicable year (from the end of the prior fiscal year) in fair value of any awards granted in prior years that are outstanding and unvested as of the end of the applicable year; and (iii) for awards granted in prior years that vest in the applicable year, the amount equal to the change as of the vesting date (from the end of the prior fiscal year) in fair value. For 2024, continued share price appreciation drove a positive equity award adjustment. The amounts deducted or added in calculating the equity award adjustments are as follows: |
| | | | | | | | | | | Year-End | | Year Over Year Change in | | Change in | | | | | Fair Value of | | Fair Value of Outstanding | | Fair Value of Equity | | | | | Equity Awards | | and Unvested | | Awards Granted in | | Total Equity | | | Granted | | Equity Awards | | Prior Years that Vested | | Award | | | During the Year | | Granted in Prior Years | | in the Year(e) | | Adjustments | Year | | ($) | | ($) | | ($) | | ($) | 2020 | | 1,777,310 | | 1,596,777 | | (62,671) | | 3,311,416 | 2021 | | 1,877,186 | | 1,937,980 | | 260,423 | | 4,075,589 | 2022 | | 528,368 | | (1,140,610) | | 99,424 | | (512,818) | 2023 | | 2,229,738 | | 1,842,615 | | 15,450 | | 4,087,803 | 2024 | | 1,447,645 | | 896,160 | | 100,082 | | 2,443,887 |
| (d) | Represents defined benefit retirement plan service cost attributed to services rendered during the covered fiscal year. |
| (e) | Represents change in fair value from prior year end to vesting date. |
|
|
|
|
|
| Compensation Actually Paid vs. Total Shareholder Return |
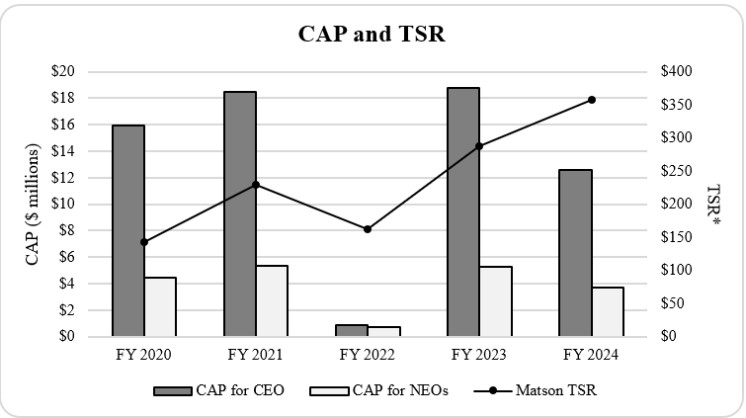
* Cumulative value of $100 invested in Matson common stock on December 31, 2019, including reinvestments of dividends
|
|
|
|
|
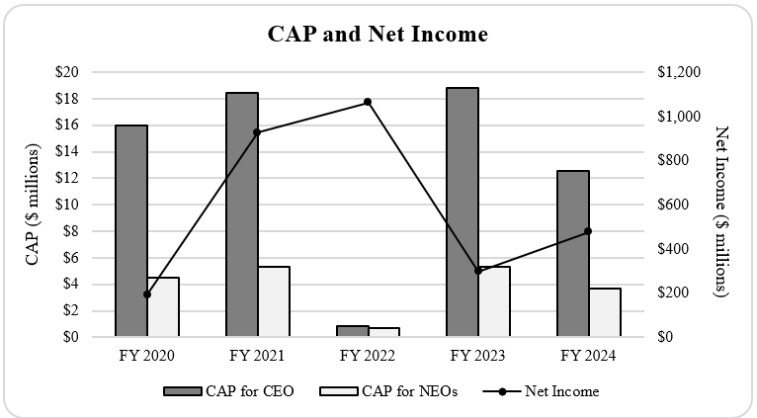
| Compensation Actually Paid vs. Net Income |
|
|
|
|
|
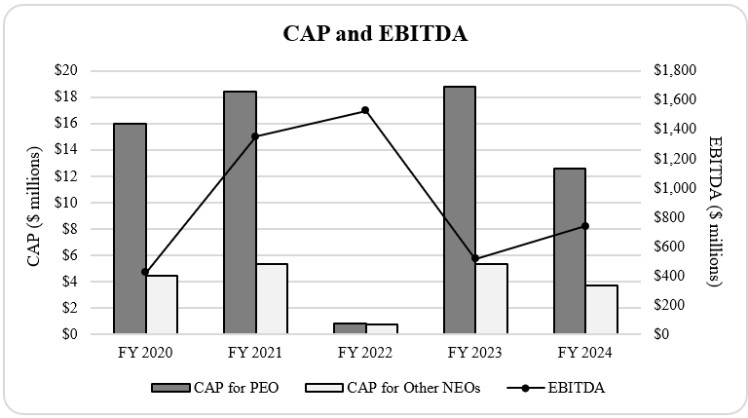
| Compensation Actually Paid vs. Company Selected Measure |
|
|
|
|
|
| Total Shareholder Return Vs Peer Group |
Cumulative Five-Year Total Shareholder Return
Matson, Inc. and S&P Transportation Select Industry Index 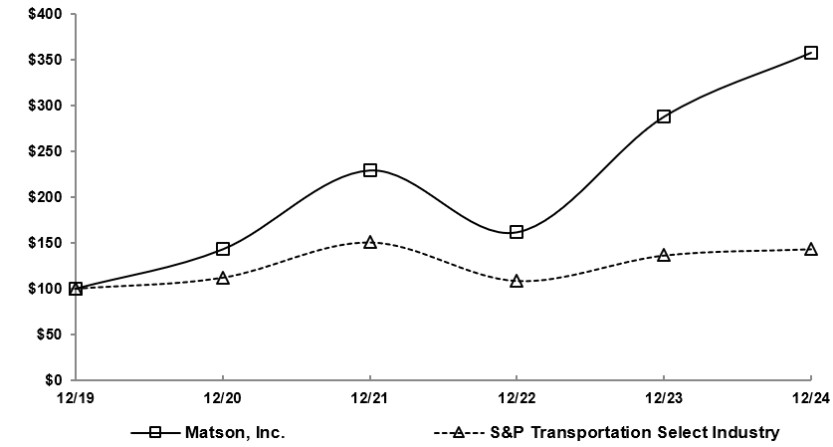
|
|
|
|
|
| Tabular List, Table |
| ● | Individual Performance Goals |
|
|
|
|
|
| Total Shareholder Return Amount |
$ 358
|
288
|
162
|
229
|
143
|
| Peer Group Total Shareholder Return Amount |
143
|
136
|
108
|
151
|
112
|
| Net Income (Loss) |
$ 476,400,000
|
$ 297,100,000
|
$ 1,063,900,000
|
$ 927,400,000
|
$ 193,100,000
|
| Company Selected Measure Amount |
738,900,000
|
516,700,000
|
1,526,200,000
|
1,350,300,000
|
423,700,000
|
| PEO Name |
Matthew J. Cox
|
|
|
|
|
| Measure:: 1 |
|
|
|
|
|
| Pay vs Performance Disclosure |
|
|
|
|
|
| Name |
EBITDA
|
|
|
|
|
| Non-GAAP Measure Description |
(6) | See Exhibit B for a reconciliation of net income to EBITDA. |
|
|
|
|
|
| Measure:: 2 |
|
|
|
|
|
| Pay vs Performance Disclosure |
|
|
|
|
|
| Name |
Individual Performance Goals
|
|
|
|
|
| Measure:: 3 |
|
|
|
|
|
| Pay vs Performance Disclosure |
|
|
|
|
|
| Name |
Relative TSR
|
|
|
|
|
| Measure:: 4 |
|
|
|
|
|
| Pay vs Performance Disclosure |
|
|
|
|
|
| Name |
ROIC
|
|
|
|
|
| PEO | Aggregate Change in Present Value of Accumulated Benefit for All Pension Plans Reported in Summary Compensation Table |
|
|
|
|
|
| Pay vs Performance Disclosure |
|
|
|
|
|
| Adjustment to Compensation, Amount |
$ (52,827)
|
$ (196,171)
|
|
$ (112,142)
|
$ (362,244)
|
| PEO | Aggregate Pension Adjustments Service Cost |
|
|
|
|
|
| Pay vs Performance Disclosure |
|
|
|
|
|
| Adjustment to Compensation, Amount |
117,323
|
76,076
|
$ 129,810
|
101,381
|
96,105
|
| PEO | Aggregate Grant Date Fair Value of Equity Award Amounts Reported in Summary Compensation Table |
|
|
|
|
|
| Pay vs Performance Disclosure |
|
|
|
|
|
| Adjustment to Compensation, Amount |
(3,299,485)
|
(3,237,822)
|
(3,341,181)
|
(3,184,092)
|
(2,662,521)
|
| PEO | Equity Awards Adjustments, Excluding Value Reported in Compensation Table |
|
|
|
|
|
| Pay vs Performance Disclosure |
|
|
|
|
|
| Adjustment to Compensation, Amount |
9,670,679
|
15,988,677
|
(1,978,185)
|
15,679,416
|
13,411,142
|
| PEO | Year-end Fair Value of Equity Awards Granted in Covered Year that are Outstanding and Unvested |
|
|
|
|
|
| Pay vs Performance Disclosure |
|
|
|
|
|
| Adjustment to Compensation, Amount |
5,789,183
|
8,918,914
|
1,981,115
|
6,804,516
|
6,279,437
|
| PEO | Year-over-Year Change in Fair Value of Equity Awards Granted in Prior Years That are Outstanding and Unvested |
|
|
|
|
|
| Pay vs Performance Disclosure |
|
|
|
|
|
| Adjustment to Compensation, Amount |
3,493,546
|
7,009,449
|
(4,447,058)
|
7,725,233
|
7,257,784
|
| PEO | Change in Fair Value as of Vesting Date of Prior Year Equity Awards Vested in Covered Year |
|
|
|
|
|
| Pay vs Performance Disclosure |
|
|
|
|
|
| Adjustment to Compensation, Amount |
387,950
|
60,314
|
487,758
|
1,149,667
|
(126,079)
|
| Non-PEO NEO | Aggregate Change in Present Value of Accumulated Benefit for All Pension Plans Reported in Summary Compensation Table |
|
|
|
|
|
| Pay vs Performance Disclosure |
|
|
|
|
|
| Adjustment to Compensation, Amount |
(103,743)
|
(86,829)
|
|
(28,243)
|
(83,785)
|
| Non-PEO NEO | Aggregate Pension Adjustments Service Cost |
|
|
|
|
|
| Pay vs Performance Disclosure |
|
|
|
|
|
| Adjustment to Compensation, Amount |
49,528
|
32,383
|
47,208
|
38,480
|
37,384
|
| Non-PEO NEO | Aggregate Grant Date Fair Value of Equity Award Amounts Reported in Summary Compensation Table |
|
|
|
|
|
| Pay vs Performance Disclosure |
|
|
|
|
|
| Adjustment to Compensation, Amount |
(825,046)
|
(809,446)
|
(891,106)
|
(878,384)
|
(753,591)
|
| Non-PEO NEO | Equity Awards Adjustments, Excluding Value Reported in Compensation Table |
|
|
|
|
|
| Pay vs Performance Disclosure |
|
|
|
|
|
| Adjustment to Compensation, Amount |
2,443,887
|
4,087,803
|
(512,818)
|
4,075,589
|
3,311,416
|
| Non-PEO NEO | Year-end Fair Value of Equity Awards Granted in Covered Year that are Outstanding and Unvested |
|
|
|
|
|
| Pay vs Performance Disclosure |
|
|
|
|
|
| Adjustment to Compensation, Amount |
1,447,645
|
2,229,738
|
528,368
|
1,877,186
|
1,777,310
|
| Non-PEO NEO | Year-over-Year Change in Fair Value of Equity Awards Granted in Prior Years That are Outstanding and Unvested |
|
|
|
|
|
| Pay vs Performance Disclosure |
|
|
|
|
|
| Adjustment to Compensation, Amount |
896,160
|
1,842,615
|
(1,140,610)
|
1,937,980
|
1,596,777
|
| Non-PEO NEO | Change in Fair Value as of Vesting Date of Prior Year Equity Awards Vested in Covered Year |
|
|
|
|
|
| Pay vs Performance Disclosure |
|
|
|
|
|
| Adjustment to Compensation, Amount |
$ 100,082
|
$ 15,450
|
$ 99,424
|
$ 260,423
|
$ (62,671)
|
