- Record annual net revenues of $12.82 billion and record net
income available to common shareholders of $2.06 billion for fiscal
2024, up 10% and 19%, respectively, over fiscal 2023
- Return on common equity of 18.9% and adjusted return on
tangible common equity of 23.3%(1) for fiscal 2024
- Record quarterly net revenues of $3.46 billion, up 13% over
the prior year’s fiscal fourth quarter and 7% over the preceding
quarter
- Record quarterly net income available to common shareholders
of $601 million, or $2.86 per diluted share; record quarterly
adjusted net income available to common shareholders of $621
million(1), or $2.95 per diluted share(1)
- Record client assets under administration of $1.57 trillion
and record Private Client Group assets in fee-based accounts of
$875.2 billion, up 25% and 28%, respectively, over September
2023
- Domestic Private Client Group net new assets(2) of $13.0
billion for the fiscal fourth quarter and $60.7 billion for fiscal
2024, annualized growth from beginning of period assets of 4.0% and
5.5%, respectively
- Total clients’ domestic cash sweep and Enhanced Savings
Program (“ESP”) balances of $57.9 billion, up 3% compared to both
September 2023 and June 2024
- Returned approximately $1.3 billion of capital to
shareholders through the combination of share repurchases and
dividends in fiscal 2024
Raymond James Financial, Inc. (NYSE: RJF) today reported record
net revenues of $3.46 billion and net income available to common
shareholders of $601 million, or $2.86 per diluted share, for the
fiscal fourth quarter ended September 30, 2024. Excluding $25
million of expenses related to acquisitions, quarterly adjusted net
income available to common shareholders was $621 million(1), or
$2.95 per diluted share(1).
Record quarterly net revenues increased 13% over the prior
year’s fiscal fourth quarter and 7% over the preceding quarter,
primarily driven by higher asset management and related
administrative fees and investment banking revenues. Record
quarterly net income available to common shareholders increased 39%
over the prior year’s fiscal fourth quarter largely due to higher
net revenues and lower provisions for legal and regulatory
matters.
For the fiscal year, record net revenues of $12.82 billion
increased 10%, record earnings per diluted share of $9.70 increased
22%, and record adjusted earnings per diluted share of $10.05(1)
increased 21% over fiscal 2023. The Private Client Group and Asset
Management segments generated record net revenues and pre-tax
income for the fiscal year. Return on common equity was 18.9% and
adjusted return on tangible common equity was 23.3%(1) for fiscal
2024.
“We generated record net revenues and record net income for the
fourth quarter and fiscal year 2024,” said Chair and CEO Paul
Reilly. “Our record performance highlights the strength of our
diverse and complementary businesses. We are well positioned
entering fiscal 2025 with record client asset levels, healthy
pipelines for growth across the business and ample funding to
support balance sheet growth. We are focused on maintaining strong
capital ratios and a flexible balance sheet to support our results
in any market environment.”
Segment ResultsPrivate Client
Group
- Record quarterly net revenues of $2.48 billion, up 9% over
the prior year’s fiscal fourth quarter and 2% over the preceding
quarter
- Quarterly pre-tax income of $461 million, down 3% compared
to the prior year’s fiscal fourth quarter and up 5% over the
preceding quarter
- Record annual net revenues of $9.46 billion and record
annual pre-tax income of $1.79 billion, up 9% and 1%, respectively,
over fiscal 2023
- Record Private Client Group assets under administration of
$1.51 trillion, up 25% over September 2023 and 6% over June
2024
- Record Private Client Group assets in fee-based accounts of
$875.2 billion, up 28% over September 2023 and 7% over June
2024
- Domestic Private Client Group net new assets(2) of $13.0
billion for the fiscal fourth quarter, or annualized growth from
beginning of period assets of 4.0%; Domestic Private Client Group
net new assets(2) of $60.7 billion for fiscal 2024, or growth from
beginning of year assets of 5.5%
- Total clients’ domestic cash sweep and ESP balances of $57.9
billion, up 3% over both the prior year’s fiscal fourth quarter and
the preceding quarter
Record quarterly net revenues grew 9% year-over-year and 2%
sequentially primarily driven by higher asset management and
related administrative fees and brokerage revenues, reflecting
growth of client assets during the year.
“The Private Client Group achieved record results in fiscal 2024
as client assets exceeded $1.5 trillion driven by strong equity
markets and net new asset growth,” said Reilly. “In the fiscal
year, we generated domestic net new assets of $60.7 billion(2), a
growth rate of 5.5%, as we remain focused on retaining, supporting
and attracting high-quality financial advisors across our multiple
affiliation options.”
Capital Markets
- Quarterly net revenues of $483 million, up 42% over the
prior year’s fiscal fourth quarter and 46% over the preceding
quarter
- Quarterly pre-tax income of $95 million
- Quarterly investment banking revenues of $306 million, up
58% over the prior year’s fiscal fourth quarter and 77% over the
preceding quarter
- Annual net revenues of $1.47 billion, up 21% over fiscal
2023; Annual pre-tax income of $67 million
Quarterly net revenues grew 42% year-over-year and 46%
sequentially primarily the result of higher investment banking
revenues. M&A and advisory revenues of $205 million grew 45%
over the prior year’s fiscal fourth quarter.
“Investment banking results increased significantly driven by
robust M&A and advisory revenues as the market environment
became more constructive in support of transaction closings in the
quarter,” said Reilly. “Our M&A pipeline remains healthy, and
we are optimistic investments in our platform and people should
drive growth in fiscal 2025.”
Asset Management
- Record quarterly net revenues of $275 million, up 17% over
the prior year’s fiscal fourth quarter and 4% over the preceding
quarter
- Record quarterly pre-tax income of $116 million, up 16% over
the prior year’s fiscal fourth quarter and 4% over the preceding
quarter
- Record annual net revenues of $1.03 billion and record
annual pre-tax income of $421 million, up 16% and 20%,
respectively, over fiscal 2023
- Record financial assets under management of $244.8 billion,
up 25% over September 2023 and 7% over June 2024
Record quarterly net revenues grew 17% year-over-year and 4%
sequentially largely attributable to higher financial assets under
management due to higher equity markets and net inflows into
fee-based accounts in the Private Client Group.
Bank
- Quarterly net revenues of $433 million, down 4% compared to
the prior year’s fiscal fourth quarter and up 4% over the preceding
quarter
- Quarterly pre-tax income of $98 million, up 26% over the
prior year’s fiscal fourth quarter and down 15% compared to the
preceding quarter
- Annual net revenues of $1.72 billion and annual pre-tax
income of $380 million, down 15% and up 2% compared to fiscal 2023,
respectively
- Bank segment net interest margin (“NIM”) of 2.62% for the
quarter, down 25 basis points compared to the prior year’s fiscal
fourth quarter and 2 basis points compared to the preceding
quarter
- Record net loans of $46.0 billion, up 5% over September 2023
and 2% over June 2024
Quarterly pre-tax income increased 26% year-over-year
predominantly driven by lower expenses which more than offset a
decline in net revenues, which was mostly due to lower NIM.
Sequentially, pre-tax income declined 15% as a higher bank loan
provision for credit losses more than offset growth in net
revenues, which included higher net interest income driven largely
by loan growth in both securities-based loans and residential
mortgage loans.
The credit quality of the loan portfolio remained solid.
Criticized loans as a percent of total loans held for investment
ended the quarter at 1.47%, up from 1.15% in the preceding quarter.
Bank loan allowance for credit losses as a percent of total loans
held for investment was 0.99%, and bank loan allowance for credit
losses on corporate loans as a percent of corporate loans held for
investment was 1.99%, each relatively flat with the preceding
quarter.
Other
The effective tax rate was 20.8% for the quarter, primarily
reflecting the favorable impact of non-taxable valuation gains
associated with the corporate-owned life insurance portfolio.
During the fiscal fourth quarter, the firm repurchased 2.6 million
shares of common stock for $300 million at an average price of $115
per share. In total, the firm repurchased 7.7 million shares of
common stock for $900 million at an average price of $117 per share
in fiscal 2024, leaving approximately $645 million available under
the Board of Directors’ approved common stock repurchase
authorization. At the end of the quarter, the total capital ratio
was 24.1%(3) and the tier 1 leverage ratio was 12.8%(3), both well
above regulatory requirements.
A conference call to discuss the results will take place today,
Wednesday, October 23, at 5:00 p.m. ET. The live audio
webcast, and the presentation which management will review on the
call, will be available at
www.raymondjames.com/investor-relations/financial-information/quarterly-earnings.
An audio replay of the call will be available at the same location
until January 22, 2025. For a listen-only connection to the
conference call, please dial: 800-715-9871 (conference code:
3778589).
Click here to view full earnings results, earnings
supplement, and earnings presentation.
About Raymond James Financial, Inc.
Raymond James Financial, Inc. (NYSE: RJF) is a leading
diversified financial services company providing private client
group, capital markets, asset management, banking and other
services to individuals, corporations and municipalities. The
company has approximately 8,800 financial advisors. Total client
assets are $1.57 trillion. Public since 1983, the firm is listed on
the New York Stock Exchange under the symbol RJF. Additional
information is available at www.raymondjames.com.
Forward-Looking Statements
Certain statements made in this press release may constitute
“forward-looking statements” under the Private Securities
Litigation Reform Act of 1995. Forward-looking statements include
information concerning future strategic objectives, business
prospects, anticipated savings, financial results (including
expenses, earnings, liquidity, cash flow and capital expenditures),
industry or market conditions (including changes in interest rates
and inflation), demand for and pricing of our products (including
cash sweep and deposit offerings), anticipated timing and benefits
of our acquisitions, and our level of success integrating acquired
businesses, anticipated results of litigation, regulatory
developments, and general economic conditions. In addition,
future or conditional verbs such as “will,” “may,” “could,”
“should,” and “would,” as well as any other statement that
necessarily depends on future events, are intended to identify
forward-looking statements. Forward-looking statements are
not guarantees, and they involve risks, uncertainties and
assumptions. Although we make such statements based on
assumptions that we believe to be reasonable, there can be no
assurance that actual results will not differ materially from those
expressed in the forward-looking statements. We caution
investors not to rely unduly on any forward-looking statements and
urge you to carefully consider the risks described in our filings
with the Securities and Exchange Commission (the “SEC”) from time
to time, including our most recent Annual Report on Form 10-K, and
subsequent Quarterly Reports on Form 10-Q and Current Reports on
Form 8-K, which are available at www.raymondjames.com and the SEC’s
website at www.sec.gov. We expressly disclaim any obligation
to update any forward-looking statement in the event it later turns
out to be inaccurate, whether as a result of new information,
future events, or otherwise.
Media Contact: Steve Hollister
Raymond James
727.567.2824

Investor Contact: Kristina Waugh
Raymond James
727.567.7654
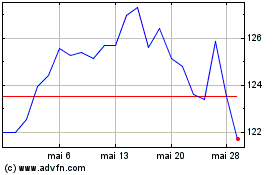
Raymond James Financial (NYSE:RJF)
Graphique Historique de l'Action
De Oct 2024 à Nov 2024

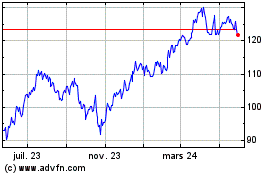
Raymond James Financial (NYSE:RJF)
Graphique Historique de l'Action
De Nov 2023 à Nov 2024


