false
0001852353
0001852353
2025-02-03
2025-02-03
0001852353
us-gaap:CommonStockMember
2025-02-03
2025-02-03
0001852353
DC:WarrantsEachWholeWarrantExercisableForOneShareOfRegistrantsCommonStockAtExercisePriceOf2.08PerShareMember
2025-02-03
2025-02-03
iso4217:USD
xbrli:shares
iso4217:USD
xbrli:shares
UNITED STATES
SECURITIES AND EXCHANGE COMMISSION
WASHINGTON, D.C. 20549
FORM 8-K
CURRENT REPORT
Pursuant to Section 13 or 15(d) of the Securities Exchange Act of 1934
Date
of Report (Date of earliest event reported): February 6, 2025 (February 3, 2025)
DAKOTA
GOLD CORP.
(Exact name of registrant as specified in its charter)
| Delaware |
001-41349 |
85-3475290 |
(State or other jurisdiction of
incorporation) |
(Commission
File Number) |
(I.R.S. Employer
Identification No.) |
| |
|
|
|
106 Glendale Drive, Suite A,
Lead, South Dakota, United States 57754
(Address of principal executive offices) (Zip Code) |
| |
(605) 906-8363
(Registrant's telephone number,
including area code)
|
Check the appropriate box below if the Form 8-K
filing is intended to simultaneously satisfy the filing obligation of the registrant under any of the following provisions:
| ¨ | Written communications pursuant
to Rule 425 under the Securities Act (17 CFR 230.425) |
| ¨ | Soliciting material pursuant to
Rule 14a-12 under the Exchange Act (17 CFR 240.14a-12) |
| ¨ | Pre-commencement communications
pursuant to Rule 14d-2(b) under the Exchange Act (17 CFR 240.14d-2(b)) |
| ¨ | Pre-commencement communications
pursuant to Rule 13e-4(c) under the Exchange Act (17 CFR 240.13e-4(c)) |
Securities registered pursuant to Section 12(b) of
the Act:
| Title
of each class |
|
Trading
Symbol(s) |
|
Name
of each exchange on which registered |
| Common
Stock, par value $0.001 per share |
|
DC |
|
NYSE
American LLC |
| Warrants, each warrant exercisable for one share of the Registrant's common stock at an exercise price of $2.08 |
|
DC.WS |
|
NYSE
American LLC |
Indicate by check mark whether the registrant
is an emerging growth company as defined in Rule 405 of the Securities Act of 1933 (§230.405 of this chapter) or Rule 12b-2
of the Securities Exchange Act of 1934 (§240.12b-2 of this chapter).
Emerging
growth company x
If
an emerging growth company, indicate by check mark if the registrant has elected not to use the extended transition period for complying
with any new or revised financial accounting standards provided pursuant to Section 13(a) of the Exchange Act.
| Item 1.01. | Entry into a Material Definitive Agreement. |
Second Amendment Agreement
On February 3, 2025, Dakota Gold Corp. (the
“Company”) and DTRC LLC, a wholly owned subsidiary of the Company (“DTRC”), entered into a second amendment (the
“Second Amendment Agreement”) to the option agreement for the purchase and sale of real property dated October 14, 2021,
as amended on September 8, 2022 (the “Richmond Hill Option Agreement”), to acquire LAC Minerals (USA) LLC and Homestake Mining
Company of California’s (“HMCC”) Richmond Hill Property in the Homestake District, South Dakota.
Under the terms of the Second Amendment Agreement,
the term of the LAC Option Agreement was extended from March 7, 2026 to December 31, 2028. As consideration for the Second Amendment
Agreement, DTRC will provide a cash payment of $170,000 to HMCC on each of March 1, 2026, March 1, 2027 and March 1, 2028.
The foregoing description of the Second Amendment
Agreement does not purport to be complete and is qualified in its entirety by reference to the full text of the Second Amendment Agreement,
a copy of which is filed herewith as Exhibit 10.1 and incorporated herein by reference.
Third Amendment Agreement
On February 3, 2025, DTRC entered into a
third amendment (the “Third Amendment Agreement”) to the option agreement for the purchase and sale of real property dated
September 7, 2021, as amended on September 30, 2021 and November 20, 2023 (the “Homestake Option Agreement”),
to acquire certain of Homestake Mining Company of California’s surface rights and residual facilities in the Homestake District
in South Dakota.
Under the terms of the Third Amendment Agreement,
the term of the Homestake Option Agreement was extended from March 7, 2026 to December 31, 2028. As consideration for the Third
Amendment Agreement, DTRC will provide a cash payment of $340,000 to HMCC on each of March 1, 2026, March 1, 2027 and March 1,
2028.
The foregoing description of the Third Amendment
Agreement does not purport to be complete and is qualified in its entirety by reference to the full text of the Third Amendment Agreement,
a copy of which is filed herewith as Exhibit 10.2 and incorporated herein by reference.
| Item 7.01. | Regulation FD Disclosure. |
On February 6, 2025, the Company issued a
press release announcing (i) the Second Amendment Agreement, (ii) the Third Amendment Agreement and (iii) the results and
publication of an updated and revised S-K 1300 Initial Assessment and Technical Report Summary for the Company’s Richmond Hill Gold
Project (the “2025 Initial Assessment”). The 2025 Initial Assessment, dated February 3, 2025 was prepared in accordance
with Subpart 1300 of Regulation S-K. A copy of the press release is furnished with this Current Report on Form 8-K
as Exhibit 99.1.
In accordance with General Instruction B.2 of
Form 8-K, the information set forth in this Item 7.01 and in the press release is deemed to be “furnished” and shall
not be deemed to be “filed” for purposes of the Securities Exchange Act of 1934, as amended (the “Exchange Act”),
and shall not be incorporated by reference into any registration statement or other document filed under the Securities Act of 1933, as
amended, or the Exchange Act, except as shall be expressly set forth by specific reference in such filing.
A copy of the Initial Assessment is attached as
Exhibit 96.1 to this Current Report on Form 8-K.
| Item 9.01 |
Financial Statements and Exhibits. |
| |
|
| |
(d) Exhibits |
SIGNATURE
Pursuant to the requirements
of the Securities Exchange Act of 1934, as amended, the registrant has duly caused this report to be signed on its behalf by the undersigned
hereunto duly authorized.
| |
DAKOTA GOLD CORP. |
| |
|
| |
/s/ Shawn Campbell |
| |
Name: Shawn Campbell |
| |
Title: Chief Financial Officer |
Date: February 6, 2025
Exhibit 10.1
SECOND AMENDMENT TO
OPTION AGREEMENT FOR PURCHASE AND SALE OF REAL PROPERTY
THIS SECOND AMENDMENT
(the “Amendment”) to the Option Agreement for Purchase and Sale of Real Property dated as of October 14, 2021
(the “Richmond Hill Option Agreement”), is entered into as of February 3, 2025 (the “Amendment Effective
Date”), by and among Homestake Mining Company of California, a California corporation (“Homestake” or
“Owner”) and LAC Minerals (USA) LLC, a Delaware limited liability company (“LAC Minerals”),
DTRC LLC (formerly known as Dakota Territory Resource Corp.), a Nevada limited liability company (the “Option
Holder”), and Dakota Gold Corp., a Nevada corporation (“Dakota Gold”). Homestake shall act as the
“Administrative Agent”) of Owners under this Amendment. Homestake, LAC Minerals, Option Holder and Dakota Gold
sometimes may be referred to in this Amendment individually as a “Party”, and collectively as the
“Parties”.
RECITALS
| A. | Owner, LAC Minerals, and Option Holder entered into the Richmond Hill Option Agreement. |
| B. | The Richmond Hill Option Agreement was amended on September 8, 2022, to, among other
things, extend the option period until March 7, 2026. |
| C. | By Agreement and Plan of Merger dated effective as of September 30, 2023, Homestake and LAC Minerals merged,
with Homestake continuing as the surviving entity assuming all rights and obligations of LAC Minerals. |
| D. | The Parties desire to further extend the option period as set forth in this Amendment. |
| E. | Option Holder is the successor entity to Dakota Territory Resource Corp. pursuant to that certain Amended
and Restated Agreement and Plan of Merger, dated as of September 10, 2021, between Dakota Gold Corp. (formerly known as JR Resources Corp.),
Dakota Territory Resource Corp., DGC Merger Sub I Corp. and DGC Merger Sub II LLC. |
| F. | Option Holder is a wholly-owned subsidiary of Dakota Gold, which is made a Party for the purpose of the
share issuance contemplated under Richmond Hill Option Agreement as amended. |
AGREEMENT
NOW, THEREFORE, in consideration
of the premises and the mutual agreements, representations and warranties herein set forth and for other good and valuable consideration,
the receipt and sufficiency of which are hereby acknowledged, and intending to be legally bound hereby, the Parties agree as follows:
1. Extension of Option
Period. The definition of Option Period in Section 1.38 of the Option Agreement hereby is deleted in its entirety and replaced with
the following:
“The period that begins on the Effective Date and
ends on the earlier of (a) December 31, 2028, and (b) the date the Option Holder delivers to the Administrative Agent the Option
Exercise Notice.”
2.
Consideration. In consideration for this Amendment, on the Amendment Effective Date, Option Holder shall provide a payment of $170,000
to Owner on each of the following dates: March 1, 2026, March 1, 2027, and March 1, 2028. Notwithstanding the foregoing, no payments under
this provision shall be required after the date upon which the Option Holder delivers to the Administrative Agent the Option Exercise
Notice.
3. Miscellaneous Provisions.
(a) The Parties agree that,
except as specifically modified by this Amendment, the Option Agreement as amended remains in full force and effect in accordance with
its terms. This Amendment shall not be construed as a waiver or amendment of any other provision of the Option Agreement or for any purpose,
except as expressly set forth herein.
(b) This Amendment shall be
governed by and construed in accordance with the laws of the State of South Dakota without reference to the conflict of law provisions
thereof.
(c) This Amendment may be executed
in any number of counterparts and by different parties hereto in separate counterparts, each of which when so executed shall be deemed
to be an original and all of which taken together shall constitute one and the same agreement. This Amendment may be validly executed
and delivered by facsimile, portable document format (.pdf) or other electronic transmission, and a signature by facsimile, portable document
format (.pdf) or other electronic transmission shall be as effective and binding as delivery of a manually executed original signature.
(d) This Amendment shall be
binding upon and inure to the benefit of the Parties and their respective successors and assigns permitted by the Option Agreement.
[REMAINDER OF PAGE LEFT BLANK]
IN WITNESS WHEREOF, the Parties hereto
have caused this Amendment to be executed by their respective officers thereunto duly authorized as of the Effective Date.
| HOMESTAKE MINING COMPANY OF CALIFORNIA |
|
|
| |
|
|
| By: |
/s/
Michael McCarthy |
|
|
| Name: |
Michael McCarthy |
|
|
| Title: |
Director |
|
|
| DTRC LLC |
|
DAKOTA GOLD CORP. |
| |
|
|
| By: |
/s/
Patrick Malone |
|
By: |
/s/ Patrick
Malone |
| Name: |
Patrick Malone |
|
Name: |
Patrick Malone |
| Title: |
Senior Vice President of
Dakota Gold Corp., its manager |
|
Titile: |
Senior Vice President |
Exhibit 10.2
THIRD AMENDMENT TO OPTION AGREEMENT
FOR PURCHASE AND SALE OF REAL PROPERTY
This Third Amendment to Option
Agreement for Purchase and Sale of Real Property (“Second Amendment”) is made and entered into as of February 3, 2025
(the “Effective Date”), by and between Homestake Mining Company of California, a California corporation (“Owner”),
and DTRC LLC, a Nevada limited liability company (“Option Holder”). Owner and Option Holder sometimes may be referred
to in this Contract individually as a “Party”, and collectively as the “Parties.”
RECITALS
A.
Owner and Dakota Territory Resource Corp, a Nevada corporation entered into that certain Option Agreement for Purchase and Sale of
Real Property, dated September 7, 2021, (the “Homestake Option Agreement”) as amended on September 30, 2021, and November
20, 2023, to, among other things, extend the option period until March 7, 2026.
B.
Option Holder is the successor entity to Dakota Territory Resource Corp. pursuant to that certain Amended and Restated Agreement and
Plan of Merger, dated as of September 10, 2021, between Dakota Gold Corp. (formerly known as JR Resources Corp.), Dakota Territory Resource
Corp., DGC Merger Sub I Corp. and DGC Merger Sub II LLC.
C.
Owner and Option Holder wish to amend the Homestake Option Agreement to extend the Option Period.
AGREEMENT
NOW THEREFORE, in consideration
of the foregoing and of the mutual promises and covenants contained in this Second Amendment, the receipt and sufficiency of which are
hereby acknowledged, and intending to be legally bound hereby, the Parties, hereby covenant and agree as to the following:
1. Extension of the Option
Period. The definition of Option Period in Section 1.37 of the Option Agreement as amended is hereby deleted in its entirety and replaced
with the following:
“The period that begins on the Effective Date and
ends on the earlier of (a) December 31, 2028, and (b) the date the Option Holder delivers to the Owner the Option Exercise
Notice.”
2.
Consideration. In consideration for this Amendment, on the Amendment Effective Date, Option Holder shall provide a payment of $340,000
to Owner on each of the following dates: March 1, 2026, March 1, 2027, and March 1, 2028. Notwithstanding the foregoing, no payments under
this provision shall be required after the date upon which the Option Holder delivers to the Administrative Agent the Option Exercise
Notice.
3. Miscellaneous Provisions.
(a) The Parties agree that,
except as specifically modified by this Amendment, the Option Agreement as amended remains in full force and effect in accordance with
its terms. This Amendment shall not be construed as a waiver or amendment of any other provision of the Option Agreement or for any purpose,
except as expressly set forth herein.
(b) This Amendment shall be
governed by and construed in accordance with the laws of the State of South Dakota without reference to the conflict of law provisions
thereof.
(c) This Amendment may be executed
in any number of counterparts and by different parties hereto in separate counterparts, each of which when so executed shall be deemed
to be an original and all of which taken together shall constitute one and the same agreement. This Amendment may be validly executed
and delivered by facsimile, portable document format (.pdf) or other electronic transmission, and a signature by facsimile, portable document
format (.pdf) or other electronic transmission shall be as effective and binding as delivery of a manually executed original signature.
(d) This Amendment shall be
binding upon and inure to the benefit of the Parties and their respective successors and assigns permitted by the Option Agreement..
[SIGNATURE PAGE TO FOLLOW]
IN WITNESS WHEREOF, the Parties have executed this
Contract as of the Effective Date.
| |
OWNER: |
| |
|
| |
HOMESTAKE MINING COMPANY OF CALIFORNIA,
a California corporation |
| |
|
| |
By: |
/s/ Michael McCarthy |
| |
Name: |
Michael McCarthy |
| |
Title: |
Director |
| |
|
| |
OPTION HOLDER |
| |
|
| |
DTRC LLC, a Nevada limited liability company |
| |
|
| |
By: |
/s/ Patrick Malone |
| |
Name: |
Patrick Malone |
| |
Title: |
On behalf of Dakota Gold Corp., its manager |
Exhibit 23.1
CONSENT OF QUALIFIED PERSON
In connection with the Company’s Current
Report on Form 8-K dated February 6, 2025 and any amendments or supplements and/or exhibits thereto (the “Form 8-K”),
the undersigned consents to:
| · | the filing and use of the technical report summary titled “S-K 1300 Initial Assessment and Technical
Report Summary – Richmond Hill Gold Project, South Dakota, U.S.A.” (the “TRS”) dated Feb 3, 2025 as an exhibit
and referenced in the Form 8-K; |
| · | the incorporation by reference of the TRS in the Registration Statements on Form S-3 (File Nos. 333-263883
and 333-266155) and Form S-8 (File Nos. 333-265399 and 333-267210) (collectively, the “Registration Statements”); |
| · | the use of and references to the undersigned’s name, including the undersigned’s status as
an expert or “qualified person” (as defined in Subpart 1300 of Regulation S-K promulgated by the U.S. Securities and Exchange
Commission) in connection with the TRS, the Form 8-K and the Registration Statements; and |
| · | Any extracts or summaries of the TRS included or incorporated by reference in the Form 8-K and the
Registration Statements, and the use of any information derived, summarized, quoted or referenced from the TRS, or portions thereof, that
was prepared by the undersigned, that the undersigned supervised the preparation of and/or that was reviewed and approved by the undersigned,
that is included or incorporated by reference in the Form 8-K and the Registration Statements. |
The undersigned is the qualified person responsible
for authoring, and this consent pertains to, Sections of the TRS: Section 1 except 1.5, 2-8, 9.1, 11-21, 22 except 22.2, 23 except
23.2 and 23.6, 24-26
Dated February 3, 2025
For Independent Mining Consultants, Inc.
Exhibit 23.2
CONSENT OF QUALIFIED PERSON
In connection with the Company’s Current
Report on Form 8-K dated February 6, 2025 and any amendments or supplements and/or exhibits thereto (the “Form 8-K”),
the undersigned consents to:
| · | the filing and use of the technical report summary titled “S-K 1300 Initial Assessment and Technical
Report Summary – Richmond Hill Gold Project, South Dakota, U.S.A.” (the “TRS”) dated Feb 3, 2025 as an exhibit
and referenced in the Form 8-K; |
| · | the incorporation by reference of the TRS in the Registration Statements on Form S-3 (File Nos. 333-263883
and 333-266155) and Form S-8 (File Nos. 333-265399 and 333-267210) (collectively, the “Registration Statements”); |
| · | the use of and references to the undersigned’s name, including the undersigned’s status as
an expert or “qualified person” (as defined in Subpart 1300 of Regulation S-K promulgated by the U.S. Securities and Exchange
Commission) in connection with the TRS, the Form 8-K and the Registration Statements; and |
| · | Any extracts or summaries of the TRS included or incorporated by reference in the Form 8-K and the
Registration Statements, and the use of any information derived, summarized, quoted or referenced from the TRS, or portions thereof, that
was prepared by the undersigned, that the undersigned supervised the preparation of and/or that was reviewed and approved by the undersigned,
that is included or incorporated by reference in the Form 8-K and the Registration Statements. |
The undersigned is the qualified person responsible
for authoring, and this consent pertains to, Sections of the TRS: 1.5, 9.2, 10, 22.2, 23.2, 23.6
Dated February 3, 2025
For Woods Process Service, LLC.
Exhibit 96.1
Richmond
Hill Project
Mineral
Resource Estimate
RICHMOND HILL PROJECT
Mineral
REsource Estimate
Table
of Contents
| SECTION |
PAGE |
| |
|
| Table of Contents |
ii |
| List of Figures and Illustrations |
vii |
| List of Tables |
x |
| 1.1 | Property
Description |
1 |
| 1.2 | Geology
and Mineralization |
1 |
| 1.3 | Exploration,
Development, and Operations |
2 |
| 1.4 | Sample
Preparation, Analysis, Security, and Data Verification |
2 |
| 1.5 | Mineral
Processing and Metallurgy |
2 |
| 1.6 | Mineral
Resource Estimate |
3 |
| 1.7 | Environmental |
5 |
| 1.8 | Conclusion
and Recommendations |
5 |
| 2.1 | Registrant |
7 |
| 2.2 | Terms
of Reference |
7 |
| 2.3 | Qualified
Persons |
9 |
| 2.4 | Date |
9 |
| 2.5 | Sources
of Information |
9 |
| 2.6 | Previous
Technical Report Summaries |
9 |
| 2.7 | Acronyms
and Abbreviations |
9 |
| 2.8 | Units
of Measure and Metric Equivalents |
13 |
| 3.1 | Project
Location |
14 |
| 3.2 | Ownership |
14 |
| 3.3 | Mineral
Tenure Holdings |
14 |
| 3.4 | Richmond
Hill Option Agreement |
22 |
| 3.5 | Surface
Rights |
23 |
| 3.6 | Water
Rights |
23 |
| 3.7 | Royalties |
23 |
| 3.8 | Permitting |
32 |
 | M3-PN240322
3 February 2025
Revision 0 |
ii |
Richmond
Hill Project
Mineral
Resource Estimate
| 3.8.1 | Existing
Permitting |
32 |
| 3.8.2 | Future
Permitting |
33 |
| 3.9 | Potential
Significant Encumbrances |
35 |
| 3.10 | Violation
and Fines |
35 |
| 3.11 | Significant
Factors and Risks That May Affect Access, Title or Work Programs |
35 |
| 4 | Accesibility,
Climate, Local Resources, Infrastructure and Physiography |
36 |
| 4.1 | Topography,
Elevation, and Vegetation |
36 |
| 4.2 | Property
Access |
37 |
| 4.3 | Climate |
37 |
| 4.4 | Local
Resources and Infrastructure |
37 |
| 5.1 | Explorations |
39 |
| 5.2 | Mining |
42 |
| 5.3 | Dakota
Gold Corp |
43 |
| 6 | Geological
Setting, Mineralization and Deposit |
44 |
| 6.1 | Local
Geology |
44 |
| 6.2 | Regional
Geology |
51 |
| 6.3 | Lithology |
53 |
| 6.4 | Landforms
and Structures |
58 |
| 6.5 | Deposit
Type |
58 |
| 6.6 | Mineralization |
59 |
| 7.1 | Airborne
Geophysics |
61 |
| 7.2 | Gravity
Compilation and Survey |
62 |
| 7.3 | Induced
Polarization Survey |
63 |
| 7.4 | Geological
Mapping |
65 |
| 7.5 | Drilling |
67 |
| 7.5.1 | Summary |
67 |
| 7.5.2 | Freeport
(1981 – 1983) |
69 |
| 7.5.3 | St.
Joe, Bond Gold, and Homestake (1984 – 1994) |
69 |
| 7.5.4 | Coeur
(2019 – 2020) |
69 |
| 7.5.5 | Dakota
Gold (2022 – 2024) |
70 |
| 7.5.6 | Opinion |
72 |
| 7.6 | Hydrogeology
and Geotechnical |
72 |
| 8 | Sample
Preparation, Analyses, and Security |
73 |
| | M3-PN240322
3 February 2025
Revision 0 |
iii |
Richmond
Hill Project
Mineral
Resource Estimate
| 8.2 | Procedures
for Historical Drilling Programs from 1981 to 1994 |
74 |
| 8.2.1 | Freeport
(1981-1983) |
74 |
| 8.2.2 | St.
Joe, Bond Gold, and Homestake (1984-1994) |
74 |
| 8.3 | Procedures
for Drilling Programs from 2019 to 2020 |
76 |
| 8.3.1 | Drilling
Programs |
76 |
| 8.3.2 | Sampling,
Sample Preparation, Analysis, and Security |
76 |
| 8.3.3 | Quality
Assurance and Quality Control Procedures |
77 |
| 8.4 | Procedures
for Drilling Programs from 2022 to 2024 |
77 |
| 8.4.1 | Drilling
Programs |
77 |
| 8.4.2 | Sampling,
Sample Preparation, Analysis, and Security |
77 |
| 8.4.3 | Quality
Assurance and Quality Control Procedures |
78 |
| 9.1 | Drillhole
Sampling Data |
91 |
| 9.1.1 | Dakota
Gold Drilling |
91 |
| 9.1.2 | Coeur
Drilling |
91 |
| 9.1.3 | St.
Joe/Bond Gold, LAC and Homestake Drilling |
91 |
| 9.1.4 | Other
Reviews |
92 |
| 10 | Mineral
Processing and Metallurgical |
96 |
| 10.1 | Preliminary
Geometallurgical Data Model Development |
96 |
| 10.2 | Oxide
and Mixed Metallurgical Testing |
97 |
| 10.2.1 | Historical
Bottle Roll Tests |
98 |
| 10.2.2 | Historical
Metallurgical testing: Oxide & Transition Heap Leach |
100 |
| 10.3 | Sulfide
and Transition Metallurgical Testing |
103 |
| 10.3.1 | Historical
Metallurgical Reports: Sulfide & Transition Flotation |
104 |
| 10.3.2 | Metallurgical
Report – BL1244 |
104 |
| 10.3.3 | Metallurgical
Report – BL1346 |
107 |
| 10.4 | Richmond
Hill Historical Operating Data |
110 |
| 10.5 | Recovery
Estimates |
111 |
| 10.6 | Summary
and Recommendations |
111 |
| 11 | Mineral
Resource Estimate |
112 |
| 11.1 | Mineral
Resource |
112 |
| 11.2 | Price
Sensitivity |
114 |
| 11.3 | Mineral
Resource Parameters |
116 |
| 11.4 | Additional
Information |
118 |
| 11.5 | Description
of the Block Model |
118 |
| | M3-PN240322
3 February 2025
Revision 0 |
iv |
Richmond
Hill Project
Mineral
Resource Estimate
| 11.5.1 | General |
118 |
| 11.5.2 | Drilling
Data |
119 |
| 11.5.3 | Geologic
Controls |
121 |
| 11.5.4 | Cap
Grades and Compositing |
126 |
| 11.5.5 | Summary
Statistics |
127 |
| 11.5.6 | Variogram
Analysis |
131 |
| 11.5.7 | Block
Grade Estimation |
140 |
| 11.5.8 | Resource
Classification |
145 |
| 11.5.9 | Bulk
Density |
150 |
| 11.6 | Reconciliation
of January 2025 and October 2023 Mineral Resources |
151 |
| 11.6.1 | Leach
Mineral Resource |
151 |
| 11.6.2 | Mill
Resource |
152 |
| 11.6.3 | Reconciliation
Summary |
158 |
| 12 | Mineral
Reserve Estimates |
159 |
| 13 | Mining
Methods |
160 |
| 14 | Process
and Recovery Methods |
161 |
| 15 | Infrastructure |
162 |
| 16 | Market
Studies |
163 |
| 17 | Environmental
Studies, Permitting and Plans, Negotiations, or Agreements with Local Individuals or Groups |
164 |
| 17.1 | Results
of Environmental Studies |
164 |
| 17.2 | Requirements
and Plans for Waste and Tailings Disposal, Site Monitoring, and Water Management During Operations
and After Mine Closures |
164 |
| 17.3 | Project
Permitting Requirements, Permit Application Status, and Requirements to Post Performance
or Reclamation Bonds |
165 |
| 17.4 | Requirements
and Plans for Waste and Tailings Disposal, Site Monitoring, and Water Management During Operations
and After Mine Closure |
165 |
| 17.5 | Mine
Closure, Remediation, and Reclamation Plans, and Associated Costs |
166 |
| 17.6 | Qualified
Person’s Opinion on the Adequacy of Current Plans to Address Any issues Related to
Environmental Compliance, Permitting, and Local Individuals or Groups |
168 |
| 17.7 | Descriptions
of Any Commitments to Ensure Local Procurement and Hiring |
168 |
| 18 | Capital
and Operating Costs |
169 |
| 19 | Economic
Analysis |
170 |
| 20 | Adjacent
Properties |
171 |
| 21 | Other
Relevant Data and Information |
172 |
| 21.1 | Homestake
Mine Facilities |
172 |
| 21.2 | Sanford
Underground Research Facility |
172 |
| 22 | Interpretation
and Conclusions |
173 |
| 22.1 | Mineral
Resources |
173 |
| | M3-PN240322
3 February 2025
Revision 0 |
v |
Richmond
Hill Project
Mineral
Resource Estimate
| 22.2 | Processing |
174 |
| 22.3 | Mineral
Tenure |
174 |
| 22.4 | Summary
Conclusion |
175 |
| 23.1 | Initial
Assessment with Economic Analysis |
176 |
| 23.2 | Metallurgical
Testing and Process Design |
176 |
| 23.3 | Additional
Drilling |
177 |
| 23.4 | Environmental
Data Collection |
179 |
| 23.5 | Resource
Estimation |
179 |
| 23.6 | Mineral
Processing and Metallurgical Testing |
179 |
| 25 | Reliance
on Information Provided by the Registrant |
185 |
| 25.1 | Legal
Matters |
185 |
| 25.2 | Tenure |
185 |
| 25.3 | Significant
Encumbrances and Permitting |
185 |
| 25.4 | History |
185 |
| 25.5 | Exploration |
185 |
| 25.6 | Environment |
185 |
| 26 | Date
and Signature Page |
186 |
| | M3-PN240322
3 February 2025
Revision 0 |
vi |
Richmond
Hill Project
Mineral
Resource Estimate
List
of Figures and Illustrations
| FIGURE |
DESCRIPTION |
PAGE |
| |
|
|
| Figure 2-1: |
Property Location |
8 |
| Figure 3-1: |
Richmond Hill Project Location and Ownership |
16 |
| Figure 3-2: |
Richmond Hill Project Royalties |
31 |
| Figure 4-1: |
Richmond Hill Gold Property Location |
36 |
| Figure 4-2: |
Richmond Hill Gold Project Access |
38 |
| Figure 6-1: |
Exploration Zones |
45 |
| Figure 6-2: |
Geology of Richmond Hill |
46 |
| Figure 6-3: |
Richmond Hill Gold Project Target Zones on 0.01 oz/ton Grade Shell Plot |
47 |
| Figure 6-4: |
Regional Geologic map of the Black Hills Uplift (from Lufking et. Al,
2009) |
52 |
| Figure 6-5: |
Southwest to Northeast Structural Cross-Sections (modified from Redden and DeWitt 2008) |
53 |
| Figure 6-6: |
Precambrian Stratigraphic Section of the Northern Black Hills |
55 |
| Figure 6-7: |
Black Hills General Stratigraphic Section |
56 |
| Figure 7-1: |
Airborne Magnetics Survey Flightline Limits |
61 |
| Figure 7-2: |
Gravity Survey Station Locations |
63 |
| Figure 7-3: |
Geophysical IP – Resistivity Survey Line Locations |
64 |
| Figure 7-4: |
Dakota Gold Geologic Field Work |
66 |
| Figure 7-5: |
Richmond Hill Gold Project Drillholes by Company |
68 |
| Figure 8-1: |
Control Chart for CRM OXE182 Gold Assays |
81 |
| Figure 8-2: |
Control Chart for CRM OXD183 Gold Assays |
82 |
| Figure 8-3: |
Control Chart for CRM SJ121 Gold Assays |
83 |
| Figure 8-4: |
Control Chart for CRM SG115 Gold Assays |
84 |
| Figure 8-5: |
Control Chart for CRM Si96 Gold Assays |
85 |
| Figure 8-6: |
Original Gold Assay versus Pulp Duplicate |
88 |
| Figure 8-7: |
Original Gold Assay versus Crusher Duplicate |
89 |
| Figure 8-8: |
Original Gold Assay versus Sample Duplicate |
90 |
| Figure 10-1: |
Preliminary Cluster Analysis Interval Analytical KPI’s by Cluster |
97 |
| Figure 10-2: |
Richmond Hill Bottle Roll Test KPIs: Calculated Heads Au opt |
98 |
| Figure 10-3: |
Richmond Hill Bottle Roll Test KPIs: Calculated Heads Ag opt |
99 |
| Figure 10-4: |
Richmond Hill Bottle Roll Test KPIs: Ag:Au ratio |
99 |
| Figure 10-5: |
Richmond Hill Bottle Roll Test KPIs: Au Recovery Distribution |
100 |
| Figure 10-6: |
Richmond Hill Bottle Roll Test KPIs: Ag Recovery Distribution |
100 |
| | M3-PN240322
3 February 2025
Revision 0 |
vii |
Richmond
Hill Project
Mineral
Resource Estimate
| Figure 10-7: |
Richmond Hill Column Test KPIs: Calculated Heads Au opt |
101 |
| Figure 10-8: |
Richmond Hill Column Test KPIs: Calculated Heads Ag opt |
102 |
| Figure 10-9: |
Richmond Hill Column Test KPIs: Ag:Au Ratio |
102 |
| Figure 10-10: |
Richmond Hill Column Test KPIs: Recovery % Au |
103 |
| Figure 10-11: |
Richmond Hill Column Test KPIs: Recovery % Ag |
103 |
| Figure 10-12: |
Rougher Flotation Flowsheet—BaseMet 2023, BL1244 |
105 |
| Figure 10-13: |
Rougher Mass vs. Gold Recovery—BaseMet 2023, BL1244 |
106 |
| Figure 10-14: |
Diagnostic Leach Test Flowsheet – BaseMet 2023, BL1244 |
107 |
| Figure 10-15: |
Gold Rougher Concentrate Recovery vs. Mass Recovery – BaseMet
2023, BL1346 |
108 |
| Figure 10-16: |
Gold Rougher Concentrate Recovery vs. Mass Recovery – BaseMet
2023, BL1346 |
109 |
| Figure 10-17: |
Gold Recovery vs. Sulfur Head Grade – BaseMet 2023, 1346 |
110 |
| Figure 10-18: |
Gold Recovery vs. Gold Head Grade – BaseMet 2023, BL1346 |
110 |
| Figure 10-19: |
Historical Richmond Hill Heap Leach KPI’s Au and Ag Recovery,
Recovered Ag:Au Ratio |
111 |
| Figure 11-1: |
Constraining Shell for Mineral Resource Estimate |
114 |
| Figure 11-2: |
Drillhole Locations by Company |
120 |
| Figure 11-3: |
Rock Types on the Resource Shell |
122 |
| Figure 11-4: |
Rock Types on Cross Section A-A’ |
123 |
| Figure 11-5: |
Rock Types on Section B-B’ |
124 |
| Figure 11-6: |
Oxidation Zones on the Resource Shell |
126 |
| Figure 11-7: |
Probability Plot of Gold by Rock Type – 10 ft. Composites (IMC,
2024) |
129 |
| Figure 11-8: |
Probability Plot of Silver by Rock Type – 10 ft. Composites (IMC,
2024) |
130 |
| Figure 11-9: |
Variogram for Tertiary Breccia – Azimuth 90°, Dip 85° |
132 |
| Figure 11-10: |
Variogram for Tertiary Breccia – Azimuth 22°, Dip -2° |
133 |
| Figure 11-11: |
Variogram for Precambrian Greenstone – Azimuth 292°, Dip
67° |
134 |
| Figure 11-12: |
Variogram for Precambrian Greenstone – Azimuth 202°, Dip
0° |
135 |
| Figure 11-13: |
Variogram for Precambrian Flagrock – Azimuth 45° - Dip 0° |
136 |
| Figure 11-14: |
Variogram for Precambrian Flagrock – Azimuth 135° –
Dip 45° |
137 |
| Figure 11-15: |
Variogram for Cambrian Deadwood – Azimuth 0° – Dip
12° |
138 |
| Figure 11-16: |
Variogram for Cambrian Deadwood – Azimuth 270° – Dip
0° |
139 |
| Figure 11-17: |
Gold Grade on Cross Section A-A’ (See Figure 11-2) |
142 |
| Figure 11-18: |
Gold Grades on Cross Section B-B’ (See Figure 11-2) |
143 |
| Figure 11-19: |
Silver Grades on Cross Section A-A’ (See Figure 11-2) |
144 |
| Figure 11-20: |
Probability Plot of Average Distance to Nearest 3 and 4 Holes – Tertiary Breccia |
146 |
| Figure 11-21: |
Probability Plot of Average Distance to Nearest 3 and 4 Holes –
Cambrian Deadwood |
147 |
| | M3-PN240322
3 February 2025
Revision 0 |
viii |
Richmond
Hill Project
Mineral
Resource Estimate
| Figure 11-22: |
Resource Classification on Cross Section A-A’ |
148 |
| Figure 11-23: |
Resource Classification on Cross Section B-B’ |
149 |
| Figure 17-1: |
LAC’s Reclamation Liability Release Map (SDBME, 2016) |
167 |
| Figure 23-1: |
Recommended Richmond Hill 2024 Diamond Drill-Hole Locations |
178 |
| | M3-PN240322
3 February 2025
Revision 0 |
ix |
Richmond
Hill Project
Mineral
Resource Estimate
List
of Tables
| TABLE |
DESCRIPTION |
PAGE |
| |
|
|
| Table 1-1: |
Mineral Resource Estimate |
3 |
| Table 1-2: |
Summary of Reconciliation Analysis for Contained Gold Ounces |
4 |
| Table 1-3: |
Budget for Recommended Work |
5 |
| Table 2-1: |
Qualified Persons Responsibilities |
9 |
| Table 3-1: |
Richmond Hill Gold Property Claims |
16 |
| Table 3-2: |
Richmond Hill Project Parcels with Holding Costs and Royalties |
24 |
| Table 3-3: |
Current Environmental Permits |
32 |
| Table 3-4: |
Potential Environmental Permits |
33 |
| Table 5-1: |
Summary of Richmond Hill’s Recent History |
40 |
| Table 7-1: |
Drilling by Company |
67 |
| Table 8-1: |
Groups of Drilling Programs at Richmond Hill Gold Project |
74 |
| Table 9-1: |
Comparison of Assay Certificates with Database for Dakota and Coeur
Drilling |
92 |
| Table 9-2: |
Comparison of Assay Certificates with Database for Legacy Drilling – Gold |
92 |
| Table 9-3: |
Comparison of Assay Certificates with Database for Legacy Drilling
– Silver |
93 |
| Table 10-1: |
Preliminary Geometallurgical Cluster Analysis Summary Table |
96 |
| Table 10-2: |
Historical Metallurgical Reports |
104 |
| Table 10-3: |
Master Composite Head Assays – BaseMet2023, BL1244 |
104 |
| Table 10-4: |
Rougher Flotation Results – BaseMet 2023, BL1244 |
105 |
| Table 10-5: |
Diagnostic Leach – BaseMet 2023, BL1244 |
107 |
| Table 10-6: |
Rougher Flotation Grind Series MC-TT-S – BaseMet 2023, BL1346 |
107 |
| Table 10-7: |
Rougher Flotation Results – BaseMet 2023, BL1346 |
109 |
| Table 10-8: |
Projected Precious Metal Recoveries |
111 |
| Table 11-1: |
Mineral Resource Estimate |
112 |
| Table 11-2: |
Mineral Resource at Various Prices – Leach Resources |
115 |
| Table 11-3: |
Mineral Resource at Various Prices – Mill Resources |
115 |
| Table 11-4: |
Economic Parameters for Mineral Resource Estimate |
117 |
| Table 11-5: |
Drilling by Company in Model Limits |
119 |
| Table 11-6: |
Model Rock Types |
121 |
| Table 11-7: |
Model Oxidation Zones |
125 |
| Table 11-8: |
Cap Grades and Number of Assays Capped |
127 |
| Table 11-9: |
Summary Statistics of Assays |
127 |
| | M3-PN240322
3 February 2025
Revision 0 |
x |
Richmond
Hill Project
Mineral
Resource Estimate
| Table 11-10: |
Summary Statistics of 10 ft. Composites |
128 |
| Table 11-11: |
Estimation Parameters |
140 |
| Table 11-12: |
Specific Gravity Measurements |
150 |
| Table 11-13: |
Reconciliation of January 2025 and October 2023 Mineral Resources – Leach Resource |
154 |
| Table 11-14: |
Reconciliation of January 2025 and October 2023 Mineral Resources – Mill Resource |
156 |
| Table 11-15: |
Summary of Reconciliation Analysis for Contained Gold Ounces |
158 |
| Table 22-1: |
Mineral Resource |
173 |
| Table 23-1: |
Budget for Recommended Work |
176 |
| | M3-PN240322
3 February 2025
Revision 0 |
xi |
Richmond Hill Project
Mineral
Resource Estimate
Dakota Gold Corp. (Dakota Gold) is a Delaware-incorporated
gold exploration and development company traded on the NYSE American with a head office in Lead, South Dakota. The company is focused
on revitalizing the Homestake District in South Dakota and has multiple gold mineral projects surrounding the historical Homestake mine,
including the Richmond Hill Gold Project (the Project), which is the subject of this Initial Assessment.
Dakota Gold contracted Independent Mining Consultants, Inc.
(IMC) of Tucson, Arizona to develop an updated mineral resource estimate and prepare an S-K 1300-compliant Initial Assessment and Technical
Report (the Report) for the Richmond Hill Gold Project. Mineral resources are reported using the definitions in Regulation S-K 1300,
17 CFR 229.1300. In this report, “resource” means “mineral resource” as defined therein.
The Project property is comprised of more than
3000 acres of private surface and mineral rights (the Property). The Project includes the past-producing Richmond Hill mine and the historical
mines of the Carbonate District, as well as multiple prospective areas where gold has been drill-intersected.
The Project is in the western portion of Lawrence
County, South Dakota (Figure 2-1), approximately 4.5 miles northwest of Lead, South Dakota. The former Richmond Hill mine is approximately
44° 22’ 45” N latitude and 103° 51’ 30” W longitude.
In 2021, Dakota Territory Resources Corp, now
DTRC LLC, entered into a three-year option agreement (the Option) with Barrick subsidiaries Homestake Mining Company of California and
LAC Minerals (for convenience referred to collectively at times as Barrick) to acquire their interests in the Richmond Hill Project area.
In 2022, the Option was amended to extend the Option period until March 7, 2026. The Option was again amended in February 2025,
extending the option until December 31, 2028. Most parcels in the Option area include both surface and mineral rights, but in some
instances the Option only includes mineral rights, as discussed further in Section 3 of this Report. Under the Option, Dakota Gold
is obligated to file a 1% royalty against the Option properties upon exercise of the Option. Certain portions of the Project are subject
to additional royalties, as described further in Section 3 of this Report.
| 1.2 | Geology
and Mineralization |
The Project is near the northwest end of the
Black Hills which is an oval-shaped north-northwest-striking mountain range approximately 45 miles by 90 miles in extent along the western
side of South Dakota and extending into Wyoming. The Black Hills is a domal uplift where erosion has exposed a window of Precambrian
igneous and metamorphic rocks flanked by a 6500 to 7000 feet deep sequence of Paleozoic to Mesozoic-aged sedimentary rocks dipping off
in all directions on the margin of the uplift, all subjected to intrusive activity in the Tertiary.
The Project is located on the northwestern portion
of the Lead dome, a subsidiary dome north of the main Black Hills uplift. The Lead dome developed in response to a major Tertiary intrusive
event that also led to development of the Tertiary-aged gold deposits. These Tertiary intrusive rocks have a wide range of compositions
and occur as stocks, sills, dikes, laccoliths, and breccia pipes. The Property forms a circular area approximately 2 miles in diameter.
Two major terranes underlie the claims. Precambrian
metamorphic rocks outcrop on the southern portions of the Property and consist of metamorphosed volcanic and sedimentary rocks. The western
portion of this terrane contains primarily extrusive metavolcanic rocks that appear to be mostly mafic in composition. The metasedimentary
rocks on the eastern side consist of phyllite, iron formations, and quartzites. Overlying the Precambrian rock on the north end of the
Property is a nearly complete Paleozoic section, which includes the Cambro-Ordovician Deadwood Formation; Ordovician to Mississippian
Englewood and the Whitewood and Winnipeg Formations; Mississippian Pahasapa Limestone; and the Pennsylvanian Minnelusa Formation. Tertiary
igneous rocks of varying composition have intruded extensively into both terranes.
| | M3-PN240322
3 February 2025
Revision 0 |
1 |
Richmond
Hill Project
Mineral
Resource Estimate
Several gold–silver deposits and prospective
areas exist within the Project boundary. Within the Precambrian terrane, Tertiary-aged mineralization occurs within breccia pipes and
altered Precambrian rocks, with minor mineralization in the Tertiary intrusive rocks. Examples include the Richmond Hill deposit, Twin
Tunnels, Turnaround, Richmond Hill North, West Thumb, Huskie West, Cleveland, Calvin P, Cole Creek Heights, and Earle.
Within the Paleozoic terrane, mineralization
occurs in the Cambro-Ordovician Deadwood Formation along two primary horizons containing the most consistent mineralization. Examples
within the Deadwood Formation are Cole Creek in the upper portion and MW-3 Main, MW-3 East, and Chism Gulch in the lower portion. Localized
gold mineralization also occurs in the Pahasapa Limestone but is limited to narrow veins and structures in the old Carbonate Camp area.
| 1.3 | Exploration,
Development, and Operations |
Prior to Dakota Gold’s tenure, the Property
was drilled by at least 1,056 rotary, RC, and core holes testing multiple prospective areas within the claim boundary. Several of these
holes are excluded from the final database due to missing collar coordinates, downhole surveys, or other issues. Since optioning the
Property in 2021 to the effective date of this report, Dakota Gold has included an additional 148 diamond drill holes in this resource
estimate, representing 157,504 feet of core drilling. As of the date of this Report, the Project remains open in multiple directions
and Dakota Gold continues to conduct exploratory drilling of the Property.
Prior to entering into the Option agreement for
the Property, Dakota Gold also flew a high-resolution helicopter-borne magnetic and gamma-ray spectrometric survey over the Homestake
District. The survey covered an area of 962.4 km2 and included the Project area, with the objective of mapping Precambrian
lithologies and structure as well as Tertiary intrusive rocks and associated alteration in outcrop, subsurface, and beneath cover. The
results of this survey are not publicly available.
| 1.4 | Sample
Preparation, Analysis, Security, and Data Verification |
From 1984 to 1994, project drilling was completed
by St Joe, Bond Gold, and Homestake. Current industry QA/QC standards were not part of these programs. However, IMC has compared
historical drilling data against more recent data using current QA/QC protocols and found that the two populations of historical and
current data are similar with no evident errors or biases.
From 2019 to the present, current industry standards
for QA/QC have been followed. It is the opinion of the QP for this section that the Richmond Hill assay database of historical and current
data is adequate for the estimation of mineral resources and subsequent mineral reserves.
| 1.5 | Mineral
Processing and Metallurgy |
Historical oxide metallurgical testing was conducted
primarily at St. Joe’s Technical Center and on-site at the Richmond Hill Metallurgical Testing laboratory. Additional work was
conducted at Dawson Metallurgical Laboratories, Bondar-Clegg, Kappes Cassiday & Associates and Heinen Lindstrom and Associates.
This data was used to support the design and engineering of the production processing facility at Richmond Hill which operated from 1988
to 1993. Recent metallurgical testing focused on froth flotation of the transition and sulfide material was completed at Basement laboratories
in 2024.
The metallurgical testwork shows that Richmond
Hill oxide material is amenable to cyanide heap processing for the recovery of precious metals. Oxide heap leach recoveries are projected
at 89% and 30% for gold and silver respectively. The testwork also indicates that the Richmond Hill sulfide material is amenable to froth
flotation resulting in a precious metal rich sulfide concentrate. Precious metal recoveries via flotation are estimated at 85% for both
gold and silver. Testing of the transition material indicates it is possible to process this transition material via heap leaching or
flotation depending on the level of oxidation. Flotation of low sulfide transition material is estimated at 65% gold and 20% for silver.
Flotation of high sulfide transition material is estimated at 80% gold and 70% silver.
| | M3-PN240322
3 February 2025
Revision 0 |
2 |
Richmond
Hill Project
Mineral
Resource Estimate
Additional metallurgical testwork is planned
to further define the metallurgical response and facilitate development of the Richmond Hill geometallurgical mode.
| 1.6 | Mineral
Resource Estimate |
The mineral resource estimate for Richmond Hill
includes mineral resources amenable to heap leaching and mineral resources amenable to milling. The mineral resource amenable to heap
leaching consists of the oxide and transition material types, and the mineral resource amenable to milling consists of the sulfide material.
Table 1-1 presents the mineral resource estimate. The measured and indicated mineral resource amenable to leaching amounts to 269.8 million
tons at 0.0135 oz/t gold and 0.141 oz/t silver for 3.65 million ounces of contained gold and 38.1 million ounces of contained silver.
Inferred mineral resource amenable to leaching is an additional 254.2 million tons at 0.0103 oz/t gold and 0.090 oz/t silver for 2.61
million ounces of contained gold and 22.8 million ounces of contained silver.
The measured and indicated mineral resource amenable
to milling amounts to 69.6 million tons at 0.0141 oz/t gold and 0.139 oz/t silver for 982,100 ounces of contained gold and 9.68 million
ounces of contained silver. Inferred mineral resource amenable to milling is an additional 202.2 million tons at 0.0121 oz/t gold and
0.145 oz/t silver for 2.45 million ounces of contained gold and 29.3 million ounces of contained silver.
The measured and indicated mineral resource for
leach and mill material amounts to 339.4 million tons at 0.0137 oz/t gold and 0.141 oz/t silver for 4.64 million ounces of contained
gold and 47.8 million ounces of contained silver. Inferred mineral resource for leach and mill material is an additional 456.4 million
tons at 0.0111 oz/t gold and 0.114 oz/t silver for 5.06 million ounces of contained gold and 52.1 million ounces of contained silver.
Table 1-1: Mineral Resource Estimate
| Resource Category | |
AuEq
COG (oz/t) | |
Ktons | |
AuEq (oz/t) | |
Gold (oz/t) | |
Silver (oz/t) | |
Gold (koz) | |
Silver (koz) | |
| Leach Resource: | |
| |
| |
| |
| |
| |
| |
| |
| Measured
Mineral Resource | |
| |
113,748 | |
0.0164 | |
0.0158 | |
0.160 | |
1,793.4 | |
18,208 | |
| Oxide | |
0.0026 | |
94,537 | |
0.0165 | |
0.0158 | |
0.167 | |
1,493.7 | |
15,788 | |
| Transition | |
0.0041 | |
19,211 | |
0.0161 | |
0.0156 | |
0.126 | |
299.7 | |
2,421 | |
| Indicated
Mineral Resource | |
| |
156,019 | |
0.0125 | |
0.0119 | |
0.128 | |
1,860.0 | |
19,884 | |
| Oxide | |
0.0026 | |
127,237 | |
0.0122 | |
0.0117 | |
0.128 | |
1,488.7 | |
16,286 | |
| Transition | |
0.0041 | |
28,783 | |
0.0134 | |
0.0129 | |
0.125 | |
371.3 | |
3,598 | |
| Meas/Indic
Mineral Resource | |
| |
269,768 | |
0.0141 | |
0.0135 | |
0.141 | |
3,653.3 | |
38,092 | |
| Oxide | |
0.0026 | |
221,774 | |
0.0140 | |
0.0134 | |
0.145 | |
2,982.4 | |
32,074 | |
| Transition | |
0.0041 | |
47,994 | |
0.0145 | |
0.0140 | |
0.125 | |
671.0 | |
6,018 | |
| Inferred
Mineral Resource | |
| |
254,186 | |
0.0106 | |
0.0103 | |
0.090 | |
2,613.4 | |
22,787 | |
| Oxide | |
0.0026 | |
211,994 | |
0.0101 | |
0.0098 | |
0.085 | |
2,077.5 | |
18,019 | |
| Transition | |
0.0041 | |
42,192 | |
0.0131 | |
0.0127 | |
0.113 | |
535.8 | |
4,768 | |
| Mill Resource (Sulfides): | |
| |
| |
| |
| |
| |
| |
| |
| Measured Mineral Resource | |
0.0050 | |
20,703 | |
0.0184 | |
0.0165 | |
0.151 | |
341.6 | |
3,126 | |
| Indicated Mineral Resource | |
0.0050 | |
48,893 | |
0.0147 | |
0.0131 | |
0.134 | |
640.5 | |
6,552 | |
| Meas/Indic Mineral Resource | |
0.0050 | |
69,596 | |
0.0158 | |
0.0141 | |
0.139 | |
982.1 | |
9,678 | |
| Inferred Mineral
Resource | |
0.0050 | |
202,221 | |
0.0139 | |
0.0121 | |
0.145 | |
2,446.9 | |
29,322 | |
| Leach and Mill Mineral Resource: | |
| |
| |
| |
| |
| |
| |
| |
| Measured Mineral Resource | |
| |
134,452 | |
0.0167 | |
0.0159 | |
0.159 | |
2,135.0 | |
21,334 | |
| Indicated Mineral Resource | |
| |
204,912 | |
0.0130 | |
0.0122 | |
0.129 | |
2,500.5 | |
26,436 | |
| Meas/Indic Mineral Resource | |
| |
339,364 | |
0.0145 | |
0.0137 | |
0.141 | |
4,635.4 | |
47,770 | |
| Inferred Mineral
Resource | |
| |
456,407 | |
0.0121 | |
0.0111 | |
0.114 | |
5,060.3 | |
52,109 | |
| | M3-PN240322
3 February 2025
Revision 0 |
3 |
Richmond
Hill Project
Mineral
Resource Estimate
Notes:
1. The Mineral Resource estimate has an effective
date of 3 February 2025.
2. All figures are rounded to reflect the relative
accuracy of the estimate and therefore numbers may not appear to add precisely.
3. Mineral Resources that are not Mineral Reserves
do not have demonstrated economic viability.
4. Mineral Resources are based on prices of $2000/oz
gold and $25/oz silver.
5. Mineral Resources for leach material are based
on a gold equivalent cut-off of 0.0026 oz/t for oxide material and 0.0041 oz/t for transition material. Mineral Resources for mill material
are based on a gold equivalent cut-off of 0.0050 oz/t.
6. The gold equivalent value for each material
is as follows:
Oxide (Leach): Gold equivalent (oz/t) = gold
(oz/t) + 0.00418 x silver (oz/t), based on gold recovery of 89% and silver recovery of 30%.
Transition (Leach): Gold equivalent = gold (oz/t)
+ 0.00382 x silver (oz/t), based on gold recovery of 65% and silver recovery of 20%.
Sulfide (Mill): Gold equivalent = gold (oz/t)
+ 0.0127 x silver (oz/t), based on gold recovery of 85% and silver recovery of 85%.
7. The gold equivalent values account for metal
recoveries, treatment charges, refining costs, and refinery payable percentages.
8. Table 11-4 accompanies this Mineral Resource
statement and shows all relevant parameters for mineral resources.
9. Includes a preliminary estimated royalty rate
of 3.8% averaged across the Project property. The QP has determined that the resource is not sensitive to nominal changes in the royalty
rate but has recommended that this estimate be updated for the Project economic and cash flow analysis.
10. Mineral Resources are reported in relation
to a conceptual constraining pit shell to demonstrate reasonable prospects for economic extraction, as required by the definition of
Mineral Resource in S-K 1300; mineralization lying outside of the pit shell is excluded from the Mineral Resource.
11. The Mineral Resource estimate is also constrained
by the Richmond Hill Project Boundary. Only mineralization inside this boundary is included in the Mineral Resource Estimate, though
waste removal outside the boundary is allowed.
12. The Mineral Resources reported are contained
on mineral titles owned or controlled by Dakota Gold.
13. The Mineral Resources are reported in-situ
without any dilution or loss considerations, as a point of reference.
Table 1-2 presents a reconciliation of the January 2025
mineral resource estimate with the SK-1300 Initial Assessment published in April 2024 (analysis dated current as of October 5,
2023) estimate for mineral resources amenable to leaching. This includes the oxide and transition material. Notable changes include conversion
of hard grade estimation boundaries to soft boundaries based on additional data and analysis and updated domains for oxide, transition,
and sulfide materials. Updates to cut off grade, recovery rates, costs, gold price, and addition of silver also positively impacted the
model.
Table 1-2: Summary of Reconciliation Analysis
for Contained Gold Ounces
| | |
Oxide/Transition
(Leach) | |
Sulfide
(Mill) | |
All Mineral
Resource | |
| | |
Meas/Indic | |
Inferred | |
Meas/Indic | |
Inferred | |
Meas/Indic | |
Inferred | |
| Parameter | |
Au (koz) | |
Au (koz) | |
Au (koz) | |
Au (koz) | |
Au (koz) | |
Au (koz) | |
| Start - October 2023 Mineral Resource | |
859 | |
836 | |
469 | |
296 | |
1,328 | |
1,132 | |
| Due to Updated Oxide/Transition/Sulfide Domains | |
453 | |
461 | |
(302 | ) |
(197 | ) |
151 | |
264 | |
| Due to Internal versus Breakeven Cut-off Grade | |
35 | |
69 | |
10 | |
6 | |
45 | |
75 | |
| Due to Updated Recoveries | |
5 | |
37 | |
65 | |
138 | |
70 | |
175 | |
| Due to $2,000/oz Price | |
11 | |
47 | |
1.6 | |
5 | |
13 | |
53 | |
| Due to Dakota Gold Costs | |
51 | |
182 | |
(0.4 | ) |
(10 | ) |
51 | |
172 | |
| Due to Updated Resource Model (Note 1) | |
2,215 | |
910 | |
698 | |
1,855 | |
2,914 | |
2,765 | |
| Due to Silver (Note 2) | |
24 | |
72 | |
41 | |
353 | |
64 | |
425 | |
| Cumulative Change for All Parameters | |
2,794 | |
1,778 | |
513 | |
2,151 | |
3,307 | |
3,929 | |
| Final - January 2025 Mineral Resource | |
3,653 | |
2,613 | |
982 | |
2,447 | |
4,635 | |
5,060 | |
Note 1. Only gold used to develop resource shell.
Note 2. Silver economics allowed to contribute
to resource shell
| | M3-PN240322
3 February 2025
Revision 0 |
4 |
Richmond
Hill Project
Mineral
Resource Estimate
In the 1980s and 1990s, considerable environmental
baseline information was collected to support historical mine permitting and to support reclamation and closure activities. This information,
along with new and additional or updated data, will be required to support future mine development and permitting efforts.
Dakota Gold collects select environmental baseline
information required to support planned exploration permitting and assist with reclamation of disturbed sites. Key environmental baseline
disciplines required to support exploration drilling permitting include: vegetation, wildlife, cultural, archaeology, and historical.
Dakota Gold will also be negotiating additional baseline requirements with South Dakota Department of Agriculture and Natural Resources
(SDDANR) as part of its permitting process for a new mine at Richmond Hill.
As part of LAC’s closure program at Richmond
Hill Mine, all material classified as acid generating was removed from the Spruce Gulch waste dump and placed in truck compacted lifts
back into the historical Richmond Hill mining area. Following placement of that material, the material was capped with clay to minimize
oxygen and water infiltration into the compacted potentially acid-generating material. LAC also used this method to remediate the ore
material on the heap leach pads, isolating the pads with a similar clay cap. The leach pad and backfilled historical Richmond Hill mining
area impoundment covers have met or exceeded original design specifications for limiting infiltration.
Any potentially impacted groundwater from the
former process area, pit impoundment, or Spruce Gulch waste dump facility is actively managed by two on-site water management and treatment
systems that have continued to operate throughout the post-closure period. Continued water treatment at these sites would be the responsibility
of Dakota Gold once the Option is exercised. The associated costs are subject to post-closure bonding, the obligation for which would
be assumed by Dakota Gold upon exercise of the Option.
| 1.8 | Conclusion
and Recommendations |
Under the assumptions presented in this Initial
Assessment Technical Report, and based on the available data, the Mineral Resource Estimates show reasonable prospects of economic extraction.
In addition, due to the nature of the Project and the ability to advance Richmond Hill towards production, the recommendation section
also outlines an estimate for a complete feasibility level work program. Of the feasibility level work outlined, certain areas of work
can be advanced concurrently with the recommended Initial Assessment with cash flow analysis, while others may be informed by the work.
The recommended program is for the company to
complete an economic and cash flow analysis.
The following are recommendations for the next
stages of work to advance the Project:
| · | Advance
the Project to an Initial Assessment that includes an economic analysis. |
| · | Additional
metallurgical testwork and process design. |
| · | Additional
drilling to infill the current mineral resource and test additional prospective areas. This
will also improve definition of geological domains and provide material for metallurgical
testing. |
| · | Advancement
of baseline environmental data collection to support initiation of Project permitting. |
| | M3-PN240322
3 February 2025
Revision 0 |
5 |
Richmond
Hill Project
Mineral
Resource Estimate
Table 1-3 summarizes the budget cost for these
items.
Table 1-3: Budget for Recommended Work
| Item | |
2025 | | |
2026 | | |
Total | |
| 1. Program To Initial Assessment W/ Cash Flow
(IACF) | |
$ | 842,000 | | |
| - | | |
$ | 842,000 | |
| 2. Program For Feasibility Study (FS) Metallurgy and Environmental | |
$ | 2,700,000 | | |
$ | 3,000,000 | | |
$ | 5,700,000 | |
| - Metallurgy Program | |
$ | 500,000 | | |
$ | 400,000 | | |
$ | 900,000 | |
| - Monitoring Wells | |
$ | 600,000 | | |
| - | | |
$ | 600,000 | |
| - Environmental Geochemistry | |
$ | 120,000 | | |
$ | 300,000 | | |
$ | 420,000 | |
| - Environmental Samples/Analytics | |
$ | 840,000 | | |
$ | 1,000,000 | | |
$ | 1,840,000 | |
| - Environmental Studies/Modeling/Other | |
$ | 640,000 | | |
$ | 1,300,000 | | |
$ | 1,940,000 | |
| 3. Drilling Program | |
$ | 15,500,000 | | |
$ | 18,000,000 | | |
$ | 33,500,000 | |
| - Target Additional 500k oz For
Resource | |
$ | 9,000,000 | | |
$ | 2,000,000 | | |
$ | 11,000,000 | |
| - Target To Conversion of Resource
to Three Years Reserves | |
$ | 1,500,000 | | |
$ | 9,500,000 | | |
$ | 11,000,000 | |
| - Drilling
For Metallurgical Testing | |
$ | 5,000,000 | | |
$ | 6,500,000 | | |
$ | 11,500,000 | |
| Total | |
$ | 19,042,000 | | |
$ | 21,000,000 | | |
$ | 40,042,000 | |
It is anticipated that these items would be performed
over the next two years. Given the robust nature of the resource identified, Dakota Gold may choose to defer some portion of additional
exploration drilling.
| | M3-PN240322
3 February 2025
Revision 0 |
6 |
Richmond
Hill Project
Mineral
Resource Estimate
Dakota Gold Corp. (Dakota Gold) is a Delaware-incorporated
company traded on the NYSE American and with a head office in Lead, South Dakota. Dakota Gold is focused on revitalizing the Homestake
District in South Dakota. Dakota Gold has multiple gold mineral projects surrounding the historical Homestake mine, including the Richmond
Hill Gold Project, which is the subject of this technical report summary. The Project hosts the former Richmond Hill gold mine that operated
from 1988 to 1993 as an open pit mine with heap leach facilities. The Project location is shown in Figure 2-1.
Dakota Gold contracted Independent Mining Consultants, Inc.
(IMC) of Tucson, Arizona to develop an updated mineral resource estimate and prepare an SK 1300-compliant Initial Assessment and Technical
Report for the Richmond Hill Gold Project (the Project). Mineral resources are reported using the definitions in Regulation S-K 1300,
17 CFR 229.1300. IMC’s scope of work was as follows:
| · | Validate
gold and silver assays in the database with original assay certificates for a representative
portion of the data. |
| · | Review
the quality assurance/quality control (QA/QC) programs and results for drilling database. |
| · | Review
geologic solids developed by Dakota Gold personnel and incorporate them into the resource
model. |
| · | Develop
gold and silver grade estimates and resource classification for the resource model. |
| · | Develop
an updated mineral resource for the Project. |
| · | Prepare
the updated Technical Report. |
Dakota Gold contracted Woods Process Services,
LLC (Woods) of Sparks, Nevada to perform the following scope of work for the Project:
| · | Review
existing metallurgical testing data and make estimates of process recoveries and processing
costs for the various mineral types. |
| · | Design
solids to define the various mineral types in the resource model. |
| · | Provide
recommendations on additional metallurgical testing. |
| · | Provide
sections for the updated Technical Report. |
| | M3-PN240322
3 February 2025
Revision 0 |
7 |
Richmond
Hill Project
Mineral
Resource Estimate

Figure 2-1: Property Location
| | M3-PN240322
3 February 2025
Revision 0 |
8 |
Richmond
Hill Project
Mineral
Resource Estimate
Table 2-1 shows the Qualified Persons (QPs) for
this technical report and their respective areas of responsibility.
Table 2-1: Qualified Persons Responsibilities
| Qualified Person | |
Company | | |
Report Section(s) of
Responsibility |
| Michael G. Hester | |
IMC | | |
1 except 1.5,2-8,9.1,11-21,22 except
22.2, 23 except 23.2 and 23.6,24-26 |
| Jeffrey L. Woods | |
Woods | | |
1.5,9.2,10,22.2,23.2,23.6 |
Michael G. Hester visited the Property on January 16th
and 17th, 2025 to review site conditions and interview site personnel. This included the core logging, processing and
storage facilities.
Jeffrey L. Woods did not visit the site. There
is currently no on-site process-related infrastructure to examine.
Information in this Report is current as of February 3,
2025.
| 2.5 | Sources
of Information |
The main sources of information for this technical
report include:
| · | The
drillhole database compiled and maintained by Dakota Gold. |
| · | Various
geologic and ore type solids developed by Dakota Gold and Woods personnel. |
| · | The
report “S-K 1300 Initial Assessment and Technical Report Summary – Richmond Hill
Gold Project, South Dakota, U.S.A” dated April 30, 2024, by AKF Mining Services
Inc. |
| · | Reports
and documents cited in Sections 24 and 25 were used to support the preparation of this Report. |
| 2.6 | Previous
Technical Report Summaries |
The Registrant filed a technical report summary
on the Project, dated April 30, 2024, that included a maiden mineral resource estimate for the Project.
| 2.7 | Acronyms
and Abbreviations |
| $ | U.S. dollar |
| 3D | three-dimensional |
| AAS | atomic absorption spectroscopy |
| Ag | silver |
| AKF | AKF Mining Services Inc. |
| AOI | Area of Interest |
| ARD | acid-rock drainage |
| ARSD | Administrative Rules of South Dakota |
| Au | gold |
| Aueq | Gold equivalent |
| BC | Bondar-Clegg |
| B.C. | British Columbia |
| Barrick | Barrick Gold Corporation |
| | M3-PN240322
3 February 2025
Revision 0 |
9 |
Richmond
Hill Project
Mineral
Resource Estimate
| BaseMet |
Base Metallurgical Laboratories |
| BLK |
blank |
| BMA |
bulk mineral analysis |
| BVMM |
Bureau Veritas Metals and Minerals |
| BWi |
Bond ball mill work index |
| CC |
Cole Creek |
| CDP |
crushed duplicate |
| CF |
Chism Flat |
| CG |
Chism Gulch |
| CN |
Cyanide |
| COd |
Cambro-Ordovician Deadwood Formation |
| COdcs |
Deadwood Formation basal conglomerate-sandstone |
| Core |
Central Crystalline Core |
| CP |
Calvin Point |
| CRM |
certified reference material |
| Cu |
copper |
| CUP |
Conditional Use Permit |
| CV |
Cleveland |
| Dakota Gold |
Dakota Gold Corp. |
| DO |
dissolved oxygen |
| DTRC |
Dakota Territory Resource Corp. |
| DUP |
duplicate |
| ERM |
Environmental Resources Management |
| EXNI |
Exploration Notice of Intent |
| Fe |
iron |
| Freeport |
Freeport Exploration Company |
| GRG |
gravity-recoverable gold |
| Homestake |
Homestake Mining Company of California |
| ICP-ES |
inductively coupled plasma-emission spectroscopy |
| ID2 |
inverse distance squared |
| IMC |
Independent Mining Consultants, Inc. |
| IP |
induced polarization |
| IRR |
internal rate of return |
| JV |
joint venture |
| Koz |
1000 troy ounces |
| K-Met |
K-Met Consultants Inc. |
| LAC |
LAC Minerals |
| LDL |
lower detection limit |
| Magee |
Magee Geophysical Surveys LLC |
| MC |
master composite |
| Mia |
coarse ore index |
| MRE |
mineral resource estimate |
| NaCN |
sodium cyanide |
| NPV |
net present value |
| NSR |
net smelter return |
| NWS |
National Weather Service |
| | M3-PN240322
3 February 2025
Revision 0 |
10 |
Richmond
Hill Project
Mineral
Resource Estimate
| OK |
ordinary kriging |
| P80 |
80% passing |
| PAX |
potassium amyl xanthate |
| pC |
undivided Precambrian |
| PDP |
pulp duplicate |
| PEA |
preliminary economic assessment |
| Pef |
Precambrian Ellison |
| Pfl |
Precambrian Flagrock |
| Pgn |
Precambrian Greenstone |
| POX |
pressure oxidation |
| Property |
Richmond Hill Gold Project |
| QA/QC |
quality assurance and quality control |
| Q/C |
quality control |
| QP |
qualified person |
| RC |
reverse circulation |
| RH |
Richmond Hill |
| RHN |
Richmond Hill North |
| RO |
reverse osmosis |
| RQD |
rock quality designation |
| S |
sulfur |
| SAG |
semi-autogenous grinding |
| SCSE |
SAG circuit specific energy |
| SD |
standard deviation |
| SDBME |
South Dakota Board of Minerals & Environment |
| SDDANR |
South Dakota Department of Agriculture & Natural Resources |
| SDDENR |
South Dakota Department of Environment & Natural Resources |
| SDP |
sample duplicate |
| SMC |
SAG mill comminution |
| St. Joe |
St. Joe Gold Corporation |
| SURF |
Sanford Underground Research Facility |
| SWD |
surface water discharge |
| SWPPP |
Stormwater Pollution Prevention Plan |
| TA |
Turn Around |
| Tbx |
Tertiary hydrothermal breccia |
| Tbx RH |
Richmond Hill Tertiary hydrothermal breccia |
| Tbx RHN-NN |
Richmond Hill North No Name Tertiary hydrothermal breccia |
| Tdk |
Tertiary dike |
| Ti |
Tertiary intrusive |
| Tsl |
Tertiary sill |
| TT |
Twin Tunnels |
| U.S. |
United States of America |
| Viable |
Viable Resources Inc. |
| WOL |
whole ore leach |
| |
|
| Units of Measure |
|
| |
|
| μm |
micrometer (micron) |
| | M3-PN240322
3 February 2025
Revision 0 |
11 |
Richmond
Hill Project
Mineral
Resource Estimate
| ° |
degrees azimuth |
| °F |
degrees Fahrenheit |
| % |
percent |
| $ |
United States dollar |
| ft |
foot |
| ft3/ton |
cubic feet per US ton |
| g |
gram |
| g/cm3 |
grams per cubic meters |
| g/mt |
grams per tonne |
| Ga |
giga-annum (billion years) |
| gal/min |
U.S. gallons per minute |
| h |
hour |
| kg |
kilogram |
| kg/t |
kilogram per tonne |
| km2 |
kilometer squared |
| kton |
1000 US tons |
| ktonne |
1000 metric tonnes |
| kV |
kilovolt |
| kW |
kilowatt |
| kWh/m3 |
kilowatt hours per cubic meter |
| kWh/t |
kilowatt hour per tonne |
| L |
liter |
| m3 |
cubic meter |
| m |
meter |
| Ma |
mega-annum (one million years) |
| mg |
milligram |
| mg/L |
milligram per liter |
| ml |
milliliter |
| mm |
millimeter |
| Moz |
million ounces |
| ms |
millisecond |
| Mton |
megaton (one million tons) |
| Opt |
ounces per short ton |
| oz |
troy ounce |
| oz/t |
ounces per short ton |
| oz/ton |
ounces per short ton |
| ppm |
parts per million |
| t |
tonne |
| ton |
short ton |
| ton/ft3 |
tons per cubic foot |
| t/m3 |
tonnes per cubic meter |
| wt% |
weight percentage |
| | M3-PN240322
3 February 2025
Revision 0 |
12 |
Richmond
Hill Project
Mineral
Resource Estimate
| 2.8 | Units
of Measure and Metric Equivalents |
Currency
Currency is expressed in United States dollars
($).
Units of Measure and Metric Equivalents
All units of measure used in this Report are
United States (US) customary units unless otherwise noted.
Linear Measure
| 1 centimeter |
= 0.3937 inches |
|
| |
|
|
| 1 meter |
= 3.2808 feet |
= 1.0936 yards |
| |
|
|
| 1 kilometer |
= 0.6214 miles |
|
Area Measure
| 1 hectare |
= 2.471 acres |
= 0.0039 square
miles |
Capacity Measure (liquid)
| 1 liter |
= 0.2642 United
States (US) gallons |
Weight
| 1 tonne |
= 1.1023 tons |
= 2,205 pounds |
| |
|
|
| 1 kilogram |
= 2.205 pounds |
|
| |
|
|
| 1 troy ounce (oz) |
= 31.1034768 grams |
|
| | M3-PN240322
3 February 2025
Revision 0 |
13 |
Dakota
Gold
Technical
Report
Dakota Gold’s Richmond Hill Gold Project
comprises 3002.07 acres, including 3000.62 acres of private surface and mineral rights. The Project includes the past-producing Richmond
Hill mine and the historical mines of the Carbonate District, as well as multiple prospective areas where gold has been drill-intersected.
The Project is in the western portion of Lawrence
County, South Dakota (Figure 2-1), approximately 4.5 miles northwest of Lead, South Dakota.
The center of the main claim block for the Project
is at approximately 44° 23’ N latitude and 103° 51’ W longitude. The former Richmond Hill mine is approximately 44°
22’ 45” N latitude and 103° 51’ 30” W longitude.
St. Joe Gold Corporation (St. Joe) developed
the former Richmond Hill gold mine in 1987. Bond Gold Corporation (Bond Gold) acquired the St. Joe Gold Corporation gold division in
1988. The mine was permitted, and construction of the mine facilities began in April 1988 under the ownership of Bond Gold.
In November 1989, LAC Minerals Ltd. Acquired
Bond Gold. After the merger, the Project was held by the LAC subsidiary Richmond Hill Inc. In 1993, Richmond Hill Inc merged into LAC
Minerals (USA) Inc. LAC Minerals (USA) Inc. converted to LAC Minerals (USA) LLC in 1999. Barrick Gold Corporation (Barrick) acquired
LAC Minerals Ltd., the parent of LAC Minerals (USA) LLC in November 1994.
The Homestake Mining Company was acquired by
Barrick in 2001. LAC Minerals (USA) LLC (hereafter “LAC”) and Homestake Mining Company of California (hereafter “Homestake”),
a subsidiary of Homestake Mining Company, merged in October 2023, with Homestake as the surviving entity. Homestake is the current
owner of the properties formerly held separately by LAC and Homestake.
Dakota Territory Resources Corp, now DTRC LLC,
entered into a three-year Option agreement with Homestake and LAC (for convenience referred to collectively at times as Barrick) in 2021
to acquire the Homestake/LAC interests in the Richmond Hill Project area, with the mineral tenure primarily held in the names of LAC
and Homestake (see discussion in 3.3 and 3.4). In 2022, the Option was amended to extend the Option period until March 7, 2026.
In February 2025, the Option was again amended to extend the Option until December 31, 2028.
In addition to the optioned Property, Dakota
Gold (or its subsidiaries), acquired ~324 acres of private property in the Richmond Hill Project area of which ~76 acres are of surface
interest only on Property included in the Richmond Hill Option Agreement.
| 3.3 | Mineral
Tenure Holdings |
Within the western portion of Lawrence County,
South Dakota, the Property covers portions of Sections 9 to 11, 13 to 16, 21 to 24, 26 to 28, and 33 to 35, Township 5 North, Range 2
East, Black Hills Meridian, plus portions of Sections 1, 3, 4, 12, and 13, Township 4 North, Range 2 East, Black Hills Meridian, and
a portion of Section 31, Township 5 North, Range 3 East, Black Hills Meridian, plus portions of Sections 6 and 7, Township 4 North,
Range 3 East, Black Hills Meridian (Dakota Gold n.d. c 2023) (Figure 3-1). The Property is contiguous with Dakota Gold’s West Corridor
and Blind Gold Properties and is approximately two and a half miles north of the producing Wharf Gold mine owned by Coeur Mining.
| | M3-PN240322
3 February 2025
Revision 0 |
14 |
Dakota
Gold
Technical
Report
The Richmond Hill Project consists of both property
subject to the Option (further discussed below) comprising of 94 Lawrence County, South Dakota, Land parcels and two unpatented mining
claims as well as 3 additional Lawrence County, South Dakota, Land Parcels owned by Dakota Gold Corp. (DTRC LLC). The 94 land parcels
of the Option agreement comprise 246 mineral survey patented lode claims, purchased government lots, and subdivided lots. Twenty-nine
(29) parcels consist only of the mineral rights, with the surface belonging to various owners. The 3 additional land parcels comprise
16 mineral survey patented lode claims. Table 3-1 contains a claims listing.
In October 2023, LAC and Homestake merged,
and Homestake now owns or controls the entire Option property. At the Report date, Homestake and LAC remain listed in the agreement as
owning their respective claims.
| | M3-PN240322
3 February 2025
Revision 0 |
15 |
Dakota
Gold
Technical
Report
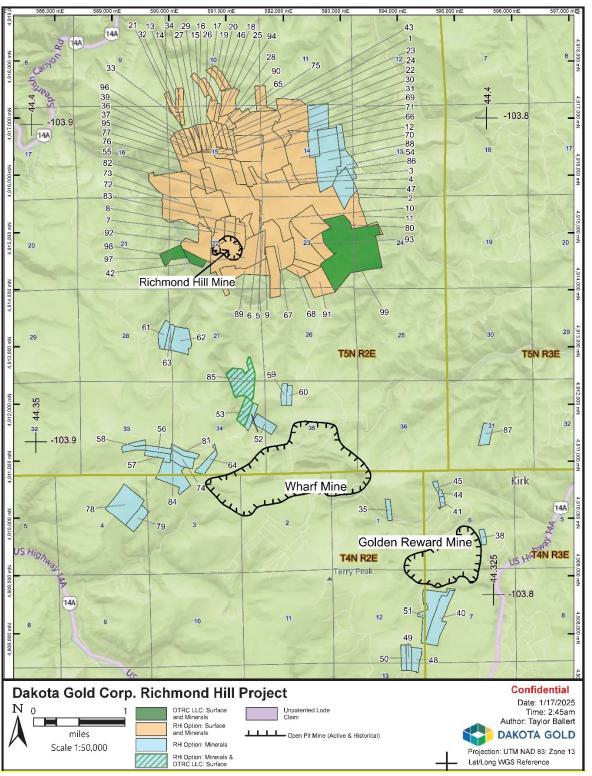
Figure 3-1: Richmond Hill Project Location and
Ownership
| | M3-PN240322
3 February 2025
Revision 0 |
16 |
Dakota
Gold
Technical
Report
Table 3-1: Richmond Hill Gold Property Claims
Map
ID |
County Tax Parcel ID |
Mineral Property Type |
Mineral
Survey # |
Patented Lode or
Government Lot |
Property Owner |
| 1 |
16000-00502-110-10 |
Patented Mineral Properties |
|
Govt. Lot 10 |
Homestake Mining Company of California |
| 2 |
16000-00502-130-12 |
Patented Mineral Properties |
|
Govt. Lot 12 |
Homestake Mining Company of California |
| 3 |
16000-00502-140-02 |
Patented Mineral Properties |
|
Govt. Lot 2 |
Homestake Mining Company of California |
| |
Govt. Lot 3 |
| |
Govt. Lot 4 |
| |
Govt. Lot 7 |
| |
Govt. Lot 8 |
| |
Govt. Lot 9 |
| |
Govt. Lot 10 |
| 4 |
16000-00502-150-00 |
Patented Mineral Properties |
|
Govt. Lot 3 |
LAC Minerals (USA) LLC |
| |
Govt. Lot 9 |
| |
Govt. Lot 10 |
| |
Govt. Lot 12 |
| |
Govt. Lot 13 |
| 5 |
16000-00502-150-10 |
Patented Mineral Properties |
|
Tract 0102-A |
LAC Minerals (USA) LLC |
| |
Tract 0102-B |
| |
Tract 0103-B |
| |
Tract 0103-A |
| 6 |
16000-00502-220-01 |
Patented Mineral Properties |
|
Govt. Lot 1 |
LAC Minerals (USA) LLC |
| 7 |
16000-00502-220-04 |
Patented Mineral Properties |
|
Govt. Lot 2 |
LAC Minerals (USA) LLC |
| |
Govt. Lot 4 |
| 8 |
16000-00502-220-10 |
Patented Mineral Properties |
|
Govt. Lot 5 |
LAC Minerals (USA) LLC |
| 9 |
16000-00502-230-00 |
Patented Mineral Properties |
|
Govt. Lot 9 |
LAC Minerals (USA) LLC |
| |
Govt. Lot 10 |
| 10 |
16000-00502-230-01 |
Patented Mineral Properties |
|
Govt. Lot 1 |
Homestake Mining Company of California |
| |
Govt. Lot 2 |
| |
Govt. Lot 3 |
| |
Govt. Lot 4 |
| |
Govt. Lot 5 |
| |
Govt. Lot 6 |
| |
Govt. Lot 7 |
| |
Govt. Lot 8 |
| 11 |
16000-00502-240-12 |
Patented Mineral Properties |
|
Govt. Lot 12 |
Homestake Mining Company of California |
| |
Govt. Lot 13 |
| |
Govt. Lot 14 |
| 12 |
26280-00348-000-00 |
Minerals Only |
348 |
Old Reliable |
Homestake Mining Company of California |
| 13 |
26280-00407-000-00 |
Patented Mineral Properties |
407 |
Enterprise |
LAC Minerals (USA) LLC |
| 14 |
26280-00408-000-10 |
Patented Mineral Properties |
408 |
Surprise |
LAC Minerals (USA) LLC |
| 15 |
26280-00417-000-00 |
Patented Mineral Properties |
417 |
Carbonate |
LAC Minerals (USA) LLC |
| 16 |
26280-00425-000-00 |
Patented Mineral Properties |
425 |
Jay Gould |
LAC Minerals (USA) LLC |
| 17 |
26280-00426-000-00 |
Patented Mineral Properties |
426 |
Garfield |
LAC Minerals (USA) LLC |
| 18 |
26280-00428-000-00 |
Patented Mineral Properties |
428 |
Far West |
LAC Minerals (USA) LLC |
| 19 |
26280-00437-000-00 |
Patented Mineral Properties |
437 |
Katie |
LAC Minerals (USA) LLC |
| 20 |
26280-00438-000-00 |
Patented Mineral Properties |
438 |
Arthur |
LAC Minerals (USA) LLC |
| 21 |
26280-00440-000-00 |
Patented Mineral Properties |
440 |
Hartshorn |
LAC Minerals (USA) LLC |
| 22 |
26280-00441-000-00 |
Patented Mineral Properties |
441 |
Minnie |
LAC Minerals (USA) LLC |
| 23 |
26280-00442-000-00 |
Patented Mineral Properties |
442A |
Ultimo |
LAC Minerals (USA) LLC |
| 24 |
26280-00443-000-00 |
Patented Mineral Properties |
443 |
Tidiout |
LAC Minerals (USA) LLC |
| 25 |
26280-00447-000-00 |
Patented Mineral Properties |
447A |
Utica |
LAC Minerals (USA) LLC |
| 26 |
26280-00448-000-00 |
Patented Mineral Properties |
448A |
Antietam |
LAC Minerals (USA) LLC |
| 27 |
26280-00449-000-10 |
Patented Mineral Properties |
449 |
Blue Bird |
LAC Minerals (USA) LLC |
| 28 |
26280-00450-000-00 |
Patented Mineral Properties |
450 |
Carbonate Fraction #1 |
LAC Minerals (USA) LLC |
| 29 |
26280-00451-000-00 |
Patented Mineral Properties |
451 |
Carbonate Fraction #2 |
LAC Minerals (USA) LLC |
| 30 |
26280-00465-000-00 |
Patented Mineral Properties |
465 |
Mutual |
LAC Minerals (USA) LLC |
| | M3-PN240322
3 February 2025
Revision 0 |
17 |
Dakota
Gold
Technical
Report
Map
ID |
County Tax Parcel ID |
Mineral Property Type |
Mineral
Survey # |
Patented Lode or
Government Lot |
Property Owner |
| 31 |
26280-00466-000-00 |
Patented Mineral Properties |
466 |
Washington |
LAC Minerals (USA) LLC |
| 32 |
26280-00473-000-00 |
Patented Mineral Properties |
473 |
May Queen |
LAC Minerals (USA) LLC |
| 33 |
26280-00474-000-00 |
Patented Mineral Properties |
474 |
Hercules |
LAC Minerals (USA) LLC |
| 34 |
26280-00489-000-00 |
Patented Mineral Properties |
489 |
Adelphi |
LAC Minerals (USA) LLC |
| 35 |
26280-00675-000-00 |
Minerals Only |
675 |
General Grant |
Homestake Mining Company of California |
| 36 |
26280-00679-000-00 |
Patented Mineral Properties |
679 |
Spanish |
LAC Minerals (USA) LLC |
| 37 |
26280-00680-000-00 |
Patented Mineral Properties |
680 |
Richmond |
LAC Minerals (USA) LLC |
| 38 |
26340-00839-000-00 |
Minerals Only |
839 |
Boss |
Homestake Mining Company of California |
| 39 |
26340-00874-000-00 |
Patented Mineral Properties |
874 |
Brooklyn |
LAC Minerals (USA) LLC |
| 40 |
26340-00930-000-00 |
Minerals Only |
930 |
Big Sam |
Homestake Mining Company of California |
| 930 |
Francis |
| 930 |
Marseillase |
| 930 |
Minnie |
| 930 |
Ruby Hill |
| 930 |
Glenwood |
| 41 |
26340-00935-000-20 |
Minerals Only |
935 |
South Lyon |
Homestake
Mining Company of California;
Parcel # 26340-00935-000-20 excludes Gov’t Lot 5. |
| 44 |
26342-00935-010-00 |
| 45 |
26342-00935-020-00 |
| 42 |
26340-00977-000-00 |
Patented Mineral Properties |
977 |
J.M. |
LAC Minerals (USA) LLC |
| 977 |
Todd |
| 977 |
Earle |
| 977 |
Minnie C |
| 977 |
Lyda B |
| 977 |
Sister |
| 977 |
Arthur L |
| 977 |
Cass |
| 977 |
Newell |
| 977 |
Calvin P |
| 977 |
Emma |
| 977 |
Virginia |
| 977 |
Juliett |
| 977 |
Donald W |
| 977 |
Helen |
| 977 |
Atwood |
| 977 |
Little Bonanze |
| 977 |
Ella |
| 977 |
Ralph K |
| | M3-PN240322
3 February 2025
Revision 0 |
18 |
Dakota
Gold
Technical
Report
Map
ID |
County Tax Parcel ID |
Mineral Property Type |
Mineral
Survey # |
Patented Lode or
Government Lot |
Property Owner |
| 43 |
26340-01022-000-00 |
Patented Mineral Properties |
1022 |
Chloride Fr. |
LAC Minerals (USA) LLC |
| 1022 |
Calkins |
| 1022 |
Logan |
| 1022 |
Anis |
| 46 |
26380-01043-000-00 |
Patented Mineral Properties |
1043 |
Rattler |
LAC Minerals (USA) LLC |
| 1043 |
Gilroy |
| 47 |
26380-01092-000-00 |
Minerals Only |
1092 |
Dakota |
Homestake Mining Company of California & Willis Aye |
| 1092 |
Granite |
| 1092 |
Columbia |
| 1092 |
Union |
| 48 |
26380-01109-000-00 |
Minerals Only |
1109 |
Argenta |
Homestake Mining Company of California |
| 1109 |
Oro |
| 1109 |
Oro Fraction |
| 49 |
26380-01109-000-05 |
Minerals Only |
1109 |
Glyn |
Homestake Mining Company of California |
| 50 |
26380-01109-000-10 |
Minerals Only |
1109 |
Lemans |
Homestake Mining Company of California |
| 51 |
26380-01114-000-00 |
Minerals Only |
1114 |
West Wedge Fraction |
Homestake Mining Company of California |
| 1114 |
West End |
| 1114 |
Jackson |
| 1114 |
Moonlight |
| 1114 |
Sunrise |
| 1114 |
Sunset Fraction |
| 1114 |
Lizzie |
| 52 |
26420-01141-000-20 |
Minerals Only |
1141 |
Camden |
Homestake Mining Company of California |
| 1141 |
Ford |
| 1141 |
Georgia |
| 53 |
26460-01168-000-00 |
Patented Mineral Properties |
1168 |
Blue |
Homestake Mining Company of California & Dakota Gold Corp. (DTRC LLC) Surface |
| 1168 |
Rocklyn |
| 54 |
26540-01247-000-00 |
Minerals Only |
1247 |
White House |
Homestake Mining Company of California |
| 1247 |
Congress |
| 1247 |
China Fraction |
| 1247 |
Japan Fraction |
| 55 |
26540-01278-000-00 |
Patented Mineral Properties |
1278 |
Nanki-Poo |
LAC Minerals (USA) LLC |
| 1278 |
Dalaunay |
| 56 |
26540-01283-000-10 |
Minerals Only |
1283 |
May |
Homestake Mining Company of California |
| 57 |
26540-01283-000-20 |
Minerals Only |
1283 |
Deadwood |
Homestake Mining Company of California |
| 58 |
26540-01283-000-30 |
Minerals Only |
1283 |
Buffalo |
Homestake Mining Company of California |
| 1283 |
Link Fraction |
| 59 |
26540-01288-000-10 |
Minerals Only |
1288 |
Longpoint Fraction |
Homestake Mining Company of California |
| 60 |
26540-01288-000-20 |
Minerals Only |
1288 |
Cardinal |
Homestake Mining Company of California |
| 61 |
26540-01289-000-05 |
Minerals Only |
1289 |
Ames |
Homestake Mining Company of California |
| 1289 |
Ames Fraction |
| 62 |
26540-01289-000-10 |
Minerals Only |
1289 |
Cloud |
Homestake Mining Company of California |
| 1289 |
Dick |
| 1289 |
Lightning |
| 1289 |
Thunder |
| 63 |
26540-01289-000-15 |
Minerals Only |
1289 |
Ester |
Homestake Mining Company of California |
| 64 |
26580-01349-000-00 |
Minerals Only |
1349 |
James G. Blaine |
Homestake Mining Company of California |
| 65 |
26580-01376-000-88 |
Patented Mineral Properties |
1376 |
Tract PR2 |
LAC Minerals (USA) LLC |
| | M3-PN240322
3 February 2025
Revision 0 |
19 |
Dakota
Gold
Technical
Report
Map
ID |
County Tax Parcel ID |
Mineral Property Type |
Mineral
Survey # |
Patented Lode or
Government Lot |
Property Owner |
| 66 |
26580-01376-000-90 |
Patented Mineral Properties |
1376 |
Aliance |
LAC Minerals (USA) LLC |
| 1376 |
Sucker |
| 1376 |
Little Ellen |
| 1376 |
Black Bird |
| 1376 |
Golden Eagle No. 2 |
| 1376 |
Rubicon |
| 1376 |
Rubicon No. 2 |
| 1376 |
Rubicon No. 4 |
| 1376 |
Dakota |
| 1376 |
Darboy |
| 1376 |
Havana No. 1 |
| 1376 |
Havana No. 3 |
| 67 |
26580-01382-000-00 |
Leased Mineral Rights |
1382 |
Rubicon |
PETERSON, JAMES E |
| 1382 |
Cleveland |
| 1382 |
Lizzie Johnson |
| 1382 |
Standard |
| 68 |
26580-01382-000-10 |
Leased Mineral Rights |
1382 |
Grayback |
PETERSON, JAMES E |
| 69 |
26580-01398-000-00 |
Patented Mineral Properties |
1398 |
Independent |
LAC Minerals (USA) LLC |
| 1398 |
Independent No. 1 |
| 1398 |
Republik |
| 70 |
26620-01406-000-00 |
Patented Mineral Properties |
1406 |
Yankee Boy |
Homestake Mining Company of California |
| 1406 |
Yankee Boy No. 3 |
| 1406 |
Yankee Boy No. 4 |
| 1406 |
Alliance No 2 |
| 1406 |
Little Bonanza No. 2 |
| 1406 |
Magna Charta |
| 1406 |
General Joe Hooker |
| 71 |
26620-01406-000-10 |
Minerals Only |
1406 |
Arthur No. 1 |
Homestake Mining Company of California |
| 1406 |
Little Hill |
| 1406 |
Little Hill No. 2 |
| 72 |
26620-01436-000-00 |
Patented Mineral Properties |
1436 |
Joplin No. 1 |
LAC Minerals (USA) LLC |
| 1436 |
Joplin No. 2 |
| 1436 |
Joplin No. 3 |
| 1436 |
Julia-Etta |
| 1436 |
Magnetic |
| 73 |
26620-01440-000-00 |
Patented Mineral Properties |
1440 |
Crest |
LAC Minerals (USA) LLC |
| 1440 |
Samoa |
| 1440 |
Co-moa |
| 1440 |
Sylvanite No. 1 |
| 1440 |
Sylvanite No. 2 |
| 1440 |
Grove |
| 1440 |
Volt |
| 1440 |
Seven-B |
| 1440 |
Storm King |
| 1440 |
Vigor |
| 74 |
26620-01468-000-00 |
Minerals Only |
1468 |
Loyd |
Homestake Mining Company of California |
| 75 |
26620-01469-000-00 |
Patented Mineral Properties |
1469 |
Cashier |
LAC Minerals (USA) LLC |
| 1469 |
LaPlata |
| | M3-PN240322
3 February 2025
Revision 0 |
20 |
Dakota
Gold
Technical
Report
Map
ID |
County Tax Parcel ID |
Mineral Property Type |
Mineral
Survey # |
Patented Lode or
Government Lot |
Property Owner |
| 76 |
26620-01529-000-00 |
Patented Mineral Properties |
1529 |
Maryland |
LAC Minerals (USA) LLC |
| 1529 |
Baltimore |
| 1529 |
Maverick |
| 1529 |
Badger |
| 1529 |
North Side Fraction |
| 77 |
26680-01569-000-00 |
Patented Mineral Properties |
1569 |
Lola |
LAC Minerals (USA) LLC |
| 78 |
26680-01616-000-60 |
Minerals Only |
1616 |
Genessee |
Homestake Mining Company of California |
| 1616 |
Grenada |
| 1616 |
Peerless |
| 79 |
26680-01616-000-70 |
Minerals Only |
1616 |
Trenton |
Homestake Mining Company of California |
| 80 |
26680-01617-000-00 |
Patented Mineral Properties |
1617 |
Los Angeles No. 1 |
Homestake Mining Company of California |
| 1617 |
Los Angeles No. 2 |
| 1617 |
Los Angeles No. 3 |
| 81 |
26680-01643-000-00 |
Minerals Only |
1643 |
Snorter |
Homestake Mining Company of California |
| 1643 |
Snorter Fraction |
| 82 |
26680-01655-000-10 |
Patented Mineral Properties |
1655 |
Zelpha Mable |
LAC Minerals (USA) LLC |
| 1655 |
Josephine |
| 1655 |
St. Cloud No. 1 |
| 1655 |
St. Cloud No. 3 |
| 1655 |
Comstock |
| 1655 |
Victor Fraction #3 |
| 1655 |
Grand Deposit No. 2 |
| 1655 |
Tartar |
| 1655 |
Red Cloud |
| 1655 |
Red Cloud Frac. |
| 1655 |
Valley Frac. |
| 83 |
26680-01655-000-20 |
Patented Mineral Properties |
1655 |
St. Cloud No. 5 |
LAC Minerals (USA) LLC |
| 84 |
26680-01659-000-20 |
Minerals Only |
1659 |
Maid of Erin |
Homestake Mining Company of California |
| 1659 |
Telegram |
| 1659 |
Gannon |
| 1659 |
B&M Fraction |
| 85 |
26680-01673-000-00 |
Patented Mineral Properties |
1673 |
Belligerent |
Homestake Mining Company of California & Dakota Gold Corp. (DTRC LLC) Surface |
| 1673 |
Belligerent Fraction |
| 1673 |
Belligerent No. 3 |
| 1673 |
Belligerent No. 4 |
| 1673 |
Bull Hill |
| 86 |
26760-01769-000-00 |
Patented Mineral Properties |
1769 |
Edmonia |
LAC Minerals (USA) LLC |
| 87 |
26760-01792-000-00 |
Minerals Only |
1792 |
Marconi |
Homestake Mining Company of California |
| 88 |
26760-01822-000-00 |
Minerals Only |
1822 |
Bessie |
Homestake Mining Company of California |
| 1822 |
Cross No. 1 |
| 1822 |
Dixie |
| 1822 |
Geneva |
| 1822 |
Hattie |
| 1822 |
Tan |
| 89 |
26760-01829-000-10 |
Patented Mineral Properties |
1829 |
Tract 1 |
Homestake Mining Company of California |
| 90 |
26760-01851-000-00 |
Patented Mineral Properties |
1851 |
Mars No. 1 |
LAC Minerals (USA) LLC |
| 91 |
26760-01862-000-00 |
Patented Mineral Properties |
1862 |
Stella No. 3 |
Homestake Mining Company of California |
| 1862 |
Stella No. 5 |
| 1862 |
Margarite No. 6 |
| 1862 |
Margarite No. 7 |
| 92 |
26760-01872-000-00 |
Patented Mineral Properties |
1872 |
Legal Tender |
LAC Minerals (USA) LLC |
| 1872 |
Diamond Point |
| 1872 |
Joe Craig |
| 1872 |
Gremmel No. 1 |
| 1872 |
Cotton Tail Frac. |
| | M3-PN240322
3 February 2025
Revision 0 |
21 |
Dakota
Gold
Technical
Report
Map
ID |
County Tax Parcel ID |
Mineral Property Type |
Mineral
Survey # |
Patented Lode or
Government Lot |
Property Owner |
| 93 |
26800-01910-000-00 |
Patented Mineral Properties |
1910 |
Dante |
LAC Minerals (USA) LLC |
| 1910 |
Creston |
| 1910 |
Morning Glory |
| 1910 |
Vindicator |
| 94 |
26880-02033-000-00 |
Patented Mineral Properties |
2033 |
Bison |
LAC Minerals (USA) LLC |
| 2033 |
Trent |
| 95 |
N/A |
Unpatented Mining Lodes |
N/A |
L&O No. 1 |
St. Joe Minerals |
| 96 |
N/A |
Unpatented Mining Lodes |
N/A |
NJB 7 |
Bond Gold Richmond |
| 97 |
26620-01401-000-00 |
Patented Mineral Properties |
1401 |
Mammouth |
Dakota Gold Corp. (DTRC LLC) |
| 98 |
26680-01709-000-20 |
Patented Mineral Properties |
1709 |
Dague #1 |
Dakota Gold Corp. (DTRC LLC) |
| |
|
|
|
Dague #2 |
|
| 99 |
26760-01862-000-10 |
Patented Mineral Properties |
1862 |
Stella |
Dakota Gold Corp. (DTRC LLC) |
| |
|
|
|
Stella #1 |
|
| |
|
|
|
Stella #2 |
|
| |
|
|
|
Stella #4 |
|
| |
|
|
|
Stella #6 |
|
| |
|
|
|
Stella #7 |
|
| |
|
|
|
Margarite |
|
| |
|
|
|
Margarite #1 |
|
| |
|
|
|
Margarite #2 |
|
| |
|
|
|
Margarite #3 |
|
| |
|
|
|
Margarite $4 |
|
| |
|
|
|
Margarite #5 |
|
| |
|
|
|
Margarite #8 |
|
Notes: DGC = Dakota Gold Corp.; LAC = Homestake;
as of early October 2023, LAC Minerals (USA) LLC and Homestake merged, and the Option property interests are now owned or controlled
entirely by Homestake.
| 3.4 | Richmond Hill Option Agreement |
On October 14, 2021, Dakota Territory Resource
Corp. (DTRC) (now Dakota Gold) entered into an Option agreement with Barrick to acquire the Richmond Hill Gold Project jointly held in
the names of Barrick’s wholly owned subsidiaries, LAC and Homestake. Under the terms of the Option agreement, Dakota Gold was provided
a three-year option to acquire the surface and mineral rights with attendant facilities comprising the Richmond Hill Project.
On signing, Dakota Gold issued 400,000 shares
to Barrick and agreed to make three $100,000 payments (all paid) during the Option period. The Option could be exercised at any time before
September 7, 2024, by assuming all the liabilities and bonds currently held by LAC and Homestake for the Richmond Hill Gold Project.
In addition, upon exercise of the Option, Dakota Gold would issue Barrick an additional 400,000 shares and grant Barrick a 1% net smelter
return (NSR) concerning any gold recovered from the Project.
On September 8, 2022, Dakota Gold announced
an amendment to the original Richmond Hill Option agreement whereby the Option period was extended by 18 months to March 7, 2026.
In addition, more than 560 acres of 100% mineral rights owned by Homestake were added to the properties subject to the Option, and Dakota
Gold issued an additional 180,000 shares to Barrick. All other terms and obligations under the original Option agreement remained unchanged.
The Option was again amended on February 3, 2025, extending the Option period until December 31, 2028, in return for Dakota
Gold agreeing to make three annual payments of $170,000, with the first of these due on March 1, 2026.
| | M3-PN240322
3 February 2025
Revision 0 |
22 |
Dakota
Gold
Technical
Report
The current Richmond Hill Option agreement (as
amended) is summarized as follows:
| · | Option to purchase all of the mineral rights, surface rights, attendant facilities,
and patented properties owned by Homestake or Lac in the Project area. |
| · | Issue an aggregate of 980,000 Dakota Gold shares to Barrick through a combination
of shares issued at signing and upon exercise of the Option (580,000 shares have been issued to date). |
| · | Assume all property liabilities and bonds upon exercise of Option. |
| · | Issue a 1% NSR upon executing the Option to Barrick from any gold production
from the Option property. |
| · | Three annual payments of $100,000 have been paid previously. Dakota Gold
will make three additional annual payments $170,000 to Barrick beginning on March 1, 2026. |
| · | Unless further extended, the Option period extends until December 31,
2028. |
Dakota Gold was current with all Option agreement
terms and conditions as of the Report date.
The Option agreement included surface rights to
many of the properties included in the Project area. Table 3-1 details parcels that include mineral rights, surface rights, or both. Pursuant
to SDCL 45-5-1, surface rights are subservient to the development of mineral rights.
Dakota Gold does not own any water rights in the
Project area. Water for exploration drilling programs has been sourced locally and either pumped or trucked to the drills. One of three
wells that supplied water to the Richmond Hill mine is still active, and Homestake maintains the water right.
In addition to the 1% NSR that Dakota Gold must
grant to Barrick, several claims have underlying royalties. Table 3-2 lists the claims and any extra royalties payable to underlying claim
owners. Figure 3-2 identifies claims with underlying royalties.
The document numbers for deeds, warranty deeds,
agreements, and others refer to documents recorded at the Lawrence County Court House in Deadwood, South Dakota. The following information
regarding royalties is extracted from these public documents (Dakota Gold, pers. Comm.):
Aye/Gali Royalty
The original Aye/Gali royalty is defined
in Warranty Deed, 82-05846, dated June 2, 1976, between Iwalana L. Gali (Grantor, formally Aye, a married woman) and Homestake Mining
(Grantee). The 5% Gross Royalty on all minerals produced is calculated less sales, severance and other similar taxes, charges for transportation
from mine to treatment, smelting and/or refining, as well as cost for treatment, smelting and/or refining. In the event royalties are
paid, the aggregate paid to the Grantor shall not exceed the sum of $200.00 per acre times the total number of acres conveyed by the Grantor
to the Grantee. Dakota Gold calculated a total 416.8 acres are under the Aye (Gali) royalty agreement in 8 land parcels. At $200.00 cap
per acre, that would mean the maximum royalty would be $83,360.00 if all parcels were impacted.
| | M3-PN240322
3 February 2025
Revision 0 |
23 |
Dakota
Gold
Technical
Report
Bohlen/Hoffman Royalty
The Bohlen/Hoffman royalty is defined
in a Grant, Bargain and Sale Deed, 2014-01458, dated April 11, 2014, between Sharlene J. Hoffman and Earl D. and Helen L. Bohlen
(Grantor) and Homestake Mining (Grantee). The 4% Net Smelter Returns Royalty on all minerals produced is calculated less refining and
delivery costs and taxes but does not allow for deduction of costs related to trading activities or mining, milling, leaching, or any
other on-site processing costs.
Fillmore Royalty
The Fillmore royalty is defined in
a Mining Deed, 84-01176, dated May 24, 1968, between Fillmore and Company, Inc, W. O. and Lillian G. Filmore (Grantor) and Congo
Uranium Company (Grantee). The Filmore Royalty is a 5% Net Smelter Returns Royalty on all minerals produced. Under earlier agreements,
the royalty was initially established at 10% but was bought down to 5% in 1974.
Peterson Royalty
The Peterson royalty is defined in
a First Amendment to Lease Agreement, dated November 15, 1984, between James E. and Arlene Peterson (Grantor) and St. Joe American
Corporation (Grantee). The 5% Net Smelter Returns Royalty on all minerals produced is due within 30 days of each calendar quarter end,
and is calculated less any weighing, sampling, penalty, processing, or other charges assessed by purchaser, selling charges, any sales,
severance, gross production, privilege or similar taxes assessed or in connection with the ore measured by the value thereof, and less
cost of transportation. The cost of leaching or other solution techniques shall be also deducted from the selling price.
Whitehouse Royalty
The Whitehouse royalties are defined
by two agreements, Mining Deed, 76-01230, dated June 1, 1976, and Warranty Deed, 76-01231, dated June 1, 1976, between White
House Congress, Inc. (Grantor) and Homestake Mining (Grantee). The 5% Gross Royalty on all minerals produced is calculated less sales,
severance and other similar taxes, charges for transportation from mine to treatment, smelting and/or refining, as well as cost for treatment,
smelting and/or refining. In the event royalties are paid, the aggregate paid to the Grantor shall not exceed the sum of $200 per acre
times the total number of acres conveyed by the Grantor to the Grantee. The property subject to the Whitehouse Royalty currently sits
outside of the resource evaluated in this Initial Assessment. The claims under the Whitehouse Royalty are scattered and mostly not contiguous.
There are approximately 27 parcels for a total of 486.26 acres at $200 cap per acre, the maximum royalty would be $97,252 if all parcels
were impacted.
Orion Future Royalty
Upon the exercise of the Richmond Hill
Option, a 1% NSR Royalty shall come into effect in favor of OMF Fund IV SPV A LLC, a Delaware limited liability company, for the lode
claims in Mineral Surveys 1406 and 1822 (Chism Gulch).
| | M3-PN240322
3 February 2025
Revision 0 |
24 |
Dakota
Gold
Technical
Report
Table 3-2: Richmond Hill Project Parcels with
Holding Costs and Royalties
Map
ID |
County
Parcel ID Number |
Mineral
Property Type |
Legal
Description |
Property
Owner |
Annual
Property Maintenance |
2024
Taxes Paid |
Other
Cost |
First
Royalty Owner |
Royalty
% |
Second
Royalty Owner |
Royalty
% |
Third
Royalty Owner |
Royalty
% |
Royalty
% Total |
Comments |
| 1 |
16000-00502-110-10 |
Patented
Mineral Properties |
Lot
10 11-005-02 |
Homestake
Mining Company of
California |
Annual
Lawrence Co. property tax |
$12.68
|
|
HMC |
1 |
|
|
|
|
1 |
|
| 2 |
16000-00502-130-12 |
Patented
Mineral Properties |
Lot
12 13-005-02 |
Homestake
Mining
Company of California |
Annual
Lawrence Co. property tax |
$2.34
|
|
HMC |
1 |
|
|
|
|
1 |
|
| 3 |
16000-00502-140-02 |
Patented
Mineral Properties |
Lots
2, 3, 4, 7, 8, 9 &
10 14-005-02 |
Homestake
Mining Company of
California |
Annual
Lawrence Co. property tax |
$165.12
|
|
HMC |
1 |
|
|
|
|
1 |
|
| 4 |
16000-00502-150-00 |
Patented
Mineral
Properties
|
Govt
Lots 3, 9, 10,
12 & 13 15-005-02 |
LAC
Minerals
(USA) LLC |
Annual
Lawrence Co.
property tax |
$23.48
|
|
HMC |
1 |
|
|
|
|
1 |
|
| 5 |
16000-00502-150-10 |
Patented Mineral Properties
|
Tracts
0102-A & 0102-B of NE1/4,
Tract 0103-B of NW1/4 &
Tract 103A of NW1/4 15- |
LAC
Minerals (USA) LLC |
Annual
Lawrence Co. property tax |
$11.40
|
|
HMC |
1 |
|
|
|
|
1 |
|
| 6 |
16000-00502-220-01 |
Patented
Mineral
Properties
|
Govt
Lot 1 22-005-
02 |
LAC
Minerals
(USA) LLC |
Annual
Lawrence Co.
property tax |
$4.42
|
|
HMC |
1 |
|
|
|
|
|
|
| 7 |
16000-00502-220-04 |
Patented
Mineral
Properties
|
Govt
Lots 2 & 4 22-
005-02 |
LAC
Minerals
(USA) LLC |
Annual
Lawrence Co.
property tax |
$29.22
|
|
HMC |
1 |
|
|
|
|
1 |
|
| 8 |
16000-00502-220-10 |
Patented
Mineral
Properties
|
Govt
Lot 5 22-005-
02 |
LAC
Minerals
(USA) LLC |
Annual
Lawrence Co.
property tax |
$20.34
|
|
HMC |
1 |
|
|
|
|
1 |
|
| 9 |
16000-00502-230-00 |
Patented
Mineral
Properties
|
Govt
Lots 9 & 10
23-005-02 |
LAC
Minerals
(USA) LLC |
Annual
Lawrence Co.
property tax |
$0.48
|
|
HMC |
1 |
|
|
|
|
1 |
|
| 10 |
16000-00502-230-01 |
Patented
Mineral Properties |
Lots
1, 2, 3, 4, 5, 6,
7 & 8 23-005-02 |
Homestake
Mining
Company of California |
Annual
Lawrence Co. property tax |
$153.06 |
|
HMC |
1 |
|
|
|
|
1 |
|
| 11 |
16000-00502-240-12 |
Patented
Mineral Properties |
Lots
12, 13 & 14 24-
005-02 |
Homestake
Mining Company of
California |
Annual
Lawrence Co. property tax |
$23.94
|
|
HMC |
1 |
|
|
|
|
1 |
|
| 12 |
26280-00348-000-00 |
Minerals
Only |
M.S.
348 Old
Reliable Lode 14-
005-02 |
Homestake
Mining Company of
California |
|
|
|
HMC |
1 |
Aye/Gali |
5 |
|
|
6 |
Capped
Royalty |
| 13 |
26280-00407-000-00 |
Patented
Mineral
Properties |
M.S.
407 Enterprise
Lode 10-005-02 |
LAC
Minerals
(USA) LLC |
Annual
Lawrence Co.
property tax |
$8.04
|
|
HMC |
1 |
Fillmore
|
5 |
|
|
6 |
Subject
to potential reversion of property
if not used for mining
purposes |
| 14 |
26280-00408-000-10 |
Patented
Mineral
Properties |
M.S.
408 pt Surprise
Lode 10-005-02 |
LAC
Minerals
(USA) LLC |
Annual
Lawrence Co.
property tax |
$12.46
|
|
HMC |
1 |
Fillmore
|
5 |
|
|
6 |
Subject
to potential reversion of property
if not used for mining
purposes |
| 15 |
26280-00417-000-00 |
Patented
Mineral
Properties |
M.S.
417 Carbonate
Lode 15-005-02 |
LAC
Minerals
(USA) LLC |
Annual
Lawrence Co.
property tax |
$12.22
|
|
HMC |
1 |
Fillmore
|
5 |
|
|
6 |
Subject
to potential reversion of property
if not used for mining
purposes |
| 16 |
26280-00425-000-00 |
Patented
Mineral
Properties |
M.S.
425 Jay Gould
Lode
10-005-02 |
LAC
Minerals
(USA)
LLC |
Annual
Lawrence Co.
property
tax |
$13.48
|
|
HMC |
1 |
Fillmore
|
5 |
|
|
6 |
Subject
to potential reversion of property
if
not used for mining purposes |
| 17 |
26280-00426-000-00 |
Patented
Mineral
Properties |
M.S.
426 Garfield
Lode
10-005-02 |
LAC
Minerals
(USA)
LLC |
Annual
Lawrence Co.
property
tax |
$11.30
|
|
HMC |
1 |
-Fillmore
|
5 |
|
|
6 |
Subject
to potential reversion of property
if
not used for mining purposes |
| 18 |
26280-00428-000-00 |
Patented
Mineral
Properties
|
M.S.
428 Far West
Lode
15-005-02 |
LAC
Minerals
(USA)
LLC |
Annual
Lawrence Co.
property
tax |
$9.36
|
|
HMC |
1 |
|
|
|
|
1 |
|
| 19 |
26280-00437-000-00 |
Patented
Mineral
Properties |
M.S.
437 Katie Lode
10-005-02 |
LAC
Minerals
(USA)
LLC |
Annual
Lawrence Co.
property
tax |
$13.08
|
|
HMC |
1 |
Fillmore
|
5 |
|
|
6 |
Subject
to potential reversion of property
if
not used for mining purposes |
| 20 |
26280-00438-000-00 |
Patented
Mineral
Properties |
M.S.
438 Arthur
Lode
10-005-02 |
LAC
Minerals
(USA)
LLC |
Annual
Lawrence Co.
property
tax |
$13.08
|
|
HMC |
1 |
Fillmore
|
5 |
|
|
6 |
Subject
to potential reversion of property
if
not used for mining purposes |
| 21 |
26280-00440-000-00 |
Patented
Mineral
Properties |
M.S.
440 Hartshorn
Lode
09-005-02 |
LAC
Minerals
(USA)
LLC |
Annual
Lawrence Co.
property
tax |
$11.20
|
|
HMC |
1 |
Fillmore
|
5 |
|
|
6 |
Subject
to potential reversion of property
if
not used for mining purposes |
| | M3-PN240322
3 February 2025
Revision 0 |
25 |
Dakota
Gold
Technical
Report
Map
ID |
County
Parcel ID Number |
Mineral
Property Type |
Legal
Description |
Property
Owner |
Annual
Property Maintenance |
2024
Taxes Paid |
Other
Cost |
First
Royalty Owner |
Royalty
% |
Second
Royalty Owner |
Royalty
% |
Third
Royalty Owner |
Royalty
% |
Royalty
% Total |
Comments |
| 22 |
26280-00441-000-00 |
Patented
Mineral
Properties |
M.S.
441 Minnie
Lode
15-005-02 |
LAC
Minerals
(USA)
LLC |
Annual
Lawrence Co.
property
tax |
$9.36
|
|
HMC |
1 |
Fillmore
|
5 |
|
|
6 |
Subject
to potential reversion of property
if
not used for mining purposes |
| 23 |
26280-00442-000-00 |
Patented
Mineral
Properties |
M.S.
442ª Ultimo
Lode
15-005-02 |
LAC
Minerals
(USA)
LLC |
Annual
Lawrence Co.
property
tax |
$13.38
|
|
HMC |
1 |
Fillmore
|
5 |
|
|
6 |
Subject
to potential reversion of property
if
not used for mining purposes |
| 24 |
26280-00443-000-00 |
Patented
Mineral
Properties |
M.S.
443 Tidiout
Lode
15-005-02 |
LAC
Minerals
(USA)
LLC |
Annual
Lawrence Co.
property
tax |
$12.58
|
|
HMC |
1 |
Fillmore
|
5 |
|
|
6 |
Subject
to potential reversion of property
if
not used for mining purposes |
| 25 |
26280-00447-000-00 |
Patented
Mineral
Properties |
M.S.
447ª Utica
Lode
15-005-02 |
LAC
Minerals
(USA)
LLC |
Annual
Lawrence Co.
property
tax |
$14.60
|
|
HMC |
1 |
Fillmore
|
5 |
|
|
6 |
Subject
to potential reversion of property
if
not used for mining purposes |
| 26 |
26280-00448-000-00 |
Patented
Mineral
Properties |
M.S.
448A Antietam
Lode
15-005-02 |
LAC
Minerals
(USA)
LLC |
Annual
Lawrence Co.
property
tax |
$14.32
|
|
HMC |
1 |
Fillmore
|
5 |
|
|
6 |
Subject
to potential reversion of property
if
not used for mining purposes |
| 27 |
26280-00449-000-10 |
Patented
Mineral
Properties |
M.S.
449 Blue Bird
Lode
15-005-02 |
LAC
Minerals
(USA)
LLC |
Annual
Lawrence Co.
property
tax |
$2.62
|
|
HMC |
1 |
Fillmore
|
5 |
|
|
6 |
Subject
to potential reversion of property
if
not used for mining purposes |
| 28 |
26280-00450-000-00 |
Patented
Mineral Properties |
M.S.
450 Carbonate
Fraction #1 Lode 15-
005-02 |
LAC
Minerals (USA) LLC |
Annual
Lawrence Co. property tax |
$2.12
|
|
HMC |
1 |
Fillmore
|
5 |
|
|
6 |
Subject
to potential reversion of property if not used for mining purposes |
| 29 |
26280-00451-000-00 |
Patented
Mineral Properties |
M.S.
451 Carbonate
Fraction #2 Lode 15-
005-02 |
LAC
Minerals (USA) LLC |
Annual
Lawrence Co. property tax |
$0.60
|
|
HMC |
1 |
Fillmore
|
5 |
|
|
6 |
Subject
to potential reversion of property if not used for mining purposes |
| 30 |
26280-00465-000-00 |
Patented
Mineral
Properties |
M.S.
465 Mutual
Lode
15-005-02 |
LAC
Minerals
(USA)
LLC |
Annual
Lawrence Co.
property
tax |
$10.64
|
|
HMC |
1 |
Fillmore
|
5 |
|
|
6 |
Subject
to potential reversion of property
if
not used for mining purposes |
| 31 |
26280-00466-000-00 |
Patented
Mineral Properties |
M.S.
466
Washington Lode 15-
005-02 |
LAC
Minerals (USA) LLC |
Annual
Lawrence Co. property tax |
$8.90
|
|
HMC |
1 |
Fillmore
|
5 |
|
|
6 |
Subject
to potential reversion of property if not used for mining purposes |
| 32 |
26280-00473-000-00 |
Patented
Mineral Properties |
M.S.
473
May Queen Lode 15-005-02 |
LAC
Minerals (USA) LLC |
Annual
Lawrence Co. property tax |
$6.56
|
|
HMC |
1 |
Fillmore
|
5 |
|
|
6 |
Subject
to potential reversion of property if not used for mining purposes |
| 33 |
26280-00474-000-00 |
Patented
Mineral
Properties |
M.S.
474 Hercules
Lode
15-005-02 |
LAC
Minerals
(USA)
LLC |
Annual
Lawrence Co.
property
tax |
$4.14
|
|
HMC |
1 |
Fillmore
|
5 |
|
|
6 |
Subject
to potential reversion of property
if
not used for mining purposes |
| 34 |
26280-00489-000-00 |
Patented
Mineral
Properties |
M.S.
489 Adelphi
Lode
15-005-02 |
LAC
Minerals
(USA)
LLC |
Annual
Lawrence Co.
property
tax |
$13.96
|
|
HMC |
1 |
Fillmore
|
5 |
|
|
6 |
Subject
to potential reversion of property
if
not used for mining purposes |
| 35 |
26280-00675-000-00 |
Minerals
Only |
M.S.
675 General
Grant Lode 01-004-
02 |
Homestake
Mining
Company
of California |
|
|
|
HMC |
1 |
Whitehouse |
5 |
|
|
6 |
Capped
Royalty |
| 36 |
26280-00679-000-00 |
Patented
Mineral
Properties |
M.S.
679 Spanish
Lode
15-005-02 |
LAC
Minerals
(USA)
LLC |
Annual
Lawrence Co.
property
tax |
$10.86
|
|
HMC |
1 |
Fillmore
|
5 |
|
|
6 |
Subject
to potential reversion of property
if
not used for mining purposes |
| 37 |
26280-00680-000-00 |
Patented
Mineral
Properties |
M.S.
680 Richmond
Lode
15-005-02 |
LAC
Minerals
(USA)
LLC |
Annual
Lawrence Co.
property
tax |
$11.80
|
|
HMC |
1 |
Fillmore
|
5 |
|
|
6 |
Subject
to potential reversion of property if not used for mining purposes |
| 38 |
26340-00839-000-00 |
Minerals
Only |
M.S.
839 Boss Lode 06-004-03 |
Homestake
Mining Company of
California |
|
|
|
HMC |
1 |
|
|
|
|
1 |
|
| 39 |
26340-00874-000-00 |
Patented
Mineral
Properties |
M.S.
874 Brooklyn
Lode
15-005-02 |
LAC
Minerals
(USA)
LLC |
Annual
Lawrence Co.
property
tax |
$11.86
|
|
HMC |
1 |
Fillmore
|
5 |
|
|
6 |
Subject
to potential reversion of property
if
not used for mining purposes |
| | M3-PN240322
3 February 2025
Revision 0 |
26 |
Dakota
Gold
Technical
Report
Map
ID |
County
Parcel ID Number |
Mineral
Property Type |
Legal
Description |
Property
Owner |
Annual
Property Maintenance |
2024
Taxes Paid |
Other
Cost |
First
Royalty Owner |
Royalty
% |
Second
Royalty Owner |
Royalty
% |
Third
Royalty Owner |
Royalty
% |
Royalty
% Total |
Comments |
| 40 |
26340-00930-000-00 |
Minerals
Only |
M.S.
930 Big Sam Lode etc. 07-004-03 |
Homestake
Mining Company of
California |
|
|
|
HMC |
1 |
Whitehouse |
5 |
|
|
6 |
Capped
Royalty |
| 41 |
26340-00935-000-20 |
Minerals
Only |
M.S.
935 Tract 1 pt of South Lyon Lode |
Homestake
Mining Company of
California |
|
|
|
HMC |
1 |
Whitehouse |
5 |
|
|
6 |
Capped
Royalty; Excluding Govt Lot 5 being a part of Tract 1 |
| 42 |
26340-00977-000-00 |
Patented
Mineral Properties |
M.S.
977 Donald W, Ella & Virginia Lodes Etal 22-005-
02 |
LAC
Minerals (USA) LLC |
Annual
Lawrence Co. property tax |
$239.02
|
|
HMC |
1 |
|
|
|
|
1 |
|
| 43 |
26340-01022-000-00 |
Patented Mineral Properties |
M.S.
1022 Chloride
Fraction
Lode Etal 15-005-02 |
LAC
Minerals (USA) LLC |
Annual
Lawrence Co. property tax |
$15.18
|
|
HMC |
1 |
|
|
|
|
1 |
Subject
to potential reversion of property if not used for mining purposes |
| 44 |
26342-00935-010-00 |
Minerals
Only |
M.S.
935 Lost
Irishman
Lot 1 |
Homestake
Mining Company of
California |
|
|
|
HMC |
1 |
Whitehouse |
5 |
|
|
6 |
Capped
Royalty |
| 45 |
26342-00935-020-00 |
Minerals
Only |
M.S.
935 Lost
Irishman
Lot 2 |
Homestake
Mining Company of
California |
|
|
|
HMC |
1 |
Whitehouse |
5 |
|
|
6 |
Capped
Royalty |
| 46 |
26380-01043-000-00 |
Patented
Mineral Properties |
M.S.
1043 Rattler & Gilroy Lodes 15-
005-02 |
LAC
Minerals (USA) LLC |
Annual
Lawrence Co. property tax |
$15.68
|
|
HMC |
1 |
Fillmore
|
5 |
|
|
6 |
Subject
to potential reversion of property if not used for mining purposes |
| 47 |
26380-01092-000-00 |
Minerals
Only |
M.S.
1092 Union
Lode
Etal 14-005-02 |
Homestake
Mining Company of California |
|
|
|
HMC |
1 |
Aye/Gali |
5 |
|
|
6 |
Capped
Royalty |
| 48 |
26380-01109-000-00 |
Minerals
Only |
M.S.
1109 Oro, Oro
Frac. &
Argenta Lodes 12-004-02 |
Homestake
Mining Company of
California |
|
|
|
HMC |
1 |
Whitehouse |
5 |
|
|
6 |
Capped
Royalty |
| 49 |
26380-01109-000-05 |
Minerals
Only |
M.S.
1109 Glyn
Lode 12-004-02 |
Homestake
Mining Company of
California |
|
|
|
HMC |
1 |
Whitehouse |
5 |
|
|
6 |
Capped
Royalty |
| 50 |
26380-01109-000-10 |
Minerals
Only |
M.S.
1109 Lemars
Lode
12-004-02 |
Homestake
Mining Company of
California |
|
|
|
HMC |
1 |
Whitehouse |
5 |
|
|
6 |
Capped
Royalty |
| 51 |
26380-01114-000-00 |
Minerals
Only |
M.S.
1114 Jackson
Lode
etc. 12-004-02 |
Homestake
Mining
Company
of California |
|
|
|
HMC |
1 |
Whitehouse |
5 |
|
|
6 |
Capped
Royalty |
| 52 |
26420-01141-000-20 |
Minerals
Only |
M.S.
1141 Camden, Ford & Georgie, etc |
Homestake
Mining Company of
California |
|
|
|
HMC |
1 |
Whitehouse |
5 |
|
|
6 |
Capped
Royalty |
| 53 |
26460-01168-000-00 |
Patented
Mineral Properties |
M.S.
1168
Rocklyn &
Blue Lodes 34-005-02 |
Homestake
Mining Company of
California |
Annual
Lawrence Co. property tax |
$19.20
|
|
HMC |
1 |
Whitehouse |
5 |
|
|
6 |
Capped
Royalty |
| 54 |
26540-01247-000-00 |
Minerals
Only |
M.S.
1247
Whitehouse &
Congress Lodes Etal 14-005-02 |
Homestake
Mining Company of
California |
|
|
|
HMC |
1 |
Aye/Gali |
5 |
|
|
6 |
Capped
Royalty |
| 55 |
26540-01278-000-00 |
Patented
Mineral Properties |
M.S.
1278
Delaunay & Nanki-
Poo Lodes 15-005-
02 |
LAC
Minerals (USA) LLC |
Annual
Lawrence Co. property tax |
$25.34
|
|
HMC |
1 |
|
|
|
|
1 |
Subject
to potential reversion of property if not used for mining purposes |
| 56 |
26540-01283-000-10 |
Minerals
Only |
M.S.
1283 May Lode 33-005-02 |
Homestake
Mining Company of
California |
|
|
|
HMC |
1 |
Whitehouse |
5 |
|
|
6 |
Capped
Royalty |
| 57 |
26540-01283-000-20 |
Minerals
Only |
M.S.
1283
Deadwood Lode 33-
005-02 |
Homestake
Mining Company of
California |
|
|
|
HMC |
1 |
Whitehouse |
5 |
|
|
6 |
Capped
Royalty |
| 58 |
26540-01283-000-30 |
Minerals
Only |
M.S.
1283 Buffalo & Link Frac. Lodes 33- 005-02 |
Homestake
Mining Company of
California |
|
|
|
HMC |
1 |
Whitehouse |
5 |
|
|
6 |
Capped
Royalty |
| 59 |
26540-01288-000-10 |
Minerals
Only |
M.S.
1288 Long
Point
Frac Lode 35- 005-02 |
Homestake
Mining Company of
California |
|
|
|
HMC |
1 |
Whitehouse |
5 |
|
|
6 |
Capped
Royalty |
| 60 |
26540-01288-000-20 |
Minerals
Only |
M.S.
1288 Cardinal
Lode
35-005-02 |
Homestake
Mining Company of
California |
|
|
|
HMC |
1 |
Whitehouse |
5 |
|
|
6 |
Capped
Royalty |
| | M3-PN240322
3 February 2025
Revision 0 |
27 |
Dakota
Gold
Technical
Report
Map
ID |
County
Parcel ID Number |
Mineral
Property Type |
Legal
Description |
Property
Owner |
Annual
Property Maintenance |
2024
Taxes Paid |
Other
Cost |
First
Royalty Owner |
Royalty
% |
Second
Royalty Owner |
Royalty
% |
Third
Royalty Owner |
Royalty
% |
Royalty
% Total |
Comments |
| 61 |
26540-01289-000-01 |
Minerals
Only |
M.S.
1289 Cloud,
Thunder, Lighting &
Dick Lodes |
Homestake
Mining Company of
California |
|
|
|
HMC |
1 |
Whitehouse |
5 |
|
|
6 |
Capped
Royalty |
| 62 |
26540-01289-000-05 |
Minerals
Only |
M.S.
1289 Ames & Ames Frac. Lodes |
Homestake
Mining Company of
California |
|
|
|
HMC |
1 |
Whitehouse |
5 |
|
|
6 |
Capped
Royalty |
| 63 |
26540-01289-000-15 |
Minerals
Only |
M.S.
1289 Ester
Lode 27-005-02 |
Homestake
Mining Company of
California |
|
|
|
HMC |
1 |
Whitehouse |
5 |
|
|
6 |
Capped
Royalty |
| 64 |
26580-01349-000-00 |
Minerals
Only |
M.S.
1349 James g. Blain Lode 34-005-
02 |
Homestake
Mining Company of
California |
|
|
|
HMC |
1 |
|
|
|
|
1 |
|
| 65 |
26580-01376-000-88 |
Patented
Mineral Properties |
M.S.
1376 Tract PR2 of Porto
Rico
#2 & Porto Rico Lodes 10, 11, 14, & 15- 005-02 |
LAC
Minerals (USA) LLC |
Annual
Lawrence Co. property tax |
$22.28
|
|
HMC |
1 |
|
|
|
|
1 |
|
| 66 |
26580-01376-000-90 |
Patented
Mineral Properties |
M.S.
1376 Darboy, Rubicon & Dakota Lodes Etal 14-005-
02 |
LAC
Minerals (USA) LLC |
Annual
Lawrence Co. property tax |
$5202.04
|
|
HMC |
1 |
Fillmore
|
5 |
|
|
6 |
Subject
to potential reversion of property if not used for mining purposes |
| 67 |
26580-01382-000-00 |
Leased
Mineral Rights |
M.S.
1382
Cleveland &
Rubicon Lodes Etal 23-005-02 |
PETERSON,
JAMES E |
|
$1647.36
|
$4,000.00 |
HMC |
1 |
Peterson |
5 |
|
|
6 |
Lease
Term 10 years (1984)
$4000
annual extended by payment. See comments in parcel #26580-01382-000-10 |
| 68 |
26580-01382-000-10 |
Leased
Mineral Rights |
M.S.
1382 Grayback
Lode
23-005-02 |
PETERSON,
JAMES E |
|
$299.72
|
|
HMC |
1 |
Peterson |
5 |
|
|
6 |
Lease
Term 10 years (1984)
$4000
annual extended by payment. This annual cost is already calculated in parcel #26580-01382-000-00 |
| 69 |
26580-01398-000-00 |
Patented
Mineral Properties |
M.S.
1398
Independent
Lode Etal 15-005-02 |
LAC
Minerals (USA) LLC |
Annual
Lawrence Co. property tax |
$71.00
|
|
HMC |
1 |
Fillmore
|
5 |
|
|
6 |
Subject
to potential reversion of property if not used for mining
purposes |
| 70 |
26620-01406-000-00 |
Patented
Mineral Properties |
M.S.
1406 Yankee Boy, Yankee Boy #3 & #4, Manga
Charta,
Alliance #2, Little Bonanza #2 & General Joe Hooker Lodes 14-005-02 |
Homestake
Mining Company of California |
Annual
Lawrence Co. property tax |
$97.00
|
|
HMC |
1 |
Aye/Gali |
5 |
OMF
Fund |
1 |
7 |
Capped
Royalty |
| 71 |
26620-01406-000-10 |
Minerals
Only |
M.S.
1406 Little Hill, Little Hill #2 & Arthur #1 Lodes 14-
005-02 |
Homestake
Mining Company of
California |
|
|
|
HMC |
1 |
Aye/Gali |
5 |
OMF
Fund |
1 |
7 |
Capped
Royalty |
| 72 |
26620-01436-000-00 |
Patented
Mineral
Properties |
M.S.
1436 Julie Ette
Lode Etal 22-005-02 |
LAC
Minerals
(USA) LLC |
Annual
Lawrence Co.
property
tax |
$75.72
|
|
HMC |
1 |
|
|
1 |
Subject
to potential reversion of property
if not used for
mining purposes |
|
|
| 73 |
26620-01440-000-00 |
Patented
Mineral
Properties |
M.S.
1440 Vigor
Lode
Etal 21-005-02 |
LAC
Minerals
(USA)
LLC |
Annual
Lawrence Co.
property
tax |
$137.16
|
|
HMC |
1 |
|
|
1 |
Subject
to potential reversion of property
if
not used for mining purposes |
|
|
| 74 |
26620-01468-000-00 |
Minerals
Only |
M.S.
1468 Loyd
Lode
33-005-02 |
Homestake
Mining Company of
California |
|
|
|
HMC |
1 |
Whitehouse |
5 |
6 |
-Capped
Royalty |
|
|
| 75 |
26620-01469-000-00 |
Patented Mineral Properties
|
M.S.
1469 Cashier & La Plata Lodes 15-
005-02 |
LAC
Minerals (USA) LLC |
Annual
Lawrence Co. property tax |
$17.00
|
|
HMC |
1 |
|
|
1 |
|
|
|
| 76 |
26620-01529-000-00 |
Patented
Mineral
Properties |
M.S.
1529 Badger
Lode
Etal 15-005-02 |
LAC
Minerals
(USA)
LLC |
Annual
Lawrence Co.
property
tax |
$66.02
|
|
HMC |
1 |
Fillmore
|
5 |
6 |
Subject
to potential reversion of property
if
not used for mining purposes |
|
|
| | M3-PN240322
3 February 2025
Revision 0 |
28 |
Dakota
Gold
Technical
Report
Map
ID |
County
Parcel ID Number |
Mineral
Property Type |
Legal
Description |
Property
Owner |
Annual
Property Maintenance |
2024
Taxes Paid |
Other
Cost |
First
Royalty Owner |
Royalty
% |
Second
Royalty Owner |
Royalty
% |
Third
Royalty Owner |
Royalty
% |
Royalty
% Total |
Comments |
| 77 |
26680-01569-000-00 |
Patented
Mineral
Properties |
M.S.
1569 Lola
Lode
15-005-02 |
LAC
Minerals
(USA)
LLC |
Annual
Lawrence Co.
property
tax |
$24.78
|
|
HMC |
1 |
Fillmore
|
5 |
6 |
Subject
to potential reversion of property
if
not used for mining purposes |
|
|
| 78 |
26680-01616-000-60 |
Minerals
Only |
M.S.
1616
Grenada,
Genesee &
Peerless Lodes 03-004-02 |
Homestake
Mining Company of
California |
|
|
|
HMC |
1 |
Whitehouse |
5 |
6 |
Capped
Royalty |
|
|
| 79 |
26680-01616-000-70 |
Minerals
Only |
M.S.
1616
Phonolite &
Trenton Lodes 03-004-02 |
Homestake
Mining Company of
California |
|
|
|
HMC |
1 |
Whitehouse |
5 |
6 |
Capped
Royalty; Excludes Phonolite lode in this parcel #. |
|
|
| 80 |
26680-01617-000-00 |
Patented
Mineral Properties |
M.S.
1617 Los
Angeles #1, #2 &
#3
Lodes
23-005-02 |
Homestake
Mining
Company
of California |
Annual
Lawrence Co. property tax |
$62.86
|
|
HMC |
1 |
Aye/Gali |
5 |
6 |
Capped
Royalty |
|
|
| 81 |
26680-01643-000-00 |
Minerals
Only |
M.S.
1543 Snorter & Snorter Frc Lodes 33-005-02 |
Homestake
Mining Company of
California |
|
|
|
HMC |
1 |
Whitehouse |
5 |
6 |
Capped
Royalty |
|
|
| 82 |
26680-01655-000-10 |
Patented
Mineral
Properties |
M.S.
1655 Victor #3
Lode
Etal 15-005-02 |
LAC
Minerals
(USA)
LLC |
Annual
Lawrence Co.
property
tax |
$166.42
|
|
HMC |
1 |
Fillmore
|
5 |
6 |
Subject
to potential reversion of property
if
not used for mining purposes |
|
|
| 83 |
26680-01655-000-20 |
Patented
Mineral Properties |
M.S.
1655 pt St.
Cloud #5 Lode 22-
005-02 |
LAC
Minerals (USA) LLC |
Annual
Lawrence Co. property tax |
$17.04
|
|
HMC |
1 |
Fillmore
|
5 |
6 |
Subject
to potential reversion of property if not used for mining purposes |
|
|
| 84 |
26680-01659-000-20 |
Minerals
Only |
M.S.
1659 Telegram, Maid of Erin, Gannon etc |
Homestake
Mining Company of
California |
|
|
|
HMC |
1 |
Whitehouse |
5 |
|
|
6 |
Capped
Royalty |
| 85 |
26680-01673-000-00 |
Patented
Mineral Properties |
M.S.
1673 Blue Hill Frac, Belligerent, etc. |
Homestake
Mining Company of
California |
Annual
Lawrence Co. property tax |
$54.80
|
|
HMC |
1 |
Whitehouse |
5 |
|
|
6 |
Capped
Royalty |
| 86 |
26760-01769-000-00 |
Patented
Mineral
Properties
|
M.S.
1769 Edmonia
Lode 14-005-02 |
LAC
Minerals
(USA)
LLC |
Annual
Lawrence Co.
property
tax |
$21.24
|
|
HMC |
1 |
|
|
|
|
1 |
|
| 87 |
26760-01792-000-00 |
Minerals
Only |
M.S.
1792 Marconi
#2
Lode 31-005-03 |
Homestake
Mining Company of
California |
|
|
|
HMC |
1 |
|
|
|
|
1 |
|
| 88 |
26760-01822-000-00 |
Minerals
Only |
M.S.
1822 Hattie
Lode
Etal 14-005-02 |
Homestake
Mining Company of
California |
|
|
|
HMC |
1 |
Aye/Gali |
5 |
OMF
Fund |
1 |
7 |
Capped
Royalty |
| 89 |
26760-01829-000-10 |
Patented
Mineral Properties |
M.S.
1829 Tract 1
27-005-02 Plat 2014-
01022 |
Homestake
Mining
Company
of California |
Annual
Lawrence Co. property tax |
$47.16
|
|
HMC |
1 |
Bohlen/
Hoffman |
4 |
|
|
5 |
|
| 90 |
26760-01851-000-00 |
Patented
Mineral
Properties |
M.S.
1851 Mars #1
Lode
15-005-02 |
LAC
Minerals
(USA)
LLC |
Annual
Lawrence Co.
property
tax |
$14.44
|
|
HMC |
1 |
|
|
|
|
1 |
Subject
to potential reversion of property
if
not used for mining purposes |
| | M3-PN240322
3 February 2025
Revision 0 |
29 |
Dakota
Gold
Technical
Report
Map
ID |
County
Parcel ID Number |
Mineral
Property Type |
Legal
Description |
Property
Owner |
Annual
Property Maintenance |
2024
Taxes Paid |
Other
Cost |
First
Royalty Owner |
Royalty
% |
Second
Royalty Owner |
Royalty
% |
Third
Royalty Owner |
Royalty
% |
Royalty
% Total |
Comments |
| 91 |
26760-01862-000-00 |
Patented
Mineral Properties |
M.S.
1862 Stella
#3 & #5 &
Margarite
#6 & #7 Lodes
26-
-005-02 |
Homestake
Mining Company of
California |
Annual
Lawrence Co. property tax |
$72.32
|
|
HMC |
1 |
|
|
|
|
|
|
| 92 |
26760-01872-000-00 |
Patented
Mineral Properties |
M.S.
1872 Cotton Tail Fraction Lode
Etal
22-05-02 |
LAC
Minerals (USA) LLC |
Annual
Lawrence Co. property tax |
$53.06
|
|
HMC |
1 |
|
|
|
|
1 |
Subject
to potential reversion of property if not used for mining purposes |
| 93 |
26800-01910-000-00 |
Patented
Mineral Properties |
M.S.
1910 Dante,
Creston,
Morning Glory & Vindicator Lodes 23-005-02 |
LAC
Minerals (USA) LLC |
Annual
Lawrence Co. property tax |
$56.18
|
|
HMC |
1 |
|
|
|
|
1 |
Subject
to potential reversion of property if not used for mining purposes |
| 94 |
26880-02033-000-00 |
Patented
Mineral Properties |
M.S.
2033 Bison & Trent Lodes 10-005-
02 |
LAC
Minerals (USA) LLC |
Annual
Lawrence Co. property tax |
$35.96
|
|
HMC |
1 |
|
|
|
|
1 |
Subject
to potential reversion of property if not used for mining purposes |
| 95 |
N/A |
Unpatented Mining Lodes
|
L&O
No. 1 – BLM
-SN
MMC74914 sec. 15 |
St.
Joe Minerals |
Annual
BLM
maintenance fee |
|
$200.00
|
HMC |
1 |
|
|
|
|
1 |
|
| 96 |
N/A |
Unpatented Mining Lodes
|
NJB
7 – BLM SN MMC165019 sec 15 |
Bond
Gold Richmond |
Annual
BLM
maintenance fee |
|
$200.00
|
HMC |
1 |
|
|
|
|
1 |
|
| 97 |
26680-01709-00-20 |
Patented
Mineral Properties |
M.S.
1401 Mammouth Lode 22-005-02 |
Dakota
Gold Corp. (DTRC LLC) |
Annual
Lawrence Co. property tax |
$224.24 |
|
|
|
|
|
|
|
|
|
| 98 |
26680-01709-000-20 |
Patented
Mineral Properties |
M.S.
1709 Dague #1 & Dague #2 Lodes 22-005-02 |
Dakota
Gold Corp (DTRC LLC) |
Annual
Lawrence Co. property tax |
$305.12 |
|
|
|
|
|
|
|
|
|
| 99 |
26760-01862-000-10 |
Patented
Mineral Properties |
M.S.
1862 Stella, Stella #1, #2, #4, #6, & #7, Margarite, Margarite #1, #2, #3, #4, #5, & #8 Lodes 26-005-02 |
Dakota
Gold Corp (DTRC LLC) |
Annual
Lawrence Co. property tax |
$237.22 |
|
HMC |
2 |
|
|
|
|
2 |
|
| | M3-PN240322
3 February 2025
Revision 0 |
30 |
Dakota
Gold
Technical
Report

Figure 3-2: Richmond Hill Project Royalties
| | M3-PN240322
3 February 2025
Revision 0 |
31 |
Dakota
Gold
Technical
Report
Table 3-3 includes all currently active permits
required by SDDANR for conducting current exploration activities being conducted at the Richmond Hill site under current approved Exploration
Notice(s) of Intent(s) (EXNI) permits.
Table 3-3: Current Environmental Permits
| Permit |
Authority |
Program |
| EXNI-440 |
SDDANR |
Minerals
and Mining Program |
| EXNI-444 |
SDDANR |
Minerals
and Mining Program |
| EXNI-446 |
SDDANR |
Minerals
and Mining Program |
| EXNI-456 |
SDDANR |
Minerals
and Mining Program |
| EXNI-457 |
SD
DANR |
Minerals
and Mining Program |
| EXNI-460 |
SD
DANR |
Minerals
and Mining Program |
Dakota Gold’s current requirements
and obligations as set out by SDDANR:
| · | Exploration
shall be conducted and reclaimed in such a manner as to prevent any violation of the beneficial
uses of specified water quality criteria of any water resources in the area. |
| · | Any potential
discharge from the site shall be directed to a settling pond or flat vegetated area to allow
suspended solids to settle out. |
| · | All affected
lands shall have adequate sedimentation and erosion control measures applied pursuant to
SDCL 45-6C-32 and according to Best Mineral Management Practices. |
| · | Dakota
Gold must construct stream crossings to protect creeks from erosion, sedimentation and other
potential damage that may cause damage because of access to exploration activities. |
| · | All topsoil
shall be salvaged and stockpiled whenever possible for use in reclamation. |
| · | When
drilling fluids are used, and groundwater is encountered during drilling, the drilling fluids
shall be sufficiently contained to prevent overland flow or discharge to any state waters. |
| · | When
mud pits are being used to drill a hole, where possible, these pits shall be constructed
on the uphill side of the drill pad. |
| · | Dakota
Gold shall spray weeds up to 50 ft. from all disturbed and surrounding areas, including along
access roads within the exploration permit boundary. |
| · | Dakota
Gold shall email a weekly schedule outlining when and where holes will be drilled so the
SDDANR can plan inspections and witness plugging activities. |
| · | Dakota
Gold shall perform paste Ph analyses on mud pits and report the findings to SDDANR prior
to reclamation. Dakota Gold shall amend the pit with lime or other buffer material if deemed
necessary. |
| · | All test
holes shall be capped, sealed, and plugged according to the Administrative Rules of
South Dakota ARSD 74:11:08 (Plugging Standards) immediately following drilling and probing. |
| · | No drilling
shall impact any historical Richmond Hill gold mine facilities designed to control, maintain,
or prevent acid generation, such as the capped pit impoundment and leach pads. |
| · | If surface
casing is used in exploration holes, the following requirements shall be met: |
| o | Prior to removal of surface casing, the hole shall be plugged in accordance
with ARSD 74:11:08 to a level just below the bottom of the surface casing. |
| o | The surface casing will be removed (when possible) or cut off at least
one foot below the ground surface. |
| | M3-PN240322
3 February 2025
Revision 0 |
32 |
Dakota
Gold
Technical
Report
| o | The remainder of the hole will be plugged in accordance with ARSD 74:11:08. |
| · | Dakota
Gold shall notify the department in writing when exploration drilling penetrates an aquifer. |
| · | Where
affected roads and drill pad areas are no longer necessary for further exploration purposes,
reclamation must be completed on these disturbed areas within 12 months. If Dakota Gold plans
to continue exploration in disturbed areas but must temporarily cease exploration activities,
reclamation must be completed within 24 months. Dakota Gold may submit a request to extend
these deadlines as necessary. |
| · | Reclamation
must be completed on all affected acreages within 12 months following completion of all exploration
activities allowed under each EXNI. |
| · | All tree
clearing must be conducted outside of the migratory bird nesting season to avoid and minimize
impacts on migratory bird nesting. |
| · | Dakota
Gold must use approved reclamation seed mixtures under each EXNI. |
| · | Dakota
Gold shall avoid bones, artifacts, foundation remains, or other evidence of previously unrecorded
past human use. |
| · | If any
artifacts or other archaeological or cultural resources are discovered during exploration
activities, the activities shall be halted, and the State Archaeologist must be notified. |
In general, permitting a potential gold deposit
at the Richmond Hill site may require the permits listed in Table 3-4. The final Project’s features, design, and location for construction
may necessitate additional permitting considerations to those listed in this table.
Table 3-4: Potential Environmental Permits
| Permit |
Authority |
Program |
| Conditional
Use Permit(s) (CUP) |
Lawrence
County P&Z |
Land
Use |
| Air
Quality Permit(s) |
SDDANR |
Air
Quality |
| Ground
Water Discharge Permit(s) |
SDDANR |
Ground
Water Quality |
| Mining
Permit(s) |
SDDANR |
Minerals
and Mining |
| NPDES/Surface
water Discharge Permit(s) |
SDDANR |
Surface
Water Quality |
| Storm
Water Discharge Permit(s) |
SDDANR |
Surface
Water Quality |
| Solid
Waste Permit(s) |
SDDANR |
Waste
Management |
| Hazardous
Waste Permit(s) |
SDDANR |
Waste
Management |
| Water
Right Permit(s) |
SDDANR |
Water
Rights |
| Note: SDDANR = South Dakota Department of Agriculture &
Natural Resources. |
| 3.8.2.1 | Addressing Potential Obstacles during
Permitting Process |
Conditional use permits through the Lawrence
County Office of Planning and Zoning go through a formal review and approval process that provides public comment on the final permits
during the Planning and Zoning and County Commissioner Board Hearings on the specific Lawrence County permit.
Large scale mine permits though SDDANR go through
a formal review and approval process that provides for public comment to the final permits during the Board Hearings on the specific
permit in South Dakota.
| | M3-PN240322
3 February 2025
Revision 0 |
33 |
Dakota
Gold
Technical
Report
| 3.8.2.2 | Pre-Mining Land Use |
The pre-mining land use in the area of the Richmond
Hill site includes logging, wildlife habitat, and recreation.
| 3.8.2.3 | Baseline Study Requirements |
Conditional Use Permit Baseline Requirements
can include:
| · | Proposed
land uses |
| · | Setbacks |
| · | Existing
and proposed structures, design specifications, and location of all facilities |
| · | Existing
and proposed grading, drainage patterns, and landscaping |
| · | Existing
and proposed improvements, including sewer and water facilities, parking, and roads |
| · | Existing
and proposed signs with locations |
| · | Proposed
timeline for completion of plans |
| · | Proposed
parking and loading plans |
| · | Adjacent
land use |
| · | Relationship
of the proposed development to the surrounding area |
| · | Property
lines and lot dimensions |
| · | Existing
and proposed wells |
| · | Existing
and proposed septic systems and drain fields. |
Additional information that the Planning and
Zoning Administrator may request could include:
| · | A description
of the activity or operation being proposed |
| · | Hours
of operation, number of employees, number of employees reporting to site |
| · | Traffic
in and out of business |
| · | Number
of vehicles on site |
| · | Number
of parking places, including handicap accessible |
| · | Use
of existing and proposed structures |
| · | Outdoor
storage needs |
| · | Water,
sewage disposal, and waste management service |
| · | Proposed
signage including size, type, and location. |
State of South Dakota Large Scale Mine Permit
Baseline Requirements will require, at a minimum, the following:
| · | Hydrology
Evaluation/Report |
| · | Meteorology
Evaluation/Report |
| · | Air
Quality Evaluation/Report |
| · | General
Geology Evaluation/Report |
| · | Slope
Stability and Geotechnical Evaluation/Report |
| · | Soils
Evaluation/Report |
| · | Vegetation
Evaluation/Report |
| · | Wildlife
Evaluation/Report |
| · | Aquatic
Resources Evaluation/Report |
| · | Cultural
Resources Evaluation/Report |
| · | Sound
Evaluation/Report |
| · | Socioeconomic
Evaluation/Report |
| | M3-PN240322
3 February 2025
Revision 0 |
34 |
Dakota
Gold
Technical
Report
| · | Visual
Evaluation/Report |
| · | Ground
Water-Evaluation/Report |
| · | Surface
Water Evaluation/Report |
| · | Critical
Resources Evaluation/Report. |
| 3.9 | Potential
Significant Encumbrances |
Three potentially significant encumbrances may
affect the Project.
In 2017, Homestake sold several claims in M.S.
1862 (Stella, Stella No.1, Stella No.2, Stella No.4, Stella No 6, Stella No. 7, Margarite, Margarite, Margarite Nos. 1 through 5,
Margarite No. 8) to Terrence T. Tyler (the Tyler Property) subject to an Area of Interest (AOI) buyback right reserved by Homestake.
Under this AOI, Homestake had a right to buy back 51% of the property subject to the AOI if a resource of no less than 1 Moz Au is declared
with the AOI. In May 2021, Dakota Gold purchased the Tyler Property. The AOI overlaps with the southeastern portion of the Richmond
Hill Option Area, which is also owned by Homestake. This buyback right runs for a period of nine months from the declaration of a 1M+
oz resource within the AOI.
The Lakota Sioux assert ownership of the Black
Hills of South Dakota. In United States v. Sioux Nation of Indians, 448 U.S. 371 (1980), the United States Supreme Court held that the
United States government had “effected a taking of tribal property, property which had been set aside for the exclusive occupation
of the Sioux by the Fort Laramie Treaty of 1868.” Although compensation was awarded for this unconstitutional taking, the Lakota
have not accepted the award (reportedly in excess of $2 billion) and continue to claim rights to the Black Hills.
Dakota Gold has indicated that they do not believe
that the former Richmond Hill Mine either helps or hinders continued exploration in any significant manner. Once the Option is exercised
and the Property is purchased from Barrick, all Richmond Hill mine site water-management obligations, along with other post-closure operations,
would become Dakota Gold’s responsibility.
Currently, there are no violations or fines.
| 3.11 | Significant
Factors and Risks That May Affect Access, Title or Work Programs |
To the extent known to the QP, no other known
significant factors and risks may affect access, title, or the right or ability to perform work on the properties that comprise the Richmond
Hill Project discussed in this Report.
| | M3-PN240322
3 February 2025
Revision 0 |
35 |
Dakota
Gold
Technical
Report
| 4 | Accesibility,
Climate, Local Resources, Infrastructure and Physiography |
| 4.1 | Topography,
Elevation, and Vegetation |
The Black Hills of southwestern South Dakota
is an isolated mountain range rising from the Great Plains of North America and extending north northwest into Wyoming (Figure 4-1).
The hills are so-called because of their dark appearance from a distance, as they are covered in a pine–spruce coniferous forest.
Black Elk Peak (formerly Harney Peak) rises to 7,244 feet (2,208 meters) and is the range’s highest summit and the highest mountain
in the United States east of the Rocky Mountains. The Black Hills have been described as an island in the plains, since they rise 3,000
to 4,000 feet above its surroundings—the Thunder Basin National Grassland of Wyoming lies to the west and the Buffalo Gap
National Grassland to the east.
Several small rivers cut through the range, describing
a roughly radial pattern, though most drainage is to the east—most notably Spearfish Creek in the north, Rapid Creek in the central
region, and the Fall River in the south. Regardless of the original drainage direction, all rivers flow into either the Belle Fourche
River, which wraps around the Hills to the north, or the Cheyenne River, wrapping around to the south. The Belle Fourche connects to
the Cheyenne River east of the Black Hills; the Cheyenne in turn joins the southeast-flowing Upper Missouri River in central South Dakota.

Source: Dakota
Gold (2024).
Figure 4-1: Richmond Hill Gold Property Location
The Black Hills is home to varied landscapes,
such as prairie grasslands; rolling hills; badlands; karst features such as caves and sinkholes; craggy peaks; and granite spires. The
hills are also noted for several unique topographic features, including the Badlands, Devils Tower, Missouri Buttes, Bear Butte, Cathedral
Spires, and Mount Rushmore.
| | M3-PN240322
3 February 2025
Revision 0 |
36 |
Dakota
Gold
Technical
Report
An ecological crossroad, the Black Hills contains
wildlife and plant species typical of habitats of the Rocky Mountains, Great Plains, northern boreal forests, and eastern deciduous forests.
The local forest is dominated by ponderosa pine, but also includes dense spruce stands and areas of aspen, birch, and oak (United States
Department of Agriculture Forest Service 2023). White-tailed deer and mule deer are common, and elk are encountered less often. Mountain
lion sightings are rare, but coyotes are relatively common. Goshawk and osprey nest in the forest, and bald eagles may visit in the winter.
Many songbird species are present, including brilliantly colored mountain bluebirds and western tanagers.
The Richmond Hill gold mine sits at an altitude
of 6,000 feet, and the historical leach pad area is 5,600 feet, about one mile north of the pit area.
Access to the Property is gained by traveling
1 mile southwest of Lead, South Dakota, on Highway 85/14A, to State Highway 473, then west approximately 3.2 miles to the Wharf Mine
Road, continuing west approximately 1.2 miles before turning and traveling 1 mile north on the Richmond Hill Road (Figure 4-2).
The Black Hills climate is one of cool-to-cold
snowy winters, and warm-to-hot dry summers, with four full seasons.
Precipitation amounts vary due to mountain influence,
and Richmond Hill is rated as subhumid, with approximately 30 inches of rain annually. Average monthly snowfall ranges from 5 inches
in Rapid City to 15 inches in the Black Hills. The snow on the plains usually melts within a few days, with deeper snow in the Black
Hills lasting much longer.
Any future mining operations are expected to
be year-round. During January and February, daytime temperatures average in the 30s Fahrenheit, but Chinook winds can warm temperatures
into the 50s and 60s. Occasional intrusions of Arctic air are short-lived, and temperature inversions sometimes produce warmer conditions
in the Black Hills.
July and August are the warmest months
of the year, when daytime temperatures climb into the 70s and 80s Fahrenheit—and sometimes the 90s. Breezy winds and low humidity
help make the hot days comfortable.
| 4.4 | Local
Resources and Infrastructure |
The Project is within 5 miles of the twin towns
of Lead and Deadwood. Dakota Gold has its base of operations in Lead, with separate facilities for office and core processing. Historical
Richmond Hill Project documents are housed in secured storage at the Armories in Lead. Two other towns, Central City and Sturgis, are
within 20 miles of the Project. The larger cities of Spearfish and Rapid City are within 40 miles of the Project, and most supplies can
be obtained from one of these two centers. Personnel for exploration or development programs may be sourced from or housed in the four
nearby communities.
Major transportation systems, including road,
rail, and air, exist proximally to the northern Black Hills. Rapid City has a major rail freight station and regional airport, while
an Interstate highway passes through the city and wraps around the northern end of the Black Hills.
Multiple facilities related to the historical
Richmond Hill Mine still exist on the Property, including a water treatment plant and maintenance and storage buildings. Containment
ponds are still operational, although an impermeable clay membrane has capped the open pit and leach pads.
Water for exploration drilling programs has been
sourced locally and either pumped or trucked to the drills. One of three wells that supplied water to the Richmond Hill mine is still
active.
| | M3-PN240322
3 February 2025
Revision 0 |
37 |
Dakota
Gold
Technical
Report
A 69 Kv transmission line supplies power to communities,
and internal power is supplied by a 12.47 Kv line to the Project site.

Source: Dakota Gold
(2023).
Figure 4-2: Richmond Hill Gold Project Access
| | M3-PN240322
3 February 2025
Revision 0 |
38 |
Dakota
Gold
Technical
Report
Gold was first recorded in the Black Hills in
1874, although prior rumors existed of prospectors discovering placer gold. The ensuing 1875 gold rush produced limited success, except
in the Whitewood and Deadwood Creeks area. Other prospectors sought the hard-rock source of the placer gold upstream of the placer workings,
and in 1876, the Homestake lode was discovered. It was mined almost continuously until 2002. Numerous gold deposits were subsequently
discovered in the Black Hills in different geologic environments, with several turning into significant mining camps.
The Richmond Hill mine is in the historical Carbonate
Mining District approximately five miles northwest of Lead, South Dakota, in the northern Black Hills. Mining in the area started in
the 1870s, during the gold-rush era. The only known production from the Property was from the Carbonate camp, which was primarily mined
for lead and silver. The bulk of this production was from the Iron Hill mine. The mining was such that it supported a nearby town and
smelter. Mining continued in this area until the silver price collapsed in the 1880s. About 2,500 ounces of gold were produced from the
Spanish R mine on the western side of the camp in the late 1800s.
Prior to 1981, Viable Resources Inc. (Viable)
assembled a land package that included most of the Carbonate camp. The bulk of the Richmond Hill deposit lies on Mineral Survey 977,
obtained by a lease from Richard McQuire that included a 2.6% NSR royalty. LAC subsequently bought out this royalty in the early 1990s.
In 1981, Freeport Exploration Company (Freeport) leased several claims from various individuals within the area now known as the Property.
Also in 1981, Freeport formed both a lease agreement and joint venture (JV) agreement with Viable and drilled 52 rotary and core holes
near the Richmond Hill topographical high and near the Carbonate camp several thousand feet to the north. The drilling project did not
return the results Freeport needed to continue exploration, and the JV was terminated in 1983. Freeport subsequentially allowed their
leases to lapse.
St. Joe American, owned by the Fluor Corporation,
first started reviewing the Black Hills for its mineral potential in 1982 (St. Joe 1986). They noted that total gold production in the
area was over 39 Moz, with the Homestake mine accounting for 36 Moz. St. Joe determined that historical gold production came from five
different geological ages and mineralizing processes. From oldest to youngest stratigraphically (mine or prospect examples) they are
Precambrian (Homestake, Keystone, Bullion, Holy Terror, and Clover Leaf); Cambro-Ordovician Deadwood Formation (Cod) (Golden Reward,
Bald Mountain, Maitland, and Wasp); Mississippian Pahasapa Formation (Spearfish Gold, Ragged Top, and Deadwood Standard); Tertiary porphyry
related (Guilt Edge and Hoodoo-Union Hill); and Placer Deposits (Deadwood and Rockerville) (St. Joe 1986).
Many of these mineralizing systems seemed to
be present on the ground controlled by Viable, so in January 1984, St. Joe American entered into a JV with Viable to explore land
around the Richmond Hill topographical high. They determined that this area held the greatest promise to host a minable gold deposit,
and that year, they started drilling a breccia body 1,500 ft. south of the hilltop; that breccia body contained the Richmond Hill gold
deposit (St. Joe 1987). The Richmond Hill mine history is summarized in Section 5.2.
An active exploration program continued elsewhere
on the claims through the life of the Richmond Hill mine, primarily looking for gold-rich oxide rock that could supplement the feed to
the Richmond Hill heap leach processing facility. In July 1987, Bond International Gold (Bond Gold) acquired St. Joe American. In
1990, Bond Gold explored thirteen prospective areas on the Property; only MW-3, Richmond Hill North, and Cole Creek returned positive
results. The MW-3 Main deposit was discovered in the third hole drilled, 6,000 ft. northeast of Richmond Hill, and later that year the
MW3 East deposit was discovered 800 ft. east-northeast of MW-3 Main, which contains higher grades. Due to the gold commodity price, at
the end of 1990 several prospective areas were dropped from further exploration. These included the Earle, West Thumb, Twin Tunnels (TT),
and Cleveland (CV) prospective areas. In 1991, seven additional prospective areas were explored, including Richmond Hill North (RHN),
Cole Creek (CC), Eagle Bird, Helena, Huskie West, Perkins–Goodell, and Cleopatra Creek. Despite somewhat encouraging results, LAC
did not develop any of these prospective areas due to low gold prices and environmental concerns. The MW-3 deposits were also excluded
from further exploration due to being closed off in all directions, except those portions that trend off claims into ground held by others.
| | M3-PN240322
3 February 2025
Revision 0 |
39 |
Dakota
Gold
Technical
Report
In November 1989, LAC Minerals Ltd. Acquired
Bond Gold. After the merger, the Project was held by the LAC subsidiary Richmond Hill Inc. In 1993, Richmond Hill Inc merged into LAC
Minerals (USA) Inc. LAC Minerals (USA) Inc. converted to LAC Minerals (USA) LLC in 1999. Barrick Gold Corporation (Barrick) acquired
LAC Minerals Ltd., the parent of LAC Minerals (USA) LLC in November 1994.
The Homestake Mining Company was acquired by
Barrick in 2001. LAC Minerals (USA) LLC (hereafter “LAC”) and Homestake Mining Company of California (hereafter “Homestake”),
a subsidiary of Homestake Mining Company merged in October 2023, with Homestake as the surviving entity. Homestake is the current
owner of the properties formerly held separately by LAC and Homestake.
Dakota Territory Resources Company, now a subsidiary
of Dakota Gold, entered into a three-year option agreement (the Option) with Barrick in 2021 to acquire the Homestake/LAC interests in
the Richmond Hill Project area, with the mineral tenure primarily held in the names of LAC and Homestake (see discussion in 3.3 and 3.4).
In 2022, the Option was amended to extend the Option period until March 7, 2026. In February 2025, the Option was further extended
until December 31, 2028.
Table 5-1 provides a summary of Richmond Hill’s
recent history.
| | M3-PN240322
3 February 2025
Revision 0 |
40 |
Dakota
Gold
Technical
Report
Table 5-1: Summary of Richmond Hill’s
Recent History
| Company |
Year |
Comment |
| Viable |
Pre
1981 |
Assembled
land package. |
| Freeport
Exploration Company |
1981 |
Leased
several claims in Richmond Hill area. |
| Joint
venture (JV) and lease agreement with Viable. Conducted drilling on several prospects. |
| 1983 |
JV
with Viable terminated and leases allowed to lapse. |
| St.
Joe |
1984 |
JV
with Viable. |
| Started
drilling on Richmond Hill deposit breccia body. |
| 1985-1986 |
Continued
drilling Richmond Hill deposit. Began property-wide drilling program. Added additional claims to the property position. |
| 1986 |
Richmond
Hill positive feasibility study. Continued property-wide exploration program. Identified significant gold mineralization in the Cole
Creek, Twin Tunnels, and Turnaround prospective areas. |
| 1987-1988 |
Richmond
Hill deposit permitted for mining. Added the Turnaround deposit to the Mine Permit Application. |
| Bond
Gold |
1987 |
Acquired
St. Joe gold division. |
| Developed
Richmond Hill as an open-cut heap leach operation. Exploration continued with discovery of Cleveland prospective area. |
| 1988 |
First
gold and silver doré poured. |
| LAC
Minerals |
1989 |
Acquired
Bond Gold. |
| 1990–1991 |
Multiple
prospective areas explored with some positive results, including MW-3 prospective area; but all rejected as possible feed sources
for Richmond Hill. |
| 1992 |
Acid
mine-drainage detected; studies began for determining reclamation plan for acid-rock drainage (ARD). |
| 1993 |
Final
mineralized material hauled from Richmond Hill mine pit and efforts shifted to reclamation activities. Final exploration activities
by LAC Minerals at the site. Final report on prospective areas completed. |
| 1994 |
Permit
Amendment approved and reclamation work commenced. |
| LAC
Minerals (USA/Barrick Gold) |
1994 |
Barrick
Acquired LAC Minerals. |
| 1995 |
Reclamation
of pit backfill and waste-rock dump completed. Last gold poured in June. |
| 1996 |
Leach
pad closure plan submitted and approved. |
| 1997 |
Leach
Pad closure completed, and water-treatment plant construction and operation start-up. Water treatment and monitoring are primary
on-site activities. |
| 2008 |
Biological
selenium-treating water-treatment plant added to system. |
| 2019 |
Wharf
Resources options property and begins exploration program. |
| 2021 |
Wharf Resources drops Option with Barrick.
Richmond Hill Gold Project optioned by Dakota
Territory Resource Corp from Barrick including adjacent lands owned by Homestake which is also owned by Barrick. |
| 2022 |
Dakota
Gold formed as a merger of Dakota Territory Resource Corp and JR Resources. |
| Homestake |
2023 |
LAC
and Homestake merged into single company to become Homestake Mining Company of California. |
| | M3-PN240322
3 February 2025
Revision 0 |
41 |
Dakota
Gold
Technical
Report
Limited formal reporting of exploration activities
on the Richmond Hill property was completed as needed for corporate reporting, so the history presented herein has been gleaned from
a limited number of letter reports and memos that were written by employees of the day and saved from destruction after flooding destroyed
nearly all historical documents (Dakota Gold Corporation, pers. Comm.). Much of the exploration status presented in this Report is from
project summary reports that the exploration staff compiled in 1993 as exploration wound down. Due to that flooding, most records of
ground exploration other than drilling were destroyed.
Exploration activities included geologic mapping,
soil sampling, rock-chip sampling, airborne and ground geophysical surveys, and drilling. Drilling was mainly by reverse-circulation
(RC) methods; however, a few percussion holes were completed in the early 1980s, and core holes were drilled in the more intensively
mineralized areas.
The Richmond Hill deposit was discovered in 1984;
and St. Joe Gold Corporation filed an application to mine in 1987, following receipt in 1986 of a positive St. Joe feasibility report
(St. Joe 1987). In March 1988 a mining permit was granted. In late 1988, mining started as an open-pit heap leach operation (Duex
and Anderson 1994).
Richmond Hill mine facilities construction began
in April 1988 under the ownership of Bond Gold. In fall 1988, production began from the Richmond Hill pit, with the first bar of
gold and silver doré poured in December 1988. In November 1989, LAC acquired Bond Gold Corporation.
Mine production was from a single open pit with
a valley-fill waste dump and three heap leach pads. Zones of mined sulfide-bearing mineralized rock placed on the waste-rock pile caused
acid mine-drainage by June 1992. Thus, in July 1992, LAC was issued a Notice of Violation and Cease and Desist Order from the
Department and was required to submit an application to amend its mine permit to the South Dakota Department of Environment and Natural
Resources (SDDENR) and the South Dakota Board of Minerals and Environment (SDBME), outlining a new reclamation plan as the result of
ARD detected at the toe of the waste-rock dump. The permit amendment was approved in February 1994, and reclamation work commenced
in April 1994. The approved plan consisted of constructing a retention pond, treating the waste-dump discharge, and hauling all
potentially ARD waste rock back to the pit and placing it under a multilayer capping system.
Mining continued intermittently until late 1993,
and processing of heap leach pads continued until June 1995. Total production for the life of the mine was 5.24 Mton, with non-mineralized-rock
production of 3.75 Mton. The final ore was hauled from the Richmond Hill pit in October 1993. In all, 172,294 ounces of gold were
produced from the mine, along with 212,610 ounces of silver (Dakota Gold, pers. Comm.).
Barrick acquired LAC in November 1994. Reclamation
of the engineered pit backfill facility and former waste-rock dump was completed in September 1995.
In conjunction with the permit amendment, a leach
pad closure plan was submitted and approved in June 1996. Closure of the leach pads consisted of amending Leach Pad 3 with limestone
to mitigate ARD and recontouring the pads and constructing a multilayer capping system similar to the capping system at the pit impoundment.
Leach pad closure was completed in July 1997. The capping system was successful in significantly reducing ARD generation and water
infiltration and, accordingly, the amount of leach pad effluent requiring treatment.
Since the leach pad effluent and the water stored
in the process ponds did not meet discharge standards, primarily due to elevated levels of selenium, construction of a water-treatment
plant began in 1995. The primary system consisted of a 200 gal/min selenium removal system. Due to issues with scale-up, a 200 gal/min
reverse-osmosis (RO) unit operating at 50% recovery was installed at the site in 1997. The original selenium treatment circuit was used
to treat the brine from the RO unit, which allowed a portion of the concentrate to be blended with the RO permeate and discharged to
the environment. The water-treatment plant began operation in July 1997 and ran full-time year-round until December 1999 (Dakota
Gold, pers. Comm.).
| | M3-PN240322
3 February 2025
Revision 0 |
42 |
Dakota
Gold
Technical
Report
The original water-treatment plant then ran seasonally
from 2002 until 2008 when a biological selenium-treating water-treatment plant was constructed to treat the concentrate stream. This
biological water-treatment operates in conjunction with the reverse-osmosis unit to treat and discharge the effluent collected from the
leach pads. Water treatment, environmental monitoring, and continued reclamation activities are ongoing at the site.
On September 7, 2021, Dakota Territory Resource
Corp (DTRC) signed the Option agreement with Barrick for the Property. In addition to the Richmond Hill land package, the Option includes
lands adjacent to the Richmond Hill Property and owned by Homestake (also owned by Barrick). On March 30, 2022, DTRC (49%) completed
a merger with JR Resources Corp (51%) and became Dakota Gold Corp. Dakota Gold’s exploration in and around the Richmond Hill historical
pit has continued to the present, primarily focusing on material amendable to conventional heap leach.
On February 3, 2025, the term of the Option
was extended by agreement with Barrick until December 31, 2028.
| | M3-PN240322
3 February 2025
Revision 0 |
43 |
Dakota
Gold
Technical
Report
| 6 | Geological
Setting, Mineralization and Deposit |
The Property is on the northwestern portion of
the Lead dome, a subsidiary dome north of the main Black Hills uplift. The Lead dome developed in response to a major Tertiary intrusive
event that also led to development of the Tertiary-aged gold deposits. These Tertiary intrusive rocks have a wide range of compositions
and occur as stocks, sills, dikes, laccoliths, and breccia pipes. The Property’s patented and unpatented claims form a roughly
circular area about 2 miles in diameter (Figure 6-1).
Two major terranes underlie the claims. Precambrian
metamorphic rocks outcrop on the southern portions of the Property and consist of metamorphosed volcanic and sedimentary rocks. The western
portion of this terrane contains primarily extrusive metavolcanic rocks that appear to be mostly mafic in composition. The metasedimentary
rocks on the eastern side consist of phyllite, iron formations, and quartzites. Overlying the Precambrian rock on the north end of the
Property is a nearly complete Paleozoic section, which includes the Cambro-Ordovician Deadwood Formation; Ordovician to Mississippian
Englewood and the Whitewood and Winnipeg Formations; Mississippian Pahasapa Formation; and the Pennsylvanian Minnelusa Formation. Tertiary
igneous rocks of varying composition have intruded extensively into both terranes. Property geology is depicted in Figure 6-2.
Several gold–silver deposits and prospective
areas exist on the Property. Descriptions of these have been grouped relative to their host geologic environment and style of mineralization.
Within the Precambrian terrane, Tertiary mineralization
occurs within breccia pipes and altered Precambrian rocks, with minor mineralization in Tertiary intrusive rocks. Examples include the
Richmond Hill deposit, Twin Tunnels, Turnaround, Richmond Hill North, West Thumb, Huskie West, Cleveland, Calvin P, Cole Creek Heights,
and Earle prospective areas.
Within the Paleozoic terrane, mineralization
occurs in the Cambro-Ordovician Deadwood Formation along two primary horizons containing the most consistent mineralization. Examples
within the Deadwood Formation are Cole Creek in the upper portion and MW-3 Main, MW-3 East, and Chism Gulch in the lower portion. Localized
gold mineralization also occurs in the Pahasapa Formation but is limited to narrow veins and structures in the old Carbonate Camp area.
Carbonate Camp is several thousand feet north
of the Richmond Hill Gold deposit, comprising two east–west fractures separated by 1,100 feet, with numerous showings and workings
(LAC 1993). Mainly known for its silver, lead, and gold mineralization, mining occurred over several short periods between 1881 and 1940,
with the Spanish R mine on the western side of the camp accounting for most of the gold production. Individual deposits along the main
(southern) fracture include Segregated Iron Hill, Seabury Calkins, Iron Hill, Combination, Able Holmes, and Adelphia. The north
fracture includes Darboy, Farwest, Rattler, Surprise, and Hartshorn deposits. Deposits off the main fractures are the Spanish R, Buntz,
and Homerun.
| | M3-PN240322
3 February 2025
Revision 0 |
44 |
Dakota
Gold
Technical
Report

Figure 6-1: Exploration Zones
| | M3-PN240322
3 February 2025
Revision 0 |
45 |
Dakota
Gold
Technical
Report

Figure 6-2: Geology of Richmond Hill
Other zones within the Property include Chism
Gulch, Rocky Point, Iron Hill, and Cleopatra Creek. Each of these areas contains gold and silver mineralization and has exploration
potential. Targets included in the mineral resource estimate and zones for which historical write-ups exist are described in more detail
below.
Several gold deposits and zones exist in the
Project area. Figure 6-3 is a 0.01 oz/ton grade shell showing the distribution of zones within the global resource estimate calculated
for this Report. The grade shell measures approximately 13,000 ft. north-south by 10,000 ft. east-west and 3,000 ft. vertically and is
close to gold mineralization’s known limits. The type and character of these zones are discussed individually below.
| | M3-PN240322
3 February 2025
Revision 0 |
46 |
Dakota
Gold
Technical
Report

Figure 6-3: Richmond Hill Gold Project Target
Zones on 0.01 oz/ton Grade Shell Plot
The Richmond Hill Gold mine is centered on an
elongate Tertiary breccia pipe intruded into Precambrian phyllite and amphibolite, with stockwork zones fracturing and mineralization
surrounding the pipe. The mine is the only site within the Project that has had recent mining. Mining activities were limited primarily
to the oxidized cap, although some sulfide-bearing material was also mined. The geology of the Richmond Hill gold mine is as follows:
The (Richmond Hill) breccia pipe contains
angular clasts of Tertiary intrusive rock and Precambrian metavolcanic rocks in a matrix of rock flour, iron oxides, barite, and adularia.
Accessory minerals in the breccia include quartz, alunite, jarosite, kaolinite, fluorite, and rutile. The breccia is argillically altered
and weakly silicified. Pyrite and marcasite occur in unoxidized rock. The deposit (that was mined) was primarily in the oxidized zone
which extended to a depth of 250 ft. Gold grain sizes were determined by scanning electron microscope studies to be less than 2
microns (µm) occurring in quartz, feldspar, kaolinite, and iron oxides. (Paterson et al. 1988)
The breccia pipe and enclosing rocks are oxidized
up to 250 ft. deep, resulting in a hematitic–jarositic cap. The hydrothermal breccia pipe hosts gold, two zones of altered and
stockwork-fractured Precambrian schist lying on the eastern and northwestern edges of the pipe, and one zone of stockwork-fractured trachyte
porphyry intrusion southwest of the pipe. Gold is widespread, occurring as small native particles near oxidized-pyrite sites. Alteration
is mainly argillic with local silicification, and numerous quartz–barite–adularia veins cut the deposit. The Precambrian
amphibolite schist east and northwest of the breccia pipe has undergone intense argillic alteration and contains fine-grained gold in
oxidized pyrite sites. In unoxidized material, pyrite and arsenical marcasite appear to be associated with gold (Paterson 1988). The
oxidized breccia pipe has historically been the most attractive gold host within the mine. Sulfide mineralization lying beneath the oxidized
cap also carries gold, but in 1986 was not deemed suitable to mine using heap leach recovery processes; therefore, the relatively flat-lying
oxide–sulfide contact was used as the floor to the deposit for mining.
| | M3-PN240322
3 February 2025
Revision 0 |
47 |
Dakota
Gold
Technical
Report
The sulfide resource underlying the Richmond
Hill deposit’s westernmost zone of oxidized and fractured Precambrian rocks is a zone of mineralized sulfide-bearing rock not suitable
for heap leaching. The host rock contains pyrite and arsenical marcasite averaging 5% to 10%, locally reaching 25% (Duex’s 1988
edit of Paterson 1988). The best grades intercepted to 1986 were 0.22 oz/ton Au over 135 ft., which is approximately 150 ft. below the
oxide–sulfide interface (St. Joe 1986).
The Richmond Hill North zone Is approximately
3,000 ft. north-east of the Richmond Hill gold mine. A 1990 radiometric airborne geophysical survey identified the Richmond Hill North
zone as having the potential for Richmond Hill deposit-style mineralization. The area has three intrusive bodies and a large breccia
pipe where early drilling returned mixed results. The geology comprises Proterozoic metavolcanic and sedimentary rocks overlain by the
Cambro-Ordovician Deadwood Formation and intruded by Tertiary porphyritic intrusive rocks (LAC 1993). Proterozoic rocks are mapped as
amphibolite and mica schist, which have been deformed by three stages of folding, and metamorphosed to greenschist facies. Rock units
strike north–south and dip vertically.
The Deadwood Formation rocks comprise basal sandstone,
conglomerate, and shale units dipping north-northwest at 10 to 15 degrees. Tertiary intrusive rocks are mineralized breccia bodies with
fragments up to 30 ft. in diameter, comprising Paleozoic sediments and Tertiary porphyry fragments cemented by a finer matrix and rock
flour. The Turnaround and Twin Tunnels prospects are within this area and are described in more detail below.
The Twin Tunnels zone is within the Richmond
Hill North area and is described in more detail below. The Twin Tunnels zone is 2,900 ft. northeast of the Richmond Hill gold deposit
at the headwaters of Cole Creek. It is named for a pair of adits driven on the breccia zone comprising the Southern Extension and Northern
Extension zones. The Southern Extension is a mineralized Tertiary breccia and jasperoid, whereas the Northern Extension is a Tertiary intrusive
complex (Watson 1990).
Gold mineralization at the Twin Tunnels Southern
Extension is within silicified Precambrian rocks surrounding a jasperoidal core (St. Joe 1986). Gold grades in jasperoidal rocks range
from 0.15 to 0.25 oz/ton Au. Only the southern portion of the breccia is mineralized, although the breccia continues to the north beyond
drill-tested ground. In 1990, the mineralized material in the drilled portion of the Southern Extension was thought to be about 330,000
tons at 0.055 oz/ton Au (Watson 1990). Dakota Gold is not treating this amount of mineralized material as current and the author
has not determined what work, if any, would be required to verify or upgrade or if such verification or upgrading would be possible.
The amount of mineralized material thought present at Twin Tunnels has been included to give the reader a sense of what was found, which
at the time was not thought to be of economic interest.
The Twin Tunnels Northern Extension Is a sericite-
and argillic-altered complex that is mineralized with pyrite containing gold and silver. The rocks comprise a mineralized metavolcanic,
a poorly mineralized coarse- and fine-grained amphibolite unit, and an unmineralized Tertiary porphyry intrusive. Altered metavolcanic
rocks are oxidized, vuggy, kaolin-rich, with about 5% finely disseminated pyrite. The metavolcanic unit has a massive and glassy matrix,
few vugs, and carries higher-grade gold mineralization up to 0.09 oz/ton. Data from 1990 show mineralization open to the north and south
suggesting a low-grade sulfide deposit (0.03 to 0.035 oz/ton Au) of undetermined size. Later drilling showed that the extensions to the
north and south were lower grade than first speculated (DGC, pers. Comm.).
The Turnaround prospect Is 1,000 ft. northeast
of the Richmond Hill gold deposit and is a breccia pipe overlain by an unmineralized porphyry cap. Bedrock oxidation extends to over
400 ft. below the overburden–bedrock interface, and sulfide pods are found randomly throughout the host stratigraphy, suggesting
that primary sulfide mineralization was oxidized during the late stages of hydrothermal alteration and more recent weathering (Paterson
1988). The pipe is weakly mineralized throughout, with a higher-grade section along the southeast margin. Alteration and clast compositions
are different from the pipe at the Richmond Hill deposit, as there are abundant Cambro-Ordovician Deadwood Formation clasts that contain
higher-grade mineralization. Drilling was conducted from 1985 to 1987, comprising 40 holes into the pipe and adjacent rocks. In September 1986
St. Joe used a polygonal model to estimate that the pipe contained as much as 8.5 Mton of oxide mineralized material at 0.021 oz/ton
Au. St Joe noted that there was a smaller, higher-grade zone within the modeled pipe. Dakota Gold is not treating the 1985 polygonal
oxide model as current and the author has not determined what work, if any, would be required to verify or upgrade or if such verification
or upgrading would be possible. The 1980s exploration results have been included to give the reader a sense of what was found at the
Turnaround prospect.
| | M3-PN240322
3 February 2025
Revision 0 |
48 |
Dakota
Gold
Technical
Report
The West Thumb area is immediately west of the
Richmond Hill gold deposit and was drilled in 1990 to increase potential resources for the Richmond Hill mining operation. The drill
program identified about 488,000 tons of oxide material grading about 0.043 oz/ton Au. Dakota Gold is not treating the historical West
Thumb work as current and the author has not determined what work, if any, would be required to verify or upgrade or if such verification
or upgrading would be possible. The results of the historical work have been included to give the reader the ultimate outcome of exploration
of the West Thumb prospect in the early 1990s. Exploration was curtailed due to the expense of drilling on the very steep terrain.
The Huskie West area is 1,500 ft. southwest of
the Richmond Hill gold deposit on the east side of Cleopatra Creek; it is a gold-in-soil anomaly trending 700 ft. north–south and
300 ft. east–west. It is underlain by altered meta-igneous rocks cut by numerous Tertiary dikes (St. Joe 1986). A total of 12 exploration
holes drilled into the Deadwood and Flagrock Formations did not return encouraging results. Bond Gold revisited the area in 1991, and
constructed drill trails along the steep terrain but did not find significant mineralization.
The Cleveland area is about 2,000 ft. northeast
of the Richmond Hill gold deposit. It contains high-grade Homestake-type mineralization in Precambrian iron formation amphibole schist
and metasediments affected by three periods of later folding. Most gold mineralization is controlled by east–west fault systems
(Duex 1989). The drilling program indicated that mineralization is cut off along strike, thinned, and became erratic to the north; heap
leachable metallurgical recoveries decreased with depth. The preliminary drill program suggested that the Cleveland area deposit may
contain 730,000 tons at 0.047 oz/ton Au (Horton 1989). Dakota Gold is not treating the Cleveland historical exploration results as current
and the author has not determined what work, if any, would be required to verify or upgrade or if such verification or upgrading would
be possible. The outcome of historical inventory has been included to give the reader a sense of the outcome of explorations ending in
late 1989.
Exploration identified an attractive zone grading
0.3 oz/ton Au over 5 ft., within an amphibole schist similar to that hosting Homestake mineralization. Exploration ceased in 1990 after
five holes drilled into the prospect had minimal success (Duex 1990).
The Calvin P area is near the Cleveland prospective
area and has similar underlying geology. One hole was drilled into the prospect in 1990 and intersected anomalous gold mineralization
near the bottom of the hole. The intersection’s grade was not high enough to warrant further work (Duex 1990).
The Cole Creek Heights area is north of the Cleveland
prospect area and has similar geology and mineralization in Precambrian iron formation. Three RC holes drilled in 1990 failed to identify
significant mineralization (Duex 1990).
The Earle area is 3,000 ft. southeast of the
Richmond Hill gold deposit and is the southern extension of the Cleveland prospect area. Four holes drilled in 1990 returned no significant
intercepts, resulting in no further work being planned (Duex 1990).
The MW-3 area is approximately 6,000 ft. northeast
of the Richmond Hill mine and comprises two zones—Main and East—which were reported to have bulk-mineable oxide resources,
but were never mined (LAC 1991). The zone contains the Richmond Hill mine’s processing facility on the northern portion. The prospective
area contains the Richmond Hill mine’s processing facility on the northern portion. Historical exploration included numerous prospect
pits, four shafts, and an adit about 260 ft. long. Other collapsed adits were identified, but no past production is known from the area.
| | M3-PN240322
3 February 2025
Revision 0 |
49 |
Dakota
Gold
Technical
Report
The southern part of the MW-3 area is underlain
by Precambrian metasediments containing iron formations, whereas the northern portion is overlain by the Cambro-Ordovician Deadwood and
Winnipeg Formations, which dip northerly at 15 to 20 degrees. Intruding the sediments are Tertiary monzonitic porphyry dikes and sills,
as well as stocks and associated breccia bodies.
Gold mineralization at MW-3 occurs throughout
the Deadwood Formation, and less so within unconformably underlying Precambrian metasediments. Potential bulk-mineable material is disseminated
in the basal conglomerate and sandstone members of the Deadwood Formation, and uppermost Precambrian schists (LAC 1991). Steeply dipping
and north-northwest-striking fractures known locally as verticals also control replacement gold-mineralization to a lesser extent. The
basal contact between Cambrian and Precambrian rocks is strongly oxidized glauconitic limestone, shale, and occasional massive limestone
beds. Underlying Precambrian metasediments comprise mica schist, iron formation, and clastic quartzites with interbedded mica schists.
The best gold grades are found within iron formation rocks, and most continuously in oxidized schists. Gold occurs erratically within
structures up to 50 ft. below the zone of oxidation.
Exploration in the late 1980s and early 1990s
comprised geological mapping, soil and rock chip sampling, ground geophysics, and 248 drill holes, which included condemnation drilling
over the Richmond Hill deposit processing facility. Metallurgical testing and detailed resource estimates were completed following discovery
of the Main and East deposits. Beyond the deposits, widely spaced drilling confirmed low probability for additional mineralization in
areas where surface mapping had indicated limited potential.
The MW-3 Main deposit mineralization is hosted
mainly in Deadwood Formation basal sandstone and conglomerate, and a minor amount in Precambrian oxidized-iron-formation schists and
lower contact unit. Consistent gold mineralization is found between two north-northwest-trending fractures or faults (verticals). East
of the verticals the grade decreases quickly, and west of the verticals gold is present, but structurally controlled, including a major
structure 500 ft. to the west that is 30 ft. wide and more than 400 ft. down dip (strike length not stated in LAC 1991). Oxidation of
the Precambrian schists is thought to have occurred during the Cambrian, and prepared the rocks for Tertiary gold mineralizing solutions
to penetrate along faults or fractures into the schists.
The Main deposit is closed in all surface directions,
and potential tonnage is limited by the thickness of the host rocks due to erosion of the host stratigraphy to the south, and a westward
fault offset to the north. The faulted continuation occurs as the Cole Creek prospect, which is discussed below. The gold grade also
decreases to the east and west of the controlling verticals.
The MW-3 East deposit is about 800 ft. east-northeast
of the Main deposit and is hosted in the Deadwood Formation lower contact zone altered to a ferruginous clay (LAC 1991). The underlying
Precambrian clastic quartzite and mica schist were not oxidized in the Cambrian and were not receptive to the gold mineralizing fluids.
Gold mineralization in the lower contact zone is controlled by north-northwest-striking verticals, with best grades between two Tertiary
porphyry dikes. The zone is 50 ft. thick and overlain by Deadwood Formation shale and Tertiary sills. The mineralization continues to
the east on land once controlled by Homestake, which drilled the eastern extension in 1994 and named this area Chism Gulch.
LAC deemed both MW-3 Main and MW-3 East to be
uneconomical to mine based upon the drilled tonnage using the 1990s gold price.
The Cole Creek area is 4,000 ft. north of the
Richmond Hill gold deposit on the north side of Cole Creek, within the northern third of the old Carbonate camp. The prospect contains
replacement-style mineralization in the uppermost part of shallow Deadwood Formation limestone, sandstone, and shale, dipping 15 to 20
degrees to the northwest. The sedimentary rocks are intruded by Tertiary porphyritic igneous (monzonite to phonolite) rocks as sills
dikes, stocks, and breccias. Mineralization is controlled by two northwest-trending faults separated by approximately 120 ft., with mineralization
continuous between the faults and as an irregular halo outward from the faults (St. Joe 1986). All near-surface bulk-mineable prospects
were evaluated, but deeper zones were not explored (DGC, pers. Comm.)
| | M3-PN240322
3 February 2025
Revision 0 |
50 |
Dakota
Gold
Technical
Report
The Iron Hill area is part of the old Carbonate
camp, just north of the Cole Creek prospect, and has mine dumps containing gold mineralization believed to reflect the underlying structure
that crosscuts an east–west fault hosting silver mineralization. No significant mineralization was found, and no further exploration
was conducted.
The Spanish R mine is a past gold producer hosted
by the north–south structures seen in the Cole Creek area. The mine is on the western side of the two structures present at Iron
Hill. No significant mineralization was found, and no further exploration was conducted.
The Squaw Creek area is north of the Huskie West
prospect and defined by a large, low-grade, gold-in-soil anomaly. Two east–west-trending structures within lower units of the Deadwood
Formation control replacement-gold mineralization, which is similar to the MW-3 or Golden Reward areas. No significant mineralization
was found, and no further exploration was conducted.
The Eagle Bird area is 2,500 ft. south of the
Richmond Hill gold mine, and was explored historically by many pits, adits, and a few shafts. One adit at the Eagle Bird mine is reported
to have had 2,600 ft. of underground workings, but no known production. The area is underlain by Precambrian meta-igneous and metasedimentary
rocks overlain by the Deadwood Formation and intruded by Tertiary porphyry bodies. There are similarities to the rocks of the Richmond
Hill mine area, but Eagle Bird rocks are more mafic, are flows rather than intrusive, and have less foliation. Overlying the basal unit
are metasedimentary rocks, including iron formation (LAC 1993).
Gold mineralization at Eagle Bird occurs in narrow,
east-northeast fault structures within the Precambrian metamorphic and Tertiary porphyritic rocks. Mineralization occurs more extensively
in the basal sandstone and conglomerate of the Deadwood Formation, with hand samples grading up to 0.046 oz/ton Au and a second zone
with 0.06 oz/ton Au. Grades were too low to encourage LAC to continue exploring the area, although less exploration was conducted here
than other prospective areas on the Property.
The Richmond Hill Gold Property is host to multiple
gold–silver prospects and deposits, many of which Dakota determined warranted further exploration. Following option of the Property
in 2021, Dakota started a property-wide exploration program including geology, geochemical, geophysical, and drilling surveys described
in more detail in Chapter 7.
The Black Hills Uplift is an elongate Laramide-aged
structural dome, located in western South Dakota and easternmost Wyoming, where erosion has exposed a core of Precambrian igneous and
metamorphic rocks flanked by Paleozoic- to Mesozoic-aged sedimentary that dip away from the core of the dome (Figure 6-4 and Figure 6-5).
Figure 6-4 is a generalized geologic map of the Black Hills Uplift showing the locations of the Property cross sections A–A′and
D–D′are provided in Figure 6-5.
| | M3-PN240322
3 February 2025
Revision 0 |
51 |
Dakota
Gold
Technical
Report
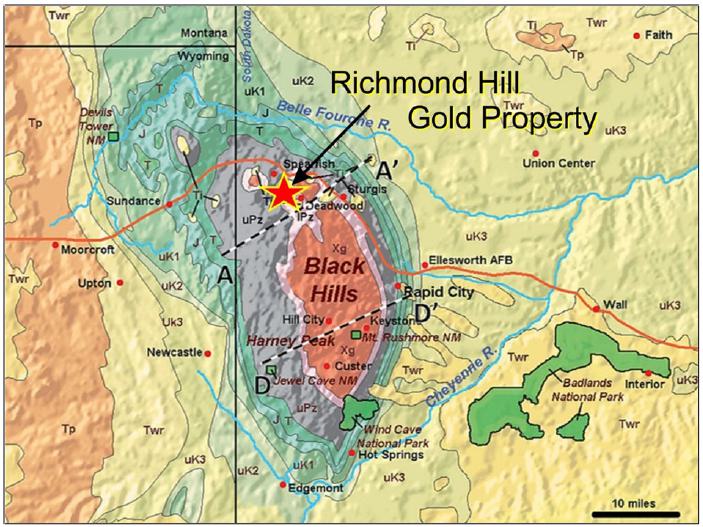
Source: Geology of Wyoming (n.d.)
Explanation: Xg—Precambrian metamorphic
and igneous rocks; lPz—lower Paleozoic (Cambrian–Mississippian); uPz—Upper Paleozoic (Pennsylvanian-Permian); T—Triassic,
J—Jurassic; Uk1-Uk3—undesignated Cretaceous (oldest to youngest); Ti—Tertiary igneous rocks; Twr—Tertiary White
River Group; Tp—Tertiary Pliocene (Upper Miocene-Pliocene Ogallala Formation). Cross-sections A–A′ and D–D′
are shown in Figure 6-5.
Figure 6-4: Regional Geologic map of the Black
Hills Uplift (from Lufking et. Al, 2009)
| | M3-PN240322
3 February 2025
Revision 0 |
52 |
Dakota
Gold
Technical
Report
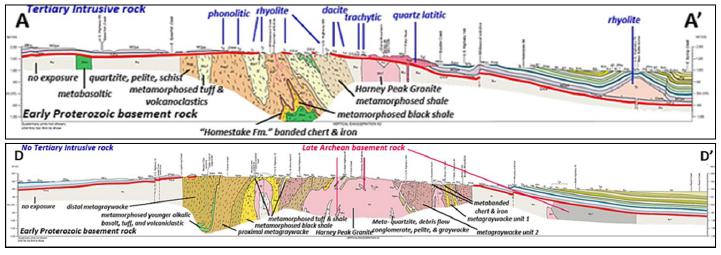
Explanation: A–A′—(northern
Black Hills); D–D′—(southern Black Hills) (shown in Figure 6-4)
Southwest to northeast structural cross sections
AA’ (northern Black Hills) and DD’ (southern Black Hills). The “Great Unconformity” between Precambrian and Phanerozoic
rocks indicated by solid red line.
Figure 6-5: Southwest to Northeast Structural
Cross-Sections (modified from Redden and DeWitt 2008)
The dome formed during the Laramide Orogeny from
66 to 56 Ma episodic tectonic events (Lisenbee, 1993). The northern part on the dome is cross-cut by a WNW-trending belt of Tertiary-aged
intrusive rock that form a number of subsidiary domes related to laccoliths, stocks, dikes and sills that range in age from 58 to 46 Ma
(Lisenbee and DeWitt, 1993, Lisenbee 2010).
The Early Proterozoic Homestake Formation is the
main host for gold mineralization in the Black Hills uplift. Tertiary aged gold mineralization is hosted Early Proterozoic metasedimentary
units, Paleozoic sedimentary units, Tertiary breccias, and Tertiary intrusive rock. The blocks of Archean crust in the southern Black
Hills (D–D′ in Figure 6-5) may be rafted portions of the Superior craton. The complexity of folding and metamorphism within
the Precambrian rocks indicates these ancient units were subjected to multiple deformational events before, during, and after the Trans-Hudson
tectonic event (Redden and DeWitt 2008).
There are three main age groups of rocks including
Precambrian igneous and metamorphic rocks, Paleozoic to Tertiary sedimentary rocks, and Tertiary igneous rocks. The foliated metamorphic
rocks that form the northern Black Hills central core are elevated up to 4,000 ft. above the surrounding flatlands and are mainly composed
of quartzite, phyllite, and schist that were metamorphosed from lower greenschist to amphibolite facies; these are radiometrically dated
to between 2.5 and 1.7 Ga. The metamorphic core has been complexly folded, faulted, and locally intruded by the 1.7 Ga Harney Peak Granite.
These rocks partly underly the Property and are discussed in more detail in Section 6.5. A stratigraphic section of the northern
part of the Precambrian core of the Black Hills uplift is presented as Figure 6-6. For a complete description of Black Hills Precambrian
rocks, see Redden and Dewitt (2008).
| | M3-PN240322
3 February 2025
Revision 0 |
53 |
Dakota
Gold
Technical
Report
Geologic mapping, stratigraphic relationships
and geochronologic data indicate that rocks comprising the metamorphic core were deposited as sand silt, clay, volcanogenic sediments,
and lava flows in intracontinental basins or on the eastern margin of the Wyoming Craton from > 2.56 Ga to 1.88 Ga (Redden et al. 1990,
Redden and Dewitt 2008 and reference therein, Dahl 2010 and references therein). These sedimentary and volcanic rocks experienced protracted
orogenic-related polyphase metamorphism and deformation (1.76-1.715) that culminated in the intrusion of S-type granite and pegmatite
(1.715-1.695) Ga during the Black Hills Orogeny (Dahl et al. 2005a and 2005b, Dahl 2010 and references thin). These events created quartzite,
phyllite, schist, greenstone, and amphibolite that experienced burial depths between approximately 10 and 23 kilometers (6-15 miles) and
temperatures of from approximately 350 to 600 C with locally much hotter conditions in proximity to the S-type granite (Terry and Friberg,
1990 and Dahl et al. 2005a).
Metamorphic conditions associated with the emplacement
of the S-type granites indicate the Precambrian rocks experienced approximately 6 miles of post-exhumation prior to the deposition of
Paleozoic sediments. In the Paleozoic, the Precambrian rocks were inundated by a sea that deposited 6,500 to 7,000 ft. of sandstone, shale,
and limestone sedimentary rock during the Cambrian through Permian periods. These Paleozoic strata thin from north to south and dip east
on the Black Hills’ eastern side and west on the western side. Figure 6-6 displays a Precambrian–Paleozoic stratigraphic section
and Figure 6-7 provides general stratigraphic section of the Black Hills.
| | M3-PN240322
3 February 2025
Revision 0 |
54 |
Dakota
Gold
Technical
Report
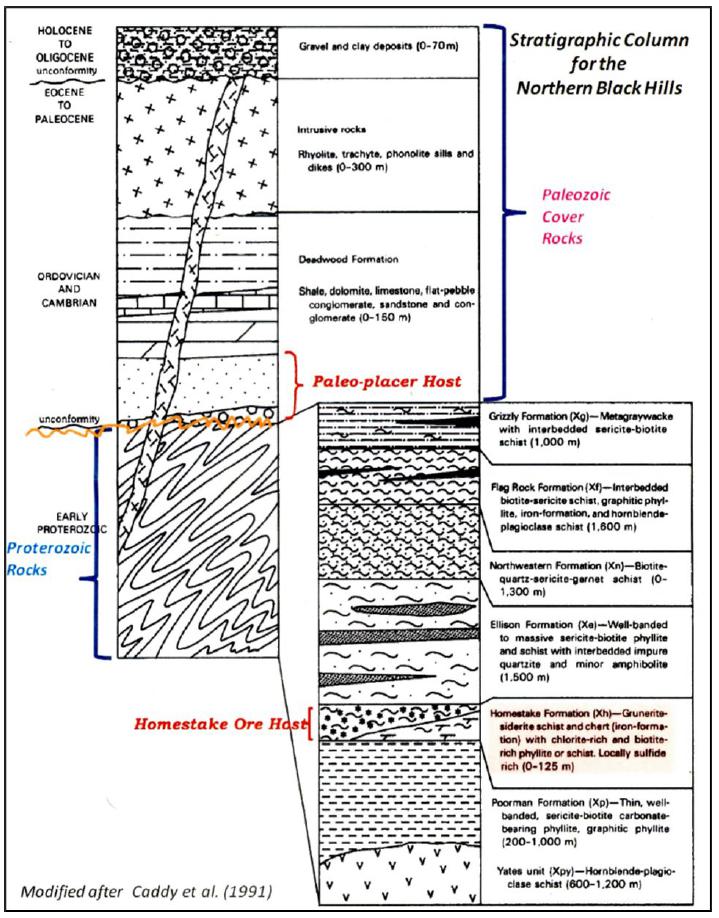
Figure 6-6: Precambrian Stratigraphic Section of
the Northern Black Hills
| | M3-PN240322
3 February 2025
Revision 0 |
55 |
Dakota
Gold
Technical
Report
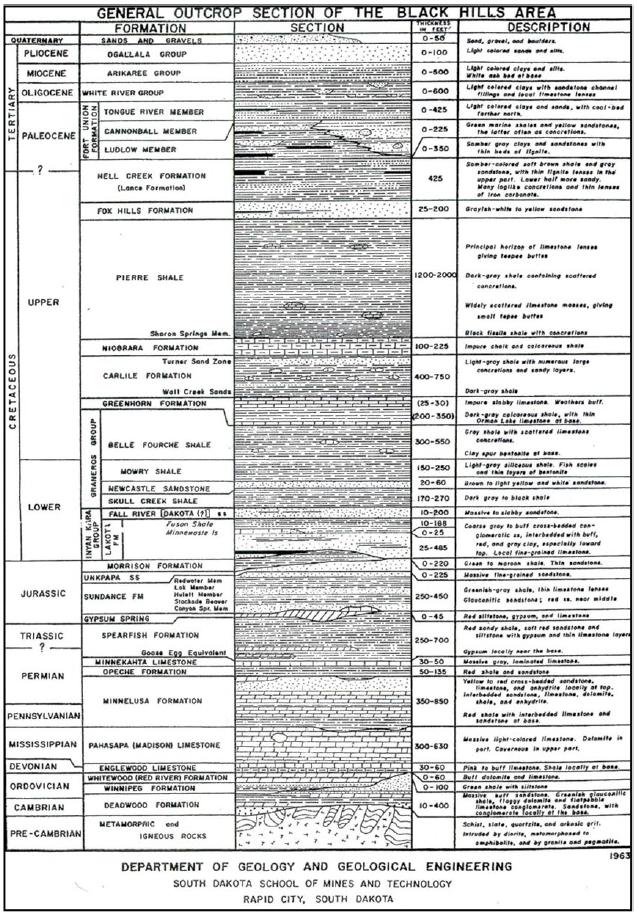
Figure 6-7: Black Hills General Stratigraphic
Section
| | M3-PN240322
3 February 2025
Revision 0 |
56 |
Dakota
Gold
Technical
Report
In the Cambrian, tropical marine clastic rocks
were deposited from north to south during a marine transgression—mainly sandstone and shale of the Deadwood Formation. The subsequent
northward regression created a southward thinning wedge of strata from 400 ft. thick in the north to 7 ft. thick in the south.
The Deadwood Formation comprises two layers of
quartz arenite separated by glauconitic sandstone, shale, limestone, and intraformational conglomerate layers. Deposition of the Deadwood
Formation extends into the Ordovician and is overlain by shale and dolomite of the Winnipeg Formation and Whitewood Dolomite. No Silurian
rocks are found in the Black Hills, which represents a period of emergence and erosion. In the Upper Devonian to Mississippian, the area
was covered by tropical seas, which deposited shale and limestone of the Englewood Limestone and then the (Pahasapa) Limestone.
The Pahasapa Limestone, is 850 ft. thick in the
north and 350 ft. in the south. From the late Mississippian to early Pennsylvanian, the Pahasapa Formation was subject to 20 Ma of erosion
and subsequent karst development in its upper layers, creating open spaces available for later mineralizing fluids.
Lower Pennsylvanian subsidence led to the deposition
of the overlying Minnelusa Formation, which includes a lower marine shale, sandstone, and limestone sequence, upper layers of sandstone
and siltstone, and gypsum near the top of the formation. Near the mid-Permian, the Minnelusa Formation is succeeded by the Opeche Formation
shale, sandstone, and siltstone. Overlying this is the Minnekahta Formation thin-bedded limestone.
The Deadwood and Pahasapa Formations are the main
Paleozoic mineralized geological units on the Richmond Hill Gold Project. The units deposited subsequently are considered cover rocks
and include, in decreasing age, the Minnelusa Formation, Opeche Formation, Minnekahta Formation, and Spearfish Formation. These rocks
are mainly shale, sandstone, siltstone, and limestone.
Following deposition of the Spearfish Formation,
the Black Hills was again emergent and eroded for about 70 Ma, precluding deposition of any early-Mesozoic strata. The erosion continued
to the mid-Jurassic, after which the area was again inundated by seawater, which allowed the Sundance Formation to be deposited.
The erosion continued to the mid-Jurassic, after
which the area was again inundated by seawater, which allowed the Sundance Formation to be deposited. The Sundance Formation is a fossiliferous
unit comprising siltstone, sandstone, white limestone, and shale.
Overlying the Sundance Formation is the upper
Jurassic Unkpapa Formation non-marine sandstone, and Morrison Formation shale and sandstone. The latter formation likely experienced erosion,
as its upper contact is an unconformity that marks the division between the Jurassic and Cretaceous periods.
At the close of the Jurassic and into the Cretaceous,
much of central North America from north to south was submerged in seawater known as the Western Interior Seaway. Between 130 and 65 Ma
a thick sequence of shale, limestone, and sandstone was deposited. Included from oldest to youngest are the Lakota Formation, Fall River
Sandstone, Skull Creek Shale, Newcastle Sandstone, Mowry Shale, Belle Fourche Shale, Niobrara Formation, Carlile Shale, Greenhorn Limestone,
Pierre Shale, Fox Hills Sandstone, and Lance Formation to close out the Cretaceous Period of the Mesozoic Era. By the end of the Cretaceous,
between 6,500 and 7,000 ft. of sedimentary strata had accumulated over what was to become the Black Hills.
Early in the following Tertiary Period the Black
Hills experienced uplift and erosion related to the Laramide orogeny. This was most notable during the Paleocene and Eocene Epochs, with
the sediments being shed to the west into the Powder River Basin. Volcanic activity occurred in a WNW-trending belt across the northern
part of the Black Hills uplift resulted in numerous shallow igneous intrusions in the northern Black Hills, with well-known examples being
Devils Tower, Missouri Buttes, and Bear Butte. The igneous bodies trend younger from east (58 Ma) to west (46 Ma).
| | M3-PN240322
3 February 2025
Revision 0 |
57 |
Dakota
Gold
Technical
Report
Other Tertiary rocks include the White River Group—divided
into the lower Chadron and upper Brule Formations—and are seen primarily along the eastern side of the Black Hills. They formed
during fluvial deposition in the late Eocene and Oligocene Epochs and comprise channel fillings of sandstone, claystone, and minor limestone.
| 6.4 | Landforms and Structures |
The geographic occurrence of Black Hills uplift
geologic formations is controlled by various landforms. Black Hills landforms are divided into five main types: Central Crystalline Core
(Core); Limestone Plateau; Red Valley; Cretaceous (Dakota) Hogback; and Buttes. Bordering the undulating Core is the Limestone Plateau,
which covers a greater area on the west side of the Core than the east due to a much gentler westward rock dip in comparison to the steeper
dips on the east side of the Core. Outboard of the Limestone Plateau is the Red Valley, a broad lowland that developed by erosion of the
Spearfish and Sundance red-bed formations. The Richmond Hill Gold Project is characterized by these first two landforms.
Outboard of the Limestone Plateau is the Red Valley,
a broad lowland that developed by erosion of Spearfish and Sundance red-bed formations. Like the Limestone Plateau, the Red Valley width
is controlled by bedding, with shallower dips producing a wider valley on the west and a narrower valley on more-steeply dipping eastern
exposures. The Cretaceous Hogback is a 300- to 400 ft-high ridge outboard of the Red Valley, formed by Lakota Sandstone that is resistant
to erosion, along with dip-slope rocks of the Fall River Sandstone Formation. Rocks of the underlying strata are exposed on the steep
cliff faces below the ridge crests. Evidence for the timing of erosion to create the current landform favors initiation in early Tertiary
time, though some valleys likely were carved within the last five million years.
Buttes occur in the Northern Black Hills Igneous
Province and are formed by a west- to northwest-striking zone of intrusive rocks cutting across the Black Hills uplift. Erosion of the
enclosing strata has exposed the igneous rocks, which occur as dikes, sills, laccoliths, stocks, ring dikes, and diatremes. Due to greater
resistance to weathering and erosion, the igneous rocks forming these structures stand out as positive topographical features such as
Devils Tower and Bear Butte. Within the Northern Black Hills, the laccoliths generally cause the greatest disruption of the existing lithological
layers into which they are intruded. The laccoliths cause doming and fault-bounded uplift, with the Deadwood Formation being the preferred
host.
The Laramide uplift of the Paleozoic and Proterozoic
basement started in the Laramide Orogeny about 70 Ma ago. Timing of the uplift can be constrained to the early Tertiary, since undeformed
and horizontal Tertiary White River Group rocks lie unconformably above tilted Mesozoic strata, which was disrupted by doming Proterozoic
basement. West vergent monoclines separate the Black Hills uplift from the Powder River Basin to the west. The eastern flank of the Black
Hills uplift is caused by doming of the Proterozoic basement which forms asymmetric anticlines.
Mineralization at the Richmond Hill Gold Project
is dominantly replacement style within Tertiary aged breccias of host Precambrian metasedimentary and Cambrian-Ordovician sedimentary
rocks. Gold bearing fluids possibly derived from Tertiary intrusions migrated along steeply dipping fractures called verticals, and gold
was deposited in favorable structural or chemical traps as replacement deposits. Breccia pipes within Precambrian metasediments and the
Cambro-Ordovician Deadwood Formation are the most common gold-bearing host rocks. The historical Richmond hill gold mine produced ore
from Tertiary breccias dominantly hosted within Precambrian units that were processed as an open pit, heap leach operation.
| | M3-PN240322
3 February 2025
Revision 0 |
58 |
Dakota
Gold
Technical
Report
Gold was first recorded in the Black Hills in
1874, although prior rumors existed of prospectors discovering placer gold. The ensuing 1875 gold rush produced limited success, except
in the Whitewood and Deadwood creeks area. Other prospectors sought the hard-rock source of the placer gold upstream of the placer workings,
and in 1876 the Homestake lode was discovered; it was mined almost continuously until 2002. Numerous other gold deposits were subsequently
discovered in the Black Hills in differing geologic environments, with several turning into significant mining camps. Gold mineralization
settings in the Black Hills are complex, and gold has been found in many geologic settings, including Archean Paleoplacer, Proterozoic
Vein related Carbonate Iron Formation, Proterozoic Vein, Cambrian Placer, Tertiary Epithermal, and Quaternary Placer.
Archean Paleoplacer deposits formed 2.5 Ga ago
in alluvial fans along rift valleys that are now beds of metamorphosed conglomerate, quartz arenite, and hematite-chert banded-iron formation,
which have been rotated and are now overturned (Paterson and Lisenbee, 1990). The paleoplacer deposits comprise pyritiferous and well-sorted
quartz-pebble conglomerates. No recorded amount of gold has been produced from these deposits.
Vein related deposits hosted by Early Proterozoic
Carbonate Iron Formation are represented by the Homestake mine in the northern Black Hills, which produced approximately 40 Moz of gold
and 10 Moz of silver, making it one of the largest deposits of its type in the world. Host rocks are seafloor sediments of the Precambrian
Homestake Formation, which were buried by later Precambrian strata, then complexly folded and metamorphosed during the Black Hills Orogeny.
After about 1.7 Ga of erosion, what was left of the Homestake Formation was buried again by Paleozoic and Mesozoic strata prior to the
most recent uplift and erosion that formed the Black Hills. Current thinking is that most of the gold was originally deposited as an orogenic
gold system along shear zones, then subsequent fluid flow associated with later metamorphism resulted in gold precipitated in a favorable
chemical environment (Caddey et al. 1991, Frei et al. 2009, Morelli et al. 2010). Gold grades at Homestake varied from 1 oz/ton in the
upper levels to 0.25 oz/ton when the mine closed in 2002. From 1953 to 1971, the mine produced more than 500,000 ounces of gold per year.
Other Proterozoic Vein deposits occur in several
locations within the Precambrian core and comprise quartz veins hosted by meta-graywacke and minor amphibolite—iron formation rocks.
Veins that contain gold and minor silver range from a few inches to over 10 ft. wide and are associated with faults, shears, and folds.
Other veins contain gold, silver, antimony, lead, zinc, and copper, which imply that two sets of gold-bearing veins exist, one with and
one without the other minerals. The latter veins are thought to be younger or shallowly emplaced. Most mining of these deposits occurred
in the late 1800s and early 1900s. Examples include Keystone, Bullion, Holy Terror, and Clover Leaf mines (Paterson and Lisenbee, 1990).
Cambrian Placer deposits were formed when gold
was eroded from the Homestake Formation or other Precambrian gold occurrences, and concentrated within stream-channel gravels on the Precambrian
surface (Irving, 1904, Paterson and Lisenbee, 1990). These gravels later became conglomerates at the base of the Deadwood Formation. An
ancient channel lies east of the Homestake open pit, and although no recorded production is known, remnants of the mines contain up to
an ounce of gold per ton. Other Deadwood conglomerate placer deposits to the southeast have never been traced to the lode source.
Tertiary epithermal deposits in the northern Black
Hills are hosted by Precambrian metamorphic, Paleozoic sedimentary, and Tertiary intrusive rocks. Gold- and silver-bearing fluids possibly
derived from the intrusions were concentrated in steeply dipping fractures called verticals, and gold was deposited in favorable structural
or chemical traps (Connolly, 1927, Paterson et al. 1988). The most favorable environment for gold deposition is the Cambro-Ordovician
Deadwood Formation, where mineralization is primarily controlled by chemical or physical traps in the sedimentary rocks.
Quaternary Placer deposits comprise gold-bearing
gravels along Deadwood and Whitewood creeks. Placer mining by shaft and drifts occurred until 1883 when floodwaters washed away many of
the workings. Best known of these placer workings are the Deadwood and Rockerville mines.
On the Richmond Hill Gold Project, Tertiary-aged
replacement gold mineralization, and Precambrian iron formation-hosted gold mineralization were drilled during exploration programs in
the 1980s and 1990s. Subsequent drilling in 2023 identified the iron formation to be within the Proterozoic Flagrock Formation magnetite
and sulfide-bearing iron formation containing Tertiary gold-silver mineralization but no classic Homestake style siderite iron-formation
mineralization.
| | M3-PN240322
3 February 2025
Revision 0 |
59 |
Dakota
Gold
Technical
Report
The current genetic model Is that Tertiary-aged
gold and silver-bearing fluids possibly derived from the Tertiary intrusions migrated along steeply dipping fractures called verticals,
and gold was deposited in favorable structural or chemical traps as replacement deposits. Breccia pipes within Precambrian metasediments
and the Cambro-Ordovician Deadwood Formation are the most common gold-bearing host rocks. These breccia pipes are associated with Tertiary
alkalic magmatism that generated most of the Tertiary-aged gold deposits in the Homestake District.
Gold mineralization in the breccia pipes had previously
been identified in various targets within the Project area, including Richmond Hill, Richmond Hill North, Twin Tunnels, and Turnaround.
Dakota Gold followed up on this earlier work, and drill tested three of the six known breccia pipes within Twin Tunnels, Turnaround, and
Richmond Hill zones. To this Report date, drilling has not defined the limits of mineralization in these breccia pipes.
Dakota Gold’s current exploration program
seeks to confirm and expand upon known oxide gold resources and test the extent of gold sulfide resources. The zones included within the
mineral resource estimate are Richmond Hill, Richmond Hill North, Cleveland, Turnaround, Twin Tunnels, Cole Creek, and MW3.
Historical production prior to the 1980s in the
Project area was primarily from the underground mining of high-grade structures. With the advent of heap leaching technologies, a resurgence
of mining occurred, and open pit mining of these resources began. The Richmond Hill gold mine and Wharf deposits to the south are examples,
with the Wharf open pit mine being the only mine currently operating the Black Hills. Most gold is associated with pyrite at depth, and
near-surface gold is liberated by natural oxidation. Sulfide-rich deposits have been processed historically using fine grinding and cyanidation,
along with roasting, to recover the gold and silver. The Deadwood Formation hosts numerous historical mines, including Golden Reward,
Bald Mountain, Maitland, and Wasp. Further north and west in the Carbonate and Ragged Top districts, fluids related to Tertiary intrusions
have localized gold, silver, lead, zinc, and tungsten along faults or breccia pipes within the Pahasapa Limestone. Tertiary porphyry-hosted
gold deposits include the Gilt Edge and Hoodoo-Union Hill mines.
| | M3-PN240322
3 February 2025
Revision 0 |
60 |
Dakota
Gold
Technical
Report
Dakota Gold entered into the Option with Barrick
on October 14, 2021, and began ground exploration on the Project, including gravity, induced polarization (IP) survey and drilling.
Prior to optioning the Project, Dakota Gold flew an airborne geophysical survey over a wide area of the Homestake district. These are
summarized in the following sections from data sheets provided by Dakota Gold (Berry 2023a, 2023b).
From June 26 to August 1, 2020, New
Sense Geophysics Ltd. conducted a high-resolution helicopter-borne magnetic and gamma-ray spectrometric survey over the Homestake District
of Northern Black Hills, South Dakota. The survey consisted of 11,636-line km covering an area of 962.4 km2 and included the
Property (Figure 7-1). The purpose of the survey was to map Precambrian lithologies and structure, as well as Tertiary intrusive rocks
and associated alteration in outcrop, subsurface, and beneath cover. A report detailing the contractor’s work is dated August 31,
2020. Results of the survey are not publicly available.
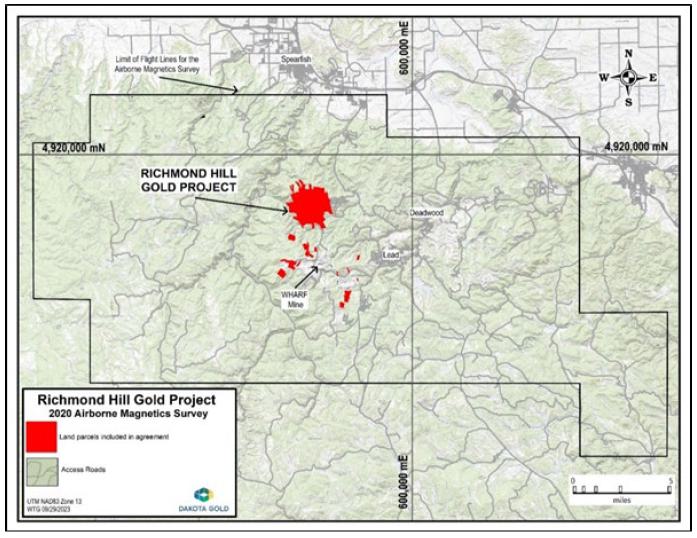
Figure 7-1: Airborne Magnetics Survey Flightline
Limits
The airborne magnetic survey was able to identify
the Tertiary intrusive centers and possibly larger feeder dikes. Most of the intrusive centers had previously been identified by surface
mapping either by exposed intrusive rocks or by doming of the Paleozoic and Mesozoic strata. Inversions of the magnetic data set were
also useful for identifying potential alteration associated with breccias and faults in the Richmond Hill Property. The radiometric survey,
especially thorium, identifies the larger Tertiary intrusive centers.
| | M3-PN240322
3 February 2025
Revision 0 |
61 |
Dakota
Gold
Technical
Report
It is the opinion of the QP for this section that
the airborne geophysical survey aided Dakota Gold in selecting the Richmond Hill Gold Project area to option and also aided interpreting
the extent geological units under areas of cover.
| 7.2 | Gravity Compilation and Survey |
In December 2021, geophysical contractor
Robert B. Ellis, Allan Spector and Associates, Ltd. and Magee Geophysical Surveys LLC (Magee) completed a report titled Gravity Compilation
and Processing (2021 Merge) Homestake District. Their work entailed compiling and merging historical Homestake gravity data with National
Geophysical Data Center gravity data and Magee gravity data for the Black Hills region.
During May and June 2022, Magee collected
additional gravity data to be added to the Dakota Gold data set. The survey acquired data from 550 gravity stations across the Black Hills
to fill in gaps in the regional data set and to replace older readings that potentially had elevation- or terrain-correction problems.
The survey area included Lawrence, Pennington, Butte, and Custer Counties of South Dakota, and Crook, Weston, and Niobrara Counties of
Wyoming (Figure 7-2). Although the survey encompassed a large area, additional stations were surveyed near Richmond Hill. No report was
completed summarizing this work, but maps and cross-sections were produced to assist with ongoing geologic interpretations.
The gravity survey was used to map out differences
in density of the various rock units. The Tertiary intrusive rocks generally have lower densities than the Precambrian metamorphic host
rocks. For example, there is a large intrusive body east of the Project area known as the Cutting Stock that is a distinctive gravity
low. The larger metamorphosed basalt units commonly generate gravity highs. The eastern contact of the metamorphosed basalt running through
the center of the Project does not generate a large density contrast. The lack of density contrast may be because of the heavy alteration
of the metamorphosed basalt adjacent to the north-south trending Tertiary breccia pipes or that the lower-density breccias tend to intrude
along this structure.
The gravity survey aided in interpreting the extent
of geological units in areas of cover, and drill-hole collars were spotted using a combination of this and other airborne and ground-based
surveys.
The QP responsible for this section of the Report
believes that the gravity survey aided Dakota Gold in interpreting the extent of geological units in areas of cover, and spotting drill-hole
collars benefited from a combination of this and other airborne and ground-based surveys.
| | M3-PN240322
3 February 2025
Revision 0 |
62 |
Dakota
Gold
Technical
Report
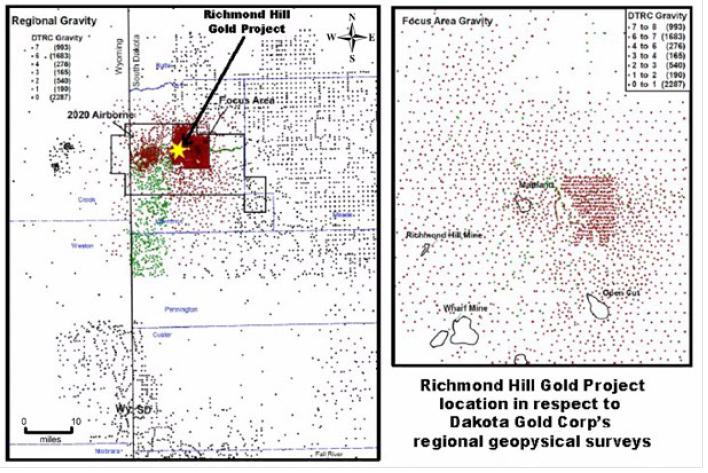
Source: Robert B. Ellis, Alan Spector and
Associates, Ltd. And Magee Geophysical Surveys LLC (2021)
Notes: Index maps showing compiled gravity
stations for the Black Hills regional area (left) and a focus area (right). Black dots are National Geophysical Data Center stations.
Green dots are historical Homestake (Spector) stations. Red dots are stations acquired for Dakota Gold in 2020 and 2021. Black Polygons
are outlines of Dakota Gold’s 2020 airborne geophysical survey and the primary gravity focus area. Blue polygons are County Lines.
Figure 7-2: Gravity Survey Station Locations
| 7.3 | Induced Polarization Survey |
From September 15 to October 2, 2022,
KLM Geoscience LLC conducted IP and resistivity geophysical surveys across four lines for 8.1 miles (13.1 Km) of survey lines at the Project
(Figure 7-3). The survey was a dipole–dipole-type array with a 200 m dipole size using a 5 Kw transmitter and 16 channel IP receiver.
The survey generated an IP response with parameters two seconds, time domain, 12 window, 150 ms, 55 ms delay after turn-off. Pseudo-sections
were generated initially, then inverted to model true sections. Using the survey results, Dakota Gold was able to plan drill holes more
accurately to intersect intended zones. KLM produced the Dakota Gold Richmond Hill DCIP Survey Logistical Report on October 2, 2022.
| | M3-PN240322
3 February 2025
Revision 0 |
63 |
Dakota
Gold
Technical
Report
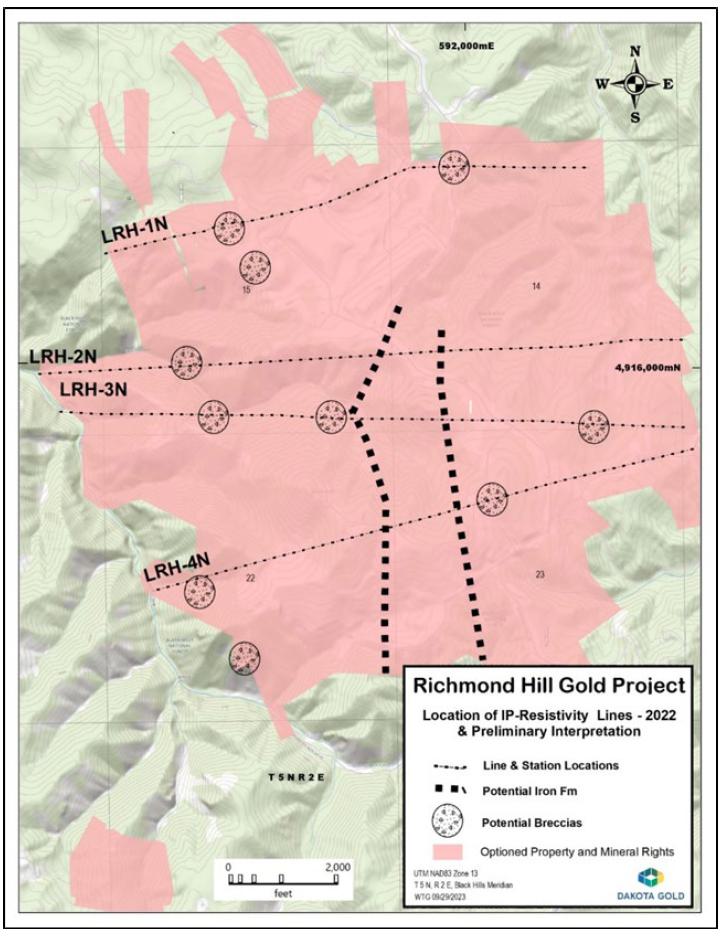
Figure 7-3: Geophysical IP – Resistivity
Survey Line Locations
| | M3-PN240322
3 February 2025
Revision 0 |
64 |
Dakota
Gold
Technical
Report
The IP survey identified possible breccias and
iron formation as identified by the resistivity and chargeability response. Several drill holes tested the chargeability anomaly that
was interpreted to be iron formation. The holes intersected Proterozoic Flagrock Formation magnetic and sulfide-bearing iron formation
containing Tertiary gold-silver mineralization but no classic Homestake-style siderite iron formation mineralization. Resistivity highs
corresponded to Proterozoic Ellison Formation quartzites and unaltered Proterozoic greenstones, and these were excluded from drill testing.
The QP responsible for this section of the Report
believes that the IP survey aided Dakota Gold in mapping iron formation and other non-mineralized rock formations at depth and that a
more detailed survey could be considered in areas lacking outcrop and needing additional subsurface information.
Small-scale geological mapping was conducted over
the Project starting November 1, 2021, and continuing to the end of 2024. Dakota Gold geologists mapped an area of 3.3 square miles
(8.6 km2) (Figure 7-4) to help guide drill-hole targeting, with the ultimate goal of integrating surface geology with drill-hole
lithography to produce a three-dimensional (3D) geological model. Much of the work has consisted of field-checking St. Joe Minerals, Bond
Gold, and LAC mapping and sample programs from the 1980s and 1990s. The recent mapping has yet to be compiled and is still in field note
form. Dakota Gold has stated that the mapping confirms earlier work by others (James Berry, pers. Comm.) and that the map provided as
Figure 7-4 is the most accurate as of the Report date.
The opinion of the QP for this section of the
Report is that the map provided in Figure 7-4 is of sufficient detail to allow targeted drilling.
| | M3-PN240322
3 February 2025
Revision 0 |
65 |
Dakota
Gold
Technical
Report
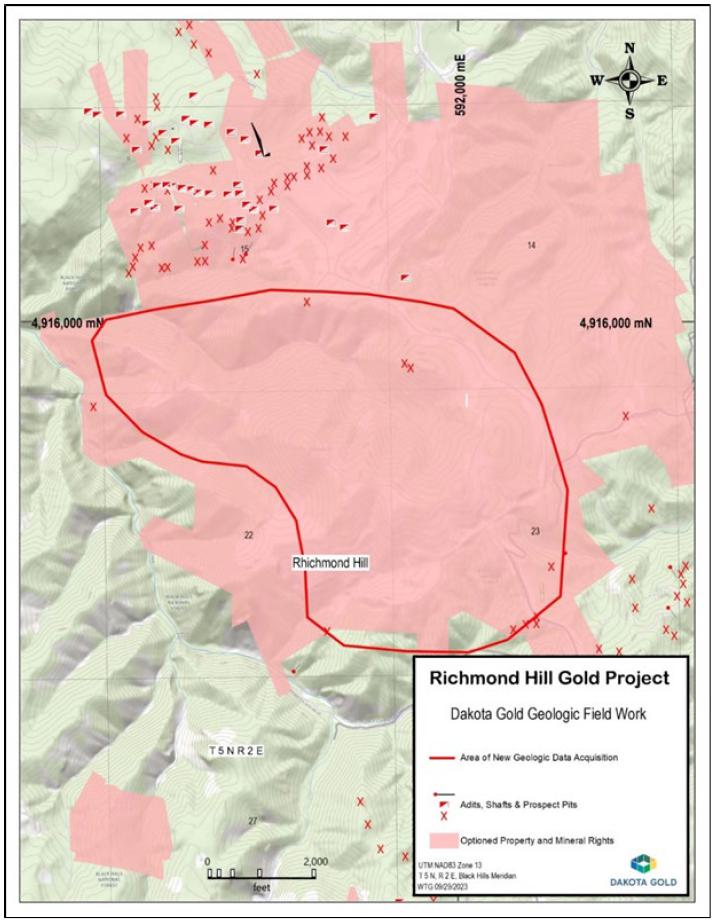
Figure 7-4: Dakota Gold Geologic Field Work
| | M3-PN240322
3 February 2025
Revision 0 |
66 |
Dakota
Gold
Technical
Report
Prior to Dakota Golds’ tenure, the Property
was drilled by at least 1,056 rotary, RC, and core holes testing multiple prospective areas within the claim boundary. Several of these
holes are excluded from the final database due to missing collar coordinates, downhole surveys, or other reasons. From optioning the Property
in 2021 to the effective date of this report, Dakota Gold has drilled an additional 148 diamond drill holes representing 157,504 ft. of
core drilling.
The drilling database provided to IMC consisted
of 1,058 drillholes and 457,392 ft. of drilling. This was after IMC removed hole RH-87-125C that was a duplication of RH-86-125C. Table
7-1 shows drilling by company. Figure 7-5 shows the distribution of drill holes by company.
Table 7-1: Drilling by Company
| | |
| | |
Final Database | |
| Company | |
Total
Holes | | |
No. of
Holes | | |
Feet | |
| Freeport | |
30 | | |
0 | | |
0 | |
| Legacy Drilling | |
951 | | |
836 | | |
272,608 | |
| St. Joe / Bond Gold | |
903 | | |
788 | | |
266,928 | |
| Homestake | |
48 | | |
48 | | |
5,680 | |
| Coeur | |
75 | | |
74 | | |
27,280 | |
| Pre-Dakota Gold Drilling | |
1,056 | | |
910 | | |
299,888 | |
| Dakota | |
148 | | |
148 | | |
157,504 | |
| 2022 | |
13 | | |
13 | | |
27,954 | |
| 2023 | |
61 | | |
61 | | |
98,610 | |
| 2024 | |
74 | | |
74 | | |
30,940 | |
| Total | |
1,204 | | |
1,058 | | |
457,392 | |
| | M3-PN240322
3 February 2025
Revision 0 |
67 |
Dakota
Gold
Technical
Report
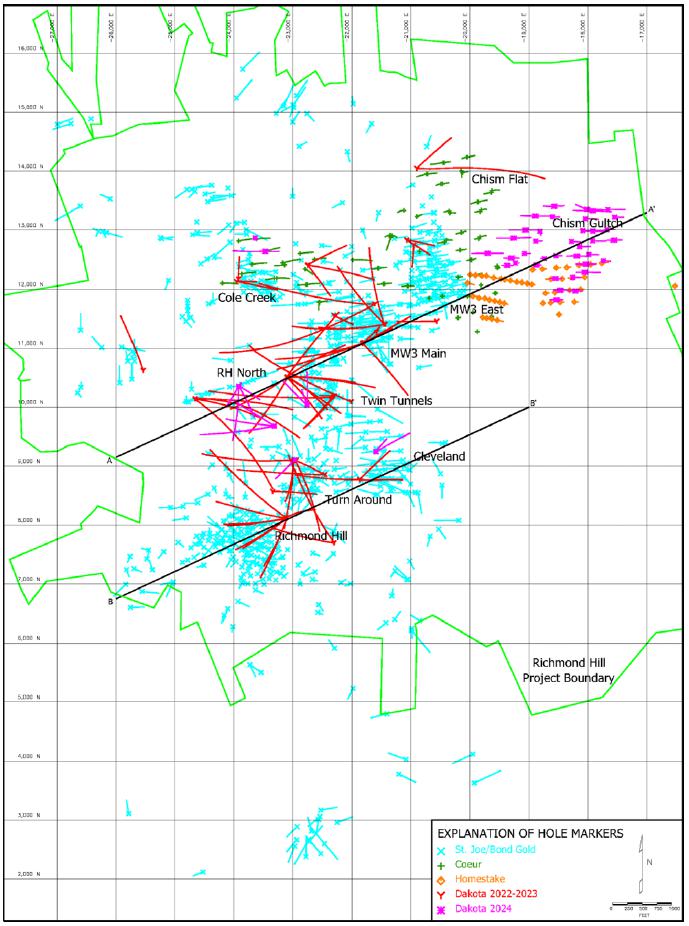
Figure 7-5: Richmond Hill Gold Project Drillholes
by Company
| | M3-PN240322
3 February 2025
Revision 0 |
68 |
Dakota
Gold
Technical
Report
| 7.5.2 | Freeport (1981 – 1983) |
Freeport completed 30 conventional rotary drill
holes. These holes were excluded from the final database as the collar locations are not known and contamination between samples was likely.
| 7.5.3 | St. Joe, Bond Gold, and Homestake (1984 – 1994) |
St. Joe, Bond Gold (while independently operated),
and Bond Gold (while owned by LAC), and Homestake completed multiple RC and core-drilling programs on various prospects across the Project
area. Separate drill-hole numbering series were used for each prospect area and were sequentially carried on between program operators.
There are no core or pulp samples available from these drilling programs. The April 2024 Technical Report states that 951 drill holes
were completed, however only 874 drill holes were acceptable for geological and resource modeling as 77 were excluded due to incomplete
collar and/or downhole surveys or large discrepancies between data sources. The database provided to IMC included 836 of these holes.
Accounting for the 77 excluded holes and the duplicated hole, there were an additional 37 holes that were not in the database provided
to IMC; IMC has no information on where these holes were located or why they were removed from the database.
Drill hole collar locations were surveyed at the
time of drilling into the Richmond Hill mine grid, which is a property specific grid. The original surveyed collar and control point coordinates
were obtained from scanned paper sheets with tabulated digital and handwritten survey coordinates under Scott Engineering Letterhead,
or directly from drill log headers. The Scott Engineering survey tickets are typical of survey instrument printouts from that time period,
although no instruments were specified in any of the historical documentation. Documentation comprising drill hole collar coordinate listings
from later in the programs indicates that Geodimeter Surveying Software was being used to manage surveying data.
The Richmond Hill mine grid was originally established
using a 1’ x 1’ true north grid with the US Locating Monument #41 assigned coordinates of X = 100,000 ft. and Y = 100,000
ft. Key control points for this grid were relocated by Dakota Gold personnel and Ponderosa Land Surveys, re-surveyed in US State Plane
Coordinates System, and a custom projection created for transferring between the Richmond Hill mine, US State Plane, UTM NAD 83, and Homestake
mine coordinate systems (Ponderosa 2024).
Drill hole dips were obtained directly from drill
log headers and applied only to the drill hole collar as most drill holes were relatively short. No instruments were specified for any
of the downhole surveys.
Drill logs comprise mostly handwritten sheets
with a header section for hole details and a description section for from-to intervals and geological descriptions plus varying amounts
of supporting information. A small number of drill logs from later holes comprise spreadsheets. Information from handwritten logs was
transferred to standardized digital drill logs containing hole number, collar coordinates, azimuth, dip, dates started and completed,
from-to depth intervals, sample numbers, gold values in oz/ton, silver values in ppm and codes for lithology, oxide or sulphide mineralization,
and alteration.
Coeur (Wharf Division) completed two drilling
campaigns comprising 75 RC holes (R19R-4674 to 4683 and R20R-4684 to -4747 & 4690A). There are no core or pulp samples available
from these drilling programs. Only 74 of the Coeur drill holes are acceptable for geological and resource modeling as one hole was excluded
due to a missing downhole survey.
The Coeur drilling was concentrated in the north
of the deposit area in the Chism Flat, MW3 East, and Cole Creek areas.
| | M3-PN240322
3 February 2025
Revision 0 |
69 |
Dakota
Gold
Technical
Report
Drill hole collar locations were surveyed at the
time of drilling into the UTM NAD 83 coordinate system. These were then converted to Richmond Hill mine grid coordinate system by Dakota
Gold using the procedures described by Ponderosa Land Surveys (Ponderosa 2024).
Drill hole dips were obtained by surveys completed
every 50 ft. downhole starting at the collar and also at the end of each hole. A Surface Recording Gyro (SRG) instrument was used for
the downhole surveys, but the actual instrument brand name was not specified. All data was exported to a spreadsheet provided by Coeur
to Dakota Gold.
Drill logs comprise colored acQuire strip logs
based on geological data stored in acQuire database software and exported to spreadsheets comprising hole numbers, collar coordinates,
azimuths, dips, dates started and completed, from-to depth intervals, sample numbers, gold and silver values, ABA, alteration, lithology,
mineralogy, oxidation, rock type, sulphide, and texture.
| 7.5.5 | Dakota Gold (2022 – 2024) |
J. Berry (2023b) assembled the drilling summaries
for 2022 and 2023 drilling from Dakota Gold news releases and is presented in whole with minor edits for clarity.
Dakota Gold began core drilling with one drill
rig on March 28, 2022. A second drill was added to the drilling project on November 9, 2022. The two drills have been working
since then, except for June 15 to September 30, 2022, when only one drill was in use. Thirteen holes were completed in 2022,
totaling 27,954.1 ft. The deepest hole was RH22C-001, which was drilled to 4,509 ft. The average hole depth was 2,150 ft.
The first two holes of the 2022 program tested
the stratigraphy of the northern portion of the Project area, looking for Homestake Formation in the core of the Bald Mountain Anticline.
Instead, only Ellison Formation was encountered below the Cambrian unconformity, indicating that the plunge of the Bald Mountain Anticline
was steeper than expected.
Drill holes RH22C-003 through RH22C-007 were drilled
in the Twin Tunnels area to test for high-grade gold mineralization in possible iron formation near the contact with a large greenstone
unit. These holes did not encounter any Precambrian iron formation-hosting gold mineralization, but did encounter broad zones of Tertiary
alteration in the greenstone and adjacent phyllites.
Drill holes RH22C-008 and RH22C-010 were drilled
west of Twin Tunnels to test for replacement-style mineralization in the Paleozoic section and to test a geophysical target. Both holes
yielded disappointing results. Drill holes RH22C-009 and RH22C-011 were drilled to test the area north of RH22C-005 at Twin Tunnels and
had good results; RH22C-012 and RH22C-013 were drilled to confirm the high-grade mineralization encountered in historical hole TT-86-26.
RH22C-013 confirmed the high-grade gold mineralization.
Sixty-one holes totaling 98,610 ft. were completed
at Richmond Hill during 2023. Hole depths varied from 429.5 to 6,046 ft. The average hole depth was 1,617 ft.
Drill holes RH23C-014 and RH23C-017 were drilled
at Twin Tunnels. RH23C-015 and RH23C-016 were drilled to test for deeper mineralization below the MW3 Main zone. Both holes encountered
gold mineralization in Precambrian phyllite and Tertiary iron formation-hosting breccias and fracture zones.
| | M3-PN240322
3 February 2025
Revision 0 |
70 |
Dakota
Gold
Technical
Report
Drill holes RH23C-019, RH23C-021, RH23C-022, RH23C-023,
RH23C-024, RH23C-025, RH23C-026, and RH23C-027 were drilled at the Turnaround breccia pipe. It was determined from these holes that the
breccia zone was extensive and went to depth, although not all portions of the breccia were well mineralized.
Drill holes RH23C-028 through RH23C-056 were drilled
as dual-purpose holes to confirm historical drilling results and obtain metallurgical test samples. The following holes were drilled at
Turnaround: RH23C-028, RH23C-029, RH23C-031, RH23C-035, RH23C-046, and RH23C-047.
Drill holes RH23C-028 and RH23C-046 were drilled
at the north end of the Turnaround breccia. Both holes encountered mineralization 800 ft. below the surface. Both holes encountered gold
mineralization.
Drill holes RH23C-029, RH23C-031, and RH23C-035
were drilled in the central portion of the Turnaround breccia. RH23C-031 and RH23C-035 encountered gold mineralization.
Drill hole RH23C-047 was drilled at the south
end of the Turnaround breccia. This hole intersected gold mineralization in the breccia pipe and the adjacent Precambrian phyllite country
rock.
Eight confirmation-metallurgical holes were drilled
at the Twin Tunnels breccia area: RH23C-030, RH23C-032, RH23C-033, RH23C-034, RH23C-036, RH23C-039, RH23C-041, and RH23C-048. Most of
the holes at Twin Tunnels breccia were drilled from the western portion of the breccia pipe over to the eastern side and fanned from north
to south. RH23C-048 was drilled from the southeastern side of the breccia to the west. RH23C-030 was lost during drilling and was offset
with RH23C-032.
Four holes were drilled at the Richmond Hill breccia
and historical pit area: RH23C-044, RH23C 050, RH23C-054, and RH23C-056.
Drill hole RH23C-044 was 1,030 ft. east of the
Richmond Hill breccia pipe. It intersected gold mineralization in Deadwood Formation, Tertiary breccia, and Tertiary-altered Flagrock
Formation.
Drill holes RH23C-050, RH23C-054, and RH23C-056
were drilled from the east side of the Richmond Hill mine historical pit and angled under the pit to confirm the mineralization that was
left below the pit. Elevated gold grades were encountered.
Drill holes RH23C-040, RH23C-042, and RH23C-043
were all drilled at the Cole Creek area, targeting Tertiary gold mineralization within the Deadwood Formation. RH23C-040 also encountered
Tertiary epithermal mineralization below the unconformity, hosted within Precambrian greenstone. All of the drill holes encountered gold
mineralization.
The following holes were drilled at the MW3 Main
prospective area: RH23C-049 and RH23C-051. RH23C-049 intersected gold mineralization. These intercepts were in Tertiary-mineralized Precambrian
phyllites and iron formation. RH23C-051 intersected gold mineralization in oxidized, lower Deadwood Formation, in Tertiary trachyte, and
also in Tertiary-mineralized Precambrian phyllite.
The following holes were drilled at the MW3 East
prospective area: RH23C-052, RH23C-053, and RH23C 055. RH23C-052 intersected gold mineralization in oxidized Deadwood Formation and in
Tertiary-mineralized Precambrian phyllite. RH23C-053 intersected gold mineralization in oxidized Deadwood Formation. RH23C-055 intersected
gold mineralization in oxidized Deadwood Formation, and in Precambrian-hosted Tertiary breccia.
The 2024 drilling consisted of 74 holes and 30,940
ft. of drilling. Three holes, RH24C-075, RH24C-076 and RH24C-077 were in the Cole Creek area of the deposit.
| | M3-PN240322
3 February 2025
Revision 0 |
71 |
Dakota
Gold
Technical
Report
Twelve holes, RH24C-078 to RH24C-082, RHC24C-086
to RH24C-088 and -088A, RH24C-099, RH24C-101 and RH24C-102 were in the Richmond Hill North area.
Two holes, RH24C-083 and RH24C-084 were in the
Cleveland area and one hole, RH24C-085 was in the Twin Tunnels area. The Cole Creek, Richmond Hill North, Cleveland, and Twin Tunnels
drilling were to fill in gaps in the drill coverage.
The remaining 56 holes, RH24C-089 to RH24C-098,
RHC24-100, and RH24C-103 to RH24C-147 were in the Chism Gulch area and were for the purpose of adding near surface, oxide, mineral resource
to the Project. This was a successful project, with most of the holes encountering mineralized material. Most of the mineralization was
in the Deadwood Formation and the drilling also encountered higher silver grades than are common in most of the deposit.
Drill holes were lined up to the proposed hole
positions using a Reflex TN14 Gyrocompass, which recorded the surface azimuth and dip of the drill hole. Drill hole collar locations were
surveyed by a licensed surveyor at the time of drilling into the Homestake mine coordinate system. These coordinates were converted to
Richmond Hill mine grid coordinate system by Dakota Gold using the procedures described by Ponderosa Land Surveys (Ponderosa 2024).
Drill hole dips were obtained by surveys completed
every 50 ft. downhole starting at the collar and also at the end of each hole. North-Seeking Gyro (NSG) instruments comprising Reflex
TN14 and Sprint_IQ tools were used. All data was exported to a spreadsheet provided by Dakota Gold.
Drill logs comprise mostly handwritten sheets
with a header section for hole details and a description section for from-to intervals and geological descriptions plus varying amounts
of supporting information. Information from handwritten logs was transferred to spreadsheets containing hole number, collar coordinates,
azimuths, dips, dates started and completed, from-to depth intervals, sample numbers, gold and silver values, lithology, mineralization,
geotechnical, geophysics, density, and breccia.
The QP responsible for Section 7.5 has reviewed
the drilling results and found that they are correctly represented as compared to the drilling results presented on geochemical laboratory
certificates. In addition, the following comments can be made regarding drilling results:
| · | The procedures for the drilling programs followed
standard industry procedures available at the time that the work was completed. |
| · | There is no currently known relationship between
recoveries and grades that could materially affect the accuracy and reliability of the results. |
| 7.6 | Hydrogeology and Geotechnical |
Dakota Gold has not initiated either hydrogeology
or advanced geotechnical characterization studies. Homestake is conducting ongoing hydrology and hydrogeology water quality testing related
to Richmond Hill mine post-closure operations. The QP responsible for Section 7.6 was not provided with information related to methodologies
or results of the sampling, but Dakota Gold would assume liability to continue with post-closure operations should they complete the Option.
The extent to which these studies affect this Report is covered further in Chapter 17. However, the reader is cautioned that ongoing reclamation
of the historical Richmond Hill mine represents a significant liability to the Project unless the mine site is included in new mining
operations.
| | M3-PN240322
3 February 2025
Revision 0 |
72 |
Dakota
Gold
Technical
Report
Dakota Gold has acquired no geotechnical data
such as rock strength parameters, as the Project is still in the early stages of exploratory drilling. However, Dakota Gold is collecting
recovery and rock quality designation (RQD) data as part of the drill-logging process. Drill core is assembled at the drill as it slides
out of the core tube before being placed into core boxes. The driller’s recovery measurements are double-checked during the core-logging
process, along with measuring and calculating the RQD. The QP responsible for Section 7.6 observed core handling at the drills and
core-logging facilities and confirmed that Dakota Gold and their drill contractor are following industry standard procedures.
| | M3-PN240322
3 February 2025
Revision 0 |
73 |
Dakota
Gold
Technical
Report
| 8 | Sample Preparation, Analyses, and Security |
Table 8-1 summarizes the historical and current
Project drilling programs in four chronological groups by which the sample preparation, analyses, and security procedures described in
this chapter are organized.
Table 8-1: Groups of Drilling Programs at Richmond
Hill Gold Project
| Company |
Year |
Comment |
| Viable Resources |
Pre 1981 |
Assembled land package. |
| Freeport Exploration Company |
1981–1983 |
Joint venture (JV) and lease agreement with Viable Resources |
| St. Joe |
1984 |
JV with Viable. |
| Conducted drilling program on Richmond Hill deposit breccia body. |
| 1985–1986 |
Conducted drilling programs on Richmond Hill deposit and property. |
| 1987–1988 |
Richmond Hill and Turnaround deposits permitted for mining. |
| Bond Gold |
1988 |
Acquired St. Joe gold division. |
|
Developed Richmond Hill as an open-cut heap leach
operation.
Conducted drilling with discovery at Cleveland. |
| LAC Minerals |
1989 |
Acquired Bond Gold and continued work through Bond. |
| 1990–1991 |
Conducted drilling programs on multiple prospects with positive results at MW3. |
| 1993 |
Final exploration activities at the site. |
| Homestake |
1994 |
Chism Gulch Drilling |
| Barrick Gold |
1994 |
Acquired LAC Minerals. |
| Coeur Mining Inc. |
2019–2020 |
Optioned property from Barrick Gold and conducted drilling program. |
| 2021 |
Terminated property option. |
| Dakota Territory Resources |
2021 |
Dakota Territory Resources optioned Property. |
| Dakota Gold |
2022–2024 |
Dakota Gold formed from merger of Dakota Territory and JR Resources. |
| 8.2 | Procedures for Historical Drilling Programs from 1981 to 1994 |
| 8.2.1 | Freeport (1981-1983) |
Freeport completed 30 conventional rotary drill
holes and submitted samples of varying lengths to an unknown laboratory for gold and silver analyses. As there are no supporting laboratory
certificates, these samples were excluded from the database for the Project.
| 8.2.2 | St. Joe, Bond Gold, and Homestake (1984-1994) |
St. Joe, Bond Gold (while independently operated),
Bond Gold (while owned by LAC), and Homestake completed multiple RC and core-drilling programs on various prospective areas across the
Project area. Separate drill-hole numbering series were used for each prospect area and were sequentially carried on between program operators.
There are no core or pulp samples available from these drilling programs. In all, 951 drill holes were completed for which information
is available. The number of these holes in the final database is 836.
| 8.2.2.2 | Sampling, Sample Preparation, Analysis, and Security |
The first four core holes drilled in 1984 at Richmond
Hill were shipped in their entirety to a metallurgical laboratory in Viburnum, Missouri, for testwork. The core was crushed to 0.75 inches,
split to obtain representative samples, prepared, then analyzed. Core from later holes was cut lengthwise, one-half was kept for reference
at St. Joe’s field office, and the other half sampled in 5 ft. intervals, and shipped for preparation and analyses.
| | M3-PN240322
3 February 2025
Revision 0 |
74 |
Dakota
Gold
Technical
Report
Dry RC drilling chips were sampled in 5 ft. intervals
and split on site under supervision of company geologists to create two samples of equal weight. One of these samples was shipped for
preparation and analyses, and the other sample stored for reference at the company’s field office. When water was encountered, it
was used during drilling, which necessitated using a wet splitter to split samples down to a manageable size. Samples were then dried
and split into two samples, and one was sent for preparation and analysis.
Most of the samples were shipped to Bondar-Clegg
laboratory in Lakewood, Colorado, and assayed there or at the Bondar-Clegg laboratory in North Vancouver, B.C. The security procedures
used for the shipments are not known. Bondar-Clegg was independent of St. Joe and Bond Gold, and was acquired by ALS Limited in 2002.
It is not known if Bondar-Clegg had any accreditations at the time the analytical work was completed between 1984 and 1993. A small number
of samples were sent to Nevada GSI laboratory in Sparks, Nevada. The history of this laboratory is not known with regards to independence
and accreditations.
Sample preparation procedures followed a standard
industry process of taking submitted samples through successive stages of reducing particle sizes and weights to obtain representative
subsamples for assaying. Procedures comprised drying, crushing (jaw or rolls), splitting (riffle), pulverizing (spindle, plate, bowl),
splitting (scoops), and analyses. Based on IMC file data, the standard Bondar-Clegg sample preparation consisted of drying the sample,
crushing to ¾ inch with a jaw crusher and crush to 75% passing -10 mesh with a cone crusher. A 250 g split was pulverized for analysis.
No details are available regarding sample preparation procedures used by Nevada GSI.
Gold assays were conducted by Bondar-Clegg and
Nevada GSI using 1-assay-ton samples; fusing using a standard lead collector fire assay; cupelling of the lead button to obtain a gold–silver
bead; removing silver by a mixture of nitric and hydrochloric acids; weighing of the final gold-only bead by a gravimetric balance; and
reporting results in ounces per ton, with lower detection limits (LDL) of 0.001, 0.002. or 0.0025. There were no over-limit analyses for
gold.
Silver analyses conducted by Bondar-Clegg and
Nevada GSI were determined using 10 gram samples, dissolving samples with a mixture of hot nitric and hydrochloric acids (aqua regia),
instrument reading using atomic absorption spectroscopy (AAS), and reporting of results in parts per million with LDLs of 0.1 or 0.2 ppm.
Samples with results over 30 ppm Ag were re-assayed, and results were reported in ounces per ton for Bondar-Clegg or parts per million
for Nevada GSI.
Most of the assay certificates are available and
were used to check against the existing database.
There is no information available for Homestake
sampling or analytical procedures. However, the area drilled by Homestake was also extensively drilled by Dakota Gold during their 2024
campaign.
| 8.2.2.3 | Quality Assurance and Quality Control Procedures |
Current industry standard QA/QC programs were
not part of any of the drilling completed by St. Joe, Bond Gold, and Homestake from 1984 to 1994, which is not unusual for that era of
exploration work.
However, St. Joe and Bond Gold did employ three
types of check assays with their drilling programs: first on 10% of the original samples using the same pulps at Bondar-Clegg; second
were third splits the company took every 50 ft. of drilling in the field and submitted to Bondar-Clegg; third were random checks done
at Skyline Labs (Skyline), Tucson, Arizona (St. Joe, 1986). In addition, the first 20 holes included splits taken by the company and submitted
to Bondar-Clegg and Cone Geochemical Lab in Denver, Colorado (Cone).
| | M3-PN240322
3 February 2025
Revision 0 |
75 |
Dakota
Gold
Technical
Report
Skyline was independent of St. Joe, Bond Gold,
and Lac Minerals. It is not known if Skyline had any accreditations at the time the analytical work was completed; however, it is currently
accredited under ISO 17025:2017. Cone was a highly regarded testing facility and was independent of St. Joe, Bond Gold, and Lac Minerals.
It is not known if there were any applicable accreditations.
Pulp samples submitted to Skyline and Cone for
checking gold assays used the following procedure: 1-assay-ton samples; fusing using a standard lead collector fire assay; cupelling of
the lead button to obtain a gold–silver bead; removing silver by a mixture of nitric and hydrochloric acids; instrument reading
using an AAS; and reporting of results in parts per million.
A check was conducted by IMC by pairing up 10
ft. composites from the St. Joe/Bond Gold, and Homestake drilling with the Dakota Gold drilling. At a maximum separation distance of 30
ft. there were 484 composite pairs. The mean gold grade of the St. Joe/Bond Gold/Homestake data was 0.025 oz/t versus 0.021 oz/t for the
Dakota Gold drilling. Examining a binomial statistic, the St. Joe/Bond/Homestake drilling was higher than the Dakota Gold drilling for
251 of the composite pairs and the Dakota Gold composite was higher for 233 of the pairs. This difference of 19 pairs passes a hypothesis
test at the 95% level of confidence; the critical value for the statistic is 44 pairs. This indicates the two populations are similar
with no evident biases.
| 8.3 | Procedures for Drilling Programs from 2019 to 2020 |
Coeur (Wharf Division) completed two drilling
campaigns comprising 75 RC holes (R19R-4674 to 4683 and R20R-4684 to -4747). Seventy-four of the holes are included in the final database
for the Project; one was excluded due to missing downhole survey information. There are no core or pulp samples available from these drilling
programs. The Coeur drilling was concentrated in the north of the deposit area in the Chism Flat, MW3 East, and Cole Creek areas.
| 8.3.2 | Sampling, Sample Preparation, Analysis, and Security |
RC drilling chips were sampled in 10 ft. intervals,
and a total of 2,721 samples were collected. Samples were initially shipped to Bureau Veritas Metals and Minerals in Vancouver; later
the shipping was switched to Sparks, Nevada. The security procedures used for the shipments are not known. Bureau Veritas is independent
of Coeur and Dakota Gold and is accredited under ISO/IEC 17025:2017.
Sample preparation procedures followed a standard
industry process of taking submitted samples through successive stages of reducing particle sizes and weights to obtain representative
subsamples for assaying. Procedures comprised drying if required, crushing to 70% passing (P70) 2 mm (jaw), splitting of 1 kg (riffle),
pulverizing to P85 200 mesh (bowl), splitting 30 g (scoops), and analysis.
Gold assays (code FA430) were conducted using
30 g samples; fusing using a standard lead collector fire assay; cupelling of the lead button to obtain a gold-silver bead; removing silver
by a mixture of nitric and hydrochloric acids; instrument reading using an AAS; and reporting results in ounces per ton with an LDL of
0.0001. There were no over-limit analyses for gold.
Silver analyses (code AQ300) were determined as
part of a multielement suite using 0.5 g samples; dissolving samples with a mixture of hot nitric and hydrochloric acids (aqua regia);
instrument reading using an inductively couple plasma–emission spectroscopy (ICP–ES); and reporting results in ounces per
ton with an LDL of 0.009. Samples with results over 30 ppm Ag were re-assayed, and results were reported in ounces per ton.
| | M3-PN240322
3 February 2025
Revision 0 |
76 |
Dakota
Gold
Technical
Report
Gold and silver analyses (code CN401) were also
conducted by cyanide leach using 15 g samples; dissolving samples with 30 ml of reagent; instrument reading using an AAS; and reporting
results in ounces per ton with an LDL of 0.001. As of the Report date, the Coeur gold and silver cyanide soluble assays are not in the
official database.
| 8.3.3 | Quality Assurance and Quality Control Procedures |
Current industry standard QA/QC programs were
not part of the drilling completed by Coeur from 2019 to 2020.
Approximately 10% of samples were sent for checking
to McClelland Laboratories, Inc., in Reno, Nevada. McClelland is independent of Coeur and is accredited under ISO/IEC 17025:2017.
Pulp samples submitted to McClelland for checking gold assays used the following procedure: 1-assay-ton samples; fusing using a standard
lead collector fire assay; cupelling of the lead button to obtain a gold–silver bead; removing silver by a mixture of nitric and
hydrochloric acids; instrument reading using an AAS; and reporting results in ounces per ton with an LDL of 0.001. There were no over-limit
analyses for gold.
There is not much spatial overlap between the
Coeur drilling and the other drilling campaigns. A check was conducted by pairing up 10 ft. composites from the St. Joe/Bond Gold drilling
with the Coeur drilling. At a separation distance of 30 ft. there were only 58 composite pairs. The mean gold grade of the Coeur drilling
is 0.012 oz/t versus 0.008 oz/t for the St. Joe/Bond Gold data. Examining a binomial statistic, the St. Joe/Bond drilling is higher than
the Coeur drilling for 21 of the composite pairs and the Dakota Gold composite is higher for 33 of the pairs, and they are the same value
for 4 pairs. This difference of 12 pairs passes a hypothesis test at the 95% level of confidence; the critical value for the statistic
is 16 pairs.
Comparing the Coeur drilling with the Dakota Gold
drilling resulted in 27 composite pairs at a 30 ft. separation distance. The mean gold grade of the Coeur drilling was 0.005 oz/t versus
0.009 oz/t for the Dakota Gold drilling. The Coeur composite is higher for 10 of the pairs and the Dakota Gold composite is higher for
17 of the pairs. This difference of 7 pairs passes a hypothesis test at the 95% level of confidence; the critical value for the statistic
is 11 pairs.
Though the available data is sparse, the Coeur
is comparable with the other drilling campaigns. There is no evidence of a bias between the various drilling programs.
| 8.4 | Procedures for Drilling Programs from 2022 to 2024 |
Dakota Gold completed three drilling campaigns
comprising 148 core holes: RH22C-001 to -0013, RH23C014 to -058, and RH23C-059 to RH24C-147 (including RH24C-088 and RH24C-088A). There
were four additional holes drilled in 2024, but they were not available in time to be included in this mineral resource update.
| 8.4.2 | Sampling, Sample Preparation, Analysis, and Security |
Core was cut in half lengthwise along one side
of the logging orientation line, and halves were stacked vertically for adequate drainage prior to sampling. Sample lengths varied based
on geological criteria and averaged roughly 5 ft. One-half of the core from each sample interval was kept for reference, and the other
half was placed in a smaller prenumbered polyweave sample bag. Multiple smaller bags were placed together in larger polyweave sample bags
that were sealed using numbered ziplock tags, and the larger polyweave bags were placed into numbered shipping bins. Each bin was accompanied
by a sample shipment form and sent for preparation and analysis. Initially a secure company truck shipped samples to ALS in Twin Falls, Idaho;
later tracked shipments used FedEx secure transportation to ALS in Winnipeg, Manitoba.
| | M3-PN240322
3 February 2025
Revision 0 |
77 |
Dakota
Gold
Technical
Report
ALS is independent of Dakota Gold and is accredited
under ISO/IEC 17025:2017 for selected analytical techniques. Sample preparation procedures followed a standard industry process of taking
submitted samples through successive stages of reducing particle sizes and weights to obtain representative subsamples for assaying. Procedures
comprised drying, crushing to P70 −2 mm (jaw), splitting of 250 g (riffle), pulverizing to P85 −75 μm (bowl), splitting
(scoops), and analyses.
Gold assays (code Au-AA23) were conducted using
30 g samples; fusing using a standard lead collector fire assay; cupelling of the lead button to obtain a gold-silver bead; removing silver
by a mixture of nitric and hydrochloric acids; instrument reading using an AAS; and reporting results in parts per million with an LDL
of 0.005. There were no over-limit analyses for gold.
Silver analyses (code ME-MS61) were determined
as part of a multielement suite using 1 g samples; dissolving samples with a four-acid digestion; instrument reading using an inductively
coupled plasma-emission spectroscopy (ICP-ES), and reporting results in ppm with a LDL of 0.01 ppm. Samples with results greater than
100 ppm were reanalyzed, and results were reported in parts per million with an LDL of 1 ppm (Ag-OG62).
Gold analyses (code Au-AA13) were also conducted
by cyanide leach using 30 g samples; dissolving samples with 30 ml of reagent; instrument reading using an AAS; and reporting results
in parts per million with an LDL of 0.03.
| 8.4.3 | Quality Assurance and Quality Control Procedures |
| 8.4.3.1 | Sample Preparation |
Dakota inserted certified reference materials
(CRM), blanks (BLK), and duplicates (DUP) into the batches of samples to be submitted for analyses using the following procedures.
CRMs were purchased commercially in bulk from
Klen International Pty Ltd, and from Rocklabs (a division of Scott Automation). Twenty-three separate CRMs were used, with grades ranging
from 0.453 to 14.6 ppm, and those up to 2.715 ppm were most commonly used. CRMs were chosen based on the character of mineralization (oxide
or sulfide) and lithology. Approximately 200 g were manually transferred to tin-top-sealed kraft bags, then placed in plastic ziplock
bags for protection.
Most of the BLKs comprised locally obtained coarsely
crushed marble at a nominal value of 0.005 ppm Au. Approximately 1 to 2 kg was manually transferred to polyweave sample bags similar to
those used for routine core samples. About 4% of the BLKs were a locally sourced rhyolite.
DUPs comprised field material, crushed material,
and pulverized material. Sample duplicates (SDP) were obtained from quarter-core splits of the parent core sample; crushed duplicates
(CDP) from a 50% split of the crushed parent sample; and pulp duplicates (PDP) from a 50% split of the pulverized parent sample.
CRMs and BLKs were inserted after roughly every
11th routine sample, alternating between the two, although this sometimes varied depending on mineralization. A sequence of
DUPs comprising one SDP, one CDP, and one PDP, was inserted after roughly every 36th routine sample.
The same consecutive numbering sequence was used
for the core and quality control (QC) samples. CRMs and BLKs were inserted at an overall rate of approximately 5% for each sample type;
SDPs, CDPs, and PDPs were inserted at roughly 3% for each sample type.
The QA/QC data based reviewed by IMC consisted
of 1,828 CRMs, 1071 BLKs, 129 SDPs, 127 CDPs, and 127 PDPs.
| | M3-PN240322
3 February 2025
Revision 0 |
78 |
Dakota
Gold
Technical
Report
The QA/QC database included 1701 BLKs. This amounts
to about 5.3% of the Dakota Gold sample intervals. Most of the gold assays were at, or near, the detection limit of 0.005 ppm. Only nine
of the samples were greater than or equal to 0.02 ppm (0.0006 oz/t). The highest gold assay was 0.064 ppm (0.0018 oz/t). These are excellent
results, indicating minimal contamination from higher grade samples during sample preparation.
The results for silver were also good. Only five
of the samples were greater than or equal to 0.5 ppm (0.015 oz/t) and the highest assay was 1.07 ppm (0.031 oz/t). In particular, the
rhyolite material used for a blank appears to have silver above detection limits.
| 8.4.3.3 | Certified Reference Materials (Standards) |
The QA/QC database included 1828 CRM samples.
This amounts to about 5.7% of the Dakota Gold sample intervals. The top 6 most utilized CRMs amounted to 70% of the data.
Figure 8-1 shows the control chart for gold for
OXE182. The certified mean and standard deviation gold values are 0.663 ppm and 0.012 ppm respectively. The control line for the mean
(red), +2 standard deviations (green), and +3 standard deviations (magenta) are shown on the chart.
There are 301 samples for this CRM of which 28
(9.3%) are outside the 2 standard deviation limits and 10 (3.3%) are outside of the 3 standard deviation limits.
Dakota Gold used CRM tolerance limits of +2
standard deviations and +8% of the certificate mean value to assess laboratory performance. Only the two low values on the right
side of the chart are outside the +8% control limits.
Figure 8-2 shows the control chart for gold for
OXD183. The certified mean and standard deviation gold values are 0.453 ppm and 0.008 ppm respectively. There are 276 samples for this
CRM of which 30 (10.8%) are outside the 2 standard deviation limits and 8 (2.9%) are outside of the 3 standard deviation limits. Only
1 of the samples is outside the +8% of the certified mean value.
Figure 8-3 shows the control chart for gold for
SJ121. The certified mean and standard deviation gold values are 2.715 ppm and 0.062 ppm respectively. There are 253 samples for this
CRM of which 12 (4.7%) are outside the 2 standard deviation limits and 6 (2.4%) are outside of the 3 standard deviation limits. Four of
the 6 samples are less than 2 ppm and are not shown on the chart. The assay values were 1.01, 0.995, 0.448, and 0.0025 ppm. It seems that
these may have been labeled incorrectly for insertion into the assay stream. The 0.448 ppm gold assay is likely OXD183; the silver assay
is also consistent with that CRM. The 0.995 ppm sample is likely SG115; the silver assay is consistent with that. The 0.0025 ppm sample
is probably BLK. The 1.01 ppm assay is also consistent with CRM SG115, but there was not a silver assay for that sample. Only 1 of the
samples shown on the chart is outside the +8% of the certified mean value limit.
Figure 8-4 shows the control chart for gold for
SG115. The certified mean and standard deviation gold values are 1.017 ppm and 0.015 ppm respectively. There are 213 samples for this
CRM of which 50 (23.4%) are outside the 2 standard deviation limits and 32 (15.0%) are outside of the 3 standard deviation limits.
This is a large number of samples outside of the control limits. It seems possible that the certified standard deviation of 0.015 ppm
is lower than the actual value. Thirteen samples are outside the +8% of the certified mean value limit.
| | M3-PN240322
3 February 2025
Revision 0 |
79 |
Dakota
Gold
Technical
Report
Figure 8-5 shows the control chart for gold for
Si96. The certified mean and standard deviation gold values are 1.801 ppm and 0.031 ppm respectively. There are 137 samples for this CRM
of which 13 (9.5%) are outside the 2 standard deviation limits and 6 (4.4%) are outside of the 3 standard deviation limits. There is one
sample of 1.075 ppm gold that is not shown on the chart. There is a good chance that this was a mis-labeled sample. It did not have a
silver assay to assist in correlating it with a different standard. Two of the samples on the chart are outside the +8% of the
certified mean value limit.
The results of the assays for CRMs are good. The
number of samples outside of the +3 standard deviation control limits are typical for gold assays on CRMs. Also, there are
relatively few samples outside of the +8% of the mean control limits.
| | M3-PN240322
3 February 2025
Revision 0 |
80 |
Dakota
Gold
Technical
Report
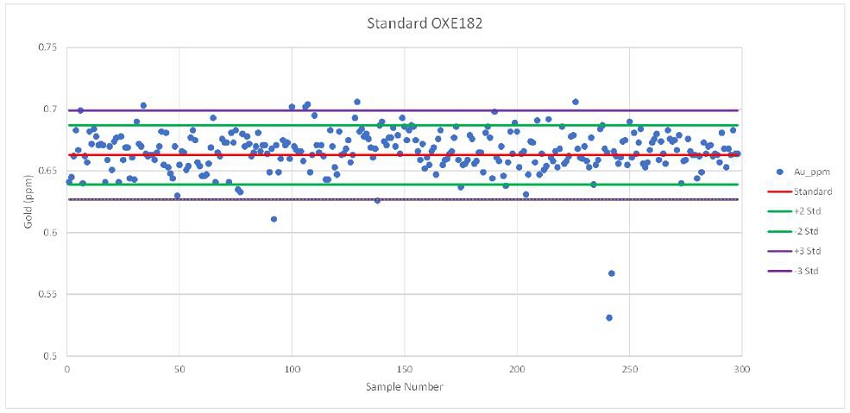
Figure 8-1: Control Chart for CRM OXE182 Gold
Assays
| | M3-PN240322
3 February 2025
Revision 0 |
81 |
Dakota
Gold
Technical
Report
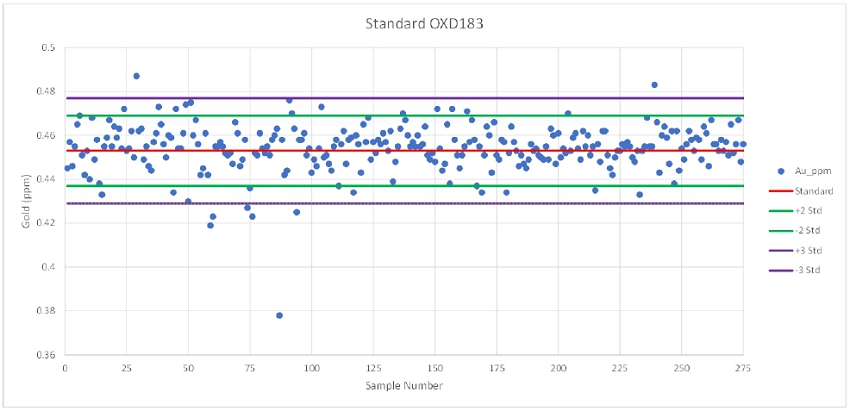
Figure 8-2: Control Chart for CRM OXD183 Gold
Assays
| | M3-PN240322
3 February 2025
Revision 0 |
82 |
Dakota
Gold
Technical
Report
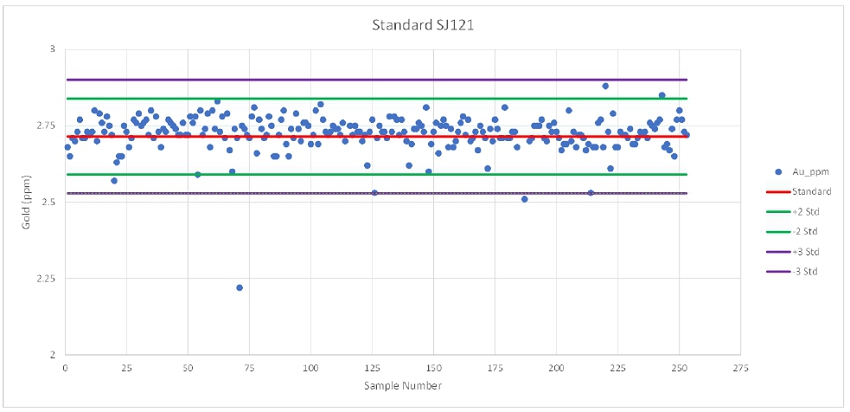
Figure 8-3: Control Chart for CRM SJ121 Gold
Assays
| | M3-PN240322
3 February 2025
Revision 0 |
83 |
Dakota
Gold
Technical
Report
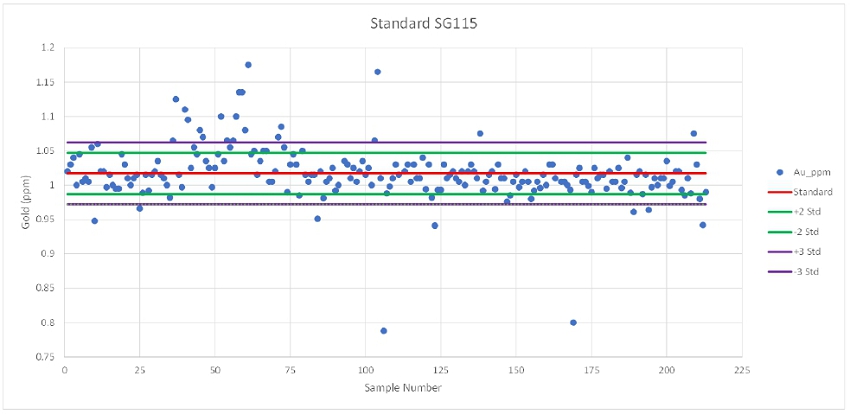
Figure 8-4: Control Chart for CRM SG115 Gold
Assays
| | M3-PN240322
3 February 2025
Revision 0 |
84 |
Dakota
Gold
Technical
Report
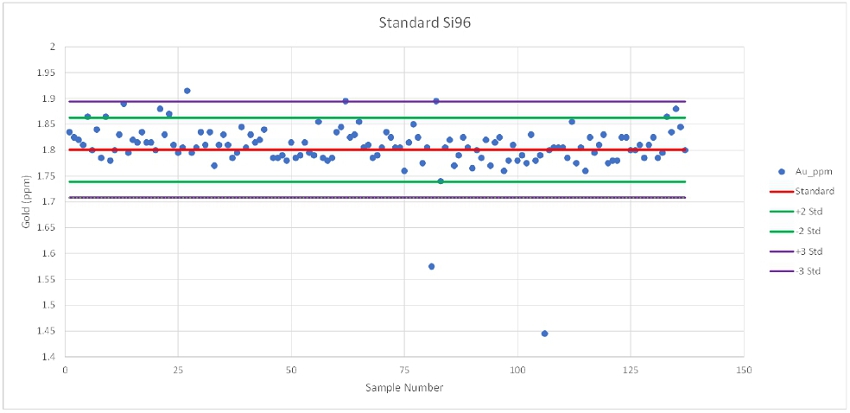
Figure 8-5: Control Chart for CRM Si96 Gold
Assays
| | M3-PN240322
3 February 2025
Revision 0 |
85 |
Dakota
Gold
Technical
Report
As discussed in Section 8.4.3.1, Dakota Gold
conducted three types of duplicate samples for their drilling program:
| · | Pulp duplicate: a check assay using the same
pulp as the original sample. |
| · | Crusher duplicate: an additional pulp is developed
from the course crushed material. |
| · | Sample duplicate: a quarter of the original drill
core is submitted as a check sample. |
Figure 8-6 presents results for the pulp duplicates
versus the original assays. The top graph is an xy plot of the data. All the samples cluster relatively closely to the 1:1 line plotted
on the graph. They are also relatively evenly distributed above and below the line indicating there is no apparent bias in the results.
The middle graph is a %HRD (Half Relative Deviation)
plot of the data. Each point of the x-axis is the average of the original and pulp duplicate for each sample pair. The y-axis represents
half of the difference in the assay pairs as a percentage of the mean value of the pair. It is a positive value when the check assay is
higher than the original assay. For %HRD plots there are typically high relative errors at low values, particularly near detection limits.
The table at the bottom shows that for all data there are 127 sample pairs with a mean gold grade of 0.443 ppm for the original assay
and 0.441 ppm for the check assay. The average %HRD value for the sample pairs in 0.26% and is an estimate of bias. There is negligible
bias between the original samples and the pulp checks. The table at the bottom shows results for assay pairs greater than 0.1 ppm to filter
the lowest sample pairs. It also shows results for assay pairs above and below 0.5 ppm.
%HARD (Half Absolute Relative Deviation) is derived
from taking the absolute value of the %HRD values and averaging them. This is a measure of assay precision. For all data this is interpreted
that any one assay is estimated to be +5.56% of the true value. Precision is better (lower %HARD value) for assays above 0.1 and 0.5 ppm.
These are good results, showing it is relatively
easy to replicate assays. This implies relatively fine-grained gold particles that are relatively easy to sample.
Figure 8-7 presents results for the crusher duplicate
versus the original assays. The xy plot shows good results with the assays clustered relatively closely to the 1:1 line and relatively
evenly distributed above and below the line.
The %HRD graph and the table show that for the
127 sample pairs the %HRD (bias) is 0.35% and the %HARD (precision) is 5.04%, i.e. any one assay can be expected to be within 5% of the
true value. This is a slightly better precision (lower number) than the estimate for the pulp data. Normally it would be expected that
the pulp check assays would have better precision than the crusher checks. However, the difference is the results is not material.
Figure 8-8 presents results for the sample duplicate
versus the original assays. The xy plot results are good, though there is more scatter in the data. This is expected since the duplicate
sample is based on a quarter split of the original core. The %HARD estimate for all data is 9.77% meaning any one assay can be expected
to be within 9.77% of the true value.
This is a very good result for a sample duplicate,
especially in the case where the duplicate was a quarter core instead of the half core sample the original sample was based on. The reduction
in the sample size is expected to add variability to the assay result.
| | M3-PN240322
3 February 2025
Revision 0 |
86 |
Dakota
Gold
Technical
Report
The QP for this section is of the opinion that
the procedures for sampling, sample shipping, sample preparation, and for analyzing gold and silver for the 1984 to 2020 drilling programs
followed acceptable standard analytical laboratory procedures available at the time the work was completed. Although current industry
standard QA/QC monitoring programs were not part of these drilling programs, the historical drilling data are acceptable for geological
and resource modeling. A comparison of the St. Joe/Bond Gold data with Dakota Gold data for 10 ft. composites within 30 ft. of each other
indicates the St. Joe/Bond Gold drilling data are sufficiently similar to current Dakota Gold drilling data. There is not much overlap
between the Coeur drilling and the other drilling campaigns, but comparisons of composite pairs that are relatively close indicate the
Coeur drilling data is similar to the St. Joe/Bond Gold data and also the Dakota Gold data.
The QP Is of the opinion that for the 2022 to
2024 Dakota Gold drilling programs, the procedures used for sampling, sample shipping, sample security, sample preparation, analyzing
gold and silver, and QA/QC monitoring are appropriate for obtaining reliable data that is acceptable for geological and resource modeling.
| | M3-PN240322
3 February 2025
Revision 0 |
87 |
Dakota
Gold
Technical
Report
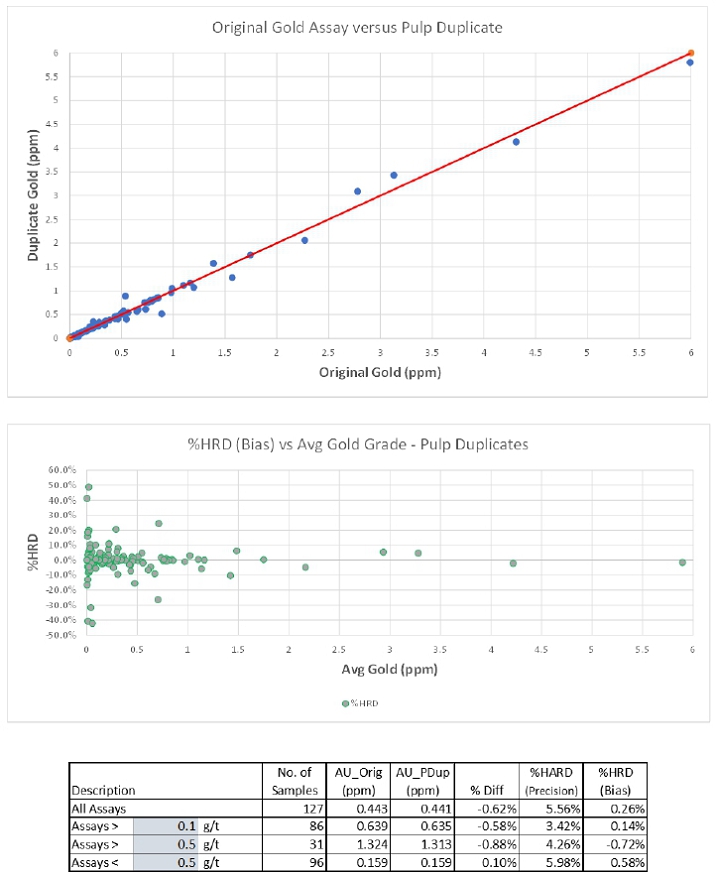
Figure 8-6: Original Gold Assay versus Pulp
Duplicate
| | M3-PN240322
3 February 2025
Revision 0 |
88 |
Dakota
Gold
Technical
Report
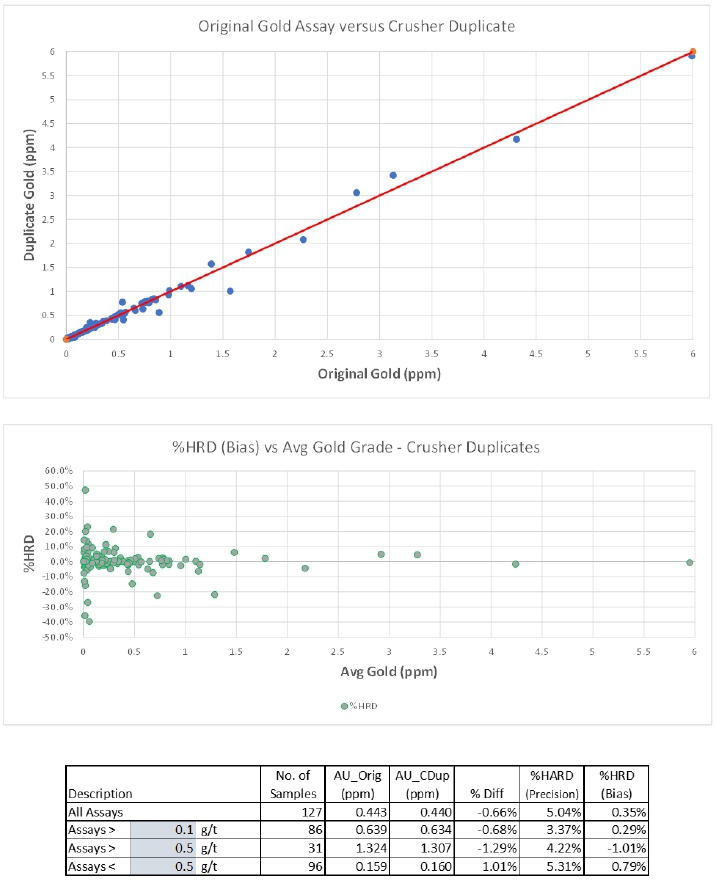
Figure 8-7: Original Gold Assay versus Crusher
Duplicate
| | M3-PN240322
3 February 2025
Revision 0 |
89 |
Dakota
Gold
Technical
Report
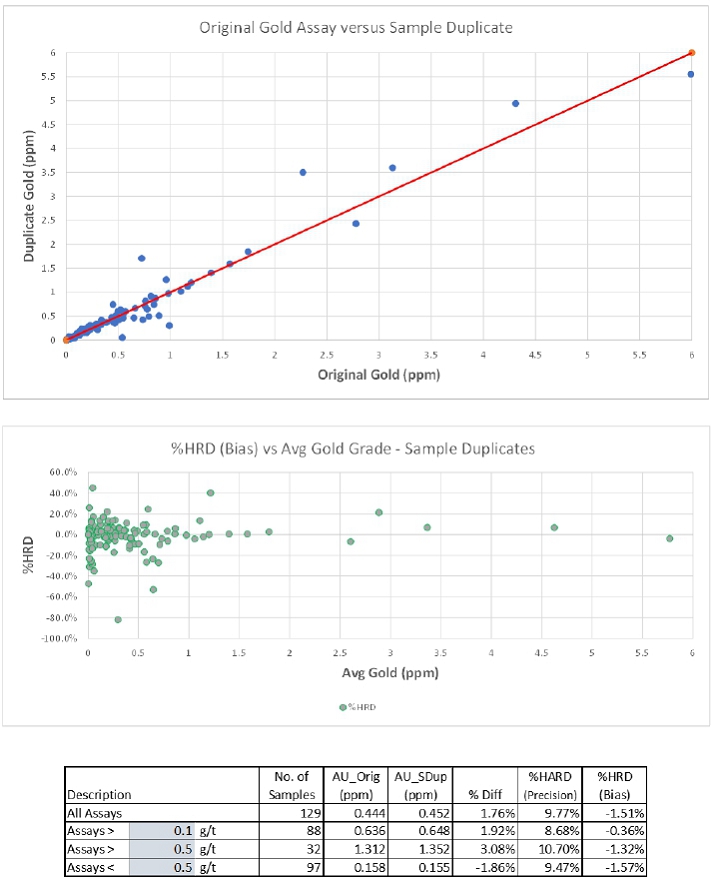
Figure 8-8: Original Gold Assay versus Sample
Duplicate
| | M3-PN240322
3 February 2025
Revision 0 |
90 |
Dakota
Gold
Technical
Report
| 9.1 | Drillhole Sampling Data |
The sampling data was verified by comparing the
database entries with assay certificates or other available data listings for a representative portion of the data. The drilling data
can be separated into three groups:
| · | Dakota Gold drilling from 2022 to the present. |
| · | Coeur drilling from 2019 to 2020. |
| · | St. Joe, Bond Gold, LAC, and Homestake drilling
1984 to 1994. |
| 9.1.1 | Dakota Gold Drilling |
The Dakota holes in the database were compared
with assay certificates for 19 holes, as shown in the upper portion of Table 9-1. This represents about 13% of the Dakota Gold holes.
Certificates were available for all the requested holes. There were no errors for gold or silver assays versus the certificates for the
holes reviewed.
The Coeur holes in the database were compared
with assay certificates for six holes, as shown in the lower portion of Table 9-1. This represents about 8% of the 74 Coeur holes. Certificates
were available for all the requested holes. There were no errors for gold or silver assays versus the certificates for the holes reviewed.
The Coeur drilling was reverse circulation (RC) drilling and the sample length was 10 ft., so there tends to be fewer samples per hole
than the Dakota Gold and St. Joe/Bond Gold drilling.
| 9.1.3 | St. Joe/Bond Gold, LAC and Homestake Drilling |
Assay certificates were requested for 57 of the
holes. This represents about 7% of the 836 legacy holes drilled between 1984 to 1994. Table 9-2 summarizes the results of the comparisons
for gold. The following is noted:
| · | Complete assay certificates were available for
35 of the holes. Most of the assays were done by Bondar-Clegg, though two of the holes were assayed by Nevada GSI, Inc. |
| · | There were 16 holes without certificates, but
did have data printouts that showed the database as of 1990. These show that there has been no tampering with the database since the time
of the printouts. Some of these holes were assayed at an internal Bond Gold laboratory on the Property. |
| · | There were four holes, CV-90-43, RH-86-92, RCM-19,
and RCM-5 with no available certificate data. |
| · | There were two holes, RH-85-52 and TT-90-51 with
only partial certificate data available. |
There were three large errors in the data that
were due to missing decimal points in the data entry. These were corrected. Other than these, there were no other assays in the data that
were over 1 oz/t gold. There were also nine smaller discrepancies encountered. These are mostly due to re-assays inserted into the database
to replace original values. For RH-84-3 there are certificates for check assays performed by Cone Geochemical and some Bondar-Clegg repeat
assays.
Table 9-3 summarizes the results for silver. The
April 2024 Technical Report did not include mineral resources for silver and it is assumed the silver database has not been previously
verified. The silver assays generally compared well with the assay certificates, or the 1990 printouts for holes without certificates.
However, there were also some significant (order of magnitude errors). The most significant errors, in holes CC-87-55 and CV-90-39, were
due to missing decimal places in the data entry and resulted in erroneous values exceeding 1000 ppm.
| | M3-PN240322
3 February 2025
Revision 0 |
91 |
Dakota
Gold
Technical
Report
As a result of the errors encountered, all the
remaining assays in the St. Joe/Bond Gold data greater than 1000 ppm were verified with certificates. This was six additional assays,
of which five were incorrect. There is only one legitimate silver assay above 1000 ppm in the data, an assay of 1139 ppm in hole MW3-90-152.
Silver assays were not done for about eight of the holes that were
reviewed.
9.1.4 Other
Reviews
As discussed in Section 8.2.2.3 and 8.3.3, 10
ft. drillhole composites from the various drilling campaigns were compared at separation distances up to a maximum of 30 ft. The comparisons
indicated a good comparison of Dakota Gold drilling data with St. Joe/Bond Gold data. Comparison of Coeur drilling with Dakota Gold and
St. Joe/Bond Gold drilling also indicated reasonable results, though there is not a lot of spatial overlap of the Coeur drilling with
the other campaigns. The drilling data was reviewed in detail on cross sections.
Drillhole collars were also checked against topography.
With the significant topographic relief at the Richmond Hill site, mis-located drill holes should stand out on the sections. No significant
issues were noted.
It is the opinion of the QP for this section that
the Richmond Hill assay database is adequate for the estimation of mineral resources and mineral reserves.
Table 9-1: Comparison of Assay Certificates with Database
for Dakota and Coeur Drilling
| |
No.
of |
Sample Number
Range |
|
|
Assay
Discrepancies |
|
| Hole Id |
Samples |
Begin |
End |
Assay Lab |
Certificate? |
Major |
Minor |
Comments |
| Dakota Drilling: |
|
|
|
|
|
|
|
|
| RH22C-004 |
578 |
E591334 |
E591970 |
ALS |
Y |
|
|
No errors for Dakota gold
or silver assays versus |
| RH 22C-005 |
590 |
E585001 |
E585648 |
ALS |
Y |
|
|
certificates for any of the
holes reviewed. |
| RH22C-006 |
787 |
E585650 |
E586525 |
ALS |
Y |
|
|
|
| RH23C-014 |
483 |
H590118 |
H590705 |
ALS |
Y |
|
|
|
| RH23C-016 |
227 |
C818002 |
C818267 |
ALS |
Y |
|
|
|
| RH23C-017 |
348 |
H590706 |
H591118 |
ALS |
Y |
|
|
|
| RH23C-021 |
498 |
C818270 |
H591541 |
ALS |
Y |
|
|
|
| RH23C-031 |
415 |
C822295 |
K050254 |
ALS |
Y |
|
|
|
| RH23C-034 |
409 |
K052001 |
K052455 |
ALS |
Y |
|
|
|
| RH23C-039 |
378 |
K055651 |
K056070 |
ALS |
Y |
|
|
|
| RH23C-063 |
278 |
K053680 |
H780398 |
ALS |
Y |
|
|
|
| RH24C-083 |
93 |
H765147 |
H765255 |
ALS |
Y |
|
|
|
| RH24C-091 |
33 |
H788549 |
H788584 |
ALS |
Y |
|
|
|
| RH24C-101 |
86 |
H788851 |
H788947 |
ALS |
Y |
|
|
|
| RH24C-105 |
78 |
H766145 |
H766229 |
ALS |
Y |
|
|
|
| RH 24C-114 |
35 |
H789527 |
H789565 |
ALS |
Y |
|
|
|
| RH24C-123 |
41 |
H774671 |
H774715 |
ALS |
Y |
|
|
|
| RH 24C-132 |
68 |
K591049 |
K591123 |
ALS |
Y |
|
|
|
| RH24C-141 |
63 |
K591266 |
K591335 |
ALS |
Y |
|
|
|
| Coeur Drilling: |
|
|
|
|
|
|
|
|
| R19R-4678 |
42 |
24956 |
25004 |
Bureau Veritas |
Y |
|
|
No errors for Coeur gold
or silver assays versus |
| R20R-4690 |
72 |
25581 |
25666 |
Bureau Veritas |
Y |
|
|
certificates for any of the
holes reviewed. |
| R20R-4702 |
72 |
26269 |
26354 |
Bureau Veritas |
Y |
|
|
|
| R20R-4729 |
42 |
27287 |
27335 |
Bureau Veritas |
Y |
|
|
|
| R20R-4743 |
70 |
27759 |
27839 |
Bureau Veritas |
Y |
|
|
|
| R20R-4745 |
60 |
27914 |
27982 |
Bureau Veritas |
Y |
|
|
|
| | M3-PN240322
3 February 2025
Revision 0 |
92 |
Dakota
Gold
Technical
Report
Table 9-2: Comparison of Assay Certificates with Database for Legacy
Drilling – Gold
| |
No.
of |
Sample
Number Range |
|
|
Assay
Discrepancies |
|
| Hole
Id |
Samples |
Begin |
End |
Assay
Lab |
Certificate? |
Major |
Minor |
Comments |
| Legacy
Drilling: |
|
|
|
|
|
|
|
|
| BZ-92-21 |
200 |
306901 |
307100 |
|
No, Note 1. |
1 |
|
Sample 306964, 0.004 opt entered as 4 opt |
| CC-86-11 |
60 |
30081 |
30140 |
Bondar-Clegg |
Y |
|
|
|
| CC-86-16 |
76 |
30491 |
30566 |
Bondar-Clegg |
Y |
|
|
|
| CC-87-55 |
76 |
59601 |
59676 |
Bondar-Clegg |
Y |
|
|
|
| CCH-89-8 |
104 |
76661 |
76764 |
Bondar-Clegg |
Y |
|
|
|
| CP-86-2 |
83 |
40101 |
40183 |
Bondar-Clegg |
Y |
|
|
|
| CV-88-4 |
88 |
62171 |
62258 |
Bondar-Clegg |
Y |
|
|
|
| CV-89-19 |
89 |
74571 |
74659 |
Bondar-Clegg |
Y |
|
|
|
| CV-89-23 |
100 |
78491 |
75080 |
Bondar-Clegg |
Y |
|
|
|
| CV-90-39 |
69 |
78351 |
78419 |
Bondar-Clegg |
Y |
|
|
|
| CV-90-43 |
81 |
86201 |
86281 |
No
Data |
No |
|
|
No certificate data provided |
| DB-91-6 |
59 |
302851 |
302909 |
|
No, Note 1. |
|
|
|
| EB-91-4 |
68 |
306421 |
306488 |
|
No, Note 1. |
|
|
|
| HE-91-2 |
131 |
303881 |
304011 |
|
No, Note 1. |
1 |
|
Sample 303984, 0.002 opt entered as 2 opt |
| HI-88-2 |
139 |
66351 |
66489 |
Bondar-Clegg |
Y |
|
|
|
| HW86-4 |
100 |
45731 |
45830 |
Bondar-Clegg |
Y |
|
|
|
| LP-86-10 |
70 |
41501 |
41570 |
|
No, Note 1. |
|
|
|
| MW3-88-6 |
90 |
61091 |
61180 |
Bondar-Clegg |
Y |
|
|
|
| MW3-90-17 |
51 |
77891 |
77941 |
Bondar-Clegg |
Y |
|
|
|
| MW3-90-33 |
74 |
80181 |
80254 |
Nevada
GSI, Inc |
Y |
|
|
|
| MW3-90-45 |
65 |
87321 |
87385 |
|
No, Note 1. |
|
|
|
| MW3-90-115 |
79 |
98331 |
98409 |
|
No, Note 1. |
|
|
|
| MW3-90-135 |
55 |
99461 |
99515 |
|
No, Note 1. |
|
|
|
| MW3-90-136 |
70 |
99521 |
99590 |
|
No, Note 1. |
|
|
|
| MW3-90-151 |
30 |
92271 |
92300 |
Bondar-Clegg |
Y |
|
|
|
| MW3-90-152 |
34 |
92311 |
92344 |
Bondar-Clegg |
Y |
|
|
|
| MW3-90-155 |
51 |
92431 |
92481 |
Bondar-Clegg |
Y |
|
|
|
| MW3-90-22 |
56 |
79781 |
79836 |
|
No, Note 1. |
|
|
|
| MW3-90-52 |
75 |
80671 |
80745 |
|
No, Note 1. |
|
|
|
| MW3-90-93 |
129 |
91561 |
91689 |
Nevada
GSI, Inc |
Y |
|
|
No
certificate data for first 13 samples. |
| PG-88-1 |
112 |
62341 |
62452 |
|
No, Note 1. |
|
|
|
| PG-91-13 |
91 |
305001 |
305091 |
|
No, Note 1. |
|
|
|
| RCM-19 |
18 |
2473 |
2490 |
|
No |
|
|
Only data provided was Excel spreadsheet. |
| RCM-5 |
30 |
2150 |
2179 |
|
No |
|
|
Only data provided was Excel spreadsheet. |
| RH-84-3 |
70 |
20541 |
20610 |
Bondar-Clegg |
Y |
|
6 |
Some Cone check assays
and BC repeats included. |
| RH-84-16 |
70 |
22741 |
22810 |
Bondar-Clegg |
Y |
|
|
|
| RH-84-18 |
70 |
23031 |
23100 |
Bondar-Clegg |
Y |
|
3 |
Sample
23035, 0.222 opt on certificate, 0.201 opt in database.
Sample 23058, 0.047 opt on certificate, 0.036 opt in database.
Sample 23072, 0.055 opt on certificate 0.064 opt in database. |
| RH-85-52 |
109 |
26701 |
51759 |
Bondar-Clegg |
Partial |
|
|
No errors, but also no certificate data for bottom
half of hole. |
| RH-85-66 |
60 |
28631 |
28690 |
Bondar-Clegg |
Y |
|
|
|
| RH-86-75C |
74 |
N.A. |
N.A. |
|
No, Note 1. |
|
|
From 44 to 49 ft, 0.008 opt entered as 8 opt. |
| RH-86-92 |
68 |
42811 |
42878 |
No
Data |
No |
|
|
No certificate data provided |
| RH-86-102 |
70 |
43091 |
43160 |
Bondar-Clegg |
Y |
1 |
|
|
| RH-86-108 |
100 |
41221 |
49826 |
|
No, Note 1. |
|
|
|
| RH-86-123C |
372 |
54201 |
55572 |
Bondar-Clegg |
Y |
|
|
|
| RH-87-128C |
197 |
55791 |
55988 |
Bondar-Clegg |
Y |
|
|
|
| RH-91-168 |
87 |
303541 |
303627 |
|
No, Note 1. |
|
|
|
| RHN-90-7 |
121 |
85591 |
85711 |
Nevada
GSI, Inc |
Y |
|
|
|
| RP-85-2 |
68 |
33581 |
33648 |
Bondar-Clegg |
Y |
|
|
|
| TA-85-2 |
80 |
35221 |
35399 |
Bondar-Clegg |
Y |
|
|
|
| TA-86-21 |
88 |
39031 |
39118 |
Bondar-Clegg |
Y |
|
|
|
| TA-86-26 |
52 |
41291 |
41342 |
Bondar-Clegg |
Y |
|
|
|
| TT-85-11 |
60 |
35051 |
35110 |
Bondar-a egg |
Y |
|
|
|
| TT-85-2 |
70 |
28441 |
28510 |
Bondar-a egg |
Y |
|
|
|
| TT-86-24 |
64 |
51511 |
51574 |
Bondar-Clegg |
Y |
|
|
|
| TT-90-47 |
100 |
77121 |
77220 |
Bondar-Clegg |
Y |
|
|
|
| TT-90-51 |
95 |
30101 |
30195 |
Bondar-Clegg |
Partial |
|
|
Certificate only available
for 44 of the samples. |
| WD-87-16 |
96 |
58401 |
58496 |
Bondar-Clegg |
Y |
|
|
|
| Note 1. Data compared with historical data printout from Bond Gold. |
|
| | M3-PN240322
3 February 2025
Revision 0 |
93 |
Dakota
Gold
Technical
Report
Table 9-3: Comparison of Assay Certificates with
Database for Legacy Drilling – Silver
| |
No.
of |
Sample
Number Range |
|
|
Assay
Discrepancies |
|
| Hole
Id |
Samples |
Begin |
End |
Assay
Lab |
Certificate? |
Major |
Minor |
Comments |
| Legacy
Drilling: |
|
|
|
|
|
|
|
|
| BZ-92-21 |
200 |
306901 |
307100 |
|
No, Note 1. |
|
|
No silver assays in database. |
| CC-86-11 |
60 |
30081 |
30140 |
Bondar-Clegg |
Y |
|
|
|
| CC-86-16 |
76 |
30491 |
30566 |
Bondar-Clegg |
Y |
1 |
|
Sample 30557, 6.2 ppm on certificate, 27.77 ppm in database. |
| CC-87-55 |
76 |
59601 |
59676 |
Bondar-Clegg |
Y |
2 |
|
Sample 59646, 3.1 ppm on certificate, 3120 ppm in database. |
| |
|
|
|
|
|
|
|
Sample 59665, 2.0 ppm on certificate, 19.89 ppm in database. |
| CCH-89-8 |
104 |
76661 |
76764 |
Bondar-Clegg |
Y |
|
|
|
| CP-86-2 |
83 |
40101 |
40153 |
Bondar-Clegg |
Y |
|
|
|
| CV-88-4 |
88 |
62171 |
62258 |
Bondar-Clegg |
Y |
|
|
|
| CV-89-19 |
89 |
74571 |
74659 |
Bondar-Clegg |
Y |
|
|
|
| CV-39-23 |
100 |
78491 |
75030 |
Bondar-Clegg |
Y |
|
|
|
| CV-90-39 |
69 |
78351 |
75419 |
Bondar-Clegg |
Y |
2 |
|
Sample 78365, 2.8 ppm on certificate, 2811 ppm in database. |
| |
|
|
|
|
|
|
|
Sample 78404, 1.8 ppm on certificate, 18.18 ppm in database. |
| CV-90-43 |
81 |
86201 |
86281 |
No Data |
No |
|
|
No certificate data provided |
| DB-91-6 |
59 |
302851 |
302909 |
|
No, Note 1. |
|
|
No silver assays in database. |
| EB-91-4 |
68 |
306421 |
306488 |
|
No, Note 1. |
|
|
No silver assays in database. |
| HE-91-2 |
131 |
303881 |
304011 |
|
No, Note 1. |
|
|
No silver assays in database. |
| HI-88-2 |
139 |
66351 |
66489 |
Bondar-Clegg |
Y |
|
|
|
| HW-86-4 |
100 |
45731 |
45830 |
Bondar-Clegg |
Y |
|
|
|
| LP-86-10 |
70 |
41501 |
41570 |
|
No, Note 1. |
|
|
|
| MW3-88-6 |
90 |
61091 |
61130 |
Bondar-Clegg |
Y |
|
|
No certificate data for first 9 samples. |
| MW3-90-17 |
51 |
77891 |
77941 |
Bondar-Clegg |
Y |
1 |
|
Database has 50 ppm (upper limit), 3.53 opt re-assay (121 ppm). |
| MW3-90-33 |
74 |
80181 |
80254 |
Nevada GSI, Inc |
Y |
|
|
|
| MW3-90-45 |
65 |
87321 |
87385 |
|
No, Note 1. |
|
|
|
| MW3-90-115 |
79 |
98331 |
98409 |
|
No, Note 1. |
|
|
|
| MW3-90-135 |
55 |
99461 |
99515 |
|
No, Note 1. |
|
|
|
| MW3-90-136 |
70 |
99521 |
99590 |
|
No, Note 1. |
|
|
|
| MW3-90-151 |
30 |
92271 |
92300 |
Bondar-Clegg |
Y |
|
|
|
| MW3-90-152 |
34 |
92311 |
92344 |
Bondar-Clegg |
Y |
|
|
|
| MW3-90-155 |
51 |
92431 |
92481 |
Bondar-Clegg |
Y |
|
|
|
| MW3-90-22 |
56 |
79781 |
79836 |
|
No, Note 1. |
|
|
|
| MW3-90-52 |
75 |
80671 |
80745 |
|
No, Note 1. |
|
|
No silver assays in upper half of hole. |
| MW3-90-93 |
129 |
91561 |
91689 |
Nevada GSI, Inc |
Y |
1 |
|
Sample 91677, 2.0 ppm on certificate, 23.04 ppm in database. No certificate data for first 13 samples. |
PG-88-1
PG-91-13
RCM-19
RCM-5 |
112
91
18
30 |
62341
305001
2473
2150 |
62452
305091
2490
2179 |
|
No, Note 1.
No, Note 1.
No
No |
|
|
No silver assays in database.
No silver assays in database.
No silver assays in database. |
| RH-84-3 |
70 |
20541 |
20610 |
Bondar-Clegg |
Y |
|
|
|
| RH-84-16 |
70 |
22741 |
22810 |
Bondar-Clegg |
Y |
|
1 |
Sample 22801, 7.8 ppm on certificate, 7.47 ppm in database. |
| RH-84-18 |
70 |
23031 |
23100 |
Bondar-Clegg |
Y |
|
3 |
Sample 23035, 24 ppm on certificate, 23 ppm in database. |
| |
|
|
|
|
|
|
|
Sample 23039, 4.1 ppm on certificate, 5.31 ppm in database. |
| |
|
|
|
|
|
|
|
Sample 23062, 6.5 ppm on certificate, 5.93 ppm in database. |
| RH-85-52 |
109 |
26701 |
51759 |
Bondar-Clegg |
Partial |
|
1 |
Sample 26750, 28 ppm on certificate, 22 ppm in database. |
| |
|
|
|
|
|
|
|
No certificate data for bottom half of hole. |
| RH-85-66 |
60 |
28631 |
28690 |
Bondar-Clegg |
Y |
|
1 |
Sample 28650, 1.63 opt (55.9 ppm) on certificate, 53.8 ppm in data. |
| RH-86-75C |
74 |
N.A. |
N.A. |
|
No, Note 1. |
|
1 |
244 to 249 ft. printout was 0.07 opt (2.4 ppm), database is 1.37 ppm. |
| RH-86-92 |
68 |
42811 |
42878 |
No Data |
No |
|
|
No certificate data provided |
| RH-86-102 |
70 |
43091 |
43160 |
Bondar-Clegg |
Y |
|
|
|
| RH-86-108 |
100 |
41221 |
49826 |
|
No, Note 1. |
|
|
|
| RH-86-123C |
372 |
54201 |
55572 |
Bondar-Clegg |
Y |
|
|
|
| RH-87-128C |
197 |
55791 |
55988 |
Bondar-Clegg |
Y |
|
|
|
| RH-91-168 |
87 |
303541 |
303627 |
|
No, Note 1. |
|
|
No silver assays in database. |
| RHN-90-7 |
121 |
85591 |
85711 |
Nevada GSI, Inc |
Y |
|
|
|
| RP-85-2 |
68 |
33581 |
33648 |
Bondar-Clegg |
Y |
|
|
|
| TA-85-2 |
80 |
35221 |
35399 |
Bondar-Clegg |
Y |
|
|
|
| TA-86-21 |
88 |
39031 |
39118 |
Bondar-Clegg |
Y |
|
|
|
| TA-86-26 |
52 |
41291 |
41342 |
Bondar-Clegg |
Y |
|
|
|
| TT-85-11 |
60 |
35051 |
35110 |
Bondar-Clegg |
Y |
|
|
|
| TT-85-2 |
70 |
28441 |
28510 |
Bondar-Clegg |
Y |
|
|
|
| TT-86-24 |
64 |
51511 |
51574 |
Bondar-Clegg |
Y |
|
|
|
| TT-90-47 |
100 |
77121 |
77220 |
Bondar-Clegg |
Y |
|
|
|
| TT-90-51 |
95 |
30101 |
30195 |
Bondar-Clegg |
Partial |
|
|
Certificate only available for 44 of the samples. |
| WD-87-16 |
96 |
58401 |
58496 |
Bondar-Clegg |
Y |
|
|
|
| Note 1. Data compared with historical data printout from Bond Gold. |
| | M3-PN240322
3 February 2025
Revision 0 |
94 |
Dakota
Gold
Technical
Report
For the purpose of this Technical Report, Woods
Process Services (WPS) has reviewed historical process information provided by Dakota Gold as discussed in more detail in Section 10.
| | M3-PN240322
3 February 2025
Revision 0 |
95 |
Dakota
Gold
Technical
Report
| 10 | Mineral Processing and Metallurgical |
The Project hosts the former Richmond Hill gold mine, operated from
1988 to 1993 as an open pit mine with heap leach facilities. The heap leach flow sheet for the historical Richmond Hill mine was based
on several column test programs primarily in-house at the St. Joe Technical Center metallurgical laboratory. Additional metallurgical
testing programs were conduced while Richmond Hill was in operation at the on-site metallurgical testing laboratory. Since termination
of operations at Richmond Hill, no significant cyanidation heap leach testing programs have been undertaken. It is the opinion of the
QP that the existing testwork data is sufficient for the scope of this technical report.
The following discussion is segmented into two
sections based on the available metallurgical testwork. The first covers the historical Oxide heap leach cyanide testing, namely bottle
roll and column tests used as the design basis for the original operations. The second section discussed Transition and Sulfide material
flotation based on recent metallurgical testing (2023) at Base Metallurgical Laboratories (BaseMet) in Kamloops, B.C.
| 10.1 | Preliminary Geometallurgical Data Model Development |
The RH deposit, as expected, has three primary
geometallurgical domains, namely: oxide, mixed (transition) and sulfide. This is evident in the core logging, geochemical analysis and
metallurgical specific analyses. As a primary run, a cluster analysis subroutine was run based on the drill core interval analyses: fire
assay Au and Ag, cyanide soluble Au (CNAu), ICP geochemical analysis and metallurgical specific data, Ag:Au ratio and cyanide soluble
Au to fire assay Au (CNAu:FAAu).
Running the cluster analysis on the total 2024
block model population resulted in subsample population of 21,906 out of the total population of 117,902 or 18.6% owing to lack of individual
analyses, namely cyanide soluble and geochem. Table 10-1 contains the cluster counts and the respective cluster means for the individual
analyses. Figure 10-1 shows the analytical KPI’s for each cluster using Quantile-Wisker plots. It should be noted that the clusters
used should are an indication of the metallurgical expected metallurgical response using the CNAu:FAAu ratio as a proxy for bottle-roll
test recovery. Additional analyses are required along with development work to incorporate the geologic, structural, metallurgical and
spatial data into the model.
Table 10-1: Preliminary Geometallurgical Cluster
Analysis Summary Table
| Cluster |
Count |
Cluster Means |
| FA Au ppm |
CN Au ppm |
CNAAu:FAAu |
FA Ag ppm |
Ag:Au |
| A |
11,872 |
0.35 |
0.32 |
0.90 |
4.83 |
16.35 |
| B |
8,505 |
0.51 |
0.12 |
0.30 |
4.34 |
10.86 |
| C |
1,122 |
2.88 |
1.95 |
0.75 |
16.89 |
6.71 |
| D |
335 |
0.49 |
0.31 |
0.74 |
65.44 |
173.86 |
| E |
72 |
9.62 |
6.50 |
0.73 |
34.58 |
4.60 |
| | M3-PN240322
3 February 2025
Revision 0 |
96 |
Dakota
Gold
Technical
Report

| Figure 10-1: Preliminary Cluster Analysis Interval Analytical KPI’s by Cluster |
 |
| 10.2 | Oxide and Mixed Metallurgical Testing |
Historical Oxide metallurgical testing was conducted
by several metallurgical laboratories including St. Joe Mining’s Technical Center and Dawson Metallurgical Testing Laboratory. Additional
work was conducted at Dawson Metallurgical Laboratories, Bondar-Clegg, Kappes Cassiday & Associates and Heinen Lindstrom and
Associates. This data was used to support the design and engineering of the production processing facility at Richmond Hill, which operated
from 1988 to 1993.
| | M3-PN240322
3 February 2025
Revision 0 |
97 |
Dakota
Gold
Technical
Report
Metallurgical testwork results have been compiled
into a common database to facilitate data analysis and incorporation into the geometallurgical model. The following discussion focuses
on the historical cyanidation bottle roll and column tests.
| 10.2.1 | Historical Bottle Roll Tests |
Figure 10-2 presents the gold calculated head
grades for Richmond Hill bottle roll tests. The calculated Au head grades ran between 0.0027 opt to 0.699 opt with a mean of 0.052 opt
and median of 0.035 opt.

Figure 10-2: Richmond Hill Bottle Roll Test
KPIs: Calculated Heads Au opt
The bottle roll test silver head grade distribution
and statistics are presented in Figure 10-3. Median and mean silver calculated heads grades are 0.22 opt and 0.472 opt respectively.
| | M3-PN240322
3 February 2025
Revision 0 |
98 |
Dakota
Gold
Technical
Report

Figure 10-3: Richmond Hill Bottle Roll Test
KPIs: Calculated Heads Ag opt
Bottle roll test Silver to Gold ratio of the Richmond
Hill has a significant variance with range of 0.21 to 803.3 as show in Figure 10-4.
Median and Mean Ag:Au ratio of 6.52 and 15.99
respectively suggest that a Merrill-Crowe circuit would be appropriate for heap leach solution processing for precious metal recovery.

Figure 10-4: Richmond Hill Bottle Roll Test
KPIs: Ag:Au ratio
Bottle roll tests for Richmond Hill had median
and mean gold recoveries of 79.0 % and 70.2 % respectively as shown in Figure 10-5. It should be noted that the data is skewed on the
low side owing to the inclusion of non-oxide bottle roll test data in the population. Where noted, non-oxide bottle roll tests were culled
from the population for analysis. After accounting for this apparent skewing, the QP is of the opinion that 89% is an appropriate expectation
for gold recovery from heap leach of the Richmond Hill oxide and 65% for low sulfide transition material.
| | M3-PN240322
3 February 2025
Revision 0 |
99 |
Dakota
Gold
Technical
Report

Figure 10-5: Richmond Hill Bottle Roll Test
KPIs: Au Recovery Distribution
Silver recoveries for the bottle tests had a median
value of 40.8% and mean of 39.7% as shown in Figure 10-6. As with the gold recovery, the distribution is skewed owing to the presence
of non-oxide material included in the population.

Figure 10-6: Richmond Hill Bottle Roll Test
KPIs: Ag Recovery Distribution
| 10.2.2 | Historical Metallurgical testing: Oxide & Transition Heap Leach |
The Richmond Hill oxide material is amenable to
cyanide heap processing for the recovery of precious metals. Individual column testwork data was combined into a common data set for analysis
of the KPI’s. Where non-oxide column tests were identified, the corresponding data was excluded from the analysis. Consequently,
non-oxide column tests that were not identified as such, tend to skew the results on the low side.
| | M3-PN240322
3 February 2025
Revision 0 |
100 |
Dakota
Gold
Technical
Report
Figure 10-7 presents the column test gold calculated
head grades for the oxide column tests. These ranged between 0.016 Au opt to 0.126 Au opt. Median and Mean gold calculated head grades
were 0.044 opt and 0.046 opt respectively.

Figure 10-7: Richmond Hill Column Test KPIs:
Calculated Heads Au opt
The oxide column test silver calculated head grade
distribution and pertinent statistics are shown in Figure 10-8. The silver grades ranged between 0.014 opt and 1.063 opt with median and
mean values of 0.165 and 0.214 opt Ag respectively.
| | M3-PN240322
3 February 2025
Revision 0 |
101 |
Dakota
Gold
Technical
Report

Figure 10-8: Richmond Hill Column Test KPIs:
Calculated Heads Ag opt
Oxide column test silver to gold ratios are presented
in Figure 10-9. These range between 0.48 Ag:Au up to 14.13 Ag:Au. Median and mean values for Ag:Au were 4.15 and 5.07 respectively. These
ratios indicate that a Merrill-Crowe circuit would be appropriate for solution processing.

Figure 10-9: Richmond Hill Column Test KPIs:
Ag:Au Ratio
Oxide column test gold recoveries, as shown in
Figure 10-10, ranged between 1.79 % to 95.1 % with median and mean values of 84.8 % and 65.5 %. As with the bottle roll tests, the distribution
was skewed owing to the presence of high-sulfide and sulfide material in the population.
| | M3-PN240322
3 February 2025
Revision 0 |
102 |
Dakota
Gold
Technical
Report

Figure 10-10: Richmond Hill Column Test KPIs:
Recovery % Au
The distribution and statistics for the oxide
column test silver recoveries are shown in Figure 10-11. Recoveries ranged from 0.25 % to 65.2 % with a median Ag recovery of 16.7% and
mean Ag recovery of 20.17%.

Figure 10-11: Richmond Hill Column Test KPIs:
Recovery % Ag
| 10.3 | Sulfide and Transition Metallurgical Testing |
In 2024, Dakota Gold contracted AKF Mining Services
Inc. (AKF) to complete a review of historical and current exploration programs to verify and validate the drilling data and produce an
S-K 1300 Initial Assessment and Technical Report Summary (Report) on the Richmond Hill Gold Project (the Project or the Property).
| | M3-PN240322
3 February 2025
Revision 0 |
103 |
Dakota
Gold
Technical
Report
Sulfide and Transition metallurgical testing was
reported in detail by QP Kelly McLeod, P.Eng., of K-Met Consultants Inc. (K-Met) in detail in the April 2024 S-K 1300 report. For
the sake of brevity, pertinent sections of the original SK-1300 are included in the following subsection 10.3.
| 10.3.1 | Historical Metallurgical Reports: Sulfide & Transition Flotation |
Between 1987 (St. Joe 1987) and 1991 five historical
metallurgical test programs were completed on the sulfide material from the Richmond Hill gold deposit, including mineralogy, gravity,
roasting, bioleach, flotation, and leaching. Dawson Metallurgical Laboratories (1988) in Murray, Utah, reported similar results for the
sulfide material as those for the 2023 testwork undertaken by Base Metallurgical Laboratories (BaseMet) in Kamloops, B.C. The historical
test programs are listed in Table 10-2.
Table 10-2: Historical Metallurgical Reports
| Test
Program |
Year |
Sample
ID |
| Process Mineralogy and CN Leach Tests of Sulfide Ore Samples from Richmond Hill Project, No. 5H06 |
1987 |
RH 85-54, 83, 102, 108 |
| Dawson Metallurgical Laboratories, Inc., Cyanide Leaching with Intensive Pre-aeration on a Sample from the Richmond Hill Project, No. P-1395 |
1988 |
Not available |
| Dawson Metallurgical Laboratories, Inc., Results of Preliminary Cyanide Leach Test on 8 Samples from South Dakota, No. P 1590 |
1988 |
CV4-1A to 4A, CV5-1A to 4A |
| Extractive Technologies Metallurgical Laboratories, Agitation Cyanidation Testwork, No. 0161 |
1989 |
CV-88-6, 8, 23 |
| LAC Minerals-Richmond Hill Inc., Report on Samples Submitted by Tod Duex for Bottle Roll Analysis |
1991 |
BR-1H1, BR-1H2, BRB-W1, BR-SR1, BR-DB1, BR-BD2, BR-SC1, BR-SC2, BR-B1, BR-W2, BR-SR2, BR-SR3, BR-B2 |
Source: K-Met 2023.
The mineralogy indicates that the tested sulfide
material contains fine gold locked in coarse gangue, and large amounts of gold associated with fine- to medium-sized iron sulfides locked
in gangue minerals. Like 2023 testwork, historical gravity concentration testwork achieved 7% to 23% recovery and was not investigated
further at this time. Whole ore leach (WOL) results were low, with gold extraction averaging 46%. Roasting, bioleach, and pressure oxidation
(POX) of the flotation concentrate followed by cyanide leach increased gold extraction. Roasting and bioleach recovered between 74% and
80% of the gold. The result of including an autoclave prior to leaching was gold extraction of approximately 93% and silver extraction
of 74%. Cyanide consumption was found to be low at 1.5 kg/t, but lime consumption was relatively high at, 7 kg/t.
| 10.3.2 | Metallurgical Report – BL1244 |
In August 2023, BaseMet completed test program
BL1244 on Richmond Hill zone drill-core material, a preliminary metallurgical investigation of extracting gold and silver from three mineralogical
classifications: oxide, transition, and sulfide. BaseMet’s full testwork provides full details in their December 4, 2023, report
on BL1244, Preliminary Metallurgical Assessment of the Richmond Hill Deposit.
The MC head assays are listed in Table 10-3. Note
that the 2023 Initial Assessment reported Au and Ag grades in grams per tonne. The gold head assays range from 0.65 to 0.82 g/t with sulfur
ranging from 1.64% for RH22 Ox to 6.21% for RH22 Sul.
| | M3-PN240322
3 February 2025
Revision 0 |
104 |
Dakota
Gold
Technical
Report
Table 10-3: Master Composite Head Assays –
BaseMet2023, BL1244
| Sample |
Assays |
| Cu (%) |
Fe (%) |
Ag (g/t) |
Au (g/t) |
S (%) |
C (%) |
TOC (%) |
| RH22 Sul |
0.013 |
7.18 |
5.0 |
0.65 |
6.21 |
0.25 |
0.07 |
| RH22 Mix |
0.014 |
7.85 |
2.8 |
0.82 |
5.16 |
0.50 |
0.09 |
| RH22 Ox |
0.014 |
8.32 |
1.4 |
0.74 |
1.64 |
<0.01 |
<0.01 |
| Method |
FAAS |
FAAS |
ICP |
FAAS |
LECO |
LECO |
LECO |
Notes: FAAS = Flame Atomic Absorption Spectroscopy;
LECO = Infrared Combustion; TOC = Total Organic Carbon.
| 10.3.2.2 | Gravity-Recoverable Gold |
Gravity-recoverable gold (GRG) testwork was undertaken
on the three MCs. All three samples had a relatively low GRG. The nominal grind sizes used for this testwork were 80% passing (P80)
1,700 µm, P80 212 µm, and P80 75 µm. The oxide MC has the most GRG, at 33%, and the sulfide MC
at 8.7%. No further gravity concentration was investigated.
| 10.3.2.3 | Flotation Leach Results |
Rougher Flotation
Rougher flotation tests were completed at P80
approximately 75 µm, at a natural Ph between 5.6 and 7.0, using potassium amyl xanthate (PAX) as a collector, with methyl isobutyl
carbinol added to maintain a consistent froth. The tests were completed at a relatively low PAX dosage (80 g/t) and a higher PAX dosage
(200 g/t). The higher-dosage tests were performed at a lower density in the range of 25% to 27% due to increased viscosity observed during
the initial flotation tests. The flowsheet is illustrated in Figure 10-12.

Figure 10-12: Rougher Flotation Flowsheet—BaseMet
2023, BL1244
The gold recovery to the rougher concentrate under
these conditions ranged from 62% to 69% for all three MCs. The sulfide MC had the best results, with a gold recovery of 69% in the flotation
concentrate. The lower density for the higher PAX test reduced the mass pull for the sulfide MC, and the gold grade in the concentrate
was higher. Very little change was noted for the oxide flotation with the second rougher test. The silver recovery for the MCs tested
was in the same range as gold (66% to 69%), but much lower for the oxide MC (39% to 44%). The rougher concentrate grades were relatively
low, ranging from 2 to 6 g/t, and would need further testwork to determine if upgrading could be achieved to produce a saleable concentrate.
To improve the concentrate grade for sale or extraction of gold from the concentrate by leaching, additional processing might include
either additional flotation stages, continuous gravity concentration, spiral concentration, or shaking tables. The rougher flotation results
and rougher mass versus recovery curves are shown in Table 10-4 and Figure 10-13, respectively.
| | M3-PN240322
3 February 2025
Revision 0 |
105 |
Dakota
Gold
Technical
Report
Table 10-4: Rougher Flotation Results –
BaseMet 2023, BL1244
| Test |
Sample |
PAX
(g/t) |
Weight
(%) |
Assay |
Distribution (%) |
| Fe (%) |
Ag (g/t) |
Au (g/t) |
S (%) |
Fe |
Ag |
Au |
S |
| 1 |
RH22—Sul |
80 |
29.4 |
14.6 |
12.0 |
1.5 |
15.6 |
56 |
69 |
69 |
75 |
| 2 |
RH22—Mix |
80 |
15.9 |
21.5 |
11.9 |
3.6 |
23.1 |
40 |
67 |
66 |
74 |
| 3 |
RN22—Ox |
80 |
8.6 |
12.7 |
10.1 |
6.2 |
.1 |
12 |
39 |
67 |
41 |
| 7 |
RH22—Sul |
200 |
17.0 |
27.4 |
19.2 |
2.8 |
35.2 |
62 |
69 |
68 |
88 |
| 8 |
RH22—Mix |
200 |
11.6 |
26.9 |
13.4 |
5.1 |
31.1 |
38 |
66 |
62 |
71 |
| 9 |
RN22—Ox |
200 |
8.6 |
12.4 |
11.1 |
6.1 |
7.8 |
13 |
44 |
68 |
43 |

Figure 10-13: Rougher Mass vs. Gold Recovery—BaseMet
2023, BL1244
To investigate the leach performance on the MCs,
and gold associated with different groups of minerals, a five-stage diagnostic leach test was conducted. In the initial stage a cyanide
leach was completed on the MCs at a primary grind of P80 75 µm.
| | M3-PN240322
3 February 2025
Revision 0 |
106 |
Dakota
Gold
Technical
Report

Figure 10-14: Diagnostic Leach Test Flowsheet
– BaseMet 2023, BL1244
At each stage of the test, various minerals and
mineral groups are dissolved by the acid used. The results are listed in Table 10-5.
Table 10-5: Diagnostic Leach – BaseMet
2023, BL1244
| Stage |
Description of Gold |
Au Stage Extraction (%) |
| RH22—Sul |
RH22—Mix |
RH22—Ox |
| A: High-Intensity CN Leach |
Cyanide amenable gold |
47.4 |
72.9 |
91.0 |
| B/C: HCl Digestion/Cyanidation |
Carbonate locked |
18.8 |
4.4 |
2.4 |
| D/E: HNO3 Digestion/Cyanidation |
Arsenical minerals (arsenopyrite) |
29.4 |
12.5 |
2.0 |
| F: Aqua Regia Digestion |
Pyritic sulfide locked |
3.5 |
1.9 |
2.6 |
| Tailings |
Silicate (gangue) encapsulated |
1.0 |
8.3 |
1.9 |
| Total |
|
100 |
100 |
100 |
The results indicate that most of the oxide material
is free or exposed, and responds well to WOL, with gold extraction expected in the range of 91%. The leach extraction for the transition
MC was 72.9% gold, which is consistent with the WOL results discussed in Section 10.2.7. The results indicate 12.5% gold reports
to the D/E stage (i.e., nitric acid), but the BMA results do not indicate a significant amount of arsenopyrite in the sample. The transition
MC had the highest percentage of gold locked in silicate or gangue. The sulfide MC had poor gold extraction at the first cyanide leach
stage. High gold dissolution was recorded in the hydrochloric acid and nitric acid digestion stages. All three MCs had a low amount of
gold locked in pyrite.
| 10.3.3 | Metallurgical Report – BL1346 |
In September 2023, intervals from 29 drill
holes representing seven zones were collected for metallurgical evaluation. The zones include Twin Tunnels Turn Around Monitoring Well
3, Richmond Hill, Cleveland, Cole Creek, and Richmond Hill North. MCs were compiled to represent the oxide, transition, and sulfide layers
within each zone.
| 10.3.3.1 | Flotation Grind Series |
Three initial rougher flotation tests were performed
on the sulfide MC-TT-S to investigate primary grind. The sample was ground to target primary grind sizes of P80 50, 75, and
106 µm. Flotation was conducted at natural Ph for a total flotation time of eight minutes. PAX was used as a nonselective gold and
sulfide collector at a total dosage of 80 g/t feed PAX. A primary grind targeting P80 75 µm provided the best results
for both gold and silver, with approximately 21% of the feed reporting to the rougher concentrate. The rougher concentrate results are
listed in Table 10-6. Figure 10-15 illustrates gold recovery versus mass recovery.
| | M3-PN240322
3 February 2025
Revision 0 |
107 |
Dakota
Gold
Technical
Report
Table 10-6: Rougher Flotation Grind Series MC-TT-S
– BaseMet 2023, BL1346
| Test No. |
Grind Size
(P80 µm) |
Weight |
Assay |
Distribution (%) |
| % |
g |
Au (g/t) |
Ag (g/t) |
Fe (%) |
S (%) |
Au |
Ag |
Fe |
S |
| BL1346-22 |
50 |
27.9 |
557.1 |
1.93 |
11.4 |
17.2 |
17.9 |
60.3 |
65.7 |
53.5 |
72.5 |
| BL1346-23 |
75 |
21.1 |
419.1 |
2.87 |
15.1 |
22.9 |
25.6 |
65.8 |
68.1 |
55.6 |
78.4 |
| BL1346-24 |
106 |
16.7 |
330.3 |
3.04 |
15.5 |
24.3 |
26.6 |
54.0 |
56.4 |
46.9 |
64.6 |

Figure 10-15: Gold Rougher Concentrate Recovery
vs. Mass Recovery – BaseMet 2023, BL1346
| 10.3.3.2 | Preliminary Flotation Optimization |
To further optimize the flotation recovery tests
on MC-TT-S, they included a longer rougher flotation time (10 minutes), higher PAX dosage (200 g/t), and lower density. The results indicate
a combination of the changes has an impact on the recovery to the rougher concentrate. With the higher PAX dosage, the highest recovery
and highest mass pull was noted. The lower density, between 25% and 27%, appears to reduce mass recovery. Figure 10-16 illustrates the
gold recovery to the rougher concentrate versus mass recovery for the additional tests completed on MC-TT-S.
| | M3-PN240322
3 February 2025
Revision 0 |
108 |
Dakota
Gold
Technical
Report

Figure 10-16: Gold Rougher Concentrate Recovery
vs. Mass Recovery – BaseMet 2023, BL1346
| 10.3.3.3 | Transition and Sulfide Master Composite Flotation |
The final rougher flotation flowsheet that was
tested on the 13 transition and sulfide MCs included a primary grind size of P80 75 µm, 200 g/t PAX, and 10-minute residence
time at a lower density. The results ranged from 31.5% to 94.0% gold recovery to the rougher concentrate. The overall results are in Table
10-7. The MC with higher sulfur content appears to perform better, as demonstrated in Figure 10-17. The head grade did not seem to correlate
with recovery of gold to the rougher concentrate, as shown in Figure 10-18.
Table 10-7: Rougher Flotation Results –
BaseMet 2023, BL1346
| Zone |
Lithology |
Test |
Head Grade |
Recovery to Rougher Concentrates (%) |
| Au (g/t) |
S (%) |
Mass |
Au |
Ag |
Fe |
S |
| MC-TA |
Transition |
28 |
0.9 |
3.3 |
8.6 |
61.6 |
50.9 |
34.5 |
82.8 |
| MC-TA |
Sulfide |
29 |
0.8 |
5.6 |
16.2 |
80.9 |
75.2 |
53.3 |
89.3 |
| MC-TT |
Transition |
30 |
0.7 |
5.8 |
15.8 |
67.0 |
64.8 |
44.5 |
79.4 |
| MC-TT |
Sulfide |
31 |
0.9 |
6.8 |
12.2 |
52.4 |
60.9 |
47.6 |
74.7 |
| MC-MW3 |
Transition |
37 |
1.5 |
3.9 |
13.0 |
84.9 |
75.3 |
37.3 |
89.0 |
| MC-MW3 |
Sulfide |
38 |
4.2 |
7.2 |
17.5 |
94.0 |
87.9 |
39.9 |
91.1 |
| MC-RH |
Transition |
39 |
1.2 |
1.1 |
2.7 |
31.5 |
36.5 |
8.0 |
88.5 |
| MC-RH |
Sulfide |
40 |
0.6 |
5.6 |
11.3 |
50.0 |
55.8 |
37.5 |
73.0 |
| MC-CV |
Transition |
32 |
0.4 |
2.8 |
10.3 |
59.4 |
44.6 |
26.6 |
85.8 |
| MC-CV |
Sulfide |
33 |
2.3 |
5.2 |
9.5 |
50.7 |
35.5 |
23.3 |
74.0 |
| MC-CC |
Transition |
34 |
0.6 |
2.8 |
7.4 |
60.4 |
54.9 |
33.6 |
92.1 |
| MC-CC |
Sulfide |
35 |
0.7 |
6.5 |
24.4 |
88.1 |
73.1 |
50.0 |
93.1 |
| MC-RHN |
Sulfide |
36 |
0.9 |
5.1 |
21.2 |
73.4 |
78.4 |
50.0 |
84.7 |
Notes: CC = Cole Creek; CV = Cleveland;
MW3 = Monitoring Well 3; RH = Richmond Hill; RHN = Richmond Hill North; TA = Turn Around; TT = Twin Tunnels.
| | M3-PN240322
3 February 2025
Revision 0 |
109 |
Dakota
Gold
Technical
Report

Figure 10-17: Gold Recovery vs. Sulfur Head
Grade – BaseMet 2023, 1346

Figure 10-18: Gold Recovery vs. Gold Head Grade
– BaseMet 2023, BL1346
| 10.4 | Richmond Hill Historical Operating Data |
Historical operating data was made available to
the QP for review and analysis. Figure 10-19 presents the commercial heap leach gold and silver recoveries as well as the dore silver
to gold ratio. Heap leach recoveries maxed out at 62.3% and 16.9% for gold and silver respectively. These are considerably lower than
would be expected using “recent” heap leach methods developed over that last 30 plus years. Reported issues with the historical
operations include:
| · | Processing of lower grade material, |
| · | Processing of sulfide material, |
| · | Processing of high-sulfide transition material |
| · | Problems with solution management during winter
operations. |
It is the QP’s opinion that that the projected
recovery can be attained with mitigation of the above issues.
| | M3-PN240322
3 February 2025
Revision 0 |
110 |
Dakota
Gold
Technical
Report

Figure 10-19: Historical Richmond Hill Heap
Leach KPI’s Au and Ag Recovery, Recovered Ag:Au Ratio
Projected recoveries are based on the available
metallurgical testwork data as presented in Table 10-8 and generally reflect the median of the respective testwork results. As previously
noted, the oxide column test recovery data is skewed owing to inclusion of likely transition and sulfide test results. Removing these
results from the data set results in an overall improvement in projected gold recoveries to 89%. It is the QP’s opinion that this
is both reasonable and supported by the data.
Table 10-8: Projected Precious Metal Recoveries
| Metallurgical Recovery Estimates |
|
| Material Type | |
Oxide | | |
Trans | | |
Trans | | |
Sulfide | |
| Process | |
Heap Leach | | |
Heap Leach | | |
Mill | | |
Mill | |
| Gold | |
| 89 | % | |
| 65 | % | |
| 80 | % | |
| 85 | % |
| Silver | |
| 30 | % | |
| 20 | % | |
| 70 | % | |
| 85 | % |
| 10.6 | Summary and Recommendations |
The Richmond Hill oxide and transition material
is amenable to cyanidation heap leach processing. The Richmond Hill sulfide material is amenable to bulk sulfide froth flotation. Transition
material can be processed through either method but requires determination of a cut-over grade for optimum economics.
It is the QP’s opinion that the existing
testwork is suitable for this level of study and projected recoveries are more than reasonable.
Additional metallurgical testing is required to
support future studies. This work will likely result in better definition of the metal recoveries and reagent consumptions. This will
improve the accuracy of future capital and operating cost estimates as well as production forecasting.
| | M3-PN240322
3 February 2025
Revision 0 |
111 |
Dakota
Gold
Technical
Report
| 11 | Mineral Resource Estimate |
The mineral resource estimate for Richmond Hill
includes mineral resources amenable to heap leaching and mineral resources amenable to milling. The mineral resource amenable to leaching
consists of the oxide and transition material types, and the mineral resource amenable to milling consists of the sulfide material. Table
11-1 presents the mineral resource estimate. The measured and indicated mineral resource amenable to leaching amounts to 269.8 million
tons at 0.0135 oz/t gold and 0.141 oz/t silver for 3.65 million ounces of contained gold and 38.1 million ounces of contained silver.
Inferred mineral resource amenable to leaching is an additional 254.2 million tons at 0.0103 oz/t gold and 0.090 oz/t silver for 2.61
million ounces of contained gold and 22.8 million ounces of contained silver.
The measured and indicated mineral resource amenable
to milling amounts to 69.6 million tons at 0.0141 oz/t gold and 0.139 oz/t silver for 982,100 ounces of contained gold and 9.68 million
ounces of contained silver. Inferred mineral resource amenable to milling is an additional 202.2 million tons at 0.0121 oz/t gold and
0.145 oz/t silver for 2.45 million ounces of contained gold and 29.3 million ounces of contained silver.
The measured and indicated mineral resource for
leach and mill material amounts to 339.4 million tons at 0.0137 oz/t gold and 0.141 oz/t silver for 4.64 million ounces of contained gold
and 47.8 million ounces of contained silver. Inferred mineral resource for leach and mill material is an additional 456.4 million tons
at 0.0111 oz/t gold and 0.114 oz/t silver for 5.06 million ounces of contained gold and 52.1 million ounces of contained silver.
The measured, indicated, and inferred mineral
resources reported herein are contained within a conceptual constraining pit shell to demonstrate “reasonable prospects for economic
extraction” to meet the definition of mineral resources in S-K 1300. Figure 11-1 shows the pit shell that is based on measured,
indicated, and inferred mineral resource. The constraining pit shell is also constrained by the Richmond Hill Project Boundary. Only mineralization
inside the boundary was allowed to contribute to the economics for development of the shell, though waste mining outside of the boundary,
to extract mineralization inside the boundary, was allowed.
Table 11-1: Mineral Resource Estimate
| Resource Category | |
AuEq COG
(oz/t) | | |
Ktons | | |
AuEq
(oz/t) | | |
Gold
(oz/t) | | |
Silver
(oz/t) | | |
Gold
(koz) | | |
Silver
(koz) | |
| Leach Resource: | |
| | | |
| | | |
| | | |
| | | |
| | | |
| | | |
| | |
| Measured Mineral Resource | |
| | | |
| 113,748 | | |
| 0.0164 | | |
| 0.0158 | | |
| 0.160 | | |
| 1,793.4 | | |
| 18,208 | |
| Oxide | |
| 0.0026 | | |
| 94,537 | | |
| 0.0165 | | |
| 0.0158 | | |
| 0.167 | | |
| 1,493.7 | | |
| 15,788 | |
| Transition | |
| 0.0041 | | |
| 19,211 | | |
| 0.0161 | | |
| 0.0156 | | |
| 0.126 | | |
| 299.7 | | |
| 2,421 | |
| Indicated Mineral Resource | |
| | | |
| 156,019 | | |
| 0.0125 | | |
| 0.0119 | | |
| 0.128 | | |
| 1,860.0 | | |
| 19,884 | |
| Oxide | |
| 0.0026 | | |
| 127,237 | | |
| 0.0122 | | |
| 0.0117 | | |
| 0.128 | | |
| 1,488.7 | | |
| 16,286 | |
| Transition | |
| 0.0041 | | |
| 28,783 | | |
| 0.0134 | | |
| 0.0129 | | |
| 0.125 | | |
| 371.3 | | |
| 3,598 | |
| Meas/Indic
Mineral Resource | |
| | | |
| 269,768 | | |
| 0.0141 | | |
| 0.0135 | | |
| 0.141 | | |
| 3,653.3 | | |
| 38,092 | |
| Oxide | |
| 0.0026 | | |
| 221,774 | | |
| 0.0140 | | |
| 0.0134 | | |
| 0.145 | | |
| 2,982.4 | | |
| 32,074 | |
| Transition | |
| 0.0041 | | |
| 47,994 | | |
| 0.0145 | | |
| 0.0140 | | |
| 0.125 | | |
| 671.0 | | |
| 6,018 | |
| Inferred
Mineral Resource | |
| | | |
| 254,186 | | |
| 0.0106 | | |
| 0.0103 | | |
| 0.090 | | |
| 2,613.4 | | |
| 22,787 | |
| Oxide | |
| 0.0026 | | |
| 211,994 | | |
| 0.0101 | | |
| 0.0098 | | |
| 0.085 | | |
| 2,077.5 | | |
| 18,019 | |
| Transition | |
| 0.0041 | | |
| 42,192 | | |
| 0.0131 | | |
| 0.0127 | | |
| 0.113 | | |
| 535.8 | | |
| 4,768 | |
| Mill Resource (Sulfides): | |
| | | |
| | | |
| | | |
| | | |
| | | |
| | | |
| | |
| Measured Mineral Resource | |
| 0.0050 | | |
| 20,703 | | |
| 0.0184 | | |
| 0.0165 | | |
| 0.151 | | |
| 341.6 | | |
| 3,126 | |
| Indicated Mineral Resource | |
| 0.0050 | | |
| 48,893 | | |
| 0.0147 | | |
| 0.0131 | | |
| 0.134 | | |
| 640.5 | | |
| 6,552 | |
| Meas/Indic Mineral Resource | |
| 0.0050 | | |
| 69,596 | | |
| 0.0158 | | |
| 0.0141 | | |
| 0.139 | | |
| 982.1 | | |
| 9,678 | |
| | M3-PN240322
3 February 2025
Revision 0 |
112 |
Dakota
Gold
Technical
Report
| Resource Category | |
AuEq COG
(oz/t) | | |
Ktons | | |
AuEq
(oz/t) | | |
Gold
(oz/t) | | |
Silver
(oz/t) | | |
Gold
(koz) | | |
Silver
(koz) | |
| Inferred Mineral Resource | |
| 0.0050 | | |
| 202,221 | | |
| 0.0139 | | |
| 0.0121 | | |
| 0.145 | | |
| 2,446.9 | | |
| 29,322 | |
| Leach and Mill Mineral Resource: | |
| | | |
| | | |
| | | |
| | | |
| | | |
| | | |
| | |
| Measured Mineral Resource | |
| | | |
| 134,452 | | |
| 0.0167 | | |
| 0.0159 | | |
| 0.159 | | |
| 2,135.0 | | |
| 21,334 | |
| Indicated Mineral Resource | |
| | | |
| 204,912 | | |
| 0.0130 | | |
| 0.0122 | | |
| 0.129 | | |
| 2,500.5 | | |
| 26,436 | |
| Meas/Indic Mineral Resource | |
| | | |
| 339,364 | | |
| 0.0145 | | |
| 0.0137 | | |
| 0.141 | | |
| 4,635.4 | | |
| 47,770 | |
| Inferred Mineral Resource | |
| | | |
| 456,407 | | |
| 0.0121 | | |
| 0.0111 | | |
| 0.114 | | |
| 5,060.3 | | |
| 52,109 | |
Notes:
1. The Mineral Resource estimate has an effective
date of 3 February 2025.
2. All figures are rounded to reflect the relative
accuracy of the estimate and therefore numbers may not appear to add precisely.
3. Mineral Resources that are not Mineral Reserves
do not have demonstrated economic viability.
4. Mineral Resources are based on prices of $2000/oz
gold and $25/oz silver.
5. Mineral Resources for leach material are based
on a gold equivalent cut-off of 0.0026 oz/t for oxide material and 0.0041 oz/t for transition material. Mineral Resources for mill material
are based on a gold equivalent cut-off of 0.0050 oz/t.
6. The gold equivalent value for each material
is as follows:
Oxide (Leach): Gold equivalent (oz/t) = gold
(oz/t) + 0.00418 x silver (oz/t), based on gold recovery of 89% and silver recovery of 30%.
Transition (Leach): Gold equivalent = gold (oz/t)
+ 0.00382 x silver (oz/t), based on gold recovery of 65% and silver recovery of 20%.
Sulfide (Mill): Gold equivalent = gold (oz/t)
+ 0.0127 x silver (oz/t), based on gold recovery of 85% and silver recovery of 85%.
7. The gold equivalent values account for metal
recoveries, treatment charges, refining costs, and refinery payable percentages.
8. Table 11-4 accompanies this Mineral Resource
statement and shows all relevant parameters for mineral resources.
9. Includes 3.8% NSR royalty.
10. Mineral Resources are reported in relation
to a conceptual constraining pit shell to demonstrate reasonable prospects for economic extraction, as required by the definition of
Mineral Resource in S-K 1300; mineralization lying outside of the pit shell is excluded from the Mineral Resource.
11. The Mineral Resource estimate is also constrained
by the Richmond Hill Project Boundary. Only mineralization inside this boundary is included in the Mineral Resource Estimate, though
waste removal outside the boundary is allowed.
12. The Mineral Resources reported are contained
on mineral titles controlled by Dakota Gold.
13. The Mineral Resources are reported in-situ
without any dilution or loss considerations, as a point of reference.
| | M3-PN240322
3 February 2025
Revision 0 |
113 |
Dakota
Gold
Technical
Report
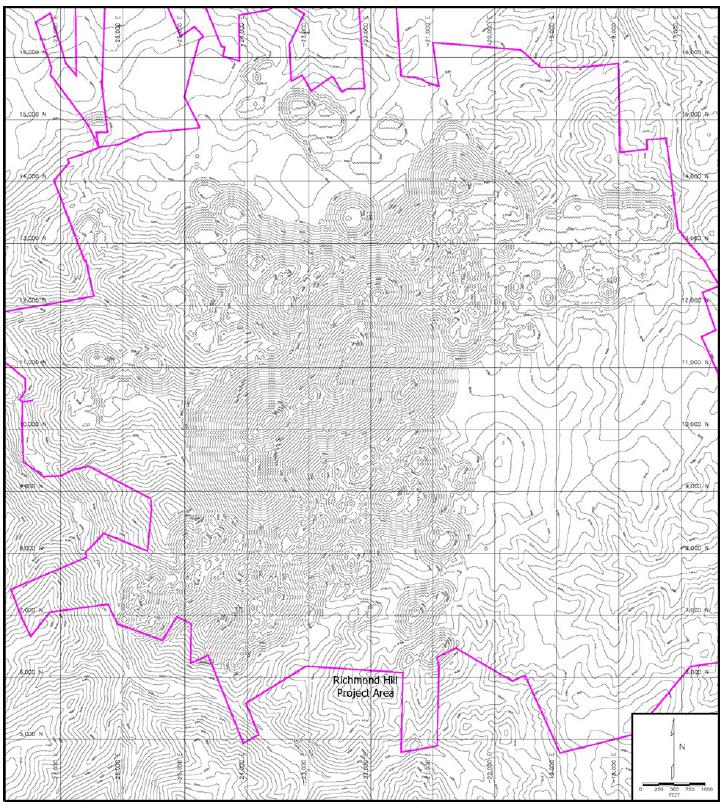
Figure 11-1: Constraining Shell for Mineral
Resource Estimate
A sensitivity analysis of metal prices was conducted
for the mineral resource estimate at the following prices:
| · | $1600/oz gold and $20.00/oz silver, |
| · | $1800/oz gold and $22.25/oz silver, |
| | M3-PN240322
3 February 2025
Revision 0 |
114 |
Dakota
Gold
Technical
Report
| · | $2000/oz gold and $25.00/oz silver (base case), |
| · | $2200/oz gold and $27.50/oz silver, and |
| · | $2400/oz gold and $30.00/oz silver. |
Restraining pit shells were developed for each
case and resources calculated at gold equivalent cut-off grades appropriate for the case. Table 11-2 shows the results of the sensitivity
analysis for the leach resource. Total kilotons for each case are also provided to gauge the increase in the size of the constraining
pit shells. The leach mineral resource is insensitive to prices. A relatively large amount of the available mineral resource is extracted
at the $1600/oz gold price and the increase in resource at higher prices is modest, even up to the $2400/oz price. Note that total tons
increased from 1.1 billion tons to 1.5 billion tons with a small impact on the mineral resource.
Table 11-3 shows the results of the sensitivity
analysis for mill resource. Measured and indicated mineral resources are insensitive to price. Inferred mineral resource increased from
141.2 million tons in the $1600/oz case to 240.9 million tons for the $2400/oz case, an increase of about 70%. Contained gold ounces increased
about 43% between the $1600/oz and $2400/oz case for inferred mineral resources.
Table 11-2: Mineral Resource at Various Prices
– Leach Resources
| Price/Resource Category |
|
AuEq COG
(oz/t) |
|
Ktons |
|
AuEq
(oz/t) |
|
Gold
(oz/t) |
|
Silver
(oz/t) |
|
Gold
(koz) |
|
Silver
(koz) |
|
Total
Ktons |
|
| $1600 Gold, $20.00 Silver: |
|
|
|
|
|
|
|
|
|
|
|
|
|
|
|
|
|
|
|
|
|
|
|
|
|
| Measured Mineral Resource |
|
|
Oxide |
|
|
108,414 |
|
|
0.0170 |
|
|
0.0164 |
|
|
0.166 |
|
|
1,778.0 |
|
|
17,997 |
|
|
|
|
| Indicated Mineral Resource |
|
|
0.0032 |
|
|
143,593 |
|
|
0.0131 |
|
|
0.0126 |
|
|
0.132 |
|
|
1,809.3 |
|
|
18,954 |
|
|
|
|
| Meas/Indic Mineral Resource |
|
|
Transition |
|
|
252,007 |
|
|
0.0148 |
|
|
0.0142 |
|
|
0.147 |
|
|
3,587.3 |
|
|
36,951 |
|
|
1,095,300 |
|
| Inferred Mineral Resource |
|
|
0.0052 |
|
|
211,774 |
|
|
0.0117 |
|
|
0.0113 |
|
|
0.097 |
|
|
2,393.0 |
|
|
20,542 |
|
|
|
|
| $1800 Gold, $22.50 Silver: |
|
|
|
|
|
|
|
|
|
|
|
|
|
|
|
|
|
|
|
|
|
|
|
|
|
| Measured Mineral Resource |
|
|
Oxide |
|
|
111,432 |
|
|
0.0167 |
|
|
0.0160 |
|
|
0.163 |
|
|
1,782.9 |
|
|
18,163 |
|
|
|
|
| Indicated Mineral Resource |
|
|
0.0029 |
|
|
149,415 |
|
|
0.0128 |
|
|
0.0122 |
|
|
0.130 |
|
|
1,822.9 |
|
|
19,424 |
|
|
|
|
| Meas/Indic Mineral Resource |
|
|
Transition |
|
|
260,847 |
|
|
0.0145 |
|
|
0.0138 |
|
|
0.144 |
|
|
3,605.8 |
|
|
37,587 |
|
|
1,209,836 |
|
| Inferred Mineral Resource |
|
|
0.0046 |
|
|
231,589 |
|
|
0.0111 |
|
|
0.0107 |
|
|
0.093 |
|
|
2,478.0 |
|
|
21,538 |
|
|
|
|
| $2000 Gold, $25.00 Silver: |
|
|
|
|
|
|
|
|
|
|
|
|
|
|
|
|
|
|
|
|
|
|
|
|
|
| Measured Mineral Resource |
|
|
Oxide |
|
|
113,748 |
|
|
0.0164 |
|
|
0.0158 |
|
|
0.160 |
|
|
1,793.4 |
|
|
18,208 |
|
|
|
|
| Indicated Mineral Resource |
|
|
0.0026 |
|
|
156,019 |
|
|
0.0125 |
|
|
0.0119 |
|
|
0.128 |
|
|
1,860.0 |
|
|
19,884 |
|
|
|
|
| Meas/Indic Mineral Resource |
|
|
Transition |
|
|
269,768 |
|
|
0.0141 |
|
|
0.0135 |
|
|
0.141 |
|
|
3,653.3 |
|
|
38,092 |
|
|
1,367,025 |
|
| Inferred Mineral Resource |
|
|
0.0041 |
|
|
254,186 |
|
|
0.0106 |
|
|
0.0103 |
|
|
0.090 |
|
|
2,613.4 |
|
|
22,787 |
|
|
|
|
| $2200 Gold, $27.50 Silver: |
|
|
|
|
|
|
|
|
|
|
|
|
|
|
|
|
|
|
|
|
|
|
|
|
|
| Measured Mineral Resource |
|
|
Oxide |
|
|
115,438 |
|
|
0.0162 |
|
|
0.0156 |
|
|
0.159 |
|
|
1,800.8 |
|
|
18,355 |
|
|
|
|
| Indicated Mineral Resource |
|
|
0.0023 |
|
|
159,556 |
|
|
0.0122 |
|
|
0.0117 |
|
|
0.126 |
|
|
1,866.8 |
|
|
20,104 |
|
|
|
|
| Meas/Indic Mineral Resource |
|
|
Transition |
|
|
274,994 |
|
|
0.0139 |
|
|
0.0133 |
|
|
0.140 |
|
|
3,667.6 |
|
|
38,459 |
|
|
1,416,143 |
|
| Inferred Mineral Resource |
|
|
0.0038 |
|
|
264,912 |
|
|
0.0104 |
|
|
0.0100 |
|
|
0.087 |
|
|
2,649.1 |
|
|
23,047 |
|
|
|
|
| $2400 Gold, $30.00 Silver: |
|
|
|
|
|
|
|
|
|
|
|
|
|
|
|
|
|
|
|
|
|
|
|
|
|
| Measured Mineral Resource |
|
|
Oxide |
|
|
116,806 |
|
|
0.0161 |
|
|
0.0154 |
|
|
0.157 |
|
|
1,798.8 |
|
|
18,339 |
|
|
|
|
| Indicated Mineral Resource |
|
|
0.0021 |
|
|
162,506 |
|
|
0.0121 |
|
|
0.0116 |
|
|
0.124 |
|
|
1,885.1 |
|
|
20,151 |
|
|
|
|
| Meas/Indic Mineral Resource |
|
|
Transition |
|
|
279,312 |
|
|
0.0138 |
|
|
0.0132 |
|
|
0.138 |
|
|
3,683.9 |
|
|
38,489 |
|
|
1,505,715 |
|
| Inferred Mineral Resource |
|
|
0.0034 |
|
|
277,569 |
|
|
0.0101 |
|
|
0.0097 |
|
|
0.085 |
|
|
2,692.4 |
|
|
23,593 |
|
|
|
|
| | M3-PN240322
3 February 2025
Revision 0 |
115 |
Dakota
Gold
Technical
Report
Table 11-3: Mineral Resource at Various Prices
– Mill Resources
| Price/Resource Category |
|
AuEq COG
(oz/t) |
|
Ktons |
|
AuEq
(oz/t) |
|
Gold
(oz/t) |
|
Silver
(oz/t) |
|
Gold
(koz) |
|
Silver
(koz) |
|
Total
Ktons |
|
| $1600 Gold, $20.00 Silver: |
|
|
|
|
|
|
|
|
|
|
|
|
|
|
|
|
|
|
|
|
|
|
|
|
|
| Measured Mineral Resource |
|
|
|
|
|
19,115 |
|
|
0.0194 |
|
|
0.0174 |
|
|
0.158 |
|
|
332.6 |
|
|
3,020 |
|
|
|
|
| Indicated Mineral Resource |
|
|
Sulfide |
|
|
41,215 |
|
|
0.0158 |
|
|
0.0141 |
|
|
0.138 |
|
|
581.1 |
|
|
5,688 |
|
|
|
|
| Meas/Indic Mineral Resource |
|
|
0.0063 |
|
|
60,330 |
|
|
0.0169 |
|
|
0.0151 |
|
|
0.144 |
|
|
913.7 |
|
|
8,708 |
|
|
1,095,300 |
|
| Inferred Mineral Resource |
|
|
|
|
|
141,239 |
|
|
0.0153 |
|
|
0.0135 |
|
|
0.152 |
|
|
1,906.7 |
|
|
21,468 |
|
|
|
|
| $1800 Gold, $22.50 Silver: |
|
|
|
|
|
|
|
|
|
|
|
|
|
|
|
|
|
|
|
|
|
|
|
|
|
| Measured Mineral Resource |
|
|
|
|
|
19,989 |
|
|
0.0188 |
|
|
0.0169 |
|
|
0.154 |
|
|
337.8 |
|
|
3,078 |
|
|
|
|
| Indicated Mineral Resource |
|
|
Sulfide |
|
|
44,472 |
|
|
0.0152 |
|
|
0.0136 |
|
|
0.134 |
|
|
604.8 |
|
|
5,959 |
|
|
|
|
| Meas/Indic Mineral Resource |
|
|
0.0056 |
|
|
64,461 |
|
|
0.0163 |
|
|
0.0146 |
|
|
0.140 |
|
|
942.6 |
|
|
9,038 |
|
|
1,209,836 |
|
| Inferred Mineral Resource |
|
|
|
|
|
170,316 |
|
|
0.0146 |
|
|
0.0128 |
|
|
0.149 |
|
|
2,180.0 |
|
|
25,377 |
|
|
|
|
| $2000 Gold, $25.00 Silver: |
|
|
|
|
|
|
|
|
|
|
|
|
|
|
|
|
|
|
|
|
|
|
|
|
|
| Measured Mineral Resource |
|
|
|
|
|
20,703 |
|
|
0.0184 |
|
|
0.0165 |
|
|
0.151 |
|
|
341.6 |
|
|
3,126 |
|
|
|
|
| Indicated Mineral Resource |
|
|
Sulfide |
|
|
48,893 |
|
|
0.0147 |
|
|
0.0131 |
|
|
0.134 |
|
|
640.5 |
|
|
6,552 |
|
|
|
|
| Meas/Indic Mineral Resource |
|
|
0.0050 |
|
|
69,596 |
|
|
0.0158 |
|
|
0.0141 |
|
|
0.139 |
|
|
982.1 |
|
|
9,678 |
|
|
1,367,025 |
|
| Inferred Mineral Resource |
|
|
|
|
|
202,221 |
|
|
0.0139 |
|
|
0.0121 |
|
|
0.145 |
|
|
2,446.9 |
|
|
29,322 |
|
|
|
|
| $2200 Gold, $27.50 Silver: |
|
|
|
|
|
|
|
|
|
|
|
|
|
|
|
|
|
|
|
|
|
|
|
|
|
| Measured Mineral Resource |
|
|
|
|
|
21,165 |
|
|
0.0181 |
|
|
0.0163 |
|
|
0.149 |
|
|
345.0 |
|
|
3,154 |
|
|
|
|
| Indicated Mineral Resource |
|
|
Sulfide |
|
|
51,015 |
|
|
0.0143 |
|
|
0.0127 |
|
|
0.131 |
|
|
647.9 |
|
|
6,683 |
|
|
|
|
| Meas/Indic Mineral Resource |
|
|
0.0046 |
|
|
72,180 |
|
|
0.0154 |
|
|
0.0138 |
|
|
0.136 |
|
|
992.9 |
|
|
9,837 |
|
|
1,416,143 |
|
| Inferred Mineral Resource |
|
|
|
|
|
218,806 |
|
|
0.0135 |
|
|
0.0117 |
|
|
0.141 |
|
|
2,560.0 |
|
|
30,852 |
|
|
|
|
| $2400 Gold, $30.00 Silver: |
|
|
|
|
|
|
|
|
|
|
|
|
|
|
|
|
|
|
|
|
|
|
|
|
|
| Measured Mineral Resource |
|
|
|
|
|
21,589 |
|
|
0.0178 |
|
|
0.0160 |
|
|
0.147 |
|
|
345.4 |
|
|
3,174 |
|
|
|
|
| Indicated Mineral Resource |
|
|
Sulfide |
|
|
53,408 |
|
|
0.0140 |
|
|
0.0124 |
|
|
0.128 |
|
|
662.3 |
|
|
6,836 |
|
|
|
|
| Meas/Indic Mineral Resource |
|
|
0.0042 |
|
|
74,997 |
|
|
0.0151 |
|
|
0.0134 |
|
|
0.133 |
|
|
1,007.7 |
|
|
10,010 |
|
|
1,505,715 |
|
| Inferred Mineral Resource |
|
|
|
|
|
240,938 |
|
|
0.0130 |
|
|
0.0113 |
|
|
0.136 |
|
|
2,722.6 |
|
|
32,768 |
|
|
|
|
| 11.3 | Mineral Resource Parameters |
Metal prices for the Mineral Resource estimate
are $2000/oz gold and $25/oz silver. These prices are reasonable based on: 1) historical 3-year trailing averages, 2) prices used by other
companies for comparable projects, and 3) long range consensus price forecasts prepared by various bank analysts.
Table 11-4 shows the economic parameters for the
mineral resources estimate. The mining cost is estimated at $2.15 per total ton. This cost is based on a review of comparable projects
in the western US.
The unit processing costs were estimated by Woods
for the various material types at $3.39/t for oxide leach material, $4.14/t for transition leach material and $6.82/t for sulfide mill
material. The costs are based on a nominal process production rate of 30,000 tons per day or about 10.95 million tons per year. The gold
and silver recovery estimates were also estimated by Woods based on the available testing data.
The unit G&A cost of $1.00/t amounts to $912,500
per month which is a reasonable estimate for this mineral resource estimate.
IMC assumed refinery payables of 100% for gold
and 100% for silver and refining costs of $5.00/oz gold and $0.25/oz silver for leach material. Woods estimated payable amounts of 95.5%
for gold and 95.0% for silver for mill material, based on the mill producing a marketable gold sulfide concentrate by flotation. Treatment
and refining costs for mill material are estimated at $6.00/oz gold and $0.40/oz silver. The Project is also subject to a 3.8% NSR royalty.
| | M3-PN240322
3 February 2025
Revision 0 |
116 |
Dakota
Gold
Technical
Report
Due to two products, and variable recoveries by
material type, a gold equivalent value was calculated for each block to tabulate proposed quantities of resource. First, the gold and
silver NSR factors are calculated as follows for oxide:
Gold NSR Factor = ($2000 – $5.00) x 0.89
x 1.00 x 0.962 = $1,708/t
Silver NSR Factor = ($25 – $0.25) x 0.20
x 1.00 x 0.962 = $7.14/t
The units are US$ per ounce. The 0.962 term represents
an allowance for the royalty.
The silver factor for the gold equivalent calculation
is:
Ag Factor for Gold Equivalent = Silver
NSR Factor / Gold NSR Factor
Ag Factor for Gold Equivalent = $7.14
/ $1,708 = 0.00418
AuEq (oz/t) = gold (oz/t) + 0.00418
x silver (oz/t)
For oxide the breakeven gold equivalent cut-off
grade is 0.0038 oz/t and the internal cut-off grade is 0.0026 oz/t. Internal cut-off applies to blocks that must be removed from the pit,
so mining is a sunk cost.
The parameters and cut-offs for the other material
types are also shown on Table 11-4. The gold equivalent cut-off grades vary by material type.
Table 11-4: Economic Parameters for Mineral
Resource Estimate
Material Type
Process | |
Units | |
Oxide
Leach | | |
Trans
Leach | | |
Sulfide
Mill | | |
Waste | |
| Commodity Prices | |
| |
| | | |
| | | |
| | | |
| | |
| Gold Price Per Ounce | |
(US$) | |
| 2000 | | |
| 2000 | | |
| 2000 | | |
| | |
| Silver Price Per Ounce | |
(US$) | |
| 25.00 | | |
| 25.00 | | |
| 25.00 | | |
| | |
| Plant Production Rate | |
(ktpy) | |
| 10,950 | | |
| 10,950 | | |
| 10,950 | | |
| | |
| Mining Cost Per Total Tonne | |
| |
| | | |
| | | |
| | | |
| | |
| Mining Cost | |
(US$) | |
| 2.150 | | |
| 2.150 | | |
| 2.150 | | |
| 2.150 | |
| Process and G&A Cost Per Tonne | |
| |
| | | |
| | | |
| | | |
| | |
| Processing | |
(US$) | |
| 3.390 | | |
| 4.150 | | |
| 6.830 | | |
| | |
| G&A | |
(US$) | |
| 1.000 | | |
| 1.000 | | |
| 1.000 | | |
| | |
| Total Process and G&A | |
(US$) | |
| 4.390 | | |
| 5.150 | | |
| 7.830 | | |
| | |
| Plant Recovery | |
| |
| | | |
| | | |
| | | |
| | |
| Gold | |
(%) | |
| 89 | % | |
| 65 | % | |
| 85 | % | |
| | |
| Silver | |
(%) | |
| 30 | % | |
| 20 | % | |
| 85 | % | |
| | |
| Treatment/Refining Payables and Costs | |
| |
| | | |
| | | |
| | | |
| | |
| Gold Payable | |
(%) | |
| 100.0 | % | |
| 100.0 | % | |
| 95.5 | % | |
| | |
| Silver Payable | |
(%) | |
| 100.0 | % | |
| 100.0 | % | |
| 95.0 | % | |
| | |
| Gold Treatment/Refining Per Ounce | |
(US$) | |
| 5.00 | | |
| 5.00 | | |
| 6.00 | | |
| | |
| Silver Treatment/Refining Per Ounce | |
(US$) | |
| 0.25 | | |
| 0.25 | | |
| 0.40 | | |
| | |
| Royalties | |
| |
| | | |
| | | |
| | | |
| | |
| Royalty | |
(%) | |
| 3.8 | % | |
| 3.8 | % | |
| 3.8 | % | |
| | |
| NSR Factors | |
| |
| | | |
| | | |
| | | |
| | |
| Gold NSR Factor | |
($/oz) | |
| 1,708 | | |
| 1,247 | | |
| 1,557 | | |
| | |
| | M3-PN240322
3 February 2025
Revision 0 |
117 |
Dakota
Gold
Technical
Report
Material Type
Process | |
Units | |
Oxide
Leach | | |
Trans
Leach | | |
Sulfide
Mill | | |
Waste | |
| Silver NSR Factor | |
($/oz) | |
| 7.14 | | |
| 4.76 | | |
| 19.11 | | |
| | |
| Silver Factor for Gold Equivalent | |
(none) | |
| 0.00418 | | |
| 0.00382 | | |
| 0.01227 | | |
| | |
| Gold Equivalent Cutoff Grade | |
| |
| | | |
| | | |
| | | |
| | |
| Breakeven Cutoff Grade | |
(oz/t) | |
| 0.0038 | | |
| 0.0059 | | |
| 0.0064 | | |
| | |
| Internal Cutoff Grade | |
(oz/t) | |
| 0.0026 | | |
| 0.0041 | | |
| 0.0050 | | |
| | |
| 11.4 | Additional Information |
The mineral resources are classified in accordance
with the requirements of S-K 1300. The mineral resource estimate reflects the reasonable expectation that all necessary permits and approvals
will be obtained and maintained. It is the opinion of the QP for this section that technical and economic factors likely to influence
the prospects of economic extraction can be resolved with additional work. In particular, more metallurgical testing will better define
process methods, metal recoveries and costs. More drilling will better define geologic domains in some areas of the deposit.
There is uncertainty in the estimates of measured,
indicated, and inferred mineral resources. Some of the sources of uncertainty are common to all projects and all classes of the mineral
resources and include: the spatial location of the samples, sample recovery in the drilling and sampling processes, assaying methods and
results, data processing and handling, assumptions of geologic interpretations and continuity of grades between samples.
Uncertainty in the estimation of measured mineral
resources should be relatively low. The sampling density is sufficient that the potential sources of uncertainty listed above should largely
by mitigated by various sampling from various time periods and companies.
The uncertainty related to indicated mineral resources
is higher than measured mineral resources due to lower sampling density and lower confidence in geologic interpretation. However, the
data density is adequate for reasonable interpretations of geologic conditions and grade quality and continuity.
Uncertainty in the estimation of inferred mineral
resources can be high since sampling data is more limited and geologic uncertainty higher. However, given the relatively disseminated
nature of the deposit, the QP for this section is confident that the inferred mineral resources meet the criteria that the majority of
the inferred mineral resource can be upgraded to indicated or measured mineral resources with additional exploration.
There is no guarantee that any of the mineral
resources will be converted to mineral reserve. There is also no guarantee that any of the inferred mineral resources will be upgraded
to measured or indicated mineral resources or to mineral reserves. Mineral resources that are not mineral reserves do not have demonstrated
economic viability.
The Project is subject to the normal risks that
mining projects face including changes to metal prices, changes to government regulations, social risks, uncertainty in mineral resource
and recovery estimates, permitting risks, financing risks, and costs higher than forecast.
| 11.5 | Description of the Block Model |
The resource model is based on 20 ft. x 20 ft.
x 20 ft. high blocks. The coordinate system for the Project is a local system initiated by Homestake Mining Company.
| | M3-PN240322
3 February 2025
Revision 0 |
118 |
Dakota
Gold
Technical
Report
The drilling database provided to IMC consisted
of 1058 drillholes and 457,392 ft. of drilling. Ten of the holes were outside of the model limits. Drilling data in the model limits by
company is shown on Table 11-5. This represents the drilling data used for the resource model update.
Table 11-5: Drilling by Company in Model Limits
| Company | |
No. of Holes | | |
Feet | | |
Sample Intervals | |
| St. Joe, Bond Gold, Homestake | |
| 828 | | |
| 269,463 | | |
| 54,012 | |
| Coeur | |
| 74 | | |
| 27,280 | | |
| 2,722 | |
| Dakota Gold | |
| 146 | | |
| 149,410 | | |
| 30,743 | |
| All Drilling | |
| 1048 | | |
| 446,153 | | |
| 87,477 | |
Figure 11-2 shows drillholes by company and also
shows the locations for cross sections A-A’ and B-B’ that are referenced in this report section.
| | M3-PN240322
3 February 2025
Revision 0 |
119 |
Dakota
Gold
Technical
Report

Figure 11-2: Drillhole Locations by Company
| | M3-PN240322
3 February 2025
Revision 0 |
120 |
Dakota
Gold
Technical
Report
Rock type interpretations for seven major rock
types have been developed as 3D solids and incorporated into the resource model. Table 11-6 shows the rock types.
Table 11-6: Model Rock Types
| Rock Type | |
Code | |
Description |
| Tbx | |
20 | |
Tertiary Breccia |
| Tsl | |
30 | |
Tertiary Sills |
| Tdk | |
40 | |
Tertiary Dikes |
| Pzu | |
45 | |
Paleozoics-Undifferentiated |
| Cdw | |
50 | |
Cambrian Deadwood |
| Pgn | |
60 | |
Precambrian Greenstone |
| Pff | |
70 | |
Precambrian Flagrock |
| Pef | |
80 | |
Precambrian Ellison |
Figure 11-3 shows the rock types projected on
the resource shell walls and surface topography. Figure 11-4 and Figure 11-5 show the rock types on the A-A’ and B-B’ cross
sections respectively.
All the rock types host economic mineralization.
The contacts between the Precambrian units are steep and trend north-south. The Precambrian Flagrock is between the Precambrian Greenstone
to the west and Precambrian Ellison to the east. The Tertiary breccia and Tertiary dikes are steep north-south trending units. The Cambrian
Deadwood and Tertiary sills are flatter lying units.
The 3D solids were used to assign rock codes to
the model blocks and rock codes were also assigned to the assay database by back-assignment from the solids. There were rock type designations
in the database, but the back-assigned values were used for the resource model so the assay assignments would be consistent with the block
they were located.
| | M3-PN240322
3 February 2025
Revision 0 |
121 |
Dakota
Gold
Technical
Report

Figure 11-3: Rock Types on the Resource Shell
| | M3-PN240322
3 February 2025
Revision 0 |
122 |
Dakota
Gold
Technical
Report

Figure 11-4: Rock Types on Cross Section A-A’
| | M3-PN240322
3 February 2025
Revision 0 |
123 |
Dakota
Gold
Technical
Report
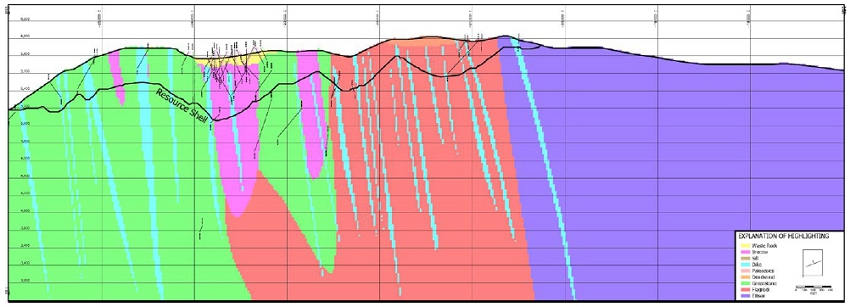
Figure 11-5: Rock Types on Section B-B’
| | M3-PN240322
3 February 2025
Revision 0 |
124 |
Dakota
Gold
Technical
Report
Interpretation of oxidations zones were developed
as surfaces and incorporated into the resource model. The surfaces were developed based on ratio of cyanide soluble to total gold assays
in the Dakota Gold drilling and cyanide soluble to total gold ratios in bottle roll tests conducted for the St. Joe and Bond Gold drilling.
Table 11-7 shows the zones and definition.
Table 11-7: Model Oxidation Zones
| Oxidation Type | |
Code | |
Definition |
| Oxide | |
10 | |
Ratio of CNAu/Au >70% |
| Transition | |
20 | |
70% < CNAu/Au < 40% |
| Sulfide | |
30 | |
Ratio of CnAu/Au < 40% |
Figure 11-6 shows the oxidation zones on the walls
of the resource shell. The oxidation zones did not impact grade estimation but are important for metallurgical purposes.
This is a significant change from the model used
for the October 2023 mineral resource estimate. For that model the domains were designed based on picks of oxide, transition, and
sulfide minerals as noted in the drilling logs. Most of the holes were drilled using reverse circulation, so only chips were available
for logging. The updated zones increased the size of the oxide zone and reduced the size of the sulfide zone. Analytical data has confirmed
that the transition zone is thinner than previously estimated.
| | M3-PN240322
3 February 2025
Revision 0 |
125 |
Dakota
Gold
Technical
Report
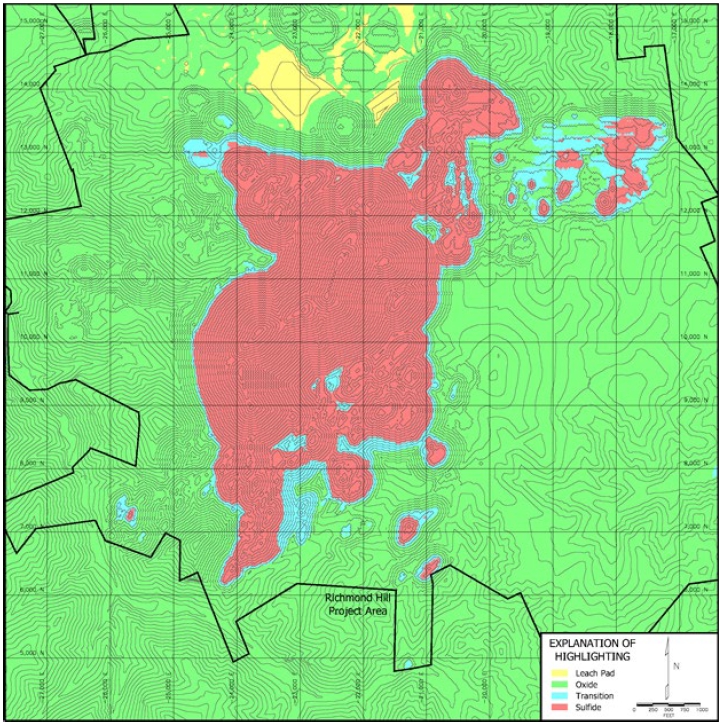
Figure 11-6: Oxidation Zones on the Resource
Shell
| 11.5.4 | Cap Grades and Compositing |
Probability plots and sorted lists of the higher-grade
assay intervals for gold and silver were examined to determine cap grades. Table 11-8 shows the cap grades and the number of assays capped
by rock type. A relatively small numbers of assays were capped for each metal in each population. The cap grades generally correspond
to the upper 99.9 percentile of the populations.
The assay database was composited to regular 10
ft. downhole composites. It is noted this is one-half of the 20 ft. bench height used for the model. The smaller composite length allows
capturing some of the narrower dikes and sills and also tends to result in less grade smoothing during block grade estimation. The rock
type was not respected during compositing; the composite rock type was based on the majority rock type.
| | M3-PN240322
3 February 2025
Revision 0 |
126 |
Dakota
Gold
Technical
Report
Table 11-8: Cap Grades and Number of Assays
Capped
| Lithology | | |
| |
Au Cap | | |
Ag Cap | | |
Ag Cap | | |
Number of Assays | |
| Code | | |
Lithology | |
(oz/t) | | |
(ppm) | | |
(oz/t) | | |
Gold | | |
Silver | |
| 20 | | |
Tertiary Breccia | |
| 0.30 | | |
| 65 | | |
| 1.90 | | |
| 19 | | |
| 19 | |
| 30 | | |
Tertiary Sills | |
| 0.15 | | |
| 95 | | |
| 2.77 | | |
| 6 | | |
| 7 | |
| 40 | | |
Tertiary Dikes | |
| 0.23 | | |
| 70 | | |
| 2.04 | | |
| 12 | | |
| 11 | |
| 45 | | |
Paleozoic (undif) | |
| 0.09 | | |
| none | | |
| none | | |
| 4 | | |
| none | |
| 50 | | |
Cambrian Deadwood | |
| 0.20 | | |
| 180 | | |
| 5.25 | | |
| 16 | | |
| 13 | |
| 60 | | |
Precambrian Greenstone | |
| 0.33 | | |
| 85 | | |
| 2.48 | | |
| 19 | | |
| 16 | |
| 70 | | |
Precambrian Flagrock | |
| 0.30 | | |
| 200 | | |
| 5.83 | | |
| 9 | | |
| 14 | |
| 80 | | |
Precambrian Ellison | |
| 0.15 | | |
| 80 | | |
| 2.33 | | |
| 6 | | |
| 5 | |
Table 11-9 shows summary statistics for gold and
silver for the assay intervals. The table shows values by the major rock types. The left side of the table shows uncapped values and the
right side shows capped values. For gold the Tertiary sills and the Precambrian Ellison are lower in grade than the other units. The Paleozoic
rock types are adjacent to the main deposit area and don’t have much drilling. For silver, the Cambrian Deadwood is considerably
higher than the other units. Minimum values for the samples represented on the table are 0.0001 oz/t for gold and 0.001 oz/t for silver.
Also, the statistics are limited to samples in the model limits.
Table 11-10 shows summary statistics for 10 ft.
composites. The statistics are based on composites with a minimum gold value of 0.0001 oz/t and silver value of 0.001 oz/t, but lower
grade assays, including 0, are incorporated into the composites.
Figure 11-7 shows a probability plot of gold in
the composites for the various rock types. The lower grade nature of the Tertiary sills and Precambrian Ellison are evident on the plot.
Figure 11-8 shows the probability plot for silver. The higher-grade nature of the Deadwood is evident.
| | M3-PN240322
3 February 2025
Revision 0 |
127 |
Dakota
Gold
Technical
Report
Table 11-9: Summary Statistics of Assays
| | |
Not Capped | | |
Capped | |
| | |
No. of | | |
Mean | | |
Std Dev | | |
Max | | |
No. of | | |
Mean | | |
Std Dev | | |
Max | |
| Metal/Rock Type | |
Samples | | |
(oz/t) | | |
(oz/t) | | |
(oz/t) | | |
Samples | | |
(oz/t) | | |
(oz/t) | | |
(oz/t) | |
| Gold: | |
| | |
| | |
| | |
| | |
| | |
| | |
| | |
| |
| All Samples | |
| 77,826 | | |
| 0.0135 | | |
| 0.0248 | | |
| 0.955 | | |
| 77,826 | | |
| 0.0133 | | |
| 0.0224 | | |
| 0.330 | |
| Tbx-Breccia | |
| 17,047 | | |
| 0.0152 | | |
| 0.0262 | | |
| 0.955 | | |
| 17,047 | | |
| 0.0151 | | |
| 0.0238 | | |
| 0.300 | |
| Tsl-Sills | |
| 4,959 | | |
| 0.0089 | | |
| 0.0150 | | |
| 0.381 | | |
| 4,959 | | |
| 0.0089 | | |
| 0.0138 | | |
| 0.150 | |
| Tdk-Dikes | |
| 10,026 | | |
| 0.0121 | | |
| 0.0214 | | |
| 0.653 | | |
| 10,026 | | |
| 0.0119 | | |
| 0.0194 | | |
| 0.230 | |
| Pzu-Paleozoic | |
| 1,640 | | |
| 0.0068 | | |
| 0.0228 | | |
| 0.685 | | |
| 12,715 | | |
| 0.0145 | | |
| 0.0192 | | |
| 0.200 | |
| Cdw-Deadwood | |
| 12,715 | | |
| 0.0146 | | |
| 0.0205 | | |
| 0.420 | | |
| 15,162 | | |
| 0.0149 | | |
| 0.0283 | | |
| 0.330 | |
| Pgn-Greenstone | |
| 15,162 | | |
| 0.0150 | | |
| 0.0312 | | |
| 0.830 | | |
| 13,193 | | |
| 0.0130 | | |
| 0.0225 | | |
| 0.300 | |
| Pff-Flagrock | |
| 13,193 | | |
| 0.0131 | | |
| 0.0248 | | |
| 0.732 | | |
| 3,084 | | |
| 0.0079 | | |
| 0.0147 | | |
| 0.150 | |
| Pef-Ellison | |
| 3,084 | | |
| 0.0082 | | |
| 0.0194 | | |
| 0.497 | | |
| 3,117 | | |
| 0.0079 | | |
| 0.0146 | | |
| 0.150 | |
| | |
No. of | | |
Mean | | |
Std Dev | | |
Max | | |
No. of | | |
Mean | | |
Std Dev | | |
Max | |
| Metal/Rock Type | |
Samples | | |
(oz/t) | | |
(oz/t) | | |
(oz/t) | | |
Samples | | |
(oz/t) | | |
(oz/t) | | |
(oz/t) | |
| Silver: | |
| | | |
| | | |
| | | |
| | | |
| | | |
| | | |
| | | |
| | |
| All Samples | |
| 69,627 | | |
| 0.128 | | |
| 0.402 | | |
| 44.77 | | |
| 69,627 | | |
| 0.124 | | |
| 0.263 | | |
| 5.83 | |
| Tbx-Breccia | |
| 16,320 | | |
| 0.107 | | |
| 0.180 | | |
| 8.00 | | |
| 16,320 | | |
| 0.105 | | |
| 0.146 | | |
| 1.90 | |
| Tsl-Sills | |
| 3,716 | | |
| 0.110 | | |
| 0.393 | | |
| 15.00 | | |
| 3,716 | | |
| 0.102 | | |
| 0.236 | | |
| 2.77 | |
| Tdk-Dikes | |
| 9,084 | | |
| 0.107 | | |
| 0.206 | | |
| 7.38 | | |
| 9,084 | | |
| 0.105 | | |
| 0.160 | | |
| 2.04 | |
| Pzu-Paleozoic | |
| 824 | | |
| 0.065 | | |
| 0.084 | | |
| 0.58 | | |
| 824 | | |
| 0.065 | | |
| 0.084 | | |
| 0.58 | |
| Cdw-Deadwood | |
| 9,272 | | |
| 0.238 | | |
| 0.471 | | |
| 11.68 | | |
| 9,272 | | |
| 0.237 | | |
| 0.445 | | |
| 5.25 | |
| Pgn-Greenstone | |
| 14,501 | | |
| 0.103 | | |
| 0.286 | | |
| 25.78 | | |
| 14,501 | | |
| 0.100 | | |
| 0.173 | | |
| 2.48 | |
| Pff-Flagrock | |
| 13,185 | | |
| 0.136 | | |
| 0.650 | | |
| 44.77 | | |
| 13,185 | | |
| 0.126 | | |
| 0.337 | | |
| 5.83 | |
| Pef-Ellison | |
| 2,725 | | |
| 0.098 | | |
| 0.538 | | |
| 24.03 | | |
| 2,725 | | |
| 0.086 | | |
| 0.209 | | |
| 2.33 | |
Table 11-10: Summary Statistics of 10 ft. Composites
| | |
Not Capped | | |
Capped | |
| | |
No. of | | |
Mean | | |
Std Dev | | |
Max | | |
No. of | | |
Mean | | |
Std Dev | | |
Max | |
| Metal/Rock
Type | |
Samples | | |
(oz/t) | | |
(oz/t) | | |
(oz/t) | | |
Samples | | |
(oz/t) | | |
(oz/t) | | |
(oz/t) | |
| Gold: | |
| | |
| | |
| | |
| | |
| | |
| | |
| | |
| |
| All Samples | |
| 40,576 | | |
| 0.0129 | | |
| 0.0213 | | |
| 0.488 | | |
| 40,576 | | |
| 0.0128 | | |
| 0.0197 | | |
| 0.330 | |
| Tbx-Breccia | |
| 8,475 | | |
| 0.0152 | | |
| 0.0242 | | |
| 0.488 | | |
| 8,475 | | |
| 0.0150 | | |
| 0.0220 | | |
| 0.300 | |
| Tsl-Sills | |
| 2,834 | | |
| 0.0086 | | |
| 0.0133 | | |
| 0.193 | | |
| 2,834 | | |
| 0.0085 | | |
| 0.0126 | | |
| 0.149 | |
| Tdk-Dikes | |
| 5,250 | | |
| 0.0116 | | |
| 0.0189 | | |
| 0.431 | | |
| 5,250 | | |
| 0.0114 | | |
| 0.0171 | | |
| 0.223 | |
| Pzu-Paleozoic | |
| 929 | | |
| 0.0061 | | |
| 0.0162 | | |
| 0.351 | | |
| 929 | | |
| 0.0054 | | |
| 0.0077 | | |
| 0.067 | |
| Cdw-Deadwood | |
| 7,094 | | |
| 0.0137 | | |
| 0.0178 | | |
| 0.324 | | |
| 7,094 | | |
| 0.0136 | | |
| 0.0168 | | |
| 0.200 | |
| Pgn-Greenstone | |
| 7,572 | | |
| 0.0146 | | |
| 0.0260 | | |
| 0.441 | | |
| 7,572 | | |
| 0.0144 | | |
| 0.0246 | | |
| 0.330 | |
| Pff-Flagrock | |
| 6,734 | | |
| 0.0125 | | |
| 0.0202 | | |
| 0.369 | | |
| 6,734 | | |
| 0.0124 | | |
| 0.0192 | | |
| 0.285 | |
| Pef-Ellison | |
| 1,688 | | |
| 0.0079 | | |
| 0.0164 | | |
| 0.371 | | |
| 1,688 | | |
| 0.0076 | | |
| 0.0125 | | |
| 0.149 | |
| | |
No. of | | |
Mean | | |
Std Dev | | |
Max | | |
No. of | | |
Mean | | |
Std Dev | | |
Max | |
| Metal/Rock Type | |
Samples | | |
(oz/t) | | |
(oz/t) | | |
(oz/t) | | |
Samples | | |
(oz/t) | | |
(oz/t) | | |
(oz/t) | |
| Silver: | |
| | | |
| | | |
| | | |
| | | |
| | | |
| | | |
| | | |
| | |
| All Samples | |
| 35,431 | | |
| 0.127 | | |
| 0.303 | | |
| 18.03 | | |
| 35,431 | | |
| 0.123 | | |
| 0.232 | | |
| 5.47 | |
| Tbx-Breccia | |
| 8,005 | | |
| 0.106 | | |
| 0.139 | | |
| 3.63 | | |
| 8,005 | | |
| 0.105 | | |
| 0.126 | | |
| 1.90 | |
| Tsl-Sills | |
| 2,090 | | |
| 0.101 | | |
| 0.308 | | |
| 7.53 | | |
| 2,090 | | |
| 0.094 | | |
| 0.202 | | |
| 2.77 | |
| Tdk-Dikes | |
| 4,616 | | |
| 0.105 | | |
| 0.174 | | |
| 5.19 | | |
| 4,616 | | |
| 0.103 | | |
| 0.140 | | |
| 2.01 | |
| Pzu-Paleozoic | |
| 453 | | |
| 0.061 | | |
| 0.079 | | |
| 0.47 | | |
| 453 | | |
| 0.061 | | |
| 0.079 | | |
| 0.47 | |
| Cdw-Deadwood | |
| 5,276 | | |
| 0.229 | | |
| 0.426 | | |
| 9.20 | | |
| 5,276 | | |
| 0.226 | | |
| 0.399 | | |
| 5.25 | |
| Pgn-Greenstone | |
| 7,043 | | |
| 0.101 | | |
| 0.197 | | |
| 8.52 | | |
| 7,043 | | |
| 0.098 | | |
| 0.147 | | |
| 2.48 | |
| Pff-Flagrock | |
| 6,526 | | |
| 0.132 | | |
| 0.439 | | |
| 18.03 | | |
| 6,526 | | |
| 0.124 | | |
| 0.273 | | |
| 5.47 | |
| Pef-Ellison | |
| 1,422 | | |
| 0.098 | | |
| 0.373 | | |
| 10.34 | | |
| 1,422 | | |
| 0.087 | | |
| 0.187 | | |
| 2.33 | |
| | M3-PN240322
3 February 2025
Revision 0 |
128 |
Dakota
Gold
Technical
Report

Figure 11-7: Probability Plot of Gold by Rock
Type – 10 ft. Composites (IMC, 2024)
| | M3-PN240322
3 February 2025
Revision 0 |
129 |
Dakota
Gold
Technical
Report

Figure 11-8: Probability Plot of Silver by Rock
Type – 10 ft. Composites (IMC, 2024)
| | M3-PN240322
3 February 2025
Revision 0 |
130 |
Dakota
Gold
Technical
Report
A variogram analysis for gold mineralization was
completed for the major rock types. First, approximately 60 directional variograms were calculated to search the entire sphere in about
22.5-degree increments for each rock type. These were examined to find longest range, highest clarity, variograms that might be considered
to define the primary direction. Given a candidate, or candidates, for a primary direction, a series of eight variograms were calculated
to search the plane perpendicular to the primary direction, to look for the secondary and tertiary axes directions. Usually, good candidates
were evident for primary directions that seemed reasonable based on the geology. It is often difficult to define secondary and tertiary
directions because variogram ranges in those directions are similar to the spacing between the available samples. The variograms were
calculated on the 10 ft. composites and a modified covariance method was used for the calculations.
Figure 11-9 and Figure 11-10 show the variograms
for Tertiary breccia. The variograms represent the primary and secondary directions of mineralization as interpreted by the QP for this
section. The primary direction has an azimuth of 90° and a steep dip of 85°. This direction is consistent with the orientation
of the tertiary dikes that are prevalent. The secondary direction has an azimuth of 22° with a slight upward dip of 2°. The ranges
of the two variograms are about 250 ft. to 275 ft. The secondary variogram shows a slightly longer range, as fit, but the primary direction
variogram has much better clarity. The directions indicated by these variograms are also appropriate for the Tertiary dikes.
Figure 11-11 and Figure 11-12 show variograms
for Precambrian Greenstone. The primary direction is at an azimuth of 292° with a downward dip of 67°. The secondary axis has
an azimuth of 202° and no dip. The variogram for the primary direction is fit as two structures with ranges of 300 ft. and 500 ft.
respectively. The range of the secondary variogram is fit as 600 ft., but the variogram has less clarity than the primary direction.
Figure 11-13 and Figure 11-14 show variograms
for Precambrian Flagrock. The primary direction is at an azimuth of 45° with a no dip. The secondary axis has an azimuth of 135°
and downward dip of 45°. The variogram for the primary direction is fit as two structures with ranges of 300 ft. and 500 ft. respectively.
The range of the secondary variogram is fit as 300 ft.
Figure 11-15 and Figure 11-16 show variograms
for the Cambrian Deadwood. The primary direction is at an azimuth of 0° with a downward dip of 12°. The secondary axis has an
azimuth of 270° (or 90°) and no dip. The ranges of the two variograms are 275 ft. and 300 ft. respectively. These variograms are
also appropriate for the Tertiary sills.
Variograms for silver were also examined and there
did not appear to be significant differences in the orientations for silver versus gold. It is also considered that the directions are
reasonable given the geology and perceived orientation of mineralization as observed on sections.
| | M3-PN240322
3 February 2025
Revision 0 |
131 |
Dakota
Gold
Technical
Report

Figure 11-9: Variogram for Tertiary Breccia
– Azimuth 90°, Dip 85°
| | M3-PN240322
3 February 2025
Revision 0 |
132 |
Dakota
Gold
Technical
Report

Figure 11-10: Variogram for Tertiary Breccia
– Azimuth 22°, Dip -2°
| | M3-PN240322
3 February 2025
Revision 0 |
133 |
Dakota
Gold
Technical
Report

Figure 11-11: Variogram for Precambrian Greenstone
– Azimuth 292°, Dip 67°
| | M3-PN240322
3 February 2025
Revision 0 |
134 |
Dakota
Gold
Technical
Report

Figure 11-12: Variogram for Precambrian Greenstone
– Azimuth 202°, Dip 0°
| | M3-PN240322
3 February 2025
Revision 0 |
135 |
Dakota
Gold
Technical
Report

Figure 11-13: Variogram for Precambrian Flagrock
– Azimuth 45° - Dip 0°
| | M3-PN240322
3 February 2025
Revision 0 |
136 |
Dakota
Gold
Technical
Report

Figure 11-14: Variogram for Precambrian Flagrock
– Azimuth 135° – Dip 45°
| | M3-PN240322
3 February 2025
Revision 0 |
137 |
Dakota
Gold
Technical
Report

Figure 11-15: Variogram for Cambrian Deadwood
– Azimuth 0° – Dip 12°
| | M3-PN240322
3 February 2025
Revision 0 |
138 |
Dakota
Gold
Technical
Report

Figure 11-16: Variogram for Cambrian Deadwood
– Azimuth 270° – Dip 0°
| | M3-PN240322
3 February 2025
Revision 0 |
139 |
Dakota
Gold
Technical
Report
| 11.5.7 | Block Grade Estimation |
Block grades for gold and silver were estimated
with inverse distance with a power weight of 2 (ID2). The ID2 method was chosen because it generally results in less smoothing (smearing)
than ordinary kriging (OK). As previously discussed, the estimates are based on 10 ft. downhole composites. All estimates were done using
a maximum of 15 composites, a minimum of three composites, and a maximum of three composites per hole. A minimum of one hole was
allowed to estimate grades. This is a change from the AKF model that required a minimum of two holes. For the updated model, blocks estimated
with only one or two drillholes are classified as inferred mineral resources. The QP for this section believes this change is reasonable
and within industry practices.
Table 11-11 shows the estimation parameters for
gold and silver. The parameters show the orientation of the composite search ellipse and the search radii in the major, minor, and tertiary
axis directions. The search orientations for the Tertiary breccia, Tertiary dikes, Precambrian Greenstone, and Precambrian Flagrock are
relatively steep. The orientations for the Tertiary sills, Cambrian Deadwood, Precambrian Ellison and Undifferentiated Paleozoic units
are relatively flat with a slight plunge to the north. Much of the Precambrian Ellison sampling data is adjacent to, and below, the Cambrian
Deadwood. The search orientations and search radii were the same for gold and silver.
There were relatively few hard boundaries for
the estimations. For gold the hard boundaries were between the Deadwood and the Tertiary sills, the Deadwood and the Ellison, and the
Tertiary dikes and the Ellison. There were also hard boundaries between the Paleozoic units and the Tertiary breccia, Precambrian Greenstone,
Precambrian Flagrock, and Precambrian Ellison.
For silver the hard boundaries are between the
Deadwood and the Tertiary dikes and the Deadwood and the Ellison. There were also hard boundaries between the Paleozoic units and the
Tertiary breccia, Precambrian Greenstone, Precambrian Flagrock, and Precambrian Ellison.
The boundaries were evaluated independently for
gold and silver. The evaluation was based on pairing samples relatively short distances apart across the various boundaries and reviewing
statistics of the sample pairs to determine if a hard boundary was indicated. The analysis was done with assay data and 10 ft. composites.
A maximum separation distance of 30 ft. was used. For assays the data was examined in 5 ft. distance intervals and composites were examined
in 10 ft. intervals.
Figure 11-17 and Figure 11-18 show gold grades
on cross sections A-A’ and B-B’ respectively. In Figure 11-18 it can be seen where mining was conducted in the high-grade
portion of Richmond Hill. The area was also backfilled with the waste material from the prior mining.
Figure 11-19 shows silver grades on cross section
A-A’. Note the relatively high silver grades in the flat lying Deadwood Formation in Chism Gulch on the far right of the figure.
| | M3-PN240322
3 February 2025
Revision 0 |
140 |
Dakota
Gold
Technical
Report
Table 11-11: Estimation Parameters
| | |
| |
| |
Rotation Angles
(Note 1) | |
Search Radii | |
Number of Composites | |
|
Lithology
Code | |
Lithology | |
Allowable
Lith Codes | |
Theta
(deq) | |
Phi
(deq) | |
Psi
(deq) | |
Major
(ft) | |
Minor
(ft ) | |
Tertiary
(ft) | |
Max | |
Min | |
Max/
Hole | |
ID
Power |
| Gold: | |
| |
| |
| |
| |
| |
| |
| |
| |
| |
| |
| |
|
| 20 | |
Tertiary Breccia | |
All, except 45 | |
90 | |
-85 | |
-20 | |
250 | |
250 | |
62.5 | |
15 | |
3 | |
3 | |
2 |
| 30 | |
Tertiary Sills | |
All except 50 | |
0 | |
-12 | |
0 | |
250 | |
250 | |
50 | |
15 | |
3 | |
3 | |
2 |
| 40 | |
Tertiary Dikes | |
All except 80 | |
90 | |
-85 | |
-20 | |
250 | |
250 | |
50 | |
15 | |
3 | |
3 | |
2 |
| 45 | |
Paleozoic (undif) | |
30,40,45,50 | |
0 | |
-12 | |
0 | |
250 | |
250 | |
50 | |
15 | |
3 | |
3 | |
2 |
| 50 | |
Cambrian Deadwood | |
All except 30, 80 | |
0 | |
-12 | |
0 | |
250 | |
250 | |
50 | |
15 | |
3 | |
3 | |
2 |
| 60 | |
Precambrian Greenstone | |
All, except 45 | |
-68 | |
-67 | |
0 | |
250 | |
250 | |
62.5 | |
15 | |
3 | |
3 | |
2 |
| 70 | |
Precambrian Flagrock | |
All, except 45 | |
45 | |
0 | |
-45 | |
250 | |
125 | |
125 | |
15 | |
3 | |
3 | |
2 |
| 80 | |
Precambrian Ellison | |
All except 40, 45, 50 | |
0 | |
-12 | |
0 | |
250 | |
250 | |
50 | |
15 | |
3 | |
3 | |
2 |
| Silver | |
| |
| |
| |
| |
| |
| |
| |
| |
| |
| |
| |
|
| 20 | |
Tertiary Breccia | |
All, except 45 | |
90 | |
-85 | |
-20 | |
250 | |
250 | |
62.5 | |
15 | |
3 | |
3 | |
2 |
| 30 | |
Tertiary Sills | |
All | |
0 | |
-12 | |
0 | |
250 | |
250 | |
50 | |
15 | |
3 | |
3 | |
2 |
| 40 | |
Tertiary Dikes | |
All except 50 | |
90 | |
-85 | |
-20 | |
250 | |
250 | |
50 | |
15 | |
3 | |
3 | |
2 |
| 45 | |
Paleozoic (undif) | |
30,40,45,50 | |
0 | |
-12 | |
0 | |
250 | |
250 | |
50 | |
15 | |
3 | |
3 | |
2 |
| 50 | |
Cambrian Deadwood | |
All except 40, 80 | |
0 | |
-12 | |
0 | |
250 | |
250 | |
50 | |
15 | |
3 | |
3 | |
2 |
| 60 | |
Precambrian Greenstone | |
All, except 45 | |
-68 | |
-67 | |
0 | |
250 | |
250 | |
62.5 | |
15 | |
3 | |
3 | |
2 |
| 70 | |
Precambrian Flagrock | |
All, except 45 | |
45 | |
0 | |
-45 | |
250 | |
125 | |
125 | |
15 | |
3 | |
3 | |
2 |
| 80 | |
Precambrian Ellison | |
All except 45, 50 | |
0 | |
-12 | |
0 | |
250 | |
250 | |
50 | |
15 | |
3 | |
3 | |
2 |
| Note 1. | GSLIB convention for angles: |
| | theta - rotation of y (north)
axis clockwise to principal direction in horizontal plane. |
| | phi - dip of principal axis, negative is down. |
| | psi - rotation around principal axis, clockwise is negative. |
| | M3-PN240322
3 February 2025
Revision 0 |
141 |
Dakota
Gold
Technical
Report

Figure 11-17: Gold Grade on Cross Section A-A’
(See Figure 11-2)
| | M3-PN240322
3 February 2025
Revision 0 |
142 |
Dakota
Gold
Technical
Report

Figure 11-18: Gold Grades on Cross Section B-B’
(See Figure 11-2)
| | M3-PN240322
3 February 2025
Revision 0 |
143 |
Dakota
Gold
Technical
Report

Figure 11-19: Silver Grades on Cross Section A-A’
(See Figure 11-2)
| | M3-PN240322
3 February 2025
Revision 0 |
144 |
Dakota
Gold
Technical
Report
| 11.5.8 | Resource Classification |
To classify measured and indicated versus inferred
mineral resources, two additional block estimates were done to measure the average distance of each block to the nearest three and four
drillholes. These were based on the same search orientations and search radii as the gold grade estimates. The first estimate was based
on a maximum of four composites, a minimum of four, and a maximum of one composite per hole. The second estimate was based on a maximum
of three composites, a minimum of three, and a maximum of one composite per hole. These estimates provide the average distance to the
nearest three and four holes to each block and the distances were stored in the block model. Note the grades from these estimates were
not used.
Blocks with an average distance to the nearest
four holes less than 125 ft. were assigned as measured mineral resources. Blocks with an average distance to the nearest three holes less
than 175 ft. (and not measured) were assigned as indicated mineral resource. This includes all blocks estimated with only one or two drillholes.
Remaining blocks with an estimated gold grade were assigned to inferred mineral resource. Generally (not specific to Richmond Hill) an
average distance to the nearest four holes of 125 ft. corresponds to an average drill spacing of about 150 ft., and an average distance
to the nearest three holes of 175 ft. corresponds to an average drill spacing of about 230 ft. These estimates are approximate. Due to
many angle holes from common drilling pads, the Richmond sample spacing fluctuates widely.
Figure 11-20 and Figure 11-21 show probability
plots of the average distance to the nearest three and four holes. Figure 11-22 and Figure 11-23 show the resource classification on cross
sections A-A’ and B-B’ respectively.
After calculating the average distances to the
blocks and assigning an initial classification a filtering algorithm was applied to the classification. The purpose of the filtering was
to remove small clusters of blocks surrounded by blocks of different classification and to smooth out the boundaries of the various categories.
The filtering identified blocks that were contacted on three or four edges by blocks of a different resource category. Five filtering
passes were done, and each pass consisted of the following steps:
| · | Measured blocks with 3 or 4 adjacent indicated
blocks were set to indicated. |
| · | Measured blocks with 3 or 4 adjacent inferred
blocks were set to inferred (rare case). |
| · | Indicated blocks with 3 or 4 adjacent measured
blocks were set to measured. |
| · | Indicated blocks with 3 or 4 adjacent inferred
blocks were set to inferred. |
| · | Inferred blocks with 3 or 4 adjacent measured
blocks were set to measured (rare case). |
| · | Inferred blocks with 3 or 4 adjacent indicated
blocks were set to indicated. |
| · | Measured blocks with 3 or 4 adjacent indicated
or inferred blocks were set to indicated. |
| · | Indicated blocks with 3 or 4 adjacent measured
or inferred blocks were set to inferred. |
| · | Inferred blocks with 3 or 4 adjacent measured
or indicated blocks were set to indicated. |
The QP for this section is of the opinion that
the classifications of measured, indicated, and inferred mineral resources are adequate. When examined on cross sections, the measured
mineral resources correspond to a high density of sampling information, sufficient to allow accurate geologic interpretation and confirm
grade quality and continuity.
When examined on cross sections, the indicated
mineral resources correspond to a reasonable level of data density, though less than the measured mineral resources. The data density
is adequate for reasonable interpretations of geologic conditions and grade quality and continuity.
Inferred mineral resources are based on some,
but more limited sampling data, sometimes only one drillhole. However, given the relatively disseminated distribution of grades in the
deposit, the QP for this section is confident that the majority of the inferred mineral resource can be upgraded to measured or indicated
mineral resource with additional exploration.
| | M3-PN240322
3 February 2025
Revision 0 |
145 |
Dakota
Gold
Technical
Report
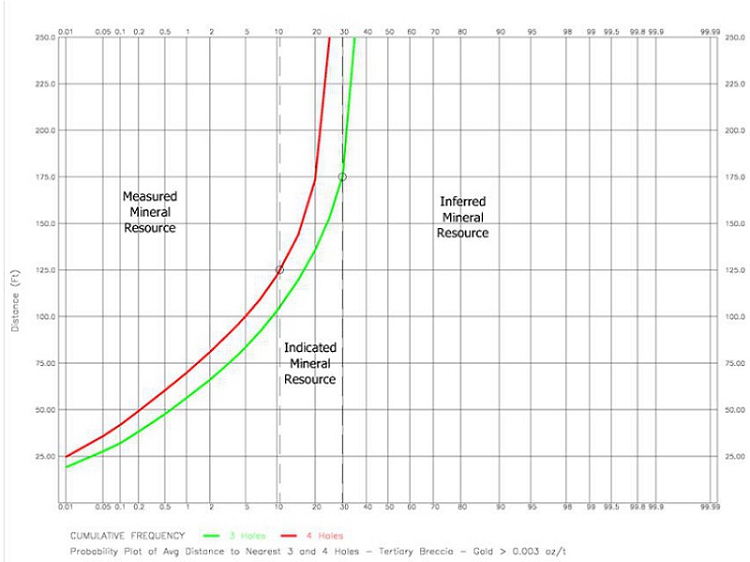
Figure 11-20: Probability Plot of Average Distance
to Nearest 3 and 4 Holes – Tertiary Breccia
| | M3-PN240322
3 February 2025
Revision 0 |
146 |
Dakota
Gold
Technical
Report
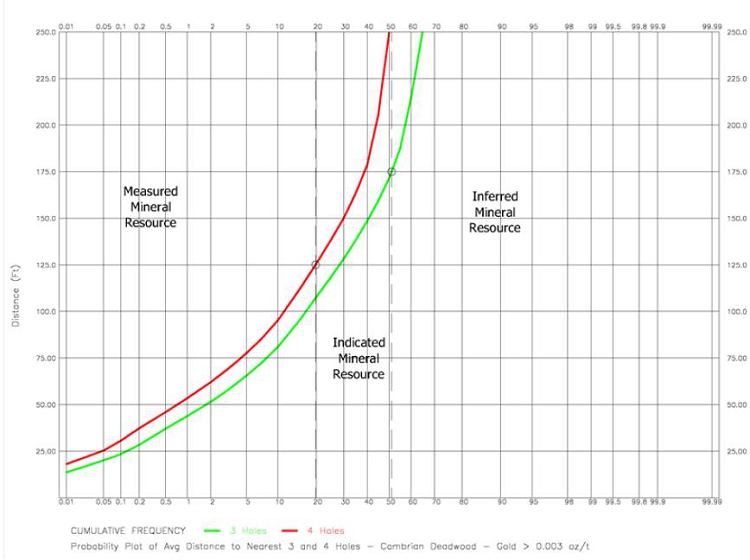
Figure 11-21: Probability Plot of Average Distance
to Nearest 3 and 4 Holes – Cambrian Deadwood
| | M3-PN240322
3 February 2025
Revision 0 |
147 |
Dakota
Gold
Technical
Report

Figure 11-22: Resource Classification on Cross
Section A-A’
| | M3-PN240322
3 February 2025
Revision 0 |
148 |
Dakota
Gold
Technical
Report

Figure 11-23: Resource Classification on Cross
Section B-B’
| | M3-PN240322
3 February 2025
Revision 0 |
149 |
Dakota
Gold
Technical
Report
The drilling database included about 13,700 specific
gravity measurements for Dakota Gold drill core that were conducted by Dakota personnel. The measurements were by the water immersion
method. The weights in air and in water, along with the specific gravity calculations, were provided with the drilling database.
These were analyzed by rock type and oxide zone.
Table 11-12 summarizes the data for the samples where a rock type and oxide zone could be assigned. The data was trimmed for the analysis;
10 samples greater than 4.0 and 23 samples less than 1.2 were excluded. The average specific gravity was reduced by 2% (0.98 bulk factor)
to allow for voids at a larger scale than the available samples and also a general tendency to measure more competent samples. The tonnage
factors and ktons/block values on the table reflect this reduction.
Table 11-12: Specific Gravity Measurements
Lilh
Code | |
Lithology/Oxidation | |
No. of
Samples | |
Mean
(g/cm3) | |
Std Dev
(g/cm3) | |
Max
(g/cm3) | |
Min
(g/cm3) | |
Bulk
Factor | |
Ton Fact
ft3/ton | |
Ktons/
Block | |
| 20 | |
Tertiary Breccia | |
| |
| |
| |
| |
| |
| |
| |
| |
| | |
10 - Oxide | |
766 | |
2.453 | |
0.240 | |
3.293 | |
1.645 | |
0.980 | |
13.33 | |
0.600 | |
| | |
20 - Transition | |
266 | |
2.596 | |
0.242 | |
3.341 | |
1.900 | |
0.980 | |
12.60 | |
0.635 | |
| | |
30 - Sulfide | |
2,651 | |
2.694 | |
0.213 | |
3.981 | |
1.281 | |
0.980 | |
12.14 | |
0.659 | |
| 30 | |
Tertiary Sills | |
| |
| |
| |
| |
| |
| |
| |
| |
| | |
10 - Oxide | |
479 | |
2.540 | |
0.153 | |
3.750 | |
1.720 | |
0.980 | |
12.88 | |
0.621 | |
| | |
20, 30 - Trans/Sulfide | |
44 | |
2.474 | |
0.145 | |
2.832 | |
2.132 | |
0.980 | |
13.22 | |
0.605 | |
| 40 | |
Tertiary Dikes | |
| |
| |
| |
| |
| |
| |
| |
| |
| | |
10 - Oxide | |
281 | |
2.524 | |
0.221 | |
3.243 | |
1.356 | |
0.980 | |
12.96 | |
0.617 | |
| | |
20, 30 - Trans/Sulfide | |
1,166 | |
2.664 | |
0.240 | |
3.827 | |
1.218 | |
0.980 | |
12.28 | |
0.652 | |
| 45 | |
Undifferentiated Paleozoic | |
| |
| |
| |
| |
| |
| |
| |
| |
| | |
10 - Oxide | |
14 | |
2.370 | |
0.205 | |
2.891 | |
2.077 | |
0.980 | |
13.80 | |
0.580 | |
| 50 | |
Cambrian Deadwood | |
| |
| |
| |
| |
| |
| |
| |
| |
| | |
10 - Oxide | |
1,133 | |
2.485 | |
0.200 | |
3.670 | |
1.658 | |
0.980 | |
13.16 | |
0.608 | |
| | |
20 - Transition | |
82 | |
2.562 | |
0.237 | |
3.331 | |
1.927 | |
0.980 | |
12.77 | |
0.627 | |
| | |
30 - Sulfide | |
155 | |
2.584 | |
0.175 | |
3.022 | |
2.139 | |
0.980 | |
12.66 | |
0.632 | |
| 60 | |
Precambrian Greenstone | |
| |
| |
| |
| |
| |
| |
| |
| |
| | |
10 - Oxide | |
497 | |
2.574 | |
0.256 | |
3.256 | |
1.299 | |
0.980 | |
12.71 | |
0.630 | |
| | |
20 - Transition | |
384 | |
2.677 | |
0.231 | |
3.977 | |
1.591 | |
0.980 | |
12.22 | |
0.655 | |
| | |
30 - Sulfide | |
2,516 | |
2.760 | |
0.229 | |
3.876 | |
1.322 | |
0.980 | |
11.85 | |
0.675 | |
| 70 | |
Precambrian Flagrock | |
| |
| |
| |
| |
| |
| |
| |
| |
| | |
10 - Oxide | |
126 | |
2.643 | |
0.223 | |
3.970 | |
2.040 | |
0.980 | |
12.37 | |
0.646 | |
| | |
20 - Transition | |
355 | |
2.761 | |
0.220 | |
3.383 | |
1.587 | |
0.980 | |
11.85 | |
0.675 | |
| |
30 - Sulfide | |
1,714 | |
2.801 | |
0.212 | |
3.807 | |
1.223 | |
0.980 | |
11.68 | |
0.685 | |
| 80 | |
Precambrian Ellison | |
| |
| |
| |
| |
| |
| |
| |
| |
| | |
10 - Oxide | |
276 | |
2.687 | |
0.175 | |
3.517 | |
1.714 | |
0.980 | |
12.17 | |
0.657 | |
| | |
20 - Transition | |
196 | |
2.766 | |
0.124 | |
3.222 | |
2.017 | |
0.980 | |
11.82 | |
0.677 | |
| | |
30 - Sulfide | |
441 | |
2.753 | |
0.122 | |
3.896 | |
1.793 | |
0.980 | |
11.88 | |
0.673 | |
| | |
Total | |
13,542 | |
2.671 | |
0.242 | |
3.981 | |
1.218 | |
0.980 | |
12.24 | |
0.653 | |
| 14 | |
Leach Pad | |
| |
1.800 | |
| |
| |
| |
1.000 | |
17.81 | |
0.449 | |
| 15 | |
Waste Rock | |
| |
2.000 | |
| |
| |
| |
1.000 | |
16.03 | |
0.499 | |
Note 1. Data is trimmed.
Values < 1.2 (23 samples ) and values > 4.0 (10 samples) are excluded .
Note 2. Tonnage factor is 32.05218/sg.
Specific gravities of 1.8 and 2.0 were assigned for the existing leach
pad and waste rock area.
| | M3-PN240322
3 February 2025
Revision 0 |
150 |
Dakota
Gold
Technical
Report
| 11.6 | Reconciliation of January 2025 and October 2023 Mineral
Resources |
| 11.6.1 | Leach Mineral Resource |
Table 11-13 presents a reconciliation of the January 2025
mineral resource estimate with the October 2023 estimate for mineral resources amenable to leaching. This includes the oxide and
transition material. Item 1 on the table is the October 2023 mineral resource estimate for oxide and transition material as stated
by AKF. Items 2 through 11 are calculations done by IMC, using the AKF resource model, to show the impact of changes in the various parameters.
In most cases, a new resource shell was developed by IMC to measure the prospective change. Items 12 through 13 are based on the updated
resource model developed by IMC.
Item 1 is the October 2023 mineral resource
estimate. There were no measured mineral resources reported by AKF. The indicated mineral resource was 41.7 million tons at 0.0206 oz/t
gold for 859,000 contained gold ounces. Inferred mineral resource was 52.2 million tons at 0.0160 oz/t gold for 835,900 contained gold
ounces. Oxide and transition material are not reported separately on the table, but the gold cut-off grades for each are shown and were
0.0062 oz/t for oxide and 0.0085 oz/t for transition, due to differences in estimated gold recovery. IMC was able to validate these results
based on the AKF resource block model and the economic parameters used to develop the resource shell. Note that total tons in the various
resource shells are also presented on Table 11-13 to show changes for each case.
Item 3 on Table 11-13 shows the impact of replacing
the AKF oxide, transition, and sulfide domains with the updated interpretation. A new pit shell was developed based on the new domains
and same economic parameters used by AKF. This resulted in 64.0 million tons of indicated mineral resource at 0.0205 oz/t gold for 1.31
million contained gold ounces. Inferred mineral resource was 84.7 million tons at 0.0153 oz/t gold for 1.30 million ounces of contained
gold. Item 2 shows that using the new domains, indicated mineral resource would have increased by 22.3 million tons and 453,000 contained
ounces and inferred mineral resources would have increased by 32.5 million tons and 460,500 contained ounces. Much of this gain represents
sulfide material reclassified as oxide or transition material.
The October 2023 mineral resource was reported
at breakeven gold cut-off grades. The January 2025 mineral resource is reported at internal cut-off grades. Item 5 shows the impact
of reporting at internal cut-off grades, 0.0050 oz/t for oxide and 0.0085 oz/t for transition material. Item 4 shows for indicated
mineral resource this change in cut-off grades would have increased the AKF resource by 5.43 million tons and 35,000 contained gold ounces
and inferred mineral resources by 12.1 million tons and 69,100 contained ounces.
Item 7 on Table 11-13 shows the impact of updated
gold recoveries. The October 2023 mineral resource estimate was based on recoveries of 87% for oxide, 65% for transition, and 42%
for sulfide. This is based on grinding the mineral resource and leaching in tanks. The updated recoveries are 89% for oxide, 65% for transition
material, and 85% for sulfide. This is based on crushing and heap leaching for oxide and transition material and grinding followed by
flotation to produce a gold sulfide concentrate for the sulfides. The recoveries for the two estimates are similar for oxide and transition
material. A new pit shell was developed based on the new recoveries, but with the same cost parameters as the October 2023 estimate.
This would have resulted in 70.4 million tons of indicated mineral resource at 0.0192 oz/t gold for 1.35 million contained gold ounces.
Inferred mineral resource would have been 101.6 million tons at 0.0138 oz/t gold for 1.40 million ounces of contained gold. Item
6 shows that the indicated mineral resource would have increased by 999,000 tons and 5,300 contained ounces and the inferred mineral resources
would have increased by 4.76 million tons and 36,700 contained ounces.
Item 9 on Table 11-13 shows the impact of an increase
in gold price on the October 2023 mineral resource estimate. The October 2023 mineral resource estimate was based on a gold
price of $1900/oz. Increasing the gold price to $2000/oz, along with the cumulative changes in parameters discussed above, would have
resulted in 71.7 million tons of indicated mineral resource at 0.0190 oz/t gold for 1.36 million contained gold ounces for the AKF model
(calculated by IMC). Inferred mineral resource would have been 107.4 million tons at 0.0135 oz/t gold for 1.45 million ounces of contained
gold. Item 8 shows for indicated mineral resource this change would have increased the resource by 1.32 million tons and 11,000 contained
ounces, and for inferred mineral resources this change would have increased the resource by 5.76 million tons and 47,200 contained ounces.
The increased gold price resulted in a small decrease in the gold cut-off grades.
| | M3-PN240322
3 February 2025
Revision 0 |
151 |
Dakota
Gold
Technical
Report
Item 11 on Table 11-13 shows the impact of updated
unit costs on the October 2023 mineral resource estimate. The October 2023 estimate was based on a mining cost of $1.80/t versus
$2.15/t for the updated mineral resource estimate. The October 2023 unit costs for processing and G&A were $8.00/t for all material
types. For the updated estimate the unit costs for processing and G&A are $4.39/t for oxide leach, $5.15/t for transition leach, and
$7.83/t for sulfide milling. The updated estimate also includes some treatment and refining charges that were not broken out separately
for the October 2023 estimate. The lower process costs for heap leaching reduced the gold internal cut-off grades to 0.0026 oz/t
for oxide and 0.0041 oz/t for transition material. This change would have resulted in 83.7 million tons of indicated mineral resource
at 0.0169 oz/t gold for 1.41 million contained gold ounces. Inferred mineral resource would have been 145.6 million tons at 0.0112 oz/t
gold for 1.63 million ounces of contained gold. Item 10 shows that indicated mineral resource would have increased the October 2023
resource by 11.9 million tons and 51,100 contained ounces and increased inferred mineral resources by 38.3 million tons and 181,900 contained
ounces.
All the previous mineral resource tabulations
in this section are based on the model used for the October 2023 mineral resource estimate. Item 13 on the table shows the impact
of the updated January 2025 resource model and the economic parameters for the current mineral resource estimate. This item is based
on a resource shell developed with gold only; silver is reported but did not contribute to economics for the case. This resulted in 264.6
million tons of measured and indicated mineral resource at 0.0137 oz/t gold and 0.141 oz/t silver for 3.63 million contained gold ounces
and 37.4 million contained silver ounces. Inferred mineral resource was 244.4 million tons at 0.0104 oz/t gold and 0.089 oz/t silver for
2.54 million ounces of contained gold and 21.7 million ounces of contained silver. Item 12 shows the incremental tons and contained ounces
due to the updated model.
Item 15 is the final mineral resource estimate,
with silver contributing to the economics. Item 14 shows the impact of adding silver to the resource estimate is modest. However, it is
important to have estimates of the amount of silver that might be produced for process plant design.
The sensitivity analysis shows a large difference
between the October 2023 and January 2025 mineral resources, and that the difference is mostly due to the resource models. Additional
drilling and analysis have eliminated the need for the conservative assumptions in the October 2023 model regarding hard geologic
boundaries and the requirement for two holes for a block grade estimation. Based on this additional data and analysis, the QP has added
blocks to the resource model that were not evaluated in the October 2023 model. It is interesting to note that Item 11 on the table
is based on the October 2023 model and all the economic and recovery parameters used for the current mineral resource. Note that
the sum of indicated and inferred mineral resources for that item amounts to 229.3 million tons at 0.0133 oz/t gold for 3.05 million ounces
of contained gold. This result is reasonably consistent with the measured and indicated mineral resources in the updated mineral resource
estimate. The October 2023 resource model can be interpreted as a model of measured and indicated mineral resources (though not reported
that way) with limited inferred mineral resources included.
Table 11-14 shows the reconciliation for mineral
resources amenable to milling that is comprised of sulfide material. This is parallel to the analysis for mineral resources amenable to
leaching; the impact of all the same parameters is measured in the analysis.
Item 1 on the table is the October 2023 mineral
resource estimate. There were no measured mineral resources reported. The indicated mineral resource was 15.4 million tons at 0.0304 oz/t
gold for 469,200 contained gold ounces. Inferred mineral resource was 11.8 million tons at 0.0252 oz/t gold for 296,300 contained gold
ounces. The gold cut-off grade for the mineral resource amenable to milling was 0.0128 oz/t. IMC was able to validate these results based
on the AKF resource block model and the economic parameters used to develop the resource shell.
| | M3-PN240322
3 February 2025
Revision 0 |
152 |
Dakota
Gold
Technical
Report
Item 3 on the table shows the impact of replacing
the AKF oxide, transition, and sulfide domains with the updated domain interpretation. A new pit shell was developed by IMC based on the
new domains and same economic parameters used by AKF. This resulted in 6.54 million tons of indicated mineral resource at 0.0256 oz/t
gold for 167,300 contained gold ounces. Inferred mineral resources were 4.30 million tons at 0.0232 oz/t gold for 99,700 ounces of contained
gold. Item 2 shows for indicated mineral resource this is a decrease of 8.90 million tons and 301,900 contained ounces and for inferred
mineral resources this is a decrease of 7.46 million tons and 196,600 contained ounces. Much of this decrease represents sulfide material
reclassified as oxide or transition material.
The October 2023 mineral resource was reported
at breakeven gold cut-off grades. The January 2025 mineral resource is reported at internal cut-off grades. Item 5 shows the impact
of reporting at internal cut-off grade of 0.0104 oz/t. Item 4 shows for indicated mineral resource this is an increase of 850,000 tons
and 9,900 contained gold ounces and for inferred mineral resources this is an increase of 561,000 tons and 6,200 contained ounces.
Item 7 on the table shows the impact of updated
gold recoveries. The October 2023 mineral resource estimate was based on a recovery of 42% for sulfide material, based on grinding
the mineral resource and leaching in tanks. The updated recovery for sulfide is 85% based grinding followed by flotation to produce a
gold sulfide concentrate. This reduced the internal cut-off grade mill material to 0.0051 oz/t. A new pit shell was developed based on
the new recoveries, but with the same cost parameters as the October 2023 estimate. This resulted in 13.1 million tons of indicated
mineral resource at 0.0185 oz/t gold for 242,200 contained gold ounces. Inferred mineral resources were 14.9 million tons at 0.0164 oz/t
gold for 243,600 ounces of contained gold. Item 6 shows for indicated mineral resource this is an increase of 5.71 million tons and 65,000
contained ounces and for inferred mineral resources this is an increase of 10.0 million tons and 137,600 contained ounces.
Item 9 on the table shows the impact of an increase
in gold price on the mineral resource estimate. The October 2023 mineral resource estimate was based on a gold price of $1900/oz.
Increasing the gold price to $2000/oz, along with the cumulative changes discussed above, results in 13.3 million tons of indicated mineral
resources at 0.0183 oz/t gold for 243,800 contained gold ounces. Inferred mineral resource is 15.4 million tons at 0.0162 oz/t gold for
248,900 ounces of contained gold. Item 8 shows for indicated mineral resource this change would have resulted in an increase of 229,000
tons and 1,600 contained ounces and for inferred mineral resources this change would have resulted in an increase of 514,000 tons and
5,400 contained ounces. The increased gold price resulted in a small decrease in the gold cut-off grade to 0.0049 oz/t.
Item 11 on the table shows the impact of updated
unit costs on the mineral resource estimate. The October 2023 unit costs for processing and G&A were $8.00/t for sulfide material.
For the updated estimate the unit costs for processing and G&A are $7.83/t for sulfide milling. The updated estimate also includes
treatment and refining charges of $6.00/oz and a payable amount of 95.5% that was not broken out separately for the October 2023
estimate. This resulted in 13.2 million tons of indicated mineral resource at 0.0185 oz/t gold for 243,400 contained gold ounces. Inferred
mineral resource was 14.7 million tons at 0.0162 oz/t gold for 238,900 ounces of contained gold. Item 10 shows a slight decrease for indicated
and inferred mineral resources due to the treatment charges.
All the previous mineral resource tabulations
in this section are based on the model used for the October 2023 mineral resource estimate. Item 13 on the table shows the impact
of the updated January 2025 resource model and the economic parameters for the current mineral resource estimate. This item is based
on a resource shell developed with gold only; silver is reported but did not contribute to economics for the case. This resulted in 63.9
million tons of measured and indicated mineral resources at 0.0147 oz/t gold and 0.140 oz/t silver for 941,500 contained gold ounces and
8.92 million contained silver ounces. Inferred mineral resource was 161.1 million tons at 0.0130 oz/t gold and 0.143 oz/t silver for 2.09
million ounces of contained gold and 23.0 million ounces of contained silver. Item 12 shows the incremental tons and contained ounces
due to the updated model.
| | M3-PN240322
3 February 2025
Revision 0 |
153 |
Dakota
Gold
Technical
Report
Item 15 is the final mineral resource estimate,
with silver contributing to the economics. Item 14 shows the impact of adding silver to the resource estimate is modest for measured and
indicated mineral resources but resulted in a significant increase in inferred mineral resources.
As with leach material, the sensitivity analysis
shows a large difference between the October 2023 and January 2025 mineral resources, and that the difference is mostly due
to the resource models.
Table 11-13: Reconciliation of January 2025
and October 2023 Mineral Resources – Leach Resource
| Price/Resource Category | |
Cut-off (oz/t) | |
Ktons | |
AuEq (oz/t) | |
Gold (oz/t) | |
Silver (oz/t) | |
Gold (koz) | |
Silver (koz) | |
Total Ktons | |
| 1. AFK October 2023 Oxide/Mixed Mineral Resource | |
| |
| |
| |
| |
| |
| |
| |
| |
| Measured Mineral Resource | |
Oxide | |
0 | |
0.0000 | |
0.0000 | |
0.000 | |
0.0 | |
0 | |
| |
| Indicated Mineral Resource | |
0.0062 | |
41,699 | |
0.0000 | |
0.0206 | |
0.000 | |
859.0 | |
0 | |
| |
| Meas/Indic Mineral Resource | |
Transition | |
41,699 | |
0.0000 | |
0.0206 | |
0.000 | |
859.0 | |
0 | |
295,000 | |
| Inferred Mineral Resource | |
0.0085 | |
52,243 | |
0.0000 | |
0.0160 | |
0.000 | |
835.9 | |
0 | |
| |
| 2. Due to Updated Oxide/Transition/Sulfide Domains | |
| |
| |
| |
| |
| |
| |
| |
| |
| Measured Mineral Resource | |
Oxide | |
0 | |
0.0000 | |
0.0000 | |
0.000 | |
0.0 | |
0 | |
| |
| Indicated Mineral Resource | |
0.0062 | |
22,301 | |
0.0000 | |
0.0203 | |
0.000 | |
453.0 | |
0 | |
| |
| Meas/Indic Mineral Resource | |
Transition | |
22,301 | |
0.0000 | |
0.0203 | |
0.000 | |
453.0 | |
0 | |
53,067 | |
| Inferred Mineral Resource | |
0.0085 | |
32,485 | |
0.0000 | |
0.0142 | |
0.000 | |
460.5 | |
0 | |
| |
| 3. Updated Oxide/Transition/Sulfide Domains | |
| |
| |
| |
| |
| |
| |
| |
| |
| Measured Mineral Resource | |
Oxide | |
0 | |
0.0000 | |
0.0000 | |
0.000 | |
0.0 | |
0 | |
| |
| Indicated Mineral Resource | |
0.0062 | |
64,000 | |
0.0000 | |
0.0205 | |
0.000 | |
1,312.0 | |
0 | |
| |
| Meas/Indic Mineral Resource | |
Transition | |
64,000 | |
0.0000 | |
0.0205 | |
0.000 | |
1,312.0 | |
0 | |
348,067 | |
| Inferred Mineral Resource | |
0.0085 | |
84,728 | |
0.0000 | |
0.0153 | |
0.000 | |
1,296.3 | |
0 | |
| |
| 4. Due to Internal versus Breakeven Cut-off Grade | |
| |
| |
| |
| |
| |
| |
| |
| |
| Measured Mineral Resource | |
Oxide | |
0 | |
0.0000 | |
0.0000 | |
0.000 | |
0.0 | |
0 | |
| |
| Indicated Mineral Resource | |
0.0050 | |
5,431 | |
0.0000 | |
0.0064 | |
0.000 | |
35.0 | |
0 | |
| |
| Meas/Indic Mineral Resource | |
Transition | |
5,431 | |
0.0000 | |
0.0064 | |
0.000 | |
35.0 | |
0 | |
0 | |
| Inferred Mineral Resource | |
0.0067 | |
12,110 | |
0.0000 | |
0.0057 | |
0.000 | |
69.1 | |
0 | |
| |
| 5. Updated Domains, Internal Cut-off Grades | |
| |
| |
| |
| |
| |
| |
| |
| |
| Measured Mineral Resource | |
Oxide | |
0 | |
0.0000 | |
0.0000 | |
0.000 | |
0.0 | |
0 | |
| |
| Indicated Mineral Resource | |
0.0050 | |
69,431 | |
0.0000 | |
0.0194 | |
0.000 | |
1,347.0 | |
0 | |
| |
| Meas/Indic Mineral Resource | |
Transition | |
69,431 | |
0.0000 | |
0.0194 | |
0.000 | |
1,347.0 | |
0 | |
348,067 | |
| Inferred Mineral Resource | |
0.0067 | |
96,838 | |
0.0000 | |
0.0141 | |
0.000 | |
1,365.4 | |
0 | |
| |
| 6. Due to Updated Recoveries | |
| |
| |
| |
| |
| |
| |
| |
| |
| Measured Mineral Resource | |
Oxide | |
0 | |
0.0000 | |
0.0000 | |
0.000 | |
0.0 | |
0 | |
| |
| Indicated Mineral Resource | |
0.0049 | |
999 | |
0.0000 | |
0.0053 | |
0.000 | |
5.3 | |
0 | |
| |
| Meas/Indic Mineral Resource | |
Transition | |
999 | |
0.0000 | |
0.0053 | |
0.000 | |
5.3 | |
0 | |
65,122 | |
| Inferred Mineral Resource | |
0.0067 | |
4,762 | |
0.0000 | |
0.0077 | |
0.000 | |
36.7 | |
0 | |
| |
| | M3-PN240322
3 February 2025
Revision 0 |
154 |
Dakota
Gold
Technical
Report
| Price/Resource Category | |
Cut-off (oz/t) | |
Ktons | |
AuEq (oz/t) | |
Gold (oz/t) | |
Silver (oz/t) | |
Gold (koz) | |
Silver (koz) | |
Total Ktons | |
| 7. Updated Process Recoveries | |
| |
| |
| |
| |
| |
| |
| |
| |
| Measured Mineral Resource | |
Oxide | |
0 | |
0.0000 | |
0.0000 | |
0.000 | |
0.0 | |
0 | |
| |
| Indicated Mineral Resource | |
0.0049 | |
70,430 | |
0.0000 | |
0.0192 | |
0.000 | |
1,352.3 | |
0 | |
| |
| Meas/Indic Mineral Resource | |
Transition | |
70,430 | |
0.0000 | |
0.0192 | |
0.000 | |
1,352.3 | |
0 | |
413,189 | |
| Inferred Mineral Resource | |
0.0067 | |
101,600 | |
0.0000 | |
0.0138 | |
0.000 | |
1,402.1 | |
0 | |
| |
| 8. Due to $2,000/oz Price | |
| |
| |
| |
| |
| |
| |
| |
| |
| Measured Mineral Resource | |
Oxide | |
0 | |
0.0000 | |
0.0000 | |
0.000 | |
0.0 | |
0 | |
| |
| Indicated Mineral Resource | |
0.0047 | |
1,319 | |
0.0000 | |
0.0083 | |
0.000 | |
11.0 | |
0 | |
| |
| Meas/Indic Mineral Resource | |
Transition | |
1,319 | |
0.0000 | |
0.0083 | |
0.000 | |
11.0 | |
0 | |
16,743 | |
| Inferred Mineral Resource | |
0.0064 | |
5,757 | |
0.0000 | |
0.0082 | |
0.000 | |
47.2 | |
0 | |
| |
| 9. $2,000/oz Gold - DGC Resource Price | |
| |
| |
| |
| |
| |
| |
| |
| |
| Measured Mineral Resource | |
Oxide | |
0 | |
0.0000 | |
0.0000 | |
0.000 | |
0.0 | |
0 | |
| |
| Indicated Mineral Resource | |
0.0047 | |
71,749 | |
0.0000 | |
0.0190 | |
0.000 | |
1,363.2 | |
0 | |
| |
| Meas/Indic Mineral Resource | |
Transition | |
71,749 | |
0.0000 | |
0.0190 | |
0.000 | |
1,363.2 | |
0 | |
429,932 | |
| Inferred Mineral Resource | |
0.0064 | |
107,357 | |
0.0000 | |
0.0135 | |
0.000 | |
1,449.3 | |
0 | |
| |
| 10. Due to Dakota Gold Costs | |
| |
| |
| |
| |
| |
| |
| |
| |
| Measured Mineral Resource | |
Oxide | |
0 | |
0.0000 | |
0.0000 | |
0.000 | |
0.0 | |
0 | |
| |
| Indicated Mineral Resource | |
0.0026 | |
11,940 | |
0.0000 | |
0.0043 | |
0.000 | |
51.1 | |
0 | |
| |
| Meas/Indic Mineral Resource | |
Transition | |
11,940 | |
0.0000 | |
0.0043 | |
0.000 | |
51.1 | |
0 | |
30,095 | |
| Inferred Mineral Resource | |
0.0041 | |
38,285 | |
0.0000 | |
0.0048 | |
0.000 | |
181.9 | |
0 | |
| |
| 11. Dakota Gold Costs | |
| |
| |
| |
| |
| |
| |
| |
| |
| Measured Mineral Resource | |
Oxide | |
0 | |
0.0000 | |
0.0000 | |
0.000 | |
0.0 | |
0 | |
| |
| Indicated Mineral Resource | |
0.0026 | |
83,689 | |
0.0000 | |
0.0169 | |
0.000 | |
1,414.3 | |
0 | |
| |
| Meas/Indic Mineral Resource | |
Transition | |
83,689 | |
0.0000 | |
0.0169 | |
0.000 | |
1,414.3 | |
0 | |
460,027 | |
| Inferred Mineral Resource | |
0.0041 | |
145,642 | |
0.0000 | |
0.0112 | |
0.000 | |
1,631.2 | |
0 | |
| |
12. Due to Updated Resource Model (Only Gold Used to Determine Resource Shell) | |
| |
| |
| |
| |
| |
| |
| |
| |
| Measured Mineral Resource | |
Oxide | |
112,566 | |
0.0000 | |
0.0159 | |
N.A. | |
1,789.8 | |
18,123 | |
| |
| Indicated Mineral Resource | |
0.0026 | |
68,376 | |
0.0000 | |
0.0062 | |
N.A. | |
425.6 | |
19,312 | |
| |
| Meas/Indic Mineral Resource | |
Transition | |
180,942 | |
0.0000 | |
0.0122 | |
N.A. | |
2,215.4 | |
37,435 | |
739,636 | |
| Inferred Mineral Resource | |
0.0041 | |
98,720 | |
0.0000 | |
0.0092 | |
N.A. | |
910.2 | |
21,748 | |
| |
13. January 2025 Resource Model (Only Gold Used to Determine Resource Shell) | |
| |
| |
| |
| |
| |
| |
| |
| |
| Measured Mineral Resource | |
Oxide | |
112,566 | |
0.0000 | |
0.0159 | |
0.161 | |
1,789.8 | |
18,123 | |
| |
| Indicated Mineral Resource | |
0.0026 | |
152,065 | |
0.0000 | |
0.0121 | |
0.127 | |
1,840.0 | |
19,312 | |
| |
| Meas/Indic Mineral Resource | |
Transition | |
264,631 | |
0.0000 | |
0.0137 | |
0.141 | |
3,629.8 | |
37,435 | |
1,199,663 | |
| Inferred Mineral Resource | |
0.0041 | |
244,362 | |
0.0000 | |
0.0104 | |
0.089 | |
2,541.4 | |
21,748 | |
| |
| 14. Due to Silver | |
| |
| |
| |
| |
| |
| |
| |
| |
| Measured Mineral Resource | |
Oxide | |
1,182 | |
0.0000 | |
0.0030 | |
0.072 | |
3.6 | |
85 | |
| |
| Indicated Mineral Resource | |
0.0026 | |
3,954 | |
0.0000 | |
0.0051 | |
0.145 | |
20.0 | |
572 | |
| |
| Meas/Indic Mineral Resource | |
Transition | |
5,136 | |
0.0000 | |
0.0046 | |
0.128 | |
23.6 | |
657 | |
167,362 | |
| Inferred Mineral Resource | |
0.0041 | |
9,824 | |
0.0000 | |
0.0073 | |
0.106 | |
72.0 | |
1,039 | |
| |
| 15. Final January 2025 Mineral Resource | |
| |
| |
| |
| |
| |
| |
| |
| |
| Measured Mineral Resource | |
Oxide | |
113,748 | |
0.0164 | |
0.0158 | |
0.160 | |
1,793.4 | |
18,208 | |
| |
| Indicated Mineral Resource | |
0.0026 | |
156,019 | |
0.0125 | |
0.0119 | |
0.128 | |
1,860.0 | |
19,884 | |
| |
| Meas/Indic Mineral Resource | |
Transition | |
269,768 | |
0.0141 | |
0.0135 | |
0.141 | |
3,653.3 | |
38,092 | |
1,367,025 | |
| Inferred Mineral Resource | |
0.0041 | |
254,186 | |
0.0106 | |
0.0103 | |
0.090 | |
2,613.4 | |
22,787 | |
| |
Note 1: Oxide and Transition Material is Combined on this Table, But Applicable Cut-off Grades for Each are Shown.
Note 2: Cases 1 - 13 Are Based on Gold Cut-off Grades, Case 15 is Gold Equivalent. |
| | M3-PN240322
3 February 2025
Revision 0 |
155 |
Dakota
Gold
Technical
Report
Table 11-14: Reconciliation of January 2025
and October 2023 Mineral Resources – Mill Resource
| Price/Resource Category | |
Cut-off (oz/t) | |
Ktons | |
AuEq (oz/t) | |
Gold (oz/t) | |
Silver (oz/t) | |
Gold (koz) | |
Silver (koz) | |
Total Ktons | |
| 1. AFK October 2023 Oxide/Mixed Mineral Resource | |
| |
| |
| |
| |
| |
| |
| |
| |
| Measured Mineral Resource | |
| |
0 | |
0.0000 | |
0.000 | |
0.0 | |
0 | |
| |
| |
| Indicated Mineral Resource | |
| |
15,434 | |
0.0304 | |
0.000 | |
469.2 | |
0 | |
| |
| |
| Meas/Indic Mineral Resource | |
0.0128 | |
15,434 | |
0.0304 | |
0.000 | |
469.2 | |
0 | |
295,000 | |
0.0128 | |
| Inferred Mineral Resource | |
| |
11,759 | |
0.0252 | |
0.000 | |
296.3 | |
0 | |
| |
| |
| 2. Due to Updated
Oxide/Transition/Sulfide Domains | |
| |
| |
| |
| |
| |
| |
| |
| |
| Measured Mineral Resource | |
| |
0 | |
0.0000 | |
0.000 | |
0.0 | |
0 | |
| |
| |
| Indicated Mineral Resource | |
| |
-8,899 | |
0.0339 | |
0.000 | |
-301.9 | |
0 | |
| |
| |
| Meas/Indic Mineral Resource | |
0.0128 | |
-8,899 | |
0.0339 | |
0.000 | |
-301.9 | |
0 | |
53,067 | |
0.0128 | |
| Inferred Mineral Resource | |
| |
-7,460 | |
0.0264 | |
0.000 | |
-196.6 | |
0 | |
| |
| |
| 3. Updated Oxide/Transition/Sulfide Domains | |
| |
| |
| |
| |
| |
| |
| |
| |
| Measured Mineral Resource | |
| |
0 | |
0.0000 | |
0.000 | |
0.0 | |
0 | |
| |
| |
| Indicated Mineral Resource | |
| |
6,535 | |
0.0256 | |
0.000 | |
167.3 | |
0 | |
| |
| |
| Meas/Indic Mineral Resource | |
0.0128 | |
6,535 | |
0.0256 | |
0.000 | |
167.3 | |
0 | |
348,067 | |
0.0128 | |
| Inferred Mineral Resource | |
| |
4,299 | |
0.0232 | |
0.000 | |
99.7 | |
0 | |
| |
| |
| 4. Due to Internal versus Breakeven Cut-off Grade | |
| |
| |
| |
| |
| |
| |
| |
| |
| Measured Mineral Resource | |
| |
0 | |
0.0000 | |
0.000 | |
0.0 | |
0 | |
| |
| |
| Indicated Mineral Resource | |
| |
850 | |
0.0117 | |
0.000 | |
9.9 | |
0 | |
| |
| |
| Meas/Indic Mineral Resource | |
0.0104 | |
850 | |
0.0117 | |
0.000 | |
9.9 | |
0 | |
0 | |
0.0104 | |
| Inferred Mineral Resource | |
| |
561 | |
0.0111 | |
0.000 | |
6.2 | |
0 | |
| |
| |
| 5. Updated Domains, Internal Cut-off Grades | |
| |
| |
| |
| |
| |
| |
| |
| |
| Measured Mineral Resource | |
| |
0 | |
0.0000 | |
0.000 | |
0.0 | |
0 | |
| |
| |
| Indicated Mineral Resource | |
| |
7,385 | |
0.0240 | |
0.000 | |
177.2 | |
0 | |
| |
| |
| Meas/Indic Mineral Resource | |
0.0104 | |
7,385 | |
0.0240 | |
0.000 | |
177.2 | |
0 | |
348,067 | |
0.0104 | |
| Inferred Mineral Resource | |
| |
4,860 | |
0.0218 | |
0.000 | |
105.9 | |
0 | |
| |
| |
| | M3-PN240322
3 February 2025
Revision 0 |
156 |
Dakota
Gold
Technical
Report
| Price/Resource Category | |
Cut-off (oz/t) | |
Ktons | |
AuEq (oz/t) | |
Gold (oz/t) | |
Silver (oz/t) | |
Gold (koz) | |
Silver (koz) | |
Total Ktons | |
| 6. Due to Updated Recoveries | |
| |
| |
| |
| |
| |
| |
| |
| |
| Measured Mineral Resource | |
| |
0 | |
0.0000 | |
0.000 | |
0.0 | |
0 | |
| |
| |
| Indicated Mineral Resource | |
| |
5,707 | |
0.0114 | |
0.000 | |
65.0 | |
0 | |
| |
| |
| Meas/Indic Mineral Resource | |
0.0051 | |
5,707 | |
0.0114 | |
0.000 | |
65.0 | |
0 | |
65,122 | |
0.0051 | |
| Inferred Mineral Resource | |
| |
9,991 | |
0.0138 | |
0.000 | |
137.6 | |
0 | |
| |
| |
| 7. Updated Process Recoveries | |
| |
| |
| |
| |
| |
| |
| |
| |
| Measured Mineral Resource | |
| |
0 | |
0.0000 | |
0.000 | |
0.0 | |
0 | |
| |
| |
| Indicated Mineral Resource | |
| |
13,092 | |
0.0185 | |
0.000 | |
242.2 | |
0 | |
| |
| |
| Meas/Indic Mineral Resource | |
0.0051 | |
13,092 | |
0.0185 | |
0.000 | |
242.2 | |
0 | |
413,189 | |
0.0051 | |
| Inferred Mineral Resource | |
| |
14,851 | |
0.0164 | |
0.000 | |
243.6 | |
0 | |
| |
| |
| 8. Due to $2,000/oz Price | |
| |
| |
| |
| |
| |
| |
| |
| |
| Measured Mineral Resource | |
| |
0 | |
0.0000 | |
0.000 | |
0.0 | |
0 | |
| |
| |
| Indicated Mineral Resource | |
| |
229 | |
0.0069 | |
0.000 | |
1.6 | |
0 | |
| |
| |
| Meas/Indic Mineral Resource | |
0.0049 | |
229 | |
0.0069 | |
0.000 | |
1.6 | |
0 | |
16,743 | |
0.0049 | |
| Inferred Mineral Resource | |
| |
514 | |
0.0104 | |
0.000 | |
5.4 | |
0 | |
| |
| |
| 9. $2,000/oz Gold - DGC Resource Price | |
| |
| |
| |
| |
| |
| |
| |
| |
| Measured Mineral Resource | |
| |
0 | |
0.0000 | |
0.000 | |
0.0 | |
0 | |
| |
| |
| Indicated Mineral Resource | |
| |
13,321 | |
0.0183 | |
0.000 | |
243.8 | |
0 | |
| |
| |
| Meas/Indic Mineral Resource | |
0.0049 | |
13,321 | |
0.0183 | |
0.000 | |
243.8 | |
0 | |
429,932 | |
0.0049 | |
| Inferred Mineral Resource | |
| |
15,365 | |
0.0162 | |
0.000 | |
248.9 | |
0 | |
| |
| |
| 10. Due to Dakota Gold Costs | |
| |
| |
| |
| |
| |
| |
| |
| |
| Measured Mineral Resource | |
| |
0 | |
0.0000 | |
0.000 | |
0.0 | |
0 | |
| |
| |
| Indicated Mineral Resource | |
| |
-165 | |
0.0024 | |
0.000 | |
-0.4 | |
0 | |
| |
| |
| Meas/Indic Mineral Resource | |
0.0050 | |
-165 | |
0.0024 | |
0.000 | |
-0.4 | |
0 | |
30,095 | |
0.0050 | |
| Inferred Mineral Resource | |
| |
-620 | |
0.0162 | |
0.000 | |
-10.0 | |
0 | |
| |
| |
| 11. Dakota Gold Costs | |
| |
| |
| |
| |
| |
| |
| |
| |
| Measured Mineral Resource | |
| |
0 | |
0.0000 | |
0.000 | |
0.0 | |
0 | |
| |
| |
| Indicated Mineral Resource | |
| |
13,156 | |
0.0185 | |
0.000 | |
243.4 | |
0 | |
| |
| |
| Meas/Indic Mineral Resource | |
0.0050 | |
13,156 | |
0.0185 | |
0.000 | |
243.4 | |
0 | |
460,027 | |
0.0050 | |
| Inferred Mineral Resource | |
| |
14,745 | |
0.0162 | |
0.000 | |
238.9 | |
0 | |
| |
| |
12. Due to Updated Resource Model (Only Gold Used to Determine Resource Shell) | |
| |
| |
| |
| |
| |
| |
| |
| |
| Measured Mineral Resource | |
| |
19,884 | |
0.0170 | |
N.A. | |
338.0 | |
3,062 | |
| |
| |
| Indicated Mineral Resource | |
| |
30,895 | |
0.0117 | |
N.A. | |
360.1 | |
5,859 | |
| |
| |
| Meas/Indic Mineral Resource | |
0.0050 | |
50,779 | |
0.0137 | |
N.A. | |
698.1 | |
8,921 | |
739,636 | |
0.0050 | |
| Inferred Mineral Resource | |
| |
146,331 | |
0.0127 | |
N.A. | |
1,855.1 | |
23,034 | |
| |
| |
13. January 2025 Resource Model (Only Gold Used to Determine Resource Shell) | |
| |
| |
| |
| |
| |
| |
| |
| |
| Measured Mineral Resource | |
| |
19,884 | |
0.0170 | |
0.154 | |
338.0 | |
3,062 | |
| |
| |
| Indicated Mineral Resource | |
| |
44,051 | |
0.0137 | |
0.133 | |
603.5 | |
5,859 | |
| |
| |
| Meas/Indic Mineral Resource | |
0.0050 | |
63,935 | |
0.0147 | |
0.140 | |
941.5 | |
8,921 | |
1,199,663 | |
0.0050 | |
| Inferred Mineral Resource | |
| |
161,076 | |
0.0130 | |
0.143 | |
2,094.0 | |
23,034 | |
| |
| |
| 14. Due to Silver | |
| |
| |
| |
| |
| |
| |
| |
| |
| Measured Mineral Resource | |
| |
819 | |
0.0044 | |
0.078 | |
3.6 | |
64 | |
| |
| |
| Indicated Mineral Resource | |
| |
4,842 | |
0.0076 | |
0.143 | |
37.0 | |
693 | |
| |
| |
| Meas/Indic Mineral Resource | |
0.0050 | |
5,661 | |
0.0072 | |
0.134 | |
40.6 | |
757 | |
167,362 | |
0.0050 | |
| Inferred Mineral Resource | |
| |
41,145 | |
0.0086 | |
0.153 | |
352.9 | |
6,288 | |
| |
| |
| 15. Final January 2025 Mineral Resource | |
| |
| |
| |
| |
| |
| |
| |
| |
| Measured Mineral Resource | |
| |
20,703 | |
0.0165 | |
0.151 | |
341.6 | |
3,126 | |
| |
| |
| Indicated Mineral Resource | |
| |
48,893 | |
0.0131 | |
0.134 | |
640.5 | |
6,552 | |
| |
| |
| Meas/Indic Mineral Resource | |
0.0050 | |
69,596 | |
0.0141 | |
0.139 | |
982.1 | |
9,678 | |
1,367,025 | |
0.0050 | |
| Inferred Mineral Resource | |
| |
202,221 | |
0.0121 | |
0.145 | |
2,446.9 | |
29,322 | |
| |
| |
| Note 1: Cases 1 - 13 Are Based on Gold Cut-off Grades, Case 15 is Gold Equivalent. |
| | M3-PN240322
3 February 2025
Revision 0 |
157 |
Dakota
Gold
Technical
Report
| 11.6.3 | Reconciliation Summary |
Table 11-15summarizes the reconciliation results
from the January 2025 and October 2023 resource models in terms of contained gold ounces. The items on the table show incremental
changes due to various changes in modeling parameters as discussed above.
Table 11-15: Summary of Reconciliation Analysis
for Contained Gold Ounces
| | |
Oxide/Transition (Leach) | |
Sulfide (Mill) | |
All Mineral Resource | |
| Parameter | |
Meas/Indic Au (koz) | |
Inferred Au (koz) | |
Meas/Indic Au (koz) | |
Inferred Au (koz) | |
Meas/Indic Au (koz) | |
Inferred Au (koz) | |
| Start - October 2023 Mineral Resource | |
859 | |
836 | |
469 | |
296 | |
1,328 | |
1,132 | |
| Due to Updated Oxide/Transition/Sulfide Domains | |
453 | |
461 | |
(302 | ) |
(197 | ) |
151 | |
264 | |
| Due to Internal versus Breakeven Cut-off Grade | |
35 | |
69 | |
10 | |
6 | |
45 | |
75 | |
| Due to Updated Recoveries | |
5 | |
37 | |
65 | |
138 | |
70 | |
175 | |
| Due to $2,000/oz Price | |
11 | |
47 | |
1.6 | |
5 | |
13 | |
53 | |
| Due to Dakota Gold Costs | |
51 | |
182 | |
(0.4 | ) |
(10 | ) |
51 | |
172 | |
| Due to Updated Resource Model (Note 1) | |
2,215 | |
910 | |
698 | |
1,855 | |
2,914 | |
2,765 | |
| Due to Silver (Note 2) | |
24 | |
72 | |
41 | |
353 | |
64 | |
425 | |
| Cumulative Change for All Parameters | |
2,794 | |
1,778 | |
513 | |
2,151 | |
3,307 | |
3,929 | |
| Final - January 2025 Mineral Resource | |
3,653 | |
2,614 | |
982 | |
2,447 | |
4,636 | |
5,061 | |
Note 1. Only gold used to develop resource shell.
Note 2. Silver economics allowed to contribute to resource shell | |
| | M3-PN240322
3 February 2025
Revision 0 |
158 |
Dakota
Gold
Technical
Report
| 12 | Mineral Reserve Estimates |
This chapter is not required for this Initial
Assessment, but will be addressed in a future Initial Assessment with Cash Flow Analysis.
| | M3-PN240322
3 February 2025
Revision 0 |
159 |
Dakota
Gold
Technical
Report
This chapter is not required for this Initial
Assessment, but will be addressed in a future Initial Assessment with Cash Flow Analysis
| | M3-PN240322
3 February 2025
Revision 0 |
160 |
Dakota Gold
Technical
Report
| 14 | Process and Recovery Methods |
This chapter is not required for this Initial
Assessment, but will be addressed in a future Initial Assessment with Cash Flow Analysis.
| | M3-PN240322
3 February 2025
Revision 0 |
161 |
Dakota
Gold
Technical
Report
This chapter is not required for this Initial
Assessment, but will be addressed in a future Initial Assessment with Cash Flow Analysis.
| | M3-PN240322
3 February 2025
Revision 0 |
162 |
Dakota
Gold
Technical
Report
This chapter is not required for this Initial
Assessment, but will be addressed in a future Initial Assessment with Cash Flow Analysis.
| | M3-PN240322
3 February 2025
Revision 0 |
163 |
Dakota
Gold
Technical
Report
| 17 | Environmental Studies, Permitting and Plans, Negotiations,
or Agreements with Local Individuals or Groups |
Please note that the information in this chapter
will generally change once a new Dakota Gold mine plan is in place.
| 17.1 | Results of Environmental Studies |
In the 1980s and 1990s, considerable environmental
baseline information was collected to support historical mine permitting and to support reclamation and closure activities. This information,
along with new and additional or updated data, will be required to support future mine development and permitting efforts.
Dakota Gold collects select environmental baseline
information required to support planned exploration permitting and assist with reclamation of disturbed sites. Key environmental baseline
disciplines required to support exploration drilling permitting include: vegetation, wildlife, cultural, archaeology, and historical.
Dakota Gold will also be negotiating additional baseline requirements with SDDANR as part of its permitting process for a new mine at
Richmond Hill.
| 17.2 | Requirements and Plans for Waste and Tailings Disposal, Site
Monitoring, and Water Management During Operations and After Mine Closures |
Since the Richmond Hill Gold Mine is closed, requirements
and plans during operations are not currently applicable.
As part of LAC’s closure program at Richmond
Hill Mine, all material classified as acid generating was removed from the Spruce Gulch waste dump and placed in truck compacted lifts
back into the historical Richmond Hill mining area. Following placement of that material, the material was capped with clay to minimize
oxygen and water infiltration into the compacted potentially acid-generating material. LAC also used this method to remediate the ore
material on the heap leach pads, isolating the pads with a similar clay cap.
All solid waste that may be generated at the site
will be transported off site and disposed of at permitted facilities in accordance with all local, state, and federal regulations. This
includes trash, debris, and building-demolition waste and rubble.
Monitoring activities at the current Richmond
Hill site include monthly site inspections of the reclaimed acreage, as well as the water treatment operations and support facilities.
Annual visual inspections of the leach pad and backfilled historical Richmond Hill mining area impoundment covers are carried out to monitor
for stability, erosion control, and prevention of deep-rooting vegetation through the clay caps. Visual inspections also include observations
of potential surface cracking, subsidence, stressed vegetation, and erosion rills or slumping of the impoundment covers.
Fencing and signage along the remaining highwalls
and along mine access roads are routinely monitored and maintained, as needed, to restrict access and provide public safety. LAC (now
merged into Homestake) annually completes an annual noxious weed treatment program at the site. Stormwater management structures are monitored
and repaired as needed to prevent extensive erosion and sediment loading into surrounding drainages. LAC maintains a Stormwater Pollution
Prevention Plan (SWPPP) as part of the surface-water discharge (SWD) permit for the site. The SWPPP ensures roads are graded and sediment-control
structures are maintained at the site. Buildings are maintained as needed, and public access to them is restricted to LAC employees, their
contractors, and upon request, to SDDANR. Site maintenance would be the responsibility of Dakota Gold once the Option is exercised.
Any potentially impacted groundwater from the
former process area, pit impoundment, or Spruce Gulch waste dump facility is actively managed by two on-site water management and treatment
systems that have continued to operate throughout the post-closure period. The Spruce Gulch water management facility manages water from
the former Spruce Gulch waste rock facility and South Gulch. The treated water is released into Spruce Gulch as permitted at the permitted
SWD compliance point. The process-area water management facility manages water from the reclaimed leach pads and stormwater pond. This
water may be treated in one of three ways before being released to the permitted SWD compliance point. The first treatment option is RO
with additional biological treatment. The second option is biological treatment without RO. The third treatment option is biological treatment
and chemical precipitation.
| | M3-PN240322
3 February 2025
Revision 0 |
164 |
Dakota
Gold
Technical
Report
Continued water treatment at these sites would
be the responsibility of Dakota Gold once the Property is purchased. The associated costs are subject to post-closure bonding, the obligation
for which would be assumed by Dakota Gold upon exercise of the Option.
LAC also performs surface water and groundwater
quality monitoring and aquatic biological monitoring consistent with the Hydrologic Monitoring Plan. The Hydrologic Monitoring Plan includes
monitoring at 13 groundwater wells and 10 surface-water locations to assess water quality and trends in pH, sulfate, and metal concentrations.
“Sentinel” monitoring locations are positioned at surface-water and groundwater flow locations downgradient of the historic
operations areas (i.e., backfilled mining area, Spruce Gulch, and leach pads) and are representative of the water quality in those locations.
A post-closure Groundwater Quality Contingency Plan has been implemented that identifies site-specific performance criteria that LAC uses
for triggering additional actions if water quality at defined sentinel monitoring locations indicates a potential change in groundwater
conditions that could potentially cause an exceedance of surface-water quality standards at permitted discharge points. Aquatic biological
monitoring continues to be conducted in Cleopatra Creek, Labrador Gulch, and Rubicon Gulch in accordance with the SWD permit. The Aquatic
Biological Monitoring Plan has LAC performing this monitoring every 5 years until 2032, at which time aquatic biological monitoring will
be discontinued. All site monitoring would be the responsibility of Dakota Gold once the Option is exercised.
The leach pad and backfilled historical Richmond
Hill mining area impoundment covers have met or exceeded original design specifications for limiting infiltration.
| 17.3 | Project Permitting Requirements, Permit Application Status,
and Requirements to Post Performance or Reclamation Bonds |
LAC has posted the required Post-Performance and
Reclamation bonds required by the SDDANR, and the SDDANR has updated both bonds as required. The bonds’ maintenance would be the
responsibility of Dakota Gold once the Option is exercised.
South Dakota Board of Minerals & Environment
(SDBME) required the face value of the surety bond for 2025 that serves as the post-closure financial assurance to be $41,773,222. This
was adjusted upwards from $30,838,220 based on increases in the assumed rate of inflation by SDBME.
Dakota Gold has posted the necessary Reclamation
Bonds for six Exploration Notices of Intent (EXNI) issued by the SDDANR.
| 17.4 | Requirements and Plans for Waste and Tailings Disposal, Site
Monitoring, and Water Management During Operations and After Mine Closure |
Plans, Negotiations, or Agreements with Local
Individuals or Groups
Other than ongoing coordination with surface rights
owners, and general plans regarding permitting strategy or land position, Dakota Gold does not have any current plans, negotiations, or
agreements with local individuals or groups.
| | M3-PN240322
3 February 2025
Revision 0 |
165 |
Dakota
Gold
Technical
Report
| 17.5 | Mine Closure, Remediation, and Reclamation Plans, and Associated
Costs |
The Richmond Hill Gold Mine is closed and mostly
reclaimed, except for water treatment facilities, as shown on Figure 17-1. As stated above, water treatment has been, and continues to
be, conducted at the former Spruce Gulch waste rock disposal site to treat water emanating from Spruce Gulch and South Gulch, and at the
former process area to treat seepage from the closed pads. Water treatment will be required at these sites until water quality effluent
limits and water quality standards are met pursuant to the Richmond Hill permits and South Dakota laws and regulations. Continued water
treatment at these sites would be the responsibility of Dakota Gold if Option is exercised. The associated costs are subject to post-closure
bonding, the obligation for which would be assumed by Dakota Gold upon exercise of the Option.
In 2024, LAC replaced the RO unit for the water
treatment plant. The new RO unit is smaller, more efficient, and can treat water at cooler water temperatures.
| | M3-PN240322
3 February 2025
Revision 0 |
166 |
Dakota
Gold
Technical
Report

Figure 17-1: LAC’s Reclamation Liability
Release Map (SDBME, 2016)
| | M3-PN240322
3 February 2025
Revision 0 |
167 |
Dakota
Gold
Technical
Report
| 17.6 | Qualified Person’s Opinion on the Adequacy of Current
Plans to Address Any issues Related to Environmental Compliance, Permitting, and Local Individuals or Groups |
It is the QP’s opinion that the adequacy
of the current plans and any issues related to environmental compliance, permitting, and local individuals or groups should not prevent
the Richmond Hill Gold Project from becoming a mine, especially given that the adjacent Wharf Mine owned by Coeur Mining has been in continuous
operation for over 40 years and further considering the history of mining activity in the Homestake District.
| 17.7 | Descriptions of Any Commitments to Ensure Local Procurement
and Hiring |
Dakota Gold is committed to hiring and procurement
from the local community, prioritizing the city, region, and state, followed by out-of-state and out-of-country.
| | M3-PN240322
3 February 2025
Revision 0 |
168 |
Dakota
Gold
Technical
Report
| 18 | Capital and Operating Costs |
This chapter is not required for this Initial
Assessment, but will be addressed in a future Initial Assessment with Cash Flow Analysis.
| | M3-PN240322
3 February 2025
Revision 0 |
169 |
Dakota
Gold
Technical
Report
This chapter is not required for this Initial
Assessment, but will be addressed in a future Initial Assessment with Cash Flow Analysis.
| | M3-PN240322
3 February 2025
Revision 0 |
170 |
Dakota
Gold
Technical
Report
This chapter is not required for this Initial
Assessment, but will be addressed in a future Initial Assessment with Cash Flow Analysis.
| | M3-PN240322
3 February 2025
Revision 0 |
171 |
Dakota
Gold
Technical
Report
| 21 | Other Relevant Data and Information |
Information provided in this chapter does not
pertain directly to the Richmond Hill Gold Project; rather, the items discussed may add benefit to the Project should positive exploration
results lead to a potential mining scenario.
| 21.1 | Homestake Mine Facilities |
In addition to the Option for Richmond Hill, Dakota
Gold also holds a separate option with Barrick that includes exclusive access to 145 years of Homestake exploration records throughout
South Dakota, Homestake mine data, and surface rights to 4,261 acres and contained facilities from the historical Homestake mine site,
including the Grizzly Gulch tailings management facility.
As the Homestake property was previously disturbed
by mining, Dakota Gold believes that a potential exists for Dakota Gold to repurpose this remaining infrastructure for future operations,
potentially including the Richmond Hill Project. The Grizzly Gulch tailings management facility holds the potential for reprocessing existing
tailings from historical milling operations at the Homestake mine and may provide waste storage for future Dakota Gold operations.
| 21.2 | Sanford Underground Research Facility |
At the 4850 level of the former Homestake mine,
the Sanford Underground Research Facility (SURF) houses world-leading physics experiments with an aim of achieving a better understanding
of the universe. SURF provides sufficient depth and rock stability for experiments that need to escape the constant bombardment of cosmic
radiation, which can interfere with the detection of rare physics events. The facility also hosts experiments in biology, geology, and
engineering.
SURF maintains underground dewatering to the 4850
level of the mine. Should future underground gold mining be contemplated proximal to SURF Project, certain synergies exist that may provide
benefit to both Dakota Gold and SURF with regard to water treatment and the reuse of water pumped from the SURF underground facilities.
| | M3-PN240322
3 February 2025
Revision 0 |
172 |
Dakota Gold
Technical
Report
| 22 | Interpretation and Conclusions |
This Initial Assessment is a significant iteration
from the Initial Assessment published in April of 2024. Based on additional drilling, validation of geological interpretations, metallurgical
reviews, and inclusion of heap leach methodology for the oxide and transition materials, the resource is a substantial upgrade from the
maiden resource. This heap leachable resource has the potential to be put into production quickly and at relatively low cost. There is
also opportunity for expansion of the leachable resource and development of the sulfide resource.
Major factors contributing to the change in resource
include:
| • | Additional drilling and analysis have eliminated
the need for the conservative assumptions in the October 2023 model regarding hard geologic boundaries and the requirement for two
holes for a block grade estimation. Based on this additional data and analysis, the QP has added blocks to the resource model that were
not evaluated in the October 2023 model; |
| • | Infill drilling added significant ounces to the
interior portion of the resource where adequate drill hole density was previously lacking and large gaps were found in the previous resource; |
| • | Step-out drilling extended the resource and added
significant ounces – in particular to the northeastern portion of the Project; |
| • | Additional metallurgical testwork was completed
resulting in refinement of geometallurgical domains; |
| • | This additional metallurgical work allowed for
evaluation of alternative process methods - notably, heap leach of oxide and appropriate transition zones resulted in significant increases
in recovery and reduction in cutoff grades for these materials; and |
| • | Silver was included in the updated resource. |
This study has defined a measured and indicated
mineral resource of 269.8 million tons at 0.0135 oz/t gold and 0.141 oz/t silver that is oxide and transition material amenable to crushing
and heap leaching. This amounts to 3.65 million ounces of contained gold and 38.1 million ounces of contained silver. Inferred mineral
resources amenable to heap leaching are an additional 254.2 million tons at 0.0103 oz/t gold and 0.090 oz/t silver for 2.61 million ounces
of contained gold and 22.8 million ounces of contained silver.
In addition, a measured and indicated mineral
resource of 69.6 million tons at 0.0141 oz/t gold and 0.139 oz/t silver that is sulfide material amenable to milling has been identified.
This amounts to 982,100 ounces of contained gold and 9.68 million ounces of contained silver. Inferred mineral resources amenable to milling
are an additional 202.2 million tons at 0.0121 oz/t gold and 0.145 oz/t silver amounting to 2.45 million ounces of contained gold and
29.3 million ounces of contained silver.
Table 22-1: Mineral Resource
| Resource Category | |
AuEq COG (oz/t) | |
Ktons | |
AuEq (oz/t) | |
Gold (oz/t) | |
Silver (oz/t) | |
Gold (koz) | |
Silver (koz) | |
| Leach Resource: | |
| |
| |
| |
| |
| |
| |
| |
| Measured
Mineral Resource | |
| |
113,748 | |
0.0164 | |
0.0158 | |
0.160 | |
1,793.4 | |
18,208 | |
| Oxide | |
0.0026 | |
94,537 | |
0.0165 | |
0.0158 | |
0.167 | |
1,493.7 | |
15,788 | |
| Transition | |
0.0041 | |
19,211 | |
0.0161 | |
0.0156 | |
0.126 | |
299.7 | |
2,421 | |
| Indicated Mineral Resource | |
| |
156,019 | |
0.0125 | |
0.0119 | |
0.128 | |
1,860.0 | |
19,884 | |
| Oxide | |
0.0026 | |
127,237 | |
0.0122 | |
0.0117 | |
0.128 | |
1,488.7 | |
16,286 | |
| Transition | |
0.0041 | |
28,783 | |
0.0134 | |
0.0129 | |
0.125 | |
371.3 | |
3,598 | |
| Meas/Indic
Mineral Resource | |
| |
269,768 | |
0.0141 | |
0.0135 | |
0.141 | |
3,653.3 | |
38,092 | |
| Oxide | |
0.0026 | |
221,774 | |
0.0140 | |
0.0134 | |
0.145 | |
2,982.4 | |
32,074 | |
| Transition | |
0.0041 | |
47,994 | |
0.0145 | |
0.0140 | |
0.125 | |
671.0 | |
6,018 | |
| Inferred
Mineral Resource | |
| |
254,186 | |
0.0106 | |
0.0103 | |
0.090 | |
2,613.4 | |
22,787 | |
| Oxide | |
0.0026 | |
211,994 | |
0.0101 | |
0.0098 | |
0.085 | |
2,077.5 | |
18,019 | |
| Transition | |
0.0041 | |
42,192 | |
0.0131 | |
0.0127 | |
0.113 | |
535.8 | |
4,768 | |
| Mill Resource (Sulfides): | |
| |
| |
| |
| |
| |
| |
| |
| Measured Mineral Resource | |
0.0050 | |
20,703 | |
0.0184 | |
0.0165 | |
0.151 | |
341.6 | |
3,126 | |
| Indicated Mineral Resource | |
0.0050 | |
48,893 | |
0.0147 | |
0.0131 | |
0.134 | |
640.5 | |
6,552 | |
| Meas/Indic Mineral Resource | |
0.0050 | |
69,596 | |
0.0158 | |
0.0141 | |
0.139 | |
982.1 | |
9,678 | |
| Inferred Mineral Resource | |
0.0050 | |
202,221 | |
0.0139 | |
0.0121 | |
0.145 | |
2,446.9 | |
29,322 | |
| Leach and Mill Mineral Resource: | |
| |
| |
| |
| |
| |
| |
| |
| Measured Mineral Resource | |
| |
134,452 | |
0.0167 | |
0.0159 | |
0.159 | |
2,135.0 | |
21,334 | |
| Indicated Mineral Resource | |
| |
204,912 | |
0.0130 | |
0.0122 | |
0.129 | |
2,500.5 | |
26,436 | |
| Meas/Indic Mineral Resource | |
| |
339,364 | |
0.0145 | |
0.0137 | |
0.141 | |
4,635.4 | |
47,770 | |
| Inferred Mineral Resource | |
| |
456,407 | |
0.0121 | |
0.0111 | |
0.114 | |
5,060.3 | |
52,109 | |
| | M3-PN240322
3 February 2025
Revision 0 |
173 |
Dakota
Gold
Technical
Report
There is a significant upside to the current mineral
resource estimate. Several targets for additional drilling have been identified.
The main risks to the mineral resource estimate
are the normal risks that all mining projects face including changes to metal prices, changes to government regulations, social risks,
uncertainty in mineral resource and recovery estimates, permitting risks, financing risks, and costs higher than forecast. There is no
guarantee that any of the mineral resources will be converted to mineral reserve. There is also no guarantee that any of the inferred
mineral resources will be upgraded to measured or indicated mineral resources or to mineral reserves. Mineral resources that are not mineral
reserves do not have demonstrated economic viability.
Metallurgical testwork has shown that the Richmond
Hill oxide material is amenable to cyanidation heap leach processing. Owing to the relatively high silver to gold ratio of the deposit,
Merrill-Crowe processing of the precious metal process solution is recommended for evaluation.
Low sulfide transition material is likely amenable
to heap leach processing, but at lower recoveries and higher reagent consumptions. Additional testing of the transition material is required
to determine the cut-over grade between heap leach and flotation processing and develop an ore control method to use during production.
There may also be environmental concerns that should be taken into consideration.
Metallurgical testing of the sulfide material
at Richmond Hill shows that it is amenable to froth flotation using bulk sulfide flotation methods resulting in a precious metal rich
sulfide concentrate suitable for sale or off-site processing. It is recommended that additional testwork be conducted on the flotation
products. Cyanide leaching testing of the flotation tailings would improve overall recovery for the sulfide material and may be an option
for high sulfide content transition material. Also, bio-oxidation of the flotation concentrates may be beneficial as all processing would
be on-site and result in producing a doré product for direct sale.
Dakota Gold’s property tenure is based on
the Option agreement to acquire the Homestake/LAC interests in the Richmond Hill Project area, with the mineral tenure primarily held
in the names of LAC and Homestake (see discussion in 3.3 and 3.4). Unless further extended, Dakota Gold has until December 31, 2028
to exercise the Option. By assuming all property liabilities and bonds upon exercise of the Option, Dakota Gold will acquire the responsibility
and liability to maintain the Richmond Hill mine post-closure requirements.
| | M3-PN240322
3 February 2025
Revision 0 |
174 |
Dakota
Gold
Technical
Report
In summary, the resource has been substantially
upgraded from the maiden resource described in the 2024 Initial Assessment. The additional drilling and analysis during the ensuing period
has resulted in a more robust resource and provides Dakota Gold with the conviction that the heap leachable resource can be advanced into
production.
The next step is to complete an economic assessment
and cash flow analysis, which we expect will illustrate that the Project is economically sound and that the Project can be advanced through
feasibility studies.
| | M3-PN240322
3 February 2025
Revision 0 |
175 |
Dakota
Gold
Technical
Report
The following are recommendations for the next
stages of work to advance the Project:
| • | Advance the Project to an Initial Assessment
that includes an economic analysis. |
| • | Additional metallurgical testwork and process
design. |
| • | Additional drilling to infill the current mineral
resource and test additional prospective areas. This will also improve definition of geological domains and provide material for metallurgical
testing. |
| • | Advancement of baseline environmental data collection
to support initiation of Project permitting. |
Table 23-1 summarizes the budget cost for these
items. More details for each item are provided below.
Table 23-1: Budget for Recommended Work
| Item | |
2025 | |
2026 | |
Total | |
| 1. Program To Initial Assessment W/ Cash Flow (IACF) | |
$ | 842,000 | |
| - | |
$ | 842,000 | |
| 2. Program For Feasibility Study (FS) Metallurgy and Environmental | |
$ | 2,700,000 | |
$ | 3,000,000 | |
$ | 5,700,000 | |
| - Metallurgy Program | |
$ | 500,000 | |
$ | 400,000 | |
$ | 900,000 | |
| - Monitoring Wells | |
$ | 600,000 | |
| - | |
$ | 600,000 | |
| - Environmental Geochemistry | |
$ | 120,000 | |
$ | 300,000 | |
$ | 420,000 | |
| - Environmental Samples/Analytics | |
$ | 840,000 | |
$ | 1,000,000 | |
$ | 1,840,000 | |
| - Environmental Studies/Modeling/Other | |
$ | 640,000 | |
$ | 1,300,000 | |
$ | 1,940,000 | |
| 3. Drilling Program | |
$ | 15,500,000 | |
$ | 18,000,000 | |
$ | 33,500,000 | |
| - Target Additional 500k oz For Resource | |
$ | 9,000,000 | |
$ | 2,000,000 | |
$ | 11,000,000 | |
| - Target To Conversion of Resource to Three Years Reserves | |
$ | 1,500,000 | |
$ | 9,500,000 | |
$ | 11,000,000 | |
| - Drilling For Metallurgical Testing | |
$ | 5,000,000 | |
$ | 6,500,000 | |
$ | 11,500,000 | |
| Total | |
$ | 19,042,000 | |
$ | 21,000,000 | |
$ | 40,042,000 | |
| 23.1 | Initial Assessment with Economic Analysis |
Based on the current oxide resource and potential
for heap leach processing of a portion of the transition material, it is recommended the company engage appropriate contractors to undertake
the necessary engineering and metallurgical studies to complete an Initial Assessment with Cash Flow.
| 23.2 | Metallurgical Testing and Process Design |
Oxide heap leaching is recommended for the Oxide
and the Heap Leach amenable Transition material. Additional metallurgical testwork is required to update the Oxide and Transition material
metallurgical performance and design criteria to advance the Project to feasibility.
Work should focus on optimizing the process flowsheet
to more accurately estimate capital costs. With regard to the Transition material, the metallurgical performance is related to the rock
type and degree of oxidation resulting in a “spectrum” type metallurgical domain. Further testing is required to determine
the ore control cut-over points for head grade and reagent consuming gangue.
Sulfide mineralization at RH tends to be refractory
requiring oxidation for the recovery of precious metals. Testwork has shown the RH sulfide material amenable to flotation processing,
generating a precious metal rich concentrate. The resultant concentrate may be sold, toll treated off-site or processed on-site using
an oxidation pre-treatment followed by cyanidation.
| | M3-PN240322
3 February 2025
Revision 0 |
176 |
Dakota
Gold
Technical
Report
Additional flotation work is required to develop
the design criteria for a concentrator and produce concentrate for oxidative testing. Also, it is common to evaluate the leaching response
of the flotation tailings as these tend to respond similar to the Oxide material during cyanidation. A portion of the Transition material
(high sulfide) may benefit from the processing method as well, likely resulting in higher recoveries.
Drilling to date has not defined the limits of
mineralization. Additional infill drilling as well as step out drilling to test prospective areas for potential mineralization is recommended.
The generalized areas for this drilling are shown in Figure 23-1. If successful, this drilling program will expand the extent of known
mineralization and identify areas that warrant additional exploration, including additional breccia bodies and Tertiary replacement mineralization
that remain undiscovered beneath the Paleozoic and Tertiary cover in the Carbonate Camp and Chism Gulch area of the Property.
Additional drilling is also recommended along
with metallurgical variability testwork to continue to improve the Project geological model along with the metallurgical domain model.
| | M3-PN240322
3 February 2025
Revision 0 |
177 |
Dakota
Gold
Technical
Report

Figure 23-1: Recommended Richmond Hill 2024
Diamond Drill-Hole Locations
| | M3-PN240322
3 February 2025
Revision 0 |
178 |
Dakota
Gold
Technical
Report
| 23.4 | Environmental Data Collection |
It is recommended that baseline data assessments
be initiated as soon as possible to collect data relating to surface and ground water, air quality, wildlife biology, and other areas
necessary to commence permitting. Preliminary cost estimates for closure and post-closure management of Richmond Hill should also be developed
for inclusion in an economic cash flow analysis for the Project.
It is recommended that Dakota Gold prepare an
Initial Assessment that includes an economic analysis with cash flow. Additional drilling to infill the current mineral resource and test
additional prospective areas is also recommended.
| 23.6 | Mineral Processing and Metallurgical Testing |
Oxide heap leaching is recommended for the Oxide
and the Heap Leach amenable Transition material. Additional metallurgical testwork is required to update the Oxide and Transition material
metallurgical performance and design criteria to advance the Project to feasibility.
Work should focus on optimizing the process flowsheet
to more accurately estimate capital costs. Regarding the Transition material, the metallurgical performance is related to the rock type
and degree of oxidation resulting in a “spectrum” type metallurgical domain. Further testing is required to determine the
ore control cut-over points for head grade and reagent consuming gangue.
Sulfide mineralization at RH tends to be refractory
requiring oxidation for the recovery of precious metals. Testwork has shown the RH sulfide material amenable to flotation processing,
generating a precious metal rich concentrate. The resultant concentrate may be sold, toll treated off-site or processed on-site using
an oxidation pre-treatment followed by cyanidation. Additional flotation work is required to develop the design criteria for a concentrator
and produce concentrate for oxidative testing. Also, it is common to evaluate the leaching response of the flotation tailings as these
tend to respond similar to the Oxide material during cyanidation. A portion of the Transition material (high sulfide) may benefit from
the processing method as well, likely resulting in higher recoveries.
| | M3-PN240322
3 February 2025
Revision 0 |
179 |
Dakota
Gold
Technical
Report
AKF Mining Services,
April 30, 2024. S-K 1300 Initial Assessment and Technical Report Summary – Richmond Hill Gold Project, South Dakota, U.S.A.
Ballert, T. 2024.
Methodology used to create custom projections for Homestake and Richmond Hill Grids (E.S.R.I. format). Memorandum from Ponderosa Land
Surveys, LLC.
Berry, J. 2003a.
Section 7 Dakota Gold Corp. Exploration and Drilling at Richmond Hill. Dakota Gold employee email correspondence November 20,
2023.
Berry, J. 2023b.
Section 7 Dakota Gold Corp Exploration and Drilling at Richmond Hill. Dakota Gold employee email correspondence, December 19,
2023.
Caddey, S. W.,
and R. L. Bachman, T. J. Campbell, R. R. Reid, and R. P. Otto. 1991. The Homestake Gold Mine, An Early Proterozoic Iron-Formation-Hosted
Gold Deposit, Lawrence County, South Dakota. In Geology and Resources of Gold in the United States, edited by Daniel R. Shawe, Roger P.
Ash-ley, and Lorna M.H. Carter, J1–J67. Geological Survey Bulletin 1857. Denver, CO: United States Geological Survey. Available
at https://doi.org/10.3133/b1857.
Caddey, S.W., Bachman,
R.L., Campbell, T.J., Reid, R.R., and Otto, R.P., 1991, The Homestake gold mine, an Early Proterozoic iron formation-hosted gold deposit,
Lawrence County, South Dakota: United States Geological Survey Bulletin 1857-J, 67p.
Carter, Janet M.,
Daniel G. Driscoll, and Joyce E. Williamson. 2002. The Black Hills Hydrology Study. USGS Fact Sheet FS-046-02. Reston, VA: U.S. Geological
Survey. Available at https://pubs.usgs.gov/fs/fs04602/pdf/fs04602.pdf.
Coeur Mining Inc.
2022, February 16. Wharf Operations, South Dakota, Technical Report Summary. Form 10-K Mineral Property Disclosure Exhibit Current
to December 31, 2021.
Connolly, J.P.,
1927, The Tertiary mineralization of the northern Black Hills: South Dakota School of Mines Bull. 15, 130 p.
Dahl, P.S., Terry,
M.P., Jercinovic, M.J., Williams, M.L., Hamilton, M.A., Foland, K.A., Clement, S.M., and Friberg, L.M., 2005b, Electron probe (Ultrachron)
microchronometry of metamorphic monazite: Unraveling the timing of polyphase deformation in the eastern Wyoming craton (Black Hills, South
Dakota): American Mineralogist, v. 90, p.1712–1728.
Dahl, P.S., Hamilton,
M.A., Jercinovic, M.J., Terry, M.P., Williams, M.L., and Frei, R., 2005a, Comparative isotopic and chemical geochronometry of monazite,
with implications for U-Th-Pb dating by electron microprobe: An example from metamorphic rocks of the eastern Wyoming craton (U.S.A.):
American Mineralogist, v. 90, p. 619–638
Dakota Gold, November 29,
2023. Core Logging Manual.
Dakota Gold. n.d.
a. Blind Gold Project. Available at https://dakotagoldcorp.com/portfolio/explore-our-gold-properties/blind-gold-property/. Accessed December 13,
2023.
Dakota Gold. n.d.
b. Maitland Gold Project. Available at https://dakotagoldcorp.com/portfolio/explore-our-gold-properties/maitland-property/. Accessed December 13,
2023.
| | M3-PN240322
3 February 2025
Revision 0 |
180 |
Dakota
Gold
Technical
Report
Dakota Gold. n.d.
c. Richmond Hill Gold Project. Available at https://dakotagoldcorp.com/portfolio/explore-our-gold-properties/richmond-hill/. Accessed
November 18, 2023.
Dakota Gold. n.d.
d. West Corridor Gold Project. Available at https://dakotagoldcorp.com/portfolio/explore-our-gold-properties/west-corridor-property/.
Ac-cessed December 13, 2023.
Dakota Territory
Resource Corp. 2022a. Notice of Intent to Conduct Mineral Exploration Operation (EXNI 440), notice received by South Dakota Department
of Environment & Natural Resources from DTRC on January 13, 2022.
Dakota Territory
Resource Corp. 2022b. Notice of Intent to Conduct Mineral Exploration Operation (EXNI 444), notice received by South Dakota Department
of Environment & Natural Resources from DTRC on December 5, 2022.
Dakota Territory
Resource Corp. 2023. Notice of Intent to Conduct Mineral Exploration Operation (EXNI 446), notice received by South Dakota Department
of Environment & Natural Resources from DTRC on January 27, 2023.
Additional DTRC
notices for 2024 (see below) are available but they are not listed here at this time.
Duex, T. 1989.
November 16. St. Joe Minerals Corporation Internal Memo. Unpublished internal memorandum.
Duex, T. 1990.
1990 Exploration Update. Unpublished Bond Gold Internal Memo to Mike Schwabe.
Duex, T. A., and
M. R. Andersen. 1994. Reclamation at the Richmond Hill Mine Lawrence County, South Dakota, LAC Minerals (USA), Inc. Internal report.
Environmental Resources
Management. 2015a. Postclosure Plan and Financial Assurance. Environmental Resources Management report presented to LAC Minerals (USA),
LLC, on May 28, 2015.
Environmental Resources
Management, 2015b. Updated Reclamation Plan and Financial Assurance. Environmental Resources Management report presented to LAC Minerals
(USA), LLC, on May 28, 2015.
Environmental Resources
Management. 2015c. Petition for Release of Reclamation Obligations. Environ-mental Resources Management report presented to LAC Minerals
(USA), LLC, on May 28, 2015.
Frei, R., Dahl,
P.S., Frandsson, M.M., Apel-Jensen, L., Hansen, T.R., Terry M.P., and Frei, K.M., 2009, Lead-isotope and trace-element characterization
of Paleoproterozoic metasediments in the Lead and Rochford basins (Black Hills, South Dakota, USA): Implications for genetic models, mineralization
ages, and sources of ore leads for the Homestake gold deposit: Precambrian Research, v. 172, p.1–24.
Geology of Wyoming.
n.d. “Devils Tower and Black Hills Regional Geology.” Devils Tower & Northern Black Hills Eocene Alkaline Magmatic
Province. Available at https://www.geowyo.com/devils-tower--black-hills.html. Accessed February 28, 2024.
Horton, J. 1989,
November 16. Status Report on the Cleveland Project Area. Bond Gold Internal Memo from Jack Horton to Todd Duex.
Irving, J.D., 1904,
Economic resources of the Northern Black Hills: with contributions by S.F. Emmons and T.A. Jagger, Jr; USGS Prof. Paper 26, 222p.
LAC Minerals Limited.
ca. 1991. Summary Report—MW-3 Target Area—Lawrence County, South Dakota. Internal report.
| | M3-PN240322
3 February 2025
Revision 0 |
181 |
Dakota
Gold
Technical
Report
LAC Minerals Limited.
1993. Cole Creek Target Area Summary Report. Internal report.
LAC Minerals Limited.
2023, August 22. Richmond Hill Mine Annual Report to the Lawrence County Com-mission Conditional Use Permit Nos. 116, 125, and 202.
Lisenbee, A.L.,
1981, Studies of the Tertiary intrusions of the Northern Black Hills uplift, South Dakota and Wyoming: a historical review: in Rich, F.J.,
ed., Geology of the Black Hills, South Dakota and Wyoming; GSA, Rocky Mt. Sec. 1981 Annual Meeting, Rapid City, Field Trip Guidebook,
p. 106-125.
Lisenbee, A., Redden
J. and Fahrenbach, M., 2020, Geologic Map of the Spearfish Quadrangle, South Dakota, 1:24000 Scale, Depart of environment and Natural
Resources Geologic Survey of South Dakota.
Lufkin, John L.,
Jack A. Redden, Alvis Lisenbee, and Thomas A. Loomis. 2009. Guidebook to Geology of the Black Hills, South Dakota. Golden, CO: Golden
Publishers.
National Weather
Service. 2023. Black Hills Climate Overview. National Oceanic and Atmospheric Administration, United States Department of Commerce, National
Weather Service. Available at https://www.weather.gov/unr/bhco. Accessed November 18, 2023.
nationsonline.org.
1998–2023. South Dakota (SD). Available at https://www.nationsonline.org/maps/USA/South_Dakota_map.jpg. Accessed January 23,
2024.
Paterson, C. J.
1988. WGA Field Guide Notes for Wyoming Geological Association 1988 Field Conference. Department of Geology and Geological Engineering.
Rapid City, SD: South Dakota School of Mines and Technology.
Paterson, C. J.,
A. L. Lisenbee, and J. A. Redden. 1988. Gold deposits in the Black Hills, South Dakota. In 39th Field Conference Guidebook, Eastern Powder
River Basin—Black Hills, edited by Robin P. Die-trich, Mary Ann K. Dyka, and W. Roger Miller, 295–304. Casper, WY: Wyoming
Geological Association.
Paterson, C.J.,
Lisenbee, A.L., and Redden, J.A., 1988, Gold deposits in the Black Hills, South Dakota: Wyoming Geological Association 39th Field Conference
Guidebook, Casper, Wyoming, eastern Powder River Basin – Black Hills Guidebook, p. 295-304.
Paterson, C.J.,
and Lisenbee, A.L., 1990, Metallogeny of Gold in the Black Hills, South Dakota, Society of Economic Geologists Field Conference, Sept.
5-9, Guidebook Series Volume 7.
Morelli, R.M.,
Bell, C.C., Creaser, R.A., and Simonetti, A., 2010, Constraints on the genesis of gold mineralization at the Homestake Gold Deposit, Black
Hills, South Dakota, from rhenium-osmium sulfide geochronology: Mineralium Deposita, 2010.
Nabelek, P.I.,
Labotka, T.C., Helms, T., and Wilke, M., 2006, Fluid mediated polymetamorphism related to Proterozoic collision of Archean Wyoming and
Superior provinces in the Black Hills, South Dakota: Ameri-can Mineralogist, v. 91, p. 1473–1487.
Redden, J. A.,
and E. DeWitt. 2008. Maps showing geology, structure, and geophysics of the central Black Hills, South Dakota. Scientific Investigations
Map 2777, Sheet 2. Reston, VA: United States Geological Survey. Available at https://pubs.usgs.gov/sim/2777/downloads/2777_sheet2.pdf.
Redden, J.A., and
DeWitt, E., 2008, Maps showing geology, structure, and geophysics of the Central Black Hills, South Dakota: United States Geological Survey
Scientific Investigations Map 2777, scale 1:100,000. Sanford Underground Research Facility. 2020. Our History. Available at https://sanfordlab.org/feature/our-history.
| | M3-PN240322
3 February 2025
Revision 0 |
182 |
Dakota
Gold
Technical
Report
Redden, J.A., Peterman,
Z.E., Zartman, R.E., and DeWitt, E.R., 1990, U-Th-Pb geochronology and preliminary interpretation of Precambrian events in the Black Hills,
South Dakota, in Lewry, J.F. and Stauffer, M.R., eds., The Early Proterozoic Trans-Hudson Orogen of North America: Geological Association
of Cana-da Special Paper 37, Ottawa, pp. 229–251.
SANtosito. Relief
location map of South Dakota, USA. Available at https://upload.wikimedia.org/wikipedia/commons/thumb/7/73/USA_South_Dakota_relief_location_map.svg/1200px-USA_South_Dakota_relief_location_map.svg.png.
Accessed February 23, 2021.
Shapiro, L. H.,
and J. P. Gries. 1970. Ore deposits in rocks of Paleozoic and Tertiary age of the northern Black Hills, South Dakota. Open-File Report
70-300. Reston, VA: United States Geological Survey. Available at https://doi.org/10.3133/ofr70300.
St. Joe Gold Corporation.
1986. Feasibility Report, Volume II. St. Joe American. Unpublished In-House Re-port by St. Joe Gold Corporation 1986.
South Dakota Board
of Minerals & Environment. 2016. Partial Release of Reclamation Liability & Release of Surety, South Dakota Department
of Environment & Natural Resources Board of Minerals & Environment Notice to Todd Duex of LAC Minerals (USA), LLC on
January 22, 2016.
South Dakota Board
of Minerals & Environment. 2023. Minutes of the Board of Minerals and Environment, South Dakota Board of Minerals and Environment,
notes for meeting on January 29, 2023.
South Dakota Department
of Agriculture & Natural Resources. 2022a. EXNI 444 Restriction Letter to DTRC, notice from South Dakota Department of Agriculture &
Natural Resources’ Roberta Hudson to Timm Comer of DTRC, dated January 18, 2022.
South Dakota Department
of Agriculture & Natural Resources. 2022b. EXNI 440 Restriction Letter to DTRC, notice from South Dakota Department of Agriculture &
Natural Resources’ Roberta Hudson to Gerald Aberle of DTRC, dated February 14, 2022.
South Dakota Department
of Agriculture & Natural Resources. 2022c. LAC Minerals 2022 Annual Environ-mental Audit Report, South Dakota Department of Agriculture &
Natural Resources report dated June 21 and 22, 2022.
South Dakota Department
of Agriculture & Natural Resources. 2022–2023. EXNI 440 Inspections, field inspection reports from South Dakota Department
of Agriculture & Natural Resources, September 26, 2022–January 11, 2023.
South Dakota Department
of Agriculture & Natural Resources. 2023a. Richmond Hill Gold Mine Compliance Update, Letter from South Dakota Department of
Environment & Natural Resources’ Roberta Hudson to Michelle Ozarowski (consultant), dated November 20, 2023.
South Dakota Department
of Agriculture & Natural Resources. 2023b. EXNI 446 Restriction Letter to DTRC, Notice from South Dakota Department of Agriculture &
Natural Resources’ Roberta Hudson to Timm Comer of DTRC, dated February 28, 2023.
South Dakota Department
of Agriculture & Natural Resources. 2023c. EXNI 444 Inspections, field inspection reports from South Dakota Department of Agriculture &
Natural Resources, February 10, 2023–March 3, 2023.
| | M3-PN240322
3 February 2025
Revision 0 |
183 |
Dakota
Gold
Technical
Report
South Dakota Department
of Agriculture & Natural Resources. 2024. EXNI 456 Restriction Letter to DTRC, notice from South Dakota Department of Agriculture &
Natural Resources’ Roberta Hudson to Timm Comer of DTRC, dated July 31, 2024.
South Dakota Department
of Agriculture & Natural Resources. 2024. EXNI 457 Restriction Letter to DTRC, notice from South Dakota Department of Agriculture &
Natural Resources’ Roberta Hudson to Timm Comer of DTRC, dated August 7, 2024.
South Dakota Department
of Agriculture & Natural Resources. 2024. EXNI 460 Restriction Letter to DTRC, notice from South Dakota Department of Agriculture &
Natural Resources’ Roberta Hudson to Timm Comer of DTRC, dated November 21, 2024.
Terry, M.P. and
Friberg, L.M., 1990, Pressure-temperature-time path related to the thermotectonic evolution of an Early Proterozoic metamorphic terrane,
Black Hills, South Dakota: Geology, v. 18, p. 786–789.
Terry, M. P. 2010.
Geological Field Trips in the Black Hills Region, South Dakota. Field Trip Guide Book 2010. South Dakota School of Mines Technical Bulletin
No. 21. Rapid City, SD: South Dakota Mines De-partment of Geology and Geological Engineering.
United States Department
of Agriculture Forest Service. 2023. Wildlife, Fish, & Rare Plants. Available at https://www.fs.usda.gov/detailfull/blackhills/landmanagement/?cid=STELPRDB5114233&width=full.
United States Geological
Survey. 2014. Figure 1. Area of investigation for the Black Hills Hydrology Study. The Black Hills Hydrology Study. USGS Fact Sheet FS-046-02.
Available at https://pubs.usgs.gov/fs/fs04602/html/fig1.html.
Watson, J. 1990,
February 19. Twin Tunnels Area. Bond Gold Internal Memo from Jim Watson to Pat Downey.
Zimmer, A. 2022, April 29. Summary of Work
Completed on the Richmond Hill Project.
| | M3-PN240322
3 February 2025
Revision 0 |
184 |
Dakota
Gold
Technical
Report
| 25 | Reliance on Information Provided by the Registrant |
The QPs have relied upon the Registrant for information
for which the QPs were not experts, or where the QPs were unable to independently secure documents describing the Project as noted in
the following subsections.
The legal staff at Dakota Gold prepared a summary
of the Dakota Gold–Barrick Option Agreement. The QPs did not have access to the complete agreement and are not experts in this discipline;
therefore, they have relied wholly upon the Registrant to provide an accurate document summary as described in Sections 3.4 through 3.7
and Table 3-1 and Table 3-2. A comparison with the information provided on the Dakota Gold website agreed with the summary provided.
The QPs have relied upon the Registrant to provide
a complete and accurate list of claims comprising the Property, along with the holding costs and royalties associated with certain claims
as set out in Section 3.3 and Table 3-1 and Table 3-2. The QPs have not independently verified the claim listing, royalties, and
holding costs, but have no reason to doubt the information Dakota Gold’s legal department provided.
| 25.3 | Significant Encumbrances and Permitting |
The QPs are relying on information provided by
the Registrant for this summary of current active permits associated with the potential gold deposit at the Property as discussed in Section 3.8.
The required permits seem consistent with those required in other jurisdictions; thus, the QPs have no reason to doubt that these are
correct and complete.
The QPs have relied on the Registrant for the
description of the history of the Project area.
The QPs have relied upon the Registrant for summaries
of non-drilling exploration programs carried out on the Property. The Registrant has not made public any results from exploration programs
other than drilling; however, the Registrant has stated that while these other exploration results helped target drill-collar locations,
they neither contributed nor detracted from the resource estimate reported in this Report.
The QPs are relying on information provided by
the Registrant for this summary of all environmental information, private and public, associated with the potential gold deposit at the
Property. The QPs have no reason to doubt that the required environmental information is correct and complete.
| | M3-PN240322
3 February 2025
Revision 0 |
185 |
Dakota
Gold
Technical
Report
| 26 | Date and Signature Page |
This Technical Report titled S-K 1300 Initial
Assessment and Technical Report Summary, Richmond Hill Gold Project, South Dakota, U.S.A., dated 3 February, 2025 was written by the following
QPs:
| Qualified Person |
Signature |
Date |
| Independent Mining Consultants, Inc. |
/s/ Michael G. Hester |
3 February, 2025 |
| Woods Process Service, LLC. |
/s/ Jeffrey Woods |
3 February, 2025 |
| |
|
|
| |
|
|
| |
|
|
| | M3-PN240322
3 February 2025
Revision 0 |
186 |
Exhibit 99.1

| February 6, 2025 |
News Release 25-02 |
Dakota Gold reports significant heap leachable
gold at Richmond Hill totaling 3.65 million ounces of Measured and Indicated Mineral Resources
LEAD, SOUTH DAKOTA – Dakota Gold Corp.
(NYSE American: DC) (“Dakota Gold or the “Company”) is pleased to announce its S-K 1300 Initial Assessment
(“Initial Assessment” or “Report”) has outlined a robust resource1 focused on heap leachable material
at the Richmond Hill Oxide Heap Leach Gold Project (“Richmond Hill” or “Project”) in South Dakota that will provide
a pathway to near term production.
Table 1: Heap Leachable Resource in Metric
Measurements
| Resource Category |
|
AuEq COG
(g/t) |
|
|
Ktonnes |
|
|
AuEq
(g/t) |
|
|
Gold
(g/t) |
|
|
Silver
(g/t) |
|
|
Gold
(koz) |
|
|
Silver
(koz) |
|
| Leach Resource: |
|
|
|
|
|
|
|
|
|
|
|
|
|
|
|
|
|
|
|
|
|
|
|
|
|
|
|
|
| Measured Mineral Resource |
|
|
|
|
|
|
103,190 |
|
|
|
0.562 |
|
|
|
0.542 |
|
|
|
5.49 |
|
|
|
1,793.4 |
|
|
|
18,208 |
|
| Oxide |
|
|
0.089 |
|
|
|
85,762 |
|
|
|
0.566 |
|
|
|
0.542 |
|
|
|
5.73 |
|
|
|
1,493.7 |
|
|
|
15,788 |
|
| Transition |
|
|
0.141 |
|
|
|
17,428 |
|
|
|
0.552 |
|
|
|
0.535 |
|
|
|
4.32 |
|
|
|
299.7 |
|
|
|
2,421 |
|
| |
|
|
|
|
|
|
|
|
|
|
|
|
|
|
|
|
|
|
|
|
|
|
|
|
|
|
|
|
| Indicated Mineral Resource |
|
|
|
|
|
|
141,537 |
|
|
|
0.429 |
|
|
|
0.408 |
|
|
|
4.39 |
|
|
|
1,860.0 |
|
|
|
19,884 |
|
| Oxide |
|
|
0.089 |
|
|
|
115,427 |
|
|
|
0.418 |
|
|
|
0.401 |
|
|
|
4.39 |
|
|
|
1,488.7 |
|
|
|
16,286 |
|
| Transition |
|
|
0.141 |
|
|
|
26,111 |
|
|
|
0.459 |
|
|
|
0.442 |
|
|
|
4.29 |
|
|
|
371.3 |
|
|
|
3,598 |
|
| Total M&I Mineral Resource |
|
|
|
|
|
|
244,728 |
|
|
|
0.483 |
|
|
|
0.463 |
|
|
|
4.83 |
|
|
|
3,653.3 |
|
|
|
38,092 |
|
*See Appendix Table 1 notes for resource assumptions.
Abbreviations in the table include gold equivalent
(“AuEq”); Cut-off Grade (“COG”); grams per tonne (“g/t”); thousand tonnes (“Ktonnes”);
thousand ounces (“Koz”); measured and indicated (“M&I”).
Highlights:
| · | The 3.65 million ounce measured and
indicated (“M&I”) heap leachable resource will inform the Initial Assessment with Cash Flow (“IACF”)
planned for release mid-2025. The IACF will outline a potential at surface heap leach operation similar to Coeur Mining’s
profitable Wharf Mine located 5 km to the south of Richmond Hill. Additionally, the Report has identified a heap leachable
inferred resource of 2.61 million ounces. Mineralization is shallow with portions of the resource exposed at or near
surface. |
| · | Major factors informing this resource include
additional infill and step-out drilling, analysis of the drilling data, additional metallurgical test work to refine the geometallurgical
domains, and evaluation of alternative process methods - notably, heap leach of oxide and appropriate transition zones. Silver was also
included in the updated resource. |
| · | The heap leachable resource remains open to the
north and in the southeast area of Richmond Hill. Both areas are currently in the process of being permitted for 2025 drilling with the
goal of expanding the resource with material amenable to heap leaching. Additionally, drilling is planned to begin converting resource
to reserves and gathering additional metallurgical data. |
1 Any reference to “mineral resource” or “resource”
means a mineral resource as defined by 17 CFR § 229.1300
| · | Complimenting the heap leachable resources, the
Report has also identified significant milled resources and outlines a combined heap leach and milled M&I resource of 4.64 million
ounces and combined heap leach and milled inferred resource of 5.06 million ounces noted in Table 2. The additional
milled material provides long-term optionality for the Project. |
| · | Barrick Gold has agreed to extend the option
period for the Richmond Hill option and the Homestake option agreements until December 31, 2028 in return for additional annual payments
of $170,000 and $340,000 respectively. The first of these payments are due March 1, 2026. |
Dr. Robert Quartermain, Co-Chair,
President, and CEO of Dakota Gold said, “The heap leachable resource we have identified at Richmond Hill is transformational
for Dakota Gold and forms the platform from which we can grow and expand our mining and exploration activities in the Homestake
District. In less than three years since commencing drilling, we have outlined a significant near-surface heap leachable resource
that we expect to advance through economic studies to Feasibility, and into commercial production as soon as 2029, based on our current
work and project understanding. The Project has significant advantages as it is located on private land, in an area that has
existing infrastructure and is a 15-minute drive from our headquarters in the city of Lead. We expect these factors to be greatly
beneficial in reducing both construction costs and timelines to potential production. We also expect that the Project has potential
to generate significant free cash flow once in production, which benefits all stakeholders including our shareholders, local
communities and the State of South Dakota.”
James Berry, VP Exploration commented,
“The results of the new resource for Richmond Hill have exceeded our expectations and showcase the extent and quality of the
Project mineralization. The step-out drilling incorporated in this update was very successful as evidenced by the expanded resource.
Drilling encountered gold mineralized material in nearly every hole and also encountered higher silver grades than those in the
other areas of the resource. We look forward to doing follow-up drilling in the northeastern portion of the Project as well as the
other target areas outlined in the Report in anticipation of a further resource expansion in 2025.”
Resource Overview:
The oxide dominant resource announced today has
been significantly upgraded from the maiden Initial Assessment resource (“maiden resource”) reported previously in April 2024.
In the maiden resource at Richmond Hill, the oxide resource was 60% inferred and had no measured resources. In today’s resource
update, the leach resource is almost 60% measured and indicated, split roughly equally, and this higher confidence level represents a
positive step towards feasibility study stage, and de-risking the Project.
The resource is informed by a historical database
containing 56,734 gold assays from 902 drill holes totaling 90,447 meters of drilling, and an additional 30,743 gold assays from 146 drill
holes totaling 45,540 meters of drilling by Dakota Gold since 2022 to expand the resource.
With the new resource completed, work has begun
on the IACF expected mid-2025 and is focused on areas where the resource contained higher-grade heap leach material.
Dakota Gold has contracted with M3,
RESPEC, IMC and Woods Processing to undertake the necessary engineering and metallurgical studies currently in progress to
advance from the IACF to initiating a full feasibility study in mid-2025. Concurrently the Company is undertaking baseline
environmental studies that will inform future permitting requirements.
Richmond Hill is expected to have economics
similar to the adjacent Wharf Mine of Coeur Mining, which is expected to generate over $100 million in free cash flow in 2024 from
approximately 90,000 ounces of gold. The Richmond Hill Oxide Heap Leach Gold Project is located primarily on previously mined, private land and we believe we can advance the
project expeditiously through permitting, development, and into production. The non-binding financial proposal for up to $300 million for
a development opportunity with Orion Mine Finance, our major shareholder, which was announced on October 12, 2023, could provide Dakota Gold
with the financial pathway to a commercial gold operation.
The Report will be published on the Company’s
website and filed by the Company with the Securities and Exchange Commission on EDGAR as an exhibit to its Current Report on Form 8-K
dated February 6, 2025. The Report was prepared by an independent group of Qualified Persons under Independent Mining Company (“IMC”)
and Woods Processing.
Details of the resource will be presented in a
webcast conference call on Friday, February 7, 2025 at 11am Eastern / 9am Mountain / 8am Pacific.
Webcast Conference Call Information:
Date: Friday, February 7, 2025
Time: 11am Eastern / 9am Mountain / 8am Pacific
Webcast: https://event.choruscall.com/mediaframe/webcast.html?webcastid=W6cPhcJ8
USA/Canada Toll Free: 1-844-763-8274
International Toll: +1-647-484-8814
Table 2: Richmond Hill Combined Heap Leach and Milled Resource in
Metric Measurements
| Resource Category | |
AuEq
COG
(g/t) | | |
Ktonnes | | |
AuEq
(g/t) | | |
Gold
(g/t) | | |
Silver
(g/t) | | |
Gold
(koz) | | |
Silver
(koz) | |
| Leach Resource: | |
| | | |
| | | |
| | | |
| | | |
| | | |
| | | |
| | |
| Measured Mineral Resource | |
| | | |
| 103,190 | | |
| 0.562 | | |
| 0.542 | | |
| 5.49 | | |
| 1,793.4 | | |
| 18,208 | |
| Oxide | |
| 0.089 | | |
| 85,762 | | |
| 0.566 | | |
| 0.542 | | |
| 5.73 | | |
| 1,493.7 | | |
| 15,788 | |
| Transition | |
| 0.141 | | |
| 17,428 | | |
| 0.552 | | |
| 0.535 | | |
| 4.32 | | |
| 299.7 | | |
| 2,421 | |
| Indicated Mineral Resource | |
| | | |
| 141,537 | | |
| 0.429 | | |
| 0.408 | | |
| 4.39 | | |
| 1,860.0 | | |
| 19,884 | |
| Oxide | |
| 0.089 | | |
| 115,427 | | |
| 0.418 | | |
| 0.401 | | |
| 4.39 | | |
| 1,488.7 | | |
| 16,286 | |
| Transition | |
| 0.141 | | |
| 26,111 | | |
| 0.459 | | |
| 0.442 | | |
| 4.29 | | |
| 371.3 | | |
| 3,598 | |
| M&I Mineral Resource | |
| | | |
| 244,728 | | |
| 0.483 | | |
| 0.463 | | |
| 4.83 | | |
| 3,653.3 | | |
| 38,092 | |
| Oxide | |
| 0.089 | | |
| 201,189 | | |
| 0.480 | | |
| 0.459 | | |
| 4.97 | | |
| 2,982.4 | | |
| 32,074 | |
| Transition | |
| 0.141 | | |
| 43,539 | | |
| 0.497 | | |
| 0.480 | | |
| 4.29 | | |
| 671.0 | | |
| 6,018 | |
| Inferred Mineral Resource | |
| | | |
| 230,592 | | |
| 0.363 | | |
| 0.353 | | |
| 3.09 | | |
| 2,613.4 | | |
| 22,787 | |
| Oxide | |
| 0.089 | | |
| 192,317 | | |
| 0.346 | | |
| 0.336 | | |
| 2.91 | | |
| 2,077.5 | | |
| 18,019 | |
| Transition | |
| 0.141 | | |
| 38,276 | | |
| 0.449 | | |
| 0.435 | | |
| 3.87 | | |
| 535.8 | | |
| 4,768 | |
| | |
| | | |
| | | |
| | | |
| | | |
| | | |
| | | |
| | |
| Mill Resource (Sulfides): | |
| | | |
| | | |
| | | |
| | | |
| | | |
| | | |
| | |
| Measured Mineral Resource | |
| 0.171 | | |
| 18,781 | | |
| 0.631 | | |
| 0.566 | | |
| 5.18 | | |
| 341.6 | | |
| 3,126 | |
| Indicated Mineral Resource | |
| 0.171 | | |
| 44,355 | | |
| 0.504 | | |
| 0.449 | | |
| 4.59 | | |
| 640.5 | | |
| 6,552 | |
| M&I Mineral Resource | |
| 0.171 | | |
| 63,136 | | |
| 0.542 | | |
| 0.483 | | |
| 4.77 | | |
| 982.1 | | |
| 9,678 | |
| Inferred Mineral Resource | |
| 0.171 | | |
| 183,451 | | |
| 0.477 | | |
| 0.415 | | |
| 4.97 | | |
| 2,446.9 | | |
| 29,322 | |
| | |
| | | |
| | | |
| | | |
| | | |
| | | |
| | | |
| | |
| Leach and Mill Mineral Resource: | |
| | | |
| | | |
| | | |
| | | |
| | | |
| | | |
| | |
| Measured Mineral Resource | |
| | | |
| 121,972 | | |
| 0.573 | | |
| 0.545 | | |
| 5.45 | | |
| 2,135.0 | | |
| 21,334 | |
| Indicated Mineral Resource | |
| | | |
| 185,892 | | |
| 0.446 | | |
| 0.418 | | |
| 4.42 | | |
| 2,500.5 | | |
| 26,436 | |
| M&I Mineral Resource | |
| | | |
| 307,864 | | |
| 0.497 | | |
| 0.470 | | |
| 4.83 | | |
| 4,635.4 | | |
| 47,770 | |
| Inferred Mineral Resource | |
| | | |
| 414,043 | | |
| 0.415 | | |
| 0.381 | | |
| 3.91 | | |
| 5,060.3 | | |
| 52,109 | |
*See Appendix Table 1 notes for resource assumptions.
Abbreviations in the table include gold equivalent
(“AuEq”); Cut-off Grade (“COG”); grams per tonne (“g/t”); thousand tonnes (“Ktonnes”);
thousand ounces (“Koz”); measured and indicated (“M&I”).
Resource Growth Potential:
The resource has potential for expansion with
additional drilling.
Figure 1:
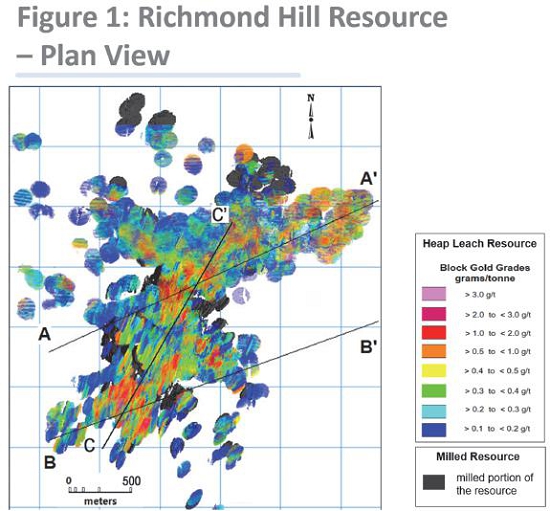
Figure 2:
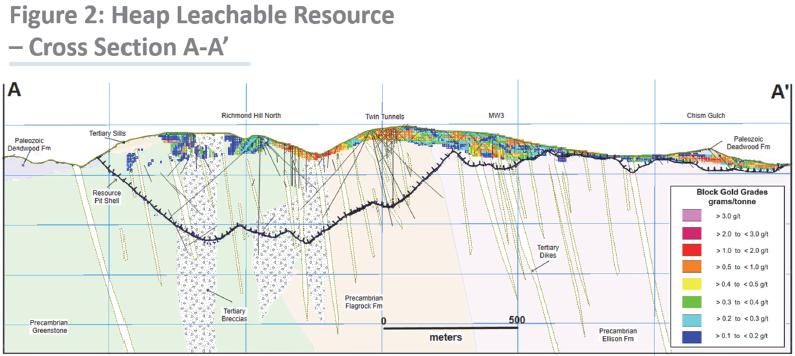
Figure 3:
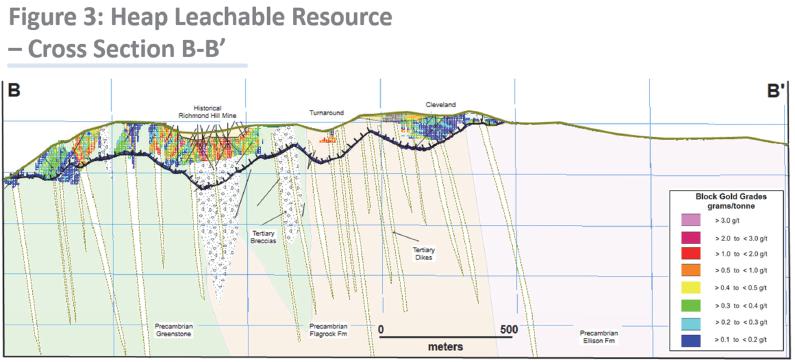
Figure 4:
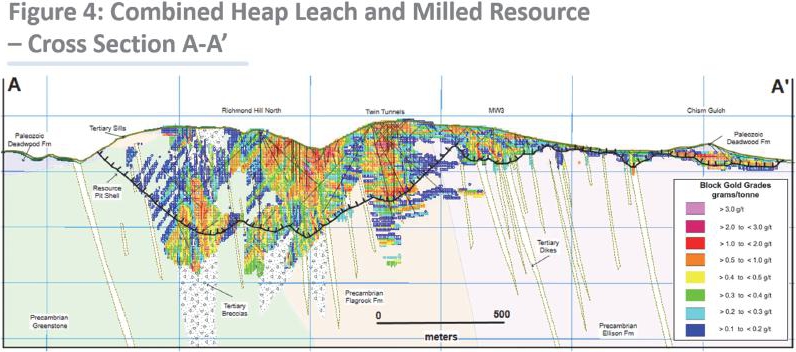
Figure 5:
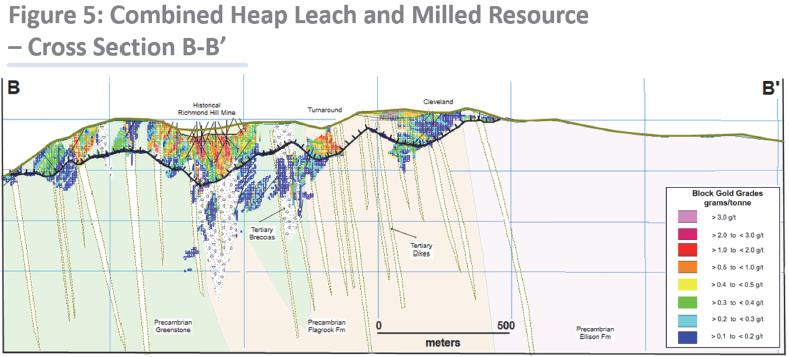
Figure 6:
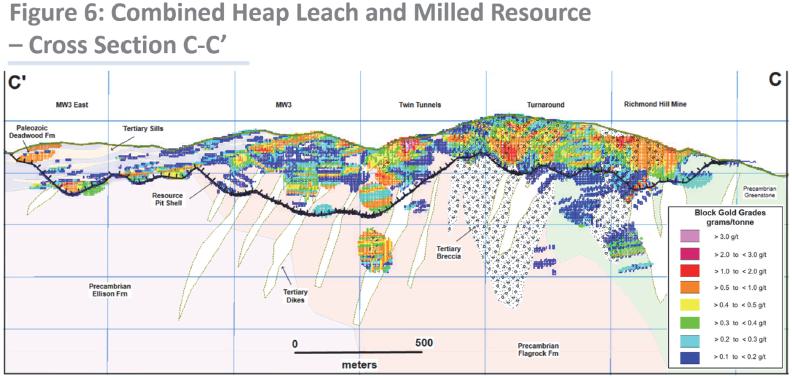
Figure 7:
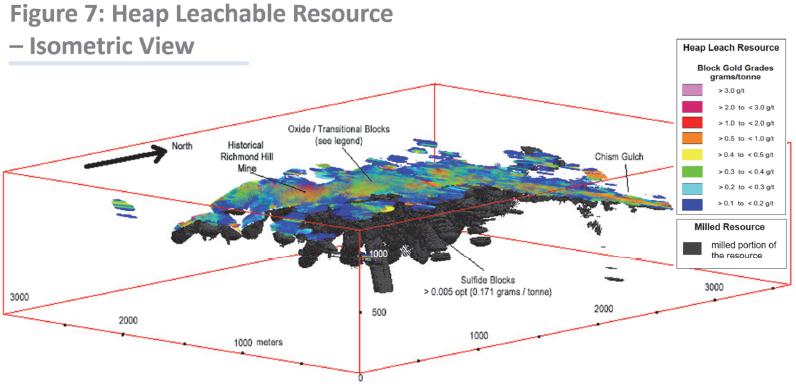
About Dakota Gold Corp.
Dakota Gold is building on the legacy of the 145
year old Homestake Gold Mining District by advancing the Richmond Hill Oxide Heap Leach Gold Project and outlining a high-grade underground
gold resource at the Maitland Gold Project located on private land in South Dakota.
Subscribe to Dakota Gold’s e-mail list
at www.dakotagoldcorp.com to receive the latest news and other Company updates.
Shareholder and Investor Inquiries
For more information, please contact:
Dr. Robert Quartermain
Co-Chair, Director, President and Chief Executive
Officer
Tel: +1 778-655-9638
Dr. Stephen O’Rourke
Co-Chair, Director and Managing Director
Tel: +1 605-717-2540
Carling Gaze
VP of Investor Relations and Corporate Communications
Tel: +1 605-679-7429
Email: info@dakotagoldcorp.com
Qualified Persons
The Report was prepared by an independent group
of Qualified Persons under IMC, which has reviewed and approved the contents of this news release.
Forward-Looking Statements
This communication contains forward-looking
statements within the meaning of Section 27A of the Securities Act of 1933, as amended, and Section 21E of the Securities
Exchange Act of 1934, as amended. When used in this communication, the words “plan,” “target,”
“anticipate,” “believe,” “estimate,” “intend,” “potential,”
“will” and “expect” and similar expressions are intended to identify such forward-looking statements. Any
express or implied statements contained in this communication that are not statements of historical fact may be deemed to be
forward-looking statements, including, without limitation: our expectations regarding additional drilling and modeling; our
expectations for the improvement and growth of the mineral resources and potential for conversion of mineral resources into
reserves; the timing for the S-K 1300 Initial Assessment with cash flow analysis, completion of a feasibility study, and/or
permitting; our expectations regarding free cash flow and future financing; and our overall expectation for the possibility of
near-term production at the Richmond Hill project. These forward-looking statements are based on assumptions and expectations that
may not be realized and are inherently subject to numerous risks and uncertainties, which could cause actual results to differ
materially from these statements. These risks and uncertainties include, among others: the execution and timing of our planned
exploration activities; our use and evaluation of historic data; our ability to achieve our strategic goals; the state of the
economy and financial markets generally and the effect on our industry; and the market for our common stock. The foregoing list is
not exhaustive. For additional information regarding factors that may cause actual results to differ materially from those indicated
in our forward-looking statements, we refer you to the risk factors included in Item 1A of the Company’s Annual Report on
Form 10-K for the fiscal year ended December 31, 2023, as updated by annual, quarterly and current reports that we file
with the SEC, which are available at www.sec.gov. We caution investors not to place undue reliance on the forward-looking statements
contained in this communication. These statements speak only as of the date of this communication, and we undertake no obligation to
update or revise these statements, whether as a result of new information, future events or otherwise, except as may be required by
law. We do not give any assurance that we will achieve our expectations.
All references to “$” in this communication
are to U.S. dollars unless otherwise stated.
Appendix:
Table 1: Richmond Hill Combined Heap Leach and Milled Resource in
Imperial Measurements
| Resource Category |
|
AuEq
COG
(oz/t) |
|
|
Ktons |
|
|
AuEq
(oz/t) |
|
|
Gold
(oz/t) |
|
|
Silver
(oz/t) |
|
|
Gold
(koz) |
|
|
Silver
(koz) |
|
| Leach Resource: |
|
|
|
|
|
|
|
|
|
|
|
|
|
|
|
|
|
|
|
|
|
|
|
|
|
|
|
|
| Measured Mineral Resource |
|
|
|
|
|
|
113,748 |
|
|
|
0.0164 |
|
|
|
0.0158 |
|
|
|
0.160 |
|
|
|
1,793.4 |
|
|
|
18,208 |
|
| Oxide |
|
|
0.0026 |
|
|
|
94,537 |
|
|
|
0.0165 |
|
|
|
0.0158 |
|
|
|
0.167 |
|
|
|
1,493.7 |
|
|
|
15,788 |
|
| Transition |
|
|
0.0041 |
|
|
|
19,211 |
|
|
|
0.0161 |
|
|
|
0.0156 |
|
|
|
0.126 |
|
|
|
299.7 |
|
|
|
2,421 |
|
| Indicated Mineral Resource |
|
|
|
|
|
|
156,019 |
|
|
|
0.0125 |
|
|
|
0.0119 |
|
|
|
0.128 |
|
|
|
1,860.0 |
|
|
|
19,884 |
|
| Oxide |
|
|
0.0026 |
|
|
|
127,237 |
|
|
|
0.0122 |
|
|
|
0.0117 |
|
|
|
0.128 |
|
|
|
1,488.7 |
|
|
|
16,286 |
|
| Transition |
|
|
0.0041 |
|
|
|
28,783 |
|
|
|
0.0134 |
|
|
|
0.0129 |
|
|
|
0.125 |
|
|
|
371.3 |
|
|
|
3,598 |
|
| M&I Mineral Resource |
|
|
|
|
|
|
269,768 |
|
|
|
0.0141 |
|
|
|
0.0135 |
|
|
|
0.141 |
|
|
|
3,653.3 |
|
|
|
38,092 |
|
| Oxide |
|
|
0.0026 |
|
|
|
221,774 |
|
|
|
0.0140 |
|
|
|
0.0134 |
|
|
|
0.145 |
|
|
|
2,982.4 |
|
|
|
32,074 |
|
| Transition |
|
|
0.0041 |
|
|
|
47,994 |
|
|
|
0.0145 |
|
|
|
0.0140 |
|
|
|
0.125 |
|
|
|
671.0 |
|
|
|
6,018 |
|
| Inferred Mineral Resource |
|
|
|
|
|
|
254,186 |
|
|
|
0.0106 |
|
|
|
0.0103 |
|
|
|
0.090 |
|
|
|
2,613.4 |
|
|
|
22,787 |
|
| Oxide |
|
|
0.0026 |
|
|
|
211,994 |
|
|
|
0.0101 |
|
|
|
0.0098 |
|
|
|
0.085 |
|
|
|
2,077.5 |
|
|
|
18,019 |
|
| Transition |
|
|
0.0041 |
|
|
|
42,192 |
|
|
|
0.0131 |
|
|
|
0.0127 |
|
|
|
0.113 |
|
|
|
535.8 |
|
|
|
4,768 |
|
| |
|
|
|
|
|
|
|
|
|
|
|
|
|
|
|
|
|
|
|
|
|
|
|
|
|
|
|
|
| Mill Resource (Sulfides): |
|
|
|
|
|
|
|
|
|
|
|
|
|
|
|
|
|
|
|
|
|
|
|
|
|
|
|
|
| Measured Mineral Resource |
|
|
0.0050 |
|
|
|
20,703 |
|
|
|
0.0184 |
|
|
|
0.0165 |
|
|
|
0.151 |
|
|
|
341.6 |
|
|
|
3,126 |
|
| Indicated Mineral Resource |
|
|
0.0050 |
|
|
|
48,893 |
|
|
|
0.0147 |
|
|
|
0.0131 |
|
|
|
0.134 |
|
|
|
640.5 |
|
|
|
6,552 |
|
| M&I Mineral Resource |
|
|
0.0050 |
|
|
|
69,596 |
|
|
|
0.0158 |
|
|
|
0.0141 |
|
|
|
0.139 |
|
|
|
982.1 |
|
|
|
9,678 |
|
| Inferred Mineral Resource |
|
|
0.0050 |
|
|
|
202,221 |
|
|
|
0.0139 |
|
|
|
0.0121 |
|
|
|
0.145 |
|
|
|
2,446.9 |
|
|
|
29,322 |
|
| |
|
|
|
|
|
|
|
|
|
|
|
|
|
|
|
|
|
|
|
|
|
|
|
|
|
|
|
|
| Leach and Mill Mineral Resource: |
|
|
|
|
|
|
|
|
|
|
|
|
|
|
|
|
|
|
|
|
|
|
|
|
|
|
|
|
| Measured Mineral Resource |
|
|
|
|
|
|
134,452 |
|
|
|
0.0167 |
|
|
|
0.0159 |
|
|
|
0.159 |
|
|
|
2,135.0 |
|
|
|
21,334 |
|
| Indicated Mineral Resource |
|
|
|
|
|
|
204,912 |
|
|
|
0.0130 |
|
|
|
0.0122 |
|
|
|
0.129 |
|
|
|
2,500.5 |
|
|
|
26,436 |
|
| M&I Mineral Resource |
|
|
|
|
|
|
339,364 |
|
|
|
0.0145 |
|
|
|
0.0137 |
|
|
|
0.141 |
|
|
|
4,635.4 |
|
|
|
47,770 |
|
| Inferred Mineral Resource |
|
|
|
|
|
|
456,407 |
|
|
|
0.0121 |
|
|
|
0.0111 |
|
|
|
0.114 |
|
|
|
5,060.3 |
|
|
|
52,109 |
|
See S-K 1300 Initial Assessment Table 1-1
Abbreviations in the table include gold equivalent
(“AuEq”); Cut-off Grade (“COG”); ounces per ton (“oz/t”); thousand tons (“Ktons”); thousand
ounces (“Koz”); measured and indicated (“M&I”).
Notes:
1. The Mineral Resource estimate has an effective date of 3 February 2025.
2. All figures are rounded to reflect the relative accuracy of the
estimate and therefore numbers may not appear to add precisely.
3. Mineral Resources that are not Mineral Reserves do not have demonstrated
economic viability.
4. Mineral Resources are based on prices of $2000/oz gold and $25/oz
silver.
5. Mineral Resources for leach material are based on a gold equivalent
cut-off of 0.0026 oz/t for oxide material and 0.0041 oz/t for transition material. Mineral Resources for mill material are based on a
gold equivalent cut-off of 0.0050 oz/t.
6. The gold equivalent value for each material is as follows:
Oxide (Leach): Gold equivalent (oz/t) = gold (oz/t) + 0.00418 x silver
(oz/t), based on gold recovery of 89% and silver recovery of 30%.
Transition (Leach): Gold equivalent = gold (oz/t) + 0.00382 x silver
(oz/t), based on gold recovery of 65% and silver recovery of 20%.
Sulfide (Mill): Gold equivalent = gold (oz/t) + 0.0127 x silver (oz/t),
based on gold recovery of 85% and silver recovery of 85%.
7. The gold equivalent values account for metal recoveries, treatment
charges, refining costs, and refinery payable percentages.
8. Table 11-4 in the Report accompanies the Mineral Resource statement
and shows all relevant parameters for mineral resources.
9. Includes a preliminary estimated royalty rate of 3.8% averaged
across the Project property. The QP has determined that the resource is not sensitive to nominal changes in the royalty rate but has
recommended that this estimate be updated for the Project economic and cash flow analysis.
10. Mineral Resources are reported in relation to a conceptual constraining
pit shell to demonstrate reasonable prospects for economic extraction, as required by the definition of Mineral Resource in S-K 1300;
mineralization lying outside of the pit shell is excluded from the Mineral Resource.
11. The Mineral Resource estimate is also constrained by the Richmond
Hill Project Boundary. Only mineralization inside this boundary is included in the Mineral Resource Estimate, though waste removal outside
the boundary is allowed.
12. The Mineral Resources reported are contained on mineral titles
owned or controlled by Dakota Gold.
13. The Mineral Resources are reported in-situ
without any dilution or loss considerations, as a point of reference.
v3.25.0.1
Cover
|
Feb. 03, 2025 |
| Document Information [Line Items] |
|
| Document Type |
8-K
|
| Amendment Flag |
false
|
| Document Period End Date |
Feb. 03, 2025
|
| Entity File Number |
001-41349
|
| Entity Registrant Name |
DAKOTA
GOLD CORP.
|
| Entity Central Index Key |
0001852353
|
| Entity Tax Identification Number |
85-3475290
|
| Entity Incorporation, State or Country Code |
DE
|
| Entity Address, Address Line One |
106 Glendale Drive, Suite A,
|
| Entity Address, City or Town |
Lead
|
| Entity Address, State or Province |
SD
|
| Entity Address, Country |
US
|
| Entity Address, Postal Zip Code |
57754
|
| City Area Code |
605
|
| Local Phone Number |
906-8363
|
| Written Communications |
false
|
| Soliciting Material |
false
|
| Pre-commencement Tender Offer |
false
|
| Pre-commencement Issuer Tender Offer |
false
|
| Entity Emerging Growth Company |
true
|
| Elected Not To Use the Extended Transition Period |
false
|
| Common Stock [Member] |
|
| Document Information [Line Items] |
|
| Title of 12(b) Security |
Common
Stock, par value $0.001 per share
|
| Trading Symbol |
DC
|
| Security Exchange Name |
NYSE
|
| Warrants, each whole warrant exercisable for one share of the Registrant’s common stock at an exercise price of $2.08 per share[Member] |
|
| Document Information [Line Items] |
|
| Title of 12(b) Security |
Warrants, each warrant exercisable for one share of the Registrant's common stock at an exercise price of $2.08
|
| Trading Symbol |
DC.WS
|
| Security Exchange Name |
NYSE
|
| X |
- DefinitionBoolean flag that is true when the XBRL content amends previously-filed or accepted submission.
| Name: |
dei_AmendmentFlag |
| Namespace Prefix: |
dei_ |
| Data Type: |
xbrli:booleanItemType |
| Balance Type: |
na |
| Period Type: |
duration |
|
| X |
- DefinitionFor the EDGAR submission types of Form 8-K: the date of the report, the date of the earliest event reported; for the EDGAR submission types of Form N-1A: the filing date; for all other submission types: the end of the reporting or transition period. The format of the date is YYYY-MM-DD.
| Name: |
dei_DocumentPeriodEndDate |
| Namespace Prefix: |
dei_ |
| Data Type: |
xbrli:dateItemType |
| Balance Type: |
na |
| Period Type: |
duration |
|
| X |
- DefinitionThe type of document being provided (such as 10-K, 10-Q, 485BPOS, etc). The document type is limited to the same value as the supporting SEC submission type, or the word 'Other'.
| Name: |
dei_DocumentType |
| Namespace Prefix: |
dei_ |
| Data Type: |
dei:submissionTypeItemType |
| Balance Type: |
na |
| Period Type: |
duration |
|
| X |
- DefinitionAddress Line 1 such as Attn, Building Name, Street Name
| Name: |
dei_EntityAddressAddressLine1 |
| Namespace Prefix: |
dei_ |
| Data Type: |
xbrli:normalizedStringItemType |
| Balance Type: |
na |
| Period Type: |
duration |
|
| X |
- Definition
+ References
+ Details
| Name: |
dei_EntityAddressCityOrTown |
| Namespace Prefix: |
dei_ |
| Data Type: |
xbrli:normalizedStringItemType |
| Balance Type: |
na |
| Period Type: |
duration |
|
| X |
- DefinitionISO 3166-1 alpha-2 country code.
| Name: |
dei_EntityAddressCountry |
| Namespace Prefix: |
dei_ |
| Data Type: |
dei:countryCodeItemType |
| Balance Type: |
na |
| Period Type: |
duration |
|
| X |
- DefinitionCode for the postal or zip code
| Name: |
dei_EntityAddressPostalZipCode |
| Namespace Prefix: |
dei_ |
| Data Type: |
xbrli:normalizedStringItemType |
| Balance Type: |
na |
| Period Type: |
duration |
|
| X |
- DefinitionName of the state or province.
| Name: |
dei_EntityAddressStateOrProvince |
| Namespace Prefix: |
dei_ |
| Data Type: |
dei:stateOrProvinceItemType |
| Balance Type: |
na |
| Period Type: |
duration |
|
| X |
- DefinitionA unique 10-digit SEC-issued value to identify entities that have filed disclosures with the SEC. It is commonly abbreviated as CIK. Reference 1: http://www.xbrl.org/2003/role/presentationRef
-Publisher SEC
-Name Exchange Act
-Number 240
-Section 12
-Subsection b-2
| Name: |
dei_EntityCentralIndexKey |
| Namespace Prefix: |
dei_ |
| Data Type: |
dei:centralIndexKeyItemType |
| Balance Type: |
na |
| Period Type: |
duration |
|
| X |
- DefinitionIndicate if registrant meets the emerging growth company criteria. Reference 1: http://www.xbrl.org/2003/role/presentationRef
-Publisher SEC
-Name Exchange Act
-Number 240
-Section 12
-Subsection b-2
| Name: |
dei_EntityEmergingGrowthCompany |
| Namespace Prefix: |
dei_ |
| Data Type: |
xbrli:booleanItemType |
| Balance Type: |
na |
| Period Type: |
duration |
|
| X |
- DefinitionCommission file number. The field allows up to 17 characters. The prefix may contain 1-3 digits, the sequence number may contain 1-8 digits, the optional suffix may contain 1-4 characters, and the fields are separated with a hyphen.
| Name: |
dei_EntityFileNumber |
| Namespace Prefix: |
dei_ |
| Data Type: |
dei:fileNumberItemType |
| Balance Type: |
na |
| Period Type: |
duration |
|
| X |
- DefinitionTwo-character EDGAR code representing the state or country of incorporation.
| Name: |
dei_EntityIncorporationStateCountryCode |
| Namespace Prefix: |
dei_ |
| Data Type: |
dei:edgarStateCountryItemType |
| Balance Type: |
na |
| Period Type: |
duration |
|
| X |
- DefinitionThe exact name of the entity filing the report as specified in its charter, which is required by forms filed with the SEC. Reference 1: http://www.xbrl.org/2003/role/presentationRef
-Publisher SEC
-Name Exchange Act
-Number 240
-Section 12
-Subsection b-2
| Name: |
dei_EntityRegistrantName |
| Namespace Prefix: |
dei_ |
| Data Type: |
xbrli:normalizedStringItemType |
| Balance Type: |
na |
| Period Type: |
duration |
|
| X |
- DefinitionThe Tax Identification Number (TIN), also known as an Employer Identification Number (EIN), is a unique 9-digit value assigned by the IRS. Reference 1: http://www.xbrl.org/2003/role/presentationRef
-Publisher SEC
-Name Exchange Act
-Number 240
-Section 12
-Subsection b-2
| Name: |
dei_EntityTaxIdentificationNumber |
| Namespace Prefix: |
dei_ |
| Data Type: |
dei:employerIdItemType |
| Balance Type: |
na |
| Period Type: |
duration |
|
| X |
- DefinitionLocal phone number for entity.
| Name: |
dei_LocalPhoneNumber |
| Namespace Prefix: |
dei_ |
| Data Type: |
xbrli:normalizedStringItemType |
| Balance Type: |
na |
| Period Type: |
duration |
|
| X |
- DefinitionBoolean flag that is true when the Form 8-K filing is intended to satisfy the filing obligation of the registrant as pre-commencement communications pursuant to Rule 13e-4(c) under the Exchange Act. Reference 1: http://www.xbrl.org/2003/role/presentationRef
-Publisher SEC
-Name Exchange Act
-Number 240
-Section 13e
-Subsection 4c
| Name: |
dei_PreCommencementIssuerTenderOffer |
| Namespace Prefix: |
dei_ |
| Data Type: |
xbrli:booleanItemType |
| Balance Type: |
na |
| Period Type: |
duration |
|
| X |
- DefinitionBoolean flag that is true when the Form 8-K filing is intended to satisfy the filing obligation of the registrant as pre-commencement communications pursuant to Rule 14d-2(b) under the Exchange Act. Reference 1: http://www.xbrl.org/2003/role/presentationRef
-Publisher SEC
-Name Exchange Act
-Number 240
-Section 14d
-Subsection 2b
| Name: |
dei_PreCommencementTenderOffer |
| Namespace Prefix: |
dei_ |
| Data Type: |
xbrli:booleanItemType |
| Balance Type: |
na |
| Period Type: |
duration |
|
| X |
- DefinitionTitle of a 12(b) registered security. Reference 1: http://www.xbrl.org/2003/role/presentationRef
-Publisher SEC
-Name Exchange Act
-Number 240
-Section 12
-Subsection b
| Name: |
dei_Security12bTitle |
| Namespace Prefix: |
dei_ |
| Data Type: |
dei:securityTitleItemType |
| Balance Type: |
na |
| Period Type: |
duration |
|
| X |
- DefinitionName of the Exchange on which a security is registered. Reference 1: http://www.xbrl.org/2003/role/presentationRef
-Publisher SEC
-Name Exchange Act
-Number 240
-Section 12
-Subsection d1-1
| Name: |
dei_SecurityExchangeName |
| Namespace Prefix: |
dei_ |
| Data Type: |
dei:edgarExchangeCodeItemType |
| Balance Type: |
na |
| Period Type: |
duration |
|
| X |
- DefinitionBoolean flag that is true when the Form 8-K filing is intended to satisfy the filing obligation of the registrant as soliciting material pursuant to Rule 14a-12 under the Exchange Act. Reference 1: http://www.xbrl.org/2003/role/presentationRef
-Publisher SEC
-Name Exchange Act
-Section 14a
-Number 240
-Subsection 12
| Name: |
dei_SolicitingMaterial |
| Namespace Prefix: |
dei_ |
| Data Type: |
xbrli:booleanItemType |
| Balance Type: |
na |
| Period Type: |
duration |
|
| X |
- DefinitionTrading symbol of an instrument as listed on an exchange.
| Name: |
dei_TradingSymbol |
| Namespace Prefix: |
dei_ |
| Data Type: |
dei:tradingSymbolItemType |
| Balance Type: |
na |
| Period Type: |
duration |
|
| X |
- DefinitionBoolean flag that is true when the Form 8-K filing is intended to satisfy the filing obligation of the registrant as written communications pursuant to Rule 425 under the Securities Act. Reference 1: http://www.xbrl.org/2003/role/presentationRef
-Publisher SEC
-Name Securities Act
-Number 230
-Section 425
| Name: |
dei_WrittenCommunications |
| Namespace Prefix: |
dei_ |
| Data Type: |
xbrli:booleanItemType |
| Balance Type: |
na |
| Period Type: |
duration |
|
| X |
- Details
| Name: |
us-gaap_StatementClassOfStockAxis=us-gaap_CommonStockMember |
| Namespace Prefix: |
|
| Data Type: |
na |
| Balance Type: |
|
| Period Type: |
|
|
| X |
- Details
| Name: |
us-gaap_StatementClassOfStockAxis=DC_WarrantsEachWholeWarrantExercisableForOneShareOfRegistrantsCommonStockAtExercisePriceOf2.08PerShareMember |
| Namespace Prefix: |
|
| Data Type: |
na |
| Balance Type: |
|
| Period Type: |
|
|
Dakota Gold (AMEX:DC)
Graphique Historique de l'Action
De Jan 2025 à Fév 2025

Dakota Gold (AMEX:DC)
Graphique Historique de l'Action
De Fév 2024 à Fév 2025

