Eastman Chemical Company (NYSE:EMN) announced its second-quarter
2024 financial results.
This press release features multimedia. View
the full release here:
https://www.businesswire.com/news/home/20240725916788/en/
- Delivered strong year-over-year sales volume/mix growth driven
by Advanced Materials.
- Drove a 300-basis-point sequential margin improvement through
volume/mix growth and operating leverage.
- Demonstrated continued commercial excellence by focusing on
specialty product offerings and managing price-cost across the
company.
- Continued to ramp up sales to our customers from the Kingsport
methanolysis facility, while demonstrating higher operating rates
and broadening the range of hard-to-recycle feedstocks.
- Delivered solid 1H24 operating cash flow and repurchased $100
million of shares in second quarter 2024.
(In millions, except per share amounts;
unaudited)
2Q24
2Q23
Sales revenue
$2,363
$2,324
Earnings before interest and taxes
(“EBIT”)
337
323
Adjusted EBIT*
353
336
Earnings per diluted share
1.94
2.27
Adjusted earnings per diluted
share*
2.15
1.99
Net cash provided by operating
activities
367
410
*For non-core and unusual items
excluded from adjusted earnings and for adjusted provision for
income taxes, segment adjusted EBIT margins, and net debt,
reconciliations to reported company and segment earnings and total
borrowings for all periods presented in this release, see Tables
3A, 3B, 4A, and 6.
“We delivered strong second-quarter results driven by topline
growth and strong sequential margin improvement,” said Mark Costa,
Board Chair and CEO. “We saw modest seasonal increases in our sales
volume led by durables and automotive end markets. Underlying
primary demand trends remained weak. Against this backdrop, the
Eastman team remains focused on commercial and operational
excellence. With customer inventory destocking largely complete and
end-market demand stabilizing at lower levels, we will continue to
focus on controllable items and leveraging our innovation-driven
growth model to deliver growth above our underlying end markets. We
also continue to advance our circular platform and demonstrate our
leadership position in the circular economy. We continued to
successfully serve our customers, demonstrated higher operating
rates, and achieved an important milestone by introducing
hard-to-recycle feedstocks into the Kingsport methanolysis
facility, while we also worked through start-up issues.”
Corporate Results 2Q 2024 versus 2Q 2023
Sales revenue increased 2 percent primarily due to 6 percent
higher sales volume/mix partially offset by 4 percent lower selling
prices.
Higher sales volume/mix was driven by the end of customer
inventory destocking across most end markets. This improvement was
partially offset by weakness in the building and construction end
market. Lower selling prices were due to lower raw material prices
across all segments.
EBIT increased primarily due to higher sales volume/mix in
Advanced Materials, partially offset by lower price-cost in
Chemical Intermediates.
Segment Results 2Q 2024 versus 2Q 2023
Advanced Materials – Sales revenue increased 8 percent
due to 12 percent higher sales volume/mix partially offset by 4
percent lower selling prices.
Higher sales volume/mix was the result of the end of customer
inventory destocking especially in the durables and packaging end
markets as well as premium interlayers product growth in the
automotive end market. This growth was partially offset by lower
selling prices.
EBIT increased due to higher sales volume/mix, partially offset
by unfavorable price-cost.
Additives & Functional Products – Sales revenue
decreased 4 percent due to 4 percent lower selling prices.
Lower selling prices were primarily due to lower raw material
prices, including the impact of cost-pass-through contracts in care
additives and functional amines. Sales volume/mix was unchanged as
growth in coatings additives and care additives was offset by a
decline in specialty fluids due to lower heat transfer fluid
project fulfillments.
EBIT decreased due to lower heat transfer fluid project
fulfillments.
Fibers – Sales revenue increased 2 percent due to 1
percent higher sales volume/mix and 1 percent higher selling
prices.
Higher selling prices were driven by acetate tow price
increases. Sales volume/mix increased primarily due to growth in
the textiles product line.
EBIT increased due to favorable price-cost and higher sales
volume/mix.
Chemical Intermediates – Sales revenue was flat due to 6
percent higher sales volume/mix, fully offset by 6 percent lower
selling prices.
Higher sales volume/mix across the segment was driven by the end
of customer inventory destocking. Higher sales volume/mix was
offset by lower selling prices due to lower raw material and energy
prices, particularly for acetyls and intermediates products.
EBIT decreased due to lower spreads more than offsetting higher
sales volume/mix.
Cash Flow
In second quarter 2024, cash provided by operating activities
was $367 million. The company returned $195 million to stockholders
through share repurchases and dividends. See Table 5. Priorities
for uses of available cash for 2024 include organic growth
investments, payment of the quarterly dividend, bolt-on
acquisitions, and share repurchases.
2024 Outlook
Commenting on the outlook for full-year 2024, Costa said, “We
delivered solid results in the first half of the year despite a
weak global economic environment. Through this year, we are
benefiting from the end of destocking, as our volumes have
reconnected to underlying demand. Consistent with our previous
end-market expectations, we continue to see little evidence for
end-market demand improvement in the second half of the year. In
this context, we remain focused on leveraging our innovation-driven
growth model to deliver growth above our end markets, especially in
the circular economy. We also expect to benefit from continued
pricing discipline, improved asset utilization, and disciplined
cost management. We expect the benefit of earnings generated by our
Kingsport methanolysis facility to be around a $50 million
incremental EBITDA contribution. Taking these factors together, we
expect 2024 EPS to be between $7.40 and $7.85 and for 2024 cash
from operations to be approximately $1.4 billion. I remain
confident in our ability to deliver earnings growth and strong cash
flow going forward.”
The full-year 2024 projected adjusted diluted EPS and Earnings
Before Interest, Taxes, Depreciation, and Amortization (“EBITDA”)
exclude any non-core, unusual, or nonrecurring items. Our financial
results forecasts do not include non-core items (such as
mark-to-market pension and other postretirement benefit gain or
loss, and asset impairments and restructuring charges) or any
unusual or non-recurring items because we are unable to predict
with reasonable certainty the financial impact of such items. These
items are uncertain and depend on various factors, and we are
unable to reconcile projected adjusted diluted EPS and EBITDA
excluding non-core and any unusual or non-recurring items to
reported GAAP diluted EPS or net earnings without unreasonable
efforts.
Forward-Looking Statements
This information and other statements by the company may contain
forward-looking statements within the meaning of the Private
Securities Litigation Reform Act with respect to, among other
items: projections and estimates of earnings, revenues, volumes,
pricing, margins, cost reductions, expenses, taxes, liquidity,
capital expenditures, cash flow, dividends, share repurchases or
other financial items, statements of management’s plans, strategies
and objectives for future operations, and statements regarding
future economic, industry or market conditions or performance. Such
projections and estimates are based upon certain preliminary
information, internal estimates, and management assumptions,
expectations, and plans. Forward-looking statements are subject to
a number of risks and uncertainties, and actual performance or
results could differ materially from that anticipated by any
forward-looking statements. Forward-looking statements speak only
as of the date they are made, and the company undertakes no
obligation to update or revise any forward-looking statement. Other
important assumptions and factors that could cause actual results
to differ materially from those in the forward-looking statements
are detailed in the company’s filings with the Securities and
Exchange Commission (the “SEC”), which are accessible on the SEC’s
website at www.sec.gov and the company’s website at
www.eastman.com.
Conference Call and Webcast Information
Eastman will host a conference call with industry analysts on
July 26, 2024, at 8:00 a.m. ET. To listen to the live webcast of
the conference call and view the accompanying slides and prepared
remarks, go to investors.eastman.com, Events & Presentations.
The slides and prepared remarks to be discussed during the call and
webcast will be available at investors.eastman.com at approximately
4:30 p.m. ET on July 25, 2024. To listen via telephone, the dial-in
number is +1 (833) 470-1428, passcode: 696395. A web replay, a
replay in downloadable MP3 format, and the accompanying slides and
prepared remarks will be available at investors.eastman.com, Events
& Presentations. A telephone replay will be available
continuously beginning at approximately 1:00 p.m. Eastern Time,
July 26, 2024, through 11:59 p.m. Eastern Time, Aug. 5, 2024, Toll
Free at +1 (866) 813-9403, passcode 643135.
Founded in 1920, Eastman is a global specialty materials company
that produces a broad range of products found in items people use
every day. With the purpose of enhancing the quality of life in a
material way, Eastman works with customers to deliver innovative
products and solutions while maintaining a commitment to safety and
sustainability. The company’s innovation-driven growth model takes
advantage of world-class technology platforms, deep customer
engagement, and differentiated application development to grow its
leading positions in attractive end markets such as transportation,
building and construction, and consumables. As a globally inclusive
and diverse company, Eastman employs approximately 14,000 people
around the world and serves customers in more than 100 countries.
The company had 2023 revenue of approximately $9.2 billion and is
headquartered in Kingsport, Tennessee, USA. For more information,
visit www.eastman.com.
View source
version on businesswire.com: https://www.businesswire.com/news/home/20240725916788/en/
Media: Tracy Kilgore Addington 423-224-0498 /
tracy@eastman.com
Investors: Greg Riddle 212-835-1620 / griddle@eastman.com
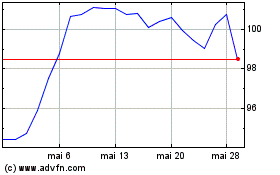
Eastman Chemical (NYSE:EMN)
Graphique Historique de l'Action
De Déc 2024 à Jan 2025

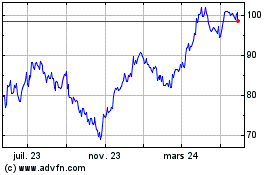
Eastman Chemical (NYSE:EMN)
Graphique Historique de l'Action
De Jan 2024 à Jan 2025
