Canadian General Investments, Limited Reports Audited 2010 Financial Results
22 Février 2011 - 10:16PM
Marketwired
Canadian General Investment, Limited's (CGI) (TSX: CGI)(TSX:
CGI.PR.B)(TSX: CGI.PR.C)(LSE: CGI) net asset value at December 31,
2010 was $501,548,000, representing a 24.8% increase from the
$402,001,000 at the end of 2009. CGI's net asset value per share
(NAV) at December 31, 2010 was $24.04, up from $19.27 at year end
2009. The NAV return, with dividends reinvested, for the year ended
December 31, 2010 was 30.3%, compared with a 17.6% total return for
the benchmark S&P/TSX Composite Index.
Strong performance was achieved across a broad range of stocks
in CGI's investment portfolio, as nine of the ten sectors of the
S&P/TSX were up in excess of 10% for 2010. CGI's outperformance
can largely be attributed to an overweighting in the Materials
sector and an underweighting in the Financials sector relative to
the Index. Materials was the second best performing sector in the
Index, returning 36.5% for the year and contributed nearly half of
the total return of the Index. Conversely, the Financials sector,
while returning an acceptable 10.5% for the year, underperformed
the overall Index, and managed to contribute to a proportionally
small fraction of the overall performance of the Index.
Additionally, the leverage afforded by the $150 million in
preference shares the Company has outstanding, served to enhance
the move up of the NAV. With a strong rebound in 2009 and 2010,
cash and short-term securities balances were returned to their
historical low levels.
In addition to the payment of four regular quarterly dividends
of $0.06 per common share, CGI paid a year-end special capital
gains distribution of $0.76 per common share on December 24, 2010.
Based on the year-end common share price of $19.18, total dividend
payments during 2010 represented a yield of 5.2%.
CGI is a closed-end equity fund, focused on medium to long-term
investments in primarily Canadian corporations. Its objective is to
provide better than average returns to investors through prudent
security selection, timely recognition of capital gains/losses and
appropriate income generating instruments.
FINANCIAL HIGHLIGHTS

(in thousands of dollars, except per share
amounts)

                                          For the Year Ended
                          --------------------------------------------------

                             December 31, 2010             December 31, 2009
                          --------------------------------------------------

Net investment loss                    (1,415)                         (640)
Net gain on investments                121,801                       124,110
                          --------------------------------------------------
Increase in net assets
 resulting from
 operations                            120,386                       123,470
Increase in net assets
 resulting from
 operations per share                     5.77                          5.92

                                                As at
                                              ----------
                             December 31, 2010             December 31, 2009
                          --------------------------------------------------

Selected data(1)
-------------------------
Net asset value                        501,548                       402,001
Net asset value per share                24.04                         19.27

Selected data according
 to GAAP(1)
-------------------------
Net assets                             500,049                       399,804
Net assets per share                     23.97                         19.17

(1) The Company calculates the net asset value and net asset value per share
on the basis of the valuation principles set out in its annual information
form. These valuation principles differ from the requirements of Canadian
generally accepted accounting principles (GAAP), with the main difference
relating to securities that are listed on a public stock exchange. While the
Company values such securities based on the latest sale price, GAAP requires
the use of the closing bid price. Accordingly, bid prices are used in
determining net assets and net assets per share for purposes of the interim
and annual financial statements.
In the United Kingdom, copies of the Company's financial reports
will be made available at the U.K. branch transfer agent,
Computershare Investor Services PLC, P.O. Box 82, The Pavilions,
Bridgwater Road, Bristol, BS99 6ZY. Phone 0870-702-0000.
Contacts: Canadian General Investments, Limited Jonathan A.
Morgan President & CEO (416) 366-2931 (416) 366-2729 (FAX)
cgifund@mmainvestments.com www.mmainvestments.com
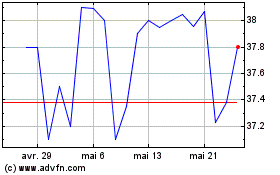
Canadian General Investm... (TSX:CGI)
Graphique Historique de l'Action
De Déc 2024 à Jan 2025

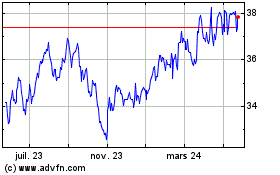
Canadian General Investm... (TSX:CGI)
Graphique Historique de l'Action
De Jan 2024 à Jan 2025
