Massive Ethereum Buying Spree – Taker Buy Volume hits $1.683B In One Hour
23 Novembre 2024 - 1:30AM
NEWSBTC
Ethereum surged over 10% yesterday, marking an impressive recovery
alongside a very bullish day for the entire crypto market. This
surge has reignited investor optimism, especially as Ethereum
approaches its yearly highs. Key data from CryptoQuant
highlights a significant bullish signal: Ethereum’s Taker Buy
Volume hit an astonishing $1.683 billion in a single hourly candle.
This metric reflects aggressive buying activity in the futures
market, further supporting Ethereum’s potential for continued
upward momentum. Related Reading: Bitcoin Open Interest Hits ATH As
BTC Nears $100K – What To Expect? The driving force behind this
rising demand for Ethereum appears to stem from profits being
cycled out of Bitcoin. With Bitcoin consistently breaking all-time
highs, investors are reallocating gains into ETH, boosting its
price. Ethereum’s ability to capitalize on Bitcoin’s momentum
underscores its position as the second-largest cryptocurrency and a
key player in the broader market trend. However, the next few days
will be crucial for Ethereum as it nears its yearly highs. A strong
breakout above these levels could propel ETH into a new uptrend,
further strengthening its bullish narrative. Ethereum Bulls Waking
Up Ethereum bulls are finally showing signs of life after
eight months of bearish price action, with the price surging over
40% since November 5. This strong upward momentum aligns with the
broader market rally, fueling optimism that Ethereum’s recovery is
just beginning. The resurgence in bullish sentiment has positioned
Ethereum as a key focus for investors seeking opportunities in the
current market environment. According to data by CryptoQuant
analyst Maartunn, Ethereum’s Taker Buy Volume recently hit $1.683
billion in a single hourly candle, highlighting significant demand
and the involvement of high-volume trades. This aggressive buying
activity is a bullish signal, suggesting increased confidence in
Ethereum’s potential to sustain its rally. Strong demand at this
scale creates upward pressure on the price, reinforcing the bullish
narrative for ETH. Related Reading: Bitcoin Rally Driven By U.S.
Coinbase Investors – Top Analyst Shares Metrics However, Ethereum
still faces a critical hurdle at the $3,550 level, a significant
supply zone that has acted as a barrier since late July. The next
few days will be pivotal for Ethereum, as breaking above this key
resistance could signal the continuation of its upward trajectory.
Failure to do so, however, might result in a short-term
consolidation. All eyes are now on ETH, as its next moves could set
the tone for the altcoin market. ETH Holding Above Key Levels
Ethereum (ETH) is trading at $3,333 after a 10% surge yesterday,
marking a significant rebound for the second-largest
cryptocurrency. The price is testing a critical supply zone just
below the $3,450 level, a resistance area that bulls need to
reclaim to confirm the uptrend and maintain momentum for new highs.
This supply zone has historically acted as a key barrier, and
breaking above it with conviction would signal strong buying
pressure and the potential for a sustained rally. Holding above the
200-day moving average (MA) at $2,959 further strengthens the
bullish case for Ethereum, as this indicator is widely regarded as
a benchmark for long-term price trends. Related Reading: Solana
Analyst Expects A Retrace Before It Breaks ATH – Targets Revealed
Should Ethereum maintain its position above the 200-day MA and push
decisively past the $3,450 level, it could pave the way for a
bullish rally, targeting higher resistance zones in the coming
days. However, failure to overcome this supply area may result in
short-term consolidation as bulls regroup to challenge the level
again. For now, the market focuses on Ethereum’s ability to clear
this crucial resistance and continue its upward trajectory.
Featured image from Dall-E, chart from TradingView
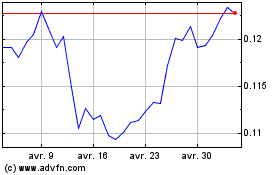
TRON (COIN:TRXUSD)
Graphique Historique de l'Action
De Oct 2024 à Nov 2024

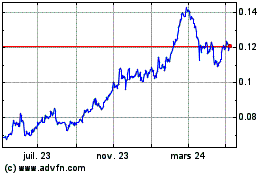
TRON (COIN:TRXUSD)
Graphique Historique de l'Action
De Nov 2023 à Nov 2024


